Embed Size (px)
Citation preview

Page 1/27
Exploring the Potential for Planning SupportSystems to Bridge the Research-translation GapBetween Public Health and Urban PlanningPaula Hooper ( [email protected] )
The University of Western Australia School of Design https://orcid.org/0000-0003-4459-2901Claire Boulange
KPMG AustraliaGustavo Arciniegas
Geo-Col GIS and collaborative planningSarah Foster
RMIT UniversityJulian Bolleter
The University of Western Australia School of DesignChris Pettit
UNSW: University of New South Wales
Research
Keywords: Planning support systems, participatory planning, scenario planning, land use planning,health, health impact, built environment, GIS
Posted Date: April 16th, 2021
DOI: https://doi.org/10.21203/rs.3.rs-405542/v1
License: This work is licensed under a Creative Commons Attribution 4.0 International License. Read Full License
Version of Record: A version of this preprint was published at International Journal of Health Geographicson August 18th, 2021. See the published version at https://doi.org/10.1186/s12942-021-00291-z.

Page 2/27
AbstractBackground: There is consensus that planning professionals need clearer guidance on the features thatare likely to produce optimal community-wide health bene�ts. However, much of this evidence resides inacademic literature and not in tools accessible to the diverse group of professionals shaping our cities.This paper explores the role of planning support systems (PSS) to facilitate the translation andapplication of health evidence into urban planning and design practices to create healthy, liveablecommunities.
Methods: A review of PSS software and studies featuring a planning support system with a builtenvironment and health impact assessment for designing and creating healthy urban areas wasundertaken. Customising existing software, a health impact PSS (the Urban Health Check) was thendeveloped and applied to a real-world planning application with an industry partner allowing for: (i)automated calculation of built environment variables; (ii) “sketch planning” functionality; and (iii) a healthimpact indicator that estimates the probability of walking for transport. A participatory evaluationframework evaluated the "utility", "usability", and "usefulness" of the Urban Health Check.
Results: Eleven PSS software applications were identi�ed, of which three were identi�ed as having thecapability to undertake health impact analyses. Three studies met the inclusion criteria of presenting aplanning support system customised to support health impact assessment with health impacts modelledor estimated due to changes to the built environment. Evaluation results indicated the Urban HealthCheck PSS helped in four key areas: visualisation of how the neighbourhood would change in responseto a proposed plan; understanding how a plan could bene�t the community; Communicate and improveunderstanding health of planning and design decisions that positively impact health outcomes;engagement – allowing community members to provide direct feedback and see the immediateimplications of amendments to a proposed plan.
Conclusions: The use of health-impact PSS have the potential to be transformative for the translationand application of health evidence into planning policy and practice, providing those responsible for thepolicy and practice of designing and creating our communities with access to quanti�able, evidence-based information about how their decisions might impact community health.
BackgroundA signi�cant public health challenge of the 21st century is the rising rate of non-communicable diseases,particularly declining rates of physical activity and mental health and increasing prevalence of obesity,diabetes and cardiovascular disease. These are signi�cant contributors to Australian and worldwidemorbidity and chronic disease burdens (1, 2). The design of the built environment is integral toencouraging positive health and well-being behaviours. The past decade has seen a proliferation ofresearch documenting the impact and associations of the built environment's many design features thatsupport or undermine residents' public health behaviours and outcomes (3-5).

Page 3/27
The public health - urban planning research-practice gapDespite the mutual historical origins of urban planning and public health (6), by the late 20th century, thetwo disciplines have largely come to function as disconnected domains of knowledge and action (6).Moreover, whilst the translation of public health research into tangible health bene�ts via modi�cationsof urban planning policy and practice is a key intended outcome of these research endeavours (7), aresearch-translation gap remains between the ambitions of public health and the planning for, anddelivery of, healthy, active communities (8). It is essential to understand why this gap remains and how itcan be overcome? One potential explanation relates to the type of health-related evidence (or science)needed by planners and planning policymakers for it to be utilised and applied (9). Several authors haveindicated that public health evidence rarely provides quanti�able, evidence-based information about thepotential health impacts of urban planning policies and decisions (10, 11) or match the interactive andparticipatory nature of planning decision making (12). Moreover, a lot of this evidence resides inacademic literature and not in tools accessible to the diverse group of professionals shaping our cities (6,13, 14).
This situation prompts us to consider how we can turn health research or science and data intomeaningful information to foster collaboration between researchers and planning professionals? (8). Assuch, there is a need to identify and test innovative digital tools that might help support the translationand application of health evidence into urban planning and design practices to create healthy, liveablecommunities.
Planning support systems - a tool to bridge the research-translation gap?Planning support systems (PSS) are spatial, data-driven, computer-based tools that integrateGeographical Information Systems (GIS) and decision support functionality to convert data intomeaningful information to support the activities of planning professionals (15, 16). They typically consistof three critical components: data, models and geo-visualisation (12) that allow for the dynamicsimulation, testing and evaluation of different urban development proposals (15, 17, 18). They containdynamic maps supported by interactive interfaces to allow sketching and editing of spatial layers withreal-time indicators (14). Moreover, PSS can be combined with custom-built models to link outcomes ofinterest to allow for the dynamic evaluation of the potential impacts of design proposals on health andwell-being outcomes (15, 16).
This situation raises the question, could PSS be used to integrate empirical health evidence to enhanceplanning professions understanding of how different approaches to neighbourhood design might impactcommunity health and well-being and assist them in making informed and evidence-based planningdecisions and practices? Could they contribute to bridging the policy-relevant research – evidence-basedpolicy and practice gap? While technological advances have seen a rise in PSS development supporting
Page 4/27
planning processes and practices (19), there remains a lack of digitally enabled collaborative tools tofacilitate health-oriented urban planning. PSS have not been widely studied in the context of integratinghealth evidence or promoting health impact assessments, bringing 'health' front and foremost in thedesign and planning processes. We hypothesise that PSS represent a potential toolkit for the translationand application of health evidence into urban design and planning practice by estimating impacts andcommunicating outcomes related to urban planning, as well as explicitly linking empirical healthevidence to allow for the modelling and estimation of potential population health impacts of designproposals (20).
There have been several reviews focussed on the development and progress of PSS (15, 16, 18, 21-24)and the sectors or �elds of application (e.g., land use planning, water management, climate changeadaptation) that PSS have been developed for and used in within the domain of spatial planning (25).This paper addresses a gap in the PSS literature concerning the role of PSS to facilitate the translation ofhealth evidence, focusing on the application of PSS within the context of a health impact application. Italso presents a case study of a pilot health-impact PSS, informed by the literature review �ndings, to areal-world planning situation and evaluates the system's usefulness and bene�ts (23). The objectives ofthis paper are to:
1. Conduct an inventory of existing PSS software that would allow for the integration of an evidence-based health impact assessment component;
2. Conduct a literature review to identify studies featuring a PSS with a built environment and healthimpact assessment for designing and creating healthy urban areas, neighbourhoods andcommunities;
3. Pilot test and evaluate the empirically-based health impact planning support system (the "UrbanHealth Check") to a real-world urban in�ll development scenario to illustrate how a PSS can includehealth considerations and model potential health impacts.
We present the health impact PSS review methods and results, followed by a case study approach tooutlining the development, application, and evaluation of the Urban Health Check.
Methods
Search strategyWe selected all PSS studies in which software was used as the main component of the PSS. Other moregeneric software tools were identi�ed utilising web-based scienti�c search engines, previous reviews (15,16, 18, 21-24), electronic libraries and databases, and personal networking and knowledge. Citations ofstudies featuring PSS tools were retrieved through a series of searches in the PubMed, Web of Science,Scopus, Elsevier Science Direct, and Ingenta Connect databases. Searches were conducted usingcombinations of keywords within the title and abstract based on GIS implementations under the GIS andSociety research area's umbrella. These were as follows: Health OR Health impact OR Health impact

Page 5/27
assessment OR health assessment OR health outcomes OR Collaborative health planning OR Healthycities OR Liveable cities AND Planning support systems OR Spatial planning support OR Spatial decisionsupport OR scenario planning tools OR scenario planning software OR spatial planning decisions ORgeomodelling tools OR geodesign OR Participatory GIS OR Public participation GIS OR Group spatialdecision support systems OR Collaborative GIS OR dynamic GIS OR geocollaboration OR CommunityVizOR MapTable OR interactive table OR touch table. Database searches were supplemented with citationsretrieved manually from relevant papers and reviews. We also identi�ed and obtained four previousreview papers on PSS use from the planning, geospatial and computer science �elds (15, 16, 18, 19, 22).
Inclusion and exclusion criteriaThe peer-reviewed papers' inclusion criteria were: (1) original journal articles of published, peer-reviewed,empirical studies; (2) in the English language and (3) published since 1995. The papers' focus needed tohave a PSS with an interactive and analytical component focussed on the built environment, plus ahealth outcome/s being modelled or estimated. Surveillance or map visualisation systems that provideda portal for the presentation and overlay of spatial data layers were not the focus of this paper (i.e.,census population/health data overlaid with the built environment's spatial datasets). Likewise, thebroader domain of planning support systems that provide a further departure from the built environmentwas not included in this review.
For the current examination, a relatively broad de�nition of the "built environment" was used to identifyand understand the range of modi�able factors in the external local environment (i.e. the neighbourhood,urban area or city) that may impact people's health behaviours (i.e., physical activity) or outcomes andhad been modelled as part of a PSS. Likewise, a broad approach was taken to de�ning "health outcomes"for this review – encompassing all types and dimensions of self-reported or objectively assessedphysical activity or any health behaviour or outcome plausibly hypothesised (and supported by existingliterature) to be impacted by built environments. These include, for example, walking (recreational /transport walking), moderate-to-vigorous physical activity, obesity, public transport use.
Study selection and data extractionThe titles and abstracts of all retrieved citations were screened by three reviewers (author one, two andthree of the present article) and examined for their eligibility and mention of words meeting the searchcriteria (i.e., health, PSS). Duplicates were manually removed, and the full-text articles of includedabstracts were retrieved and further screened by the same three reviewers to determine �nal eligibility.Discrepancies between reviewers surrounding a particular study's eligibility were resolved by furtherevaluation and consensus amongst all authors. Information was extracted from each paper on the PSStools and identi�ed software relating to the following thirteen criteria (Table 1) and collated into a resultsmatrix/table for analysis.
Page 6/27
Table 1 Data extraction criteria
1 Tool's name and the city and country in which it was developed and applied.
2 Software/hardware characteristics - proprietary/ license based or open-source; cost; online /cloud-based and/or o�ine, desktop, smartphone app, interactive table; others; distributed orface-to-face.
3 Functions and use - communication; spatial data visualisation; pre-built analysis modules;sketch planning and editing of spatial data layers; 3D visualisation; health impactanalysis/modelling; individual or group decision making.
4 The user interface/information mediums - maps, graphs, charts, reports
5 The scale of the project / scenario being applied to: Precinct / neighbourhood / city / metro /region / country.
6 The target application / planning-related task or stage of a project cycle or decision process thePSS intended to support (site and context analysis, concept design, community consultation,design review, design documentation).
7 The intended users - who are the PSS intended for / target audience -planners/policymakers/community / elected members, others.
8 The built environment / urban design exposure features have been used - e.g., density, land usemix, street connectivity, public open space, others.
9 The health-supportive behaviour or outcomes impacts that have been used/estimated for thehealth impact scenario mode - e.g., walking, physical activity, mental health.
10 The source of health data/evidence used.
11 The scale at which the of health outcome data is collected/modelled - individual or geographicunit/s.
12 The predictive/statistical modelling technique was used to estimate the health impacts.
13 The population demographics the health impact is estimated for - children, young adults, adults,and older adults.
Results
Review of PSS softwareEleven PSS software applications were identi�ed (Table 2). Of these, three were identi�ed as having thecapability to undertake health impact analyses: (1) CommunityViz (http://communityviz.com/); (2) UrbanFootprint (http://urbanfootprint.com/); and (3) Envision Tomorrow (http://envisiontomorrow.org/).Developed as an ArcGIS® extension, CommunityViz allows for customisable programming of outcomes

Page 7/27
of interest (i.e., health behaviours). The CommunityViz Scenario 360 software transforms a GIS into adynamic system that allows co-sketching and rapid editing of the spatial layers. The attributes of thegeographic features are driven by formulas that update automatically as the user makes changes. Eachtime a spatial feature on the map is changed (i.e., added, deleted, moved, its attributes changed) by theuser, the system is updated, the formulas automatically re-run, and the outcome indicators dynamicallychanged. Two commercial web-based software products – Urban Footprint and Envision Tomorrow -both have a public health analysis module that measures the impact of land use patterns and urban formon a range of health-related indicators, including physical activity-related weight and disease incidences,pedestrian safety measures, and respiratory effects. While Envision tomorrow keeps most of thecalculation elements in a scenario spreadsheet linked to ArcGIS via an extension, Urban Footprintcontains analysis modules for scenario planning.
Table 2 Inventory of planning support system software
PSS Software
CommunityViz https://communityviz.city-explained.com/ (26)
EnvisionTomorrow
http://envisiontomorrow.org/
Online WhatIf?
https://aurin.org.au/resources/decision-support/what-if/ (27, 28)
UrbanFootprint https://urbanfootprint.com/
ESRIGeoPlanner
https://www.esri.com/en-us/arcgis/products/arcgis-geoplanner/overview
ESRI CityEngine
https://www.esri.com/en-us/arcgis/products/arcgis-cityengine/overview
TNO UrbanStrategy
https://www.tno.nl/en/focus-areas/tra�c-transport/roadmaps/smart-and-safe-tra�c-and-transport/societal-impact-for-accessibility-and-liveability/big-data-ecosystems-collaborating-on-data-controlled-cities/urban-strategy-brings-planning-effects-into-clear-focus/
UrbanSim /UrbanCanvas
https://urbansim.com/
https://urbansim.com/urbancanvas
Healthy UrbanRoute Planner
https://www.ams-institute.org/urban-challenges/resilient-cities/healthy-urban-route-planner/
TygronGeodesignPlatform
https://www.tygron.com/nl/
INDEX PlanBuilder SPARC
http://www.crit.com/sparc/

Page 8/27
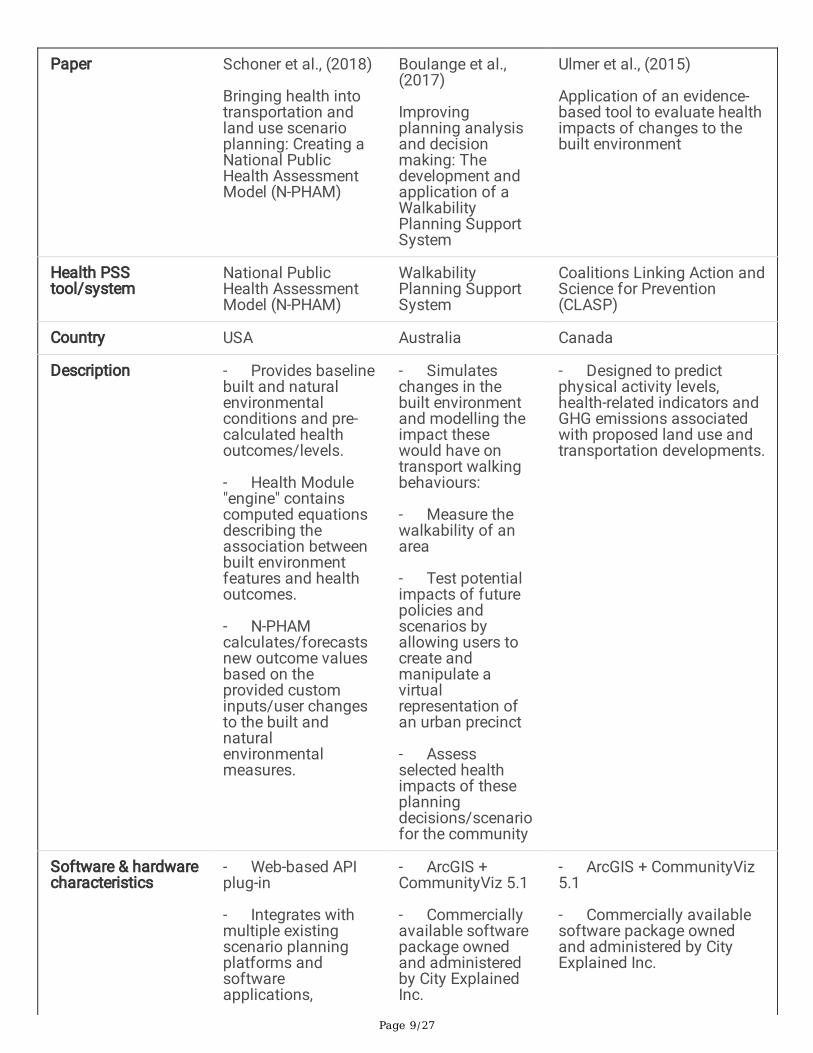
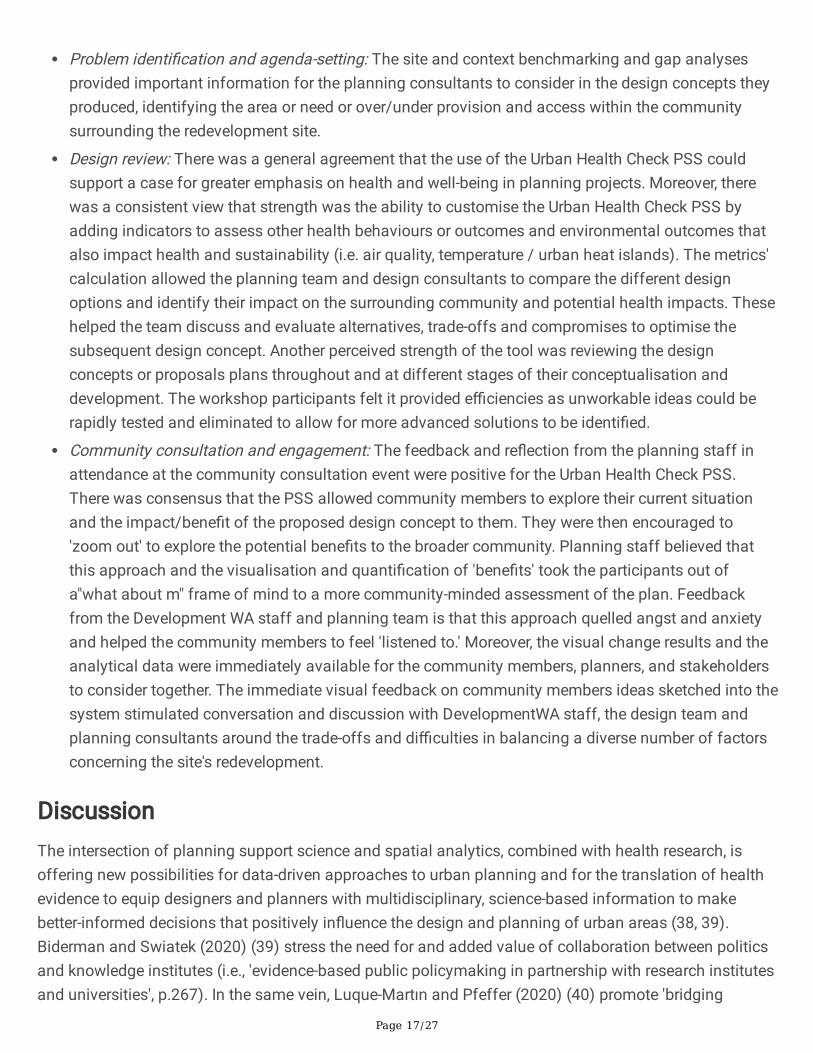
Review of Health impact PSSA total of 243 potential articles were retrieved from the search. Initial screening on the title and abstractidenti�ed 39 articles that met the eligibility and inclusion criteria and for which the full-text articles wereretrieved for review. Of these, only three papers that met the inclusion criteria of presenting a PSScustomised to support health impact assessment with health impacts modelled or estimated due tochanges to the built environment were therefore included and described below. The full results againstthe thirteen extraction criteria for these studies are outlined in Table 3.
Table 3 Health Impact Planning Support Systems
Page 9/27
Paper Schoner et al., (2018)
Bringing health intotransportation andland use scenarioplanning: Creating aNational PublicHealth AssessmentModel (N-PHAM)
Boulange et al.,(2017)
Improvingplanning analysisand decisionmaking: Thedevelopment andapplication of aWalkabilityPlanning SupportSystem
Ulmer et al., (2015)
Application of an evidence-based tool to evaluate healthimpacts of changes to thebuilt environment
Health PSStool/system
National PublicHealth AssessmentModel (N-PHAM)
WalkabilityPlanning SupportSystem
Coalitions Linking Action andScience for Prevention(CLASP)
Country USA Australia Canada
Description - Provides baselinebuilt and naturalenvironmentalconditions and pre-calculated healthoutcomes/levels.
- Health Module"engine" containscomputed equationsdescribing theassociation betweenbuilt environmentfeatures and healthoutcomes.
- N-PHAMcalculates/forecastsnew outcome valuesbased on theprovided custominputs/user changesto the built andnaturalenvironmentalmeasures.
- Simulateschanges in thebuilt environmentand modelling theimpact thesewould have ontransport walkingbehaviours:
- Measure thewalkability of anarea
- Test potentialimpacts of futurepolicies andscenarios byallowing users tocreate andmanipulate avirtualrepresentation ofan urban precinct
- Assessselected healthimpacts of theseplanningdecisions/scenariofor the community
- Designed to predictphysical activity levels,health-related indicators andGHG emissions associatedwith proposed land use andtransportation developments.
Software & hardwarecharacteristics
- Web-based APIplug-in
- Integrates withmultiple existingscenario planningplatforms andsoftwareapplications,
- ArcGIS +CommunityViz 5.1
- Commerciallyavailable softwarepackage ownedand administeredby City ExplainedInc.
- ArcGIS + CommunityViz5.1
- Commercially availablesoftware package ownedand administered by CityExplained Inc.

Page 10/27
allowing users ofavailable scenarioplanning tools(CommunityViz,Envision Tomorrow,UrbanFootprint) tochoose an area ofinterest representedby Census blockgroups which returnbaseline input andoutcome values foreach block group, aswell as aggregatedvalues for the studyarea.
- These data arethen available to thetool user to map andanalyse data in waysspeci�c to therespective tool.
- It iscustomisable andis an extension ofESRI's ArcGIS
- Displayed on atouch-enabled 46-inch MapTablethat can supportup to 10 peoplearound its screen.
- It is customisable and isan extension of ESRI'sArcGIS
Functions & userinterface
- Spatial datavisualisation
- Dynamicinterface for sketch-planning + editing ofspatial layers
- Maps, charts
- Health impactanalysis & modelling
- Spatial datavisualisation
- Dynamicinterface forsketch-planning +editing of spatiallayers
- Maps, charts
- Real-timeHealth impactanalysis &modelling
- Spatial datavisualisation
- Dynamic interface forsketch-planning + editing ofspatial layers
- Maps, charts
- Real-time Health impactanalysis & modelling
Scale of theproject/scenario?
- Various - Precinct
- Precinct
- Suburb
- Postal codes
Builtenvironmental/urbandesign layers
- Gross populationdensity
- Grossemployment density
- Jobs within a 45-minute transitcommute, distancedecay, walk networkand GTFS scheduletravel time
- Land use mix(commercial,education,industrial,parkland,residential)
- Dwellingdensity
- Housingdiversity score
- Length of roads; bicycleand sidewalk facilities;
- Distance to nearestmajor arterial, school andtransit stop/station;
- Accessibility to majorregional destinations; severaldensity vectors, includingnet-residential, intersection,schools, transit stop and typeof each food location (sit

Page 11/27
- Employmententropy index using a5-tier employmentclassi�cationscheme
- Retail jobs withina 5-tier employmentclassi�cationscheme
- % of CBGemployment within1/4 mile of a �xedguideway transit stop
- Network density -facility miles ofpedestrian-orientatedlinks per square mile
- Streetintersection density,weighted auto-orientatedintersectionseliminated
- % of land coverdeveloped as openspace
- % of land areacovered by treecanopy
- % land cover =forest
- % land cover =natural
- % of land cover =developed openspace or naturalspace
- Local livingdestination score -convenience(convenience store,newsagent orpetrol station);supermarket;speciality fooddestination (fruitand vegetable,meat, �sh orpoultry store); posto�ce; bank;pharmacy; generalpractice / medicalcentre; dentist;community centre;childcare facility;library;
- Closest trainstation (</> 800m);
- Closest busstop (</> 400m)
- Street network- intersectiondensity
down and fast food, groceryand convenience stores);
- Land use - an entropy-based measure of the mix,retail �oor-to-land area andpark area.
Health behaviour oroutcomes or impactshave beenused/estimated ascoe�cients for thehealth impactscenario model
- Transportationwalking (binaryparticipation +continuous duration)
- Leisure walking(binary participation+ continuousduration)
- Transportationbiking (binary
- Transportationwalking
- Walking and biking forexercise;
- Walking and biking towork/school
- Body mass index
- Daily energy expenditure
- Blood pressure;
- Walk/bike trips/day,

Page 12/27
participation +continuous duration)
- Auto travel /sedentary time(binary participation+ continuousduration)
- Recreationalphysical activity(binary participation+ continuousduration)
- Body mass index(continuous)
- Overweight(binary)
- Obese (binary)
- Kessler-6 mentalhealth - moderate(binary)
- Fair or poorgeneral health(binary)
- Transit trips/day, Automobile trips/day,
- Kilometres of travel/day
- Estimated vehicularemissions of CO2/day.
Scale at which thehealth outcome dataiscollected/modelled
- Census block - Meshblock (thesmallestgeographic regionon the AustralianStatisticalGeographyStandard)
- Postal code
Whatpredictive/statisticalmodelling techniquewas used toestimate the healthimpacts?
Likelihood ofparticipating in theactivity = binaryhealth outcomes =binary logisticregression
- Multi-level,multivariatelogistic regression
- To estimatethe probability thatan individualparticipates intransport-walking,the formula takesin the values foreach builtenvironmentalvariable multipliedby thecorrespondingregressioncoe�cients andsummed with theconstants
- Multivariate regressionmodels were used to predictthe value of each healthoutcome/behaviour basedon each participant's builtenvironment anddemographic/socioeconomiccharacteristics.
- Four different types ofregression model were used,depending on the type anddistribution of the outcomevariable: linear, log-linear,binary logistic and two-stage(zero-in�ated). In each case,a base model was �rst builtto include any statisticallysigni�cant (p<0.05)demographic/socioeconomicvariables.

Page 13/27
Populationdemographic/s
- Adults 18-64
- Older adults 65+
- Adults >18years
- Adults >18 years
Target application /planning-related taskor stage
- Baseline analysis
- Scenario testing
- Baselineanalysis
- Scenariotesting
- Baseline analysis
- Scenario testing
Intended Users - Planners
- Community
- Policy makers
- Planners
- Community
- Policy makers
- Planners
- Academics
- Policymakers
Does it supportindividual or groupdecision making?
- Individual
- Group
- Individual
- Group
- Individual
- Group
In the United States, Schoner et al. (29) developed the "National Public Health Assessment Model" (N-PHAM) that included a Health Module "engine", which contains a set of equations describing theassociation between built environment features and health outcomes, and a database of nationallyavailable baseline input data and pre-calculated baseline health outcomes. Users can create custominputs based on a future scenario of the built, natural and social environments. These environmentalchanges are used to calculate new values for the predicted health outcomes.
In Australia, Boulange et al. (2018) (30, 31) designed the Walkability Planning Support System usinga commercial software platform/extension to Esri's ArcGIS: CommunityViz Scenario 360, anextension to Esri ArcGIS, and linked with a MapTable. The tool features include (i) automatedcalculation of built environment variables; (ii) "sketch planning" functionality; and (iii) suite ofindicators including a walkability indicator that estimates the probability that an adult would walk fortransport. This tool was implemented to determine walkability indexes for three suburbs in Victoria,Australia.
In Canada, Ulmer et al. (20) designed an empirically based health and greenhouse gas (GHG) impactassessment tool linking detailed walkability and regional accessibility measures with travel, physicalactivity, health indicators, and GHG emissions. Built environment measures were correlated withhealth and demographic characteristics from the Canadian Community Health Survey and travelbehaviour from the Transportation Tomorrow Survey. Results were incorporated into an existingsoftware tool and used to predict health-related indicators and GHG emissions for the Toronto WestDon Lands Redevelopment.
Several other tools were identi�ed that model or provide indicators of built environments conducive topositive health outcomes based on health research. For example, the Walkability Index Tool as part of theAustralian Urban Research Infrastructure Network (AURIN) (7) measures the walkability of user‐speci�ed

Page 14/27
areas (i.e. suburb, Australian Bureau of Statistics (ABS) Statistical Areas and user‐speci�ed road networkbuffers) for any Australian urban area (https://aurin.org.au/resources/workbench-user-guides/portal-user-guides/analysing-your-data/walkability-tools/). Similarly, the PedCatch tool (http://pedcatch.com/)is an open-source simple agent-based walkable catchment tool that researchers can use, urban designers,planners, and policymakers to test proposals for improving walkable neighbourhood catchments (32).However, while both are founded on empirical health research, they do not model potential health impactsdue to changes to pedestrian catchments' walkability and thus were excluded from this review.
Case Study: Development and testing of an evidence-basedhealth impact planning support systemThis case study was conducted in collaboration with the Western Australian Government's landdevelopment agency, DevelopmentWA, who are responsible for identifying, designing and implementingsigni�cant land and community infrastructure projects in response to state Government planningdirectives. DevelopmentWA were preparing a redevelopment strategy for a former high school site(11.9ha) in the suburb of Hamilton Hill, approximately 17km southwest of the Perth Central BusinessDistrict. They were keen to embed the consideration of health outcomes in their decision-making into theplanning and design of the site using locally relevant research evidence.
These conditions motivated the development of a health impact-based planning support system (PSS)capable of simulating changes in the built environment and measuring the impact these changes wouldhave on the community's surrounding neighbourhood and potential health behaviours. Working withDevelopmentWA, we identi�ed the intended goals of the PSS related to three planning tasks: (1) Problemidenti�cation and setting of planning principles and goals - assisting with site and context benchmarkingand gap analyses and capturing of community values and concerns; (2) Design review – testing andinforming the development of alternative design concepts and evaluating alternatives, trade-offs andcompromises; (3) Community consultation and engagement – helping to inform and educate thecommunity and allow participants to seek feedback on design concepts. Based on learning from theliterature and software review, we created an experimental health-impact PSS (named the "Urban HealthCheck") to (1) Create spatial performance and health impact indicators of potential in�ll design concepts;and (2) Create an interactive data visualisation tool to test potential impacts of design proposals byallowing users to create and manipulate a virtual plan of the development site and assess their impactsagainst the spatial and health indicators.
Development of the Urban Health Check PSSThe Urban Health Check was developed using CommunityViz Scenario 360 software (26). The area offocus for this PSS was the high school redevelopment site, plus the surrounding community within an

Page 15/27
800m buffer. Seven spatial indicators were developed to assess the built environmental performance ofdifferent concept plans developed for the site: (1) Housing diversity (lot sizes); (2) amount (number andarea) of parks; (3) access to public transport; (4) access to parks; (5) access to playgrounds; (6) access tosports parks; and (7) access to destinations. The indicators were chosen as they addressed issuespreviously raised by the community and were features known to be associated with health behaviours (2,9). Dynamic charts were created to represent the values of these spatial indicators.
The spatial indicators were linked to formulas to indicate potential health impacts. Earlier work from theRESIDential Environments (RESIDE) project had estimated the relationships between the builtenvironment's multiple features and a range of health-supportive behaviours and well-being outcomes forparticipants living across Perth, Western Australia (33). A formula was programmed into theCommunityViz to estimate the probability that an individual undertakes (any) transport walking that tookin the values for each spatial indicator multiplied by the identi�ed coe�cients. A baseline probability ofwalking was computed for the current condition at the case study site, and dynamic charts wereprogrammed to represent the estimated values that automatically updated when alternative designoptions were sketched and changes were made to the spatial layers.
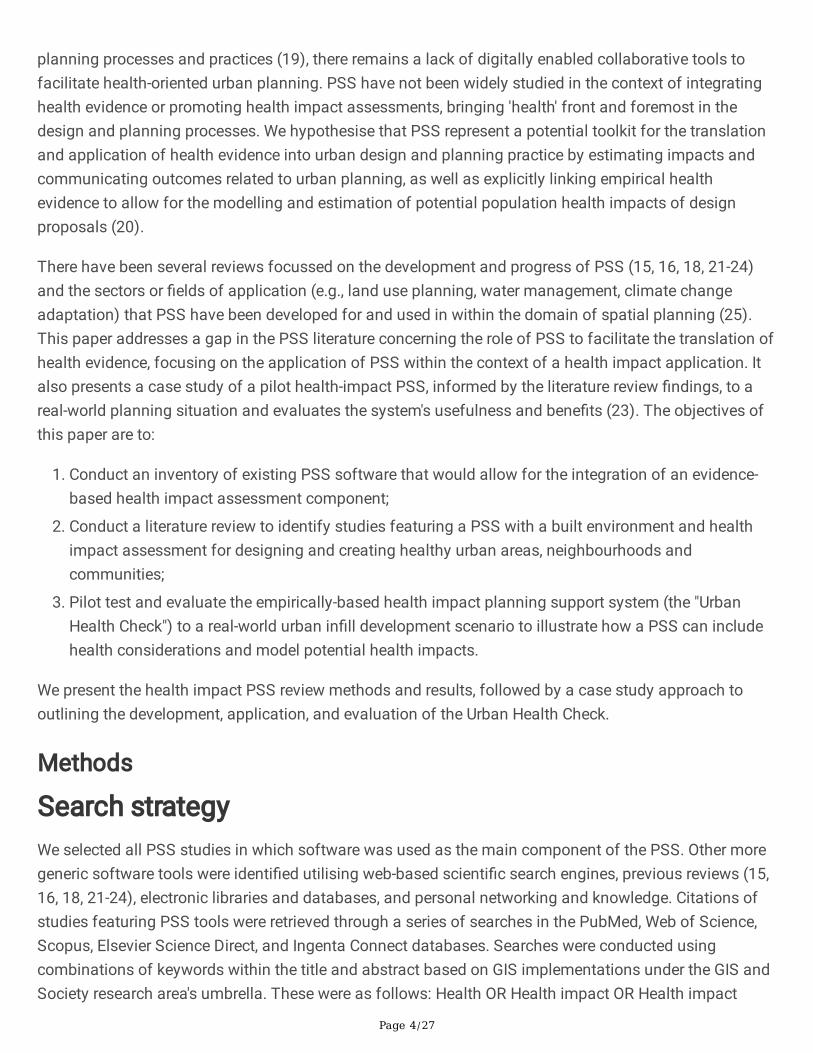
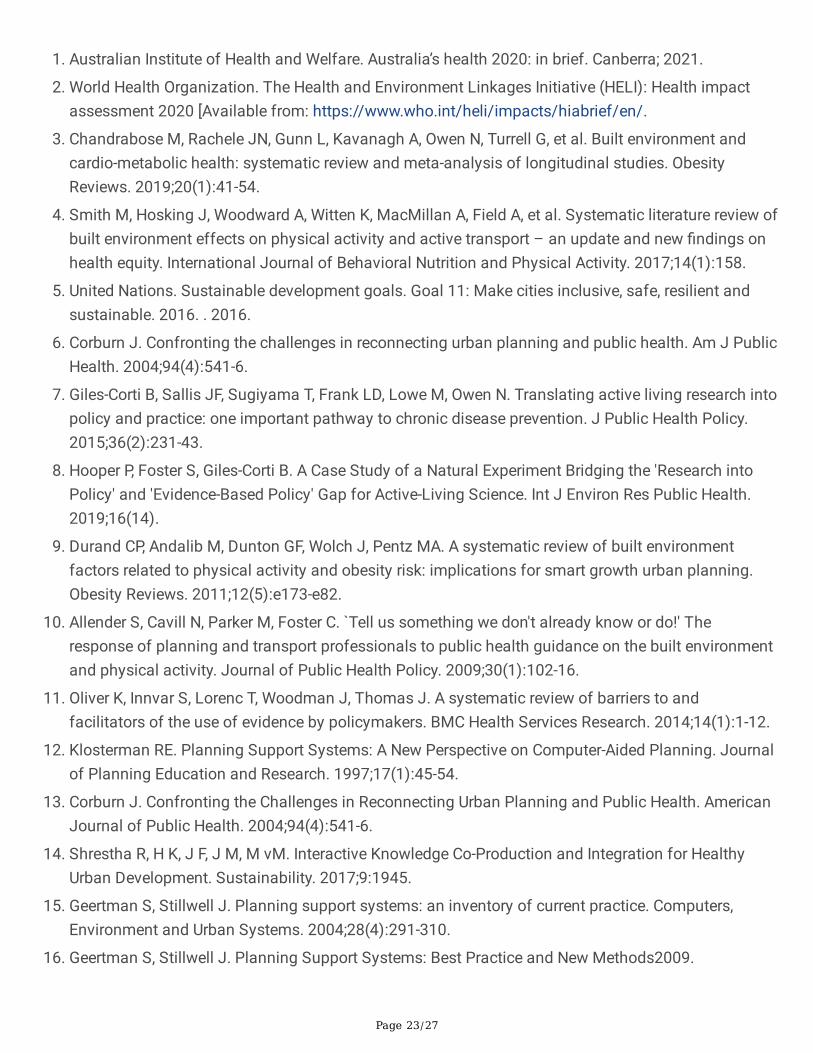
Applying the Urban Health Check PSS - design review andcommunity consultationThree concept plans developed by a planning consultant were modelled in the PSS. The spatial indicatorsquanti�ed the changes in built form and access from each residential lot (I.e., the surroundingcommunity) that might result from the different design concepts. The metrics derived for each conceptwere provided to the planning consultant to re�ne successive plans. The Urban Health Check PSS wasalso used as an activity during a three-hour traditional (drop-in) townhall-style community engagementand consultation event for the redevelopment project. The PSS was presented on a large (46 inches)touch-enabled MapTable (34) that was large enough to accommodate a group of 10 people and providesan interactive environment to support community engagement and planning participation around thePSS. Figure 1 illustrates the user interface of the CommunityViz displayed on the MapTable. On the leftside, the table of contents lists the spatial layers which can be manipulated using the 'sketch tools (e.g.,users can add new points, resize polygons or change attributes in features). As soon as the spatial layerswere edited, the dynamic indicator charts displaying the spatial indicators' values and estimated walkingoutcomes were automatically updated.
The PSS was driven by a facilitator (one of the research team) who led the participants through thefollowing process: Firstly, community participants viewed the study area's baseline spatial layers andmetrics. Participants were then invited to sketch into the system the proposed concept plan for the site,and instant feedback was given against each of the spatial (n=7) and health (i.e., walking) indicators.Participants were then encouraged to sketch in alternative design ideas (i.e., edit, delete or add features)and got instant feedback against the same indicators. The facilitator helped users navigate the interface,

Page 16/27
explained the spatial and health indicators, and helped interpret the results. Whilst participants werewelcomed and invited to sketch and edit/take control of the system, most preferred to direct the facilitatorto re�ect their ideas on the map – they would raise an issue or put a question or idea to the facilitator,who would sketch and enter it in into the PSS. After the calculation was �nished, the facilitator wouldhelp communicate the participants' outcome and results.
Evaluation of the Urban Health Check PSSA participatory evaluation framework and methodology was designed to understand the Urban HealthCheck PSS users' experiences and their bene�ts to the planning agency. Based on the work of Pelzer (23)and Nielson (35), we evaluated the "utility", "usability", and "usefulness" of the Urban Health Check PSS.The concept of "utility" was concerned with whether the PSS technology supported the planning tasksand activities of the professionals addressing whether it improved the understanding of the planningissue and was it able to facilitate communication among different involved stakeholders (35, 36). The'usefulness" referred to the perceived advantage of using the Urban Health Check PSS over currentpractices, focussing on its ability to provide better or additional insight into the nature of the planningtask and whether it improved the sharing of information and knowledge and perspectives amongstakeholders, via a community survey and focus group workshops.
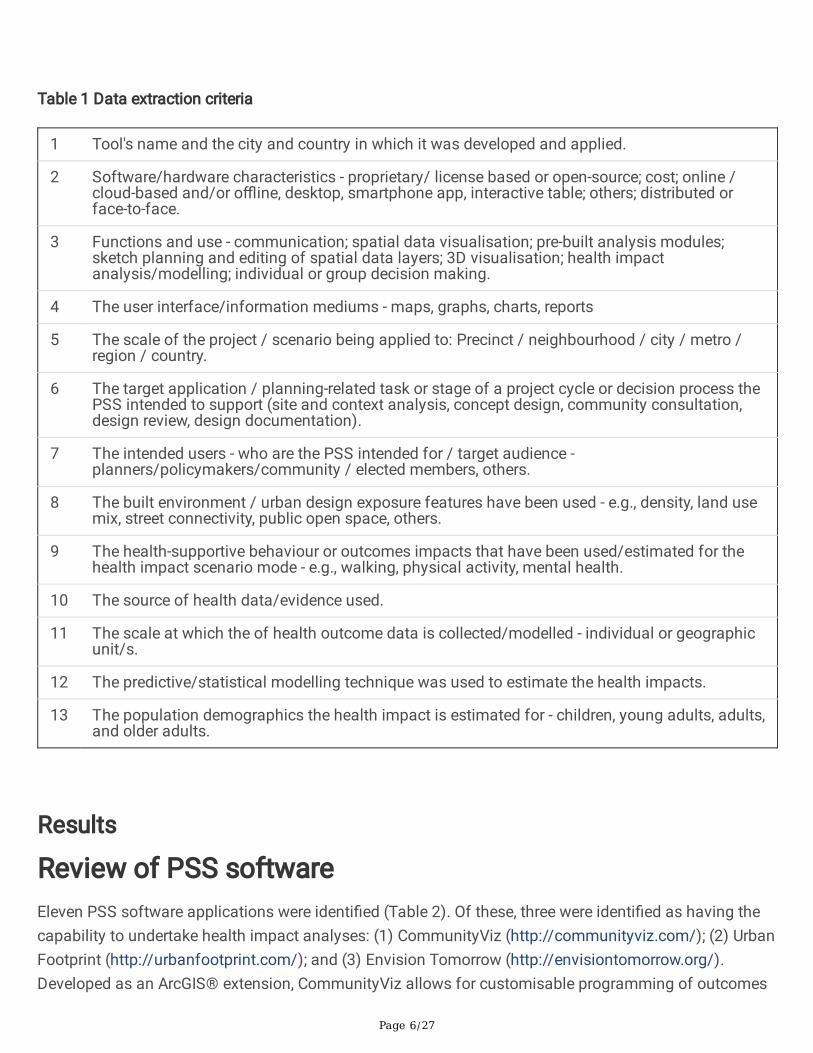
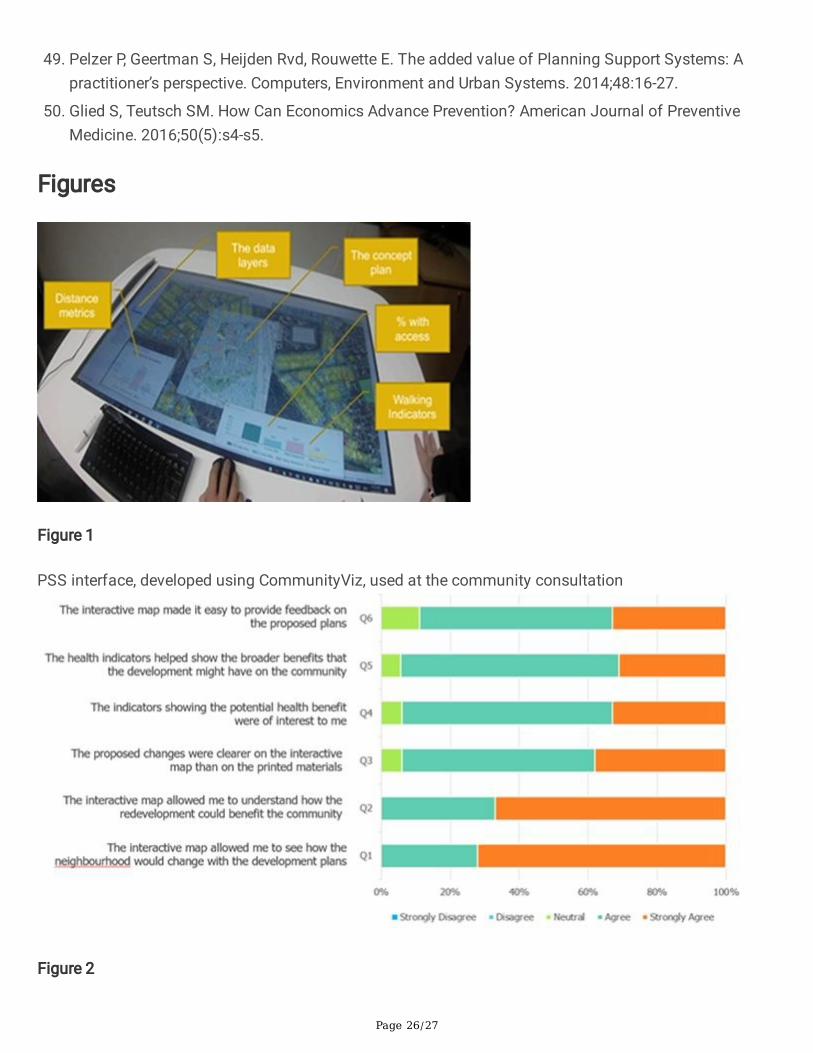
Community survey: A short survey was administered to all community members who engaged with theUrban Health Check whilst attending the community consultation event. We measured the perceivedusability and usefulness of the PSS with six statements (based on (23, 36, 37) using a �ve-point Likertscale with higher scores indicating greater agreement with the statement. These statements related totransparency, user-friendliness and interactivity, level of detail and data quality, reliability, andcommunicative value (Figure 4). Surveys were completed by 18 of the 28 participants (64%) whoengaged with the PSS. Responses indicated that the PSS helped raise awareness and understanding ofthe potential bene�ts of the proposed redevelopment. Community feedback against the evaluationcriteria found the tool was more user friendly, interactive, �exible, and provided better quality data and alevel of detail and visualisation unrivalled by previous engagement methods (Figure 2).
Focus group workshops - planning professionals: A focus group was held with six staff from the projectteam, including representatives from the DevelopmentWA project (n=2) and community consultation(n=2) teams and the planning consultant (n=1), to re�ect on how the PSS assisted (or hindered) them inthe design and consultation processes. Six 45-minute interactive demonstration workshops were thenheld with six Development WA staff at each (n=36 participants) to solicit feedback on the usability andbene�ts and potential future applications of the Urban Health Check to the organisation and its workingpractices and design solutions. Three aspects were considered in this focus group evaluation: problemidenti�cation, design review and community consultation:
Page 17/27
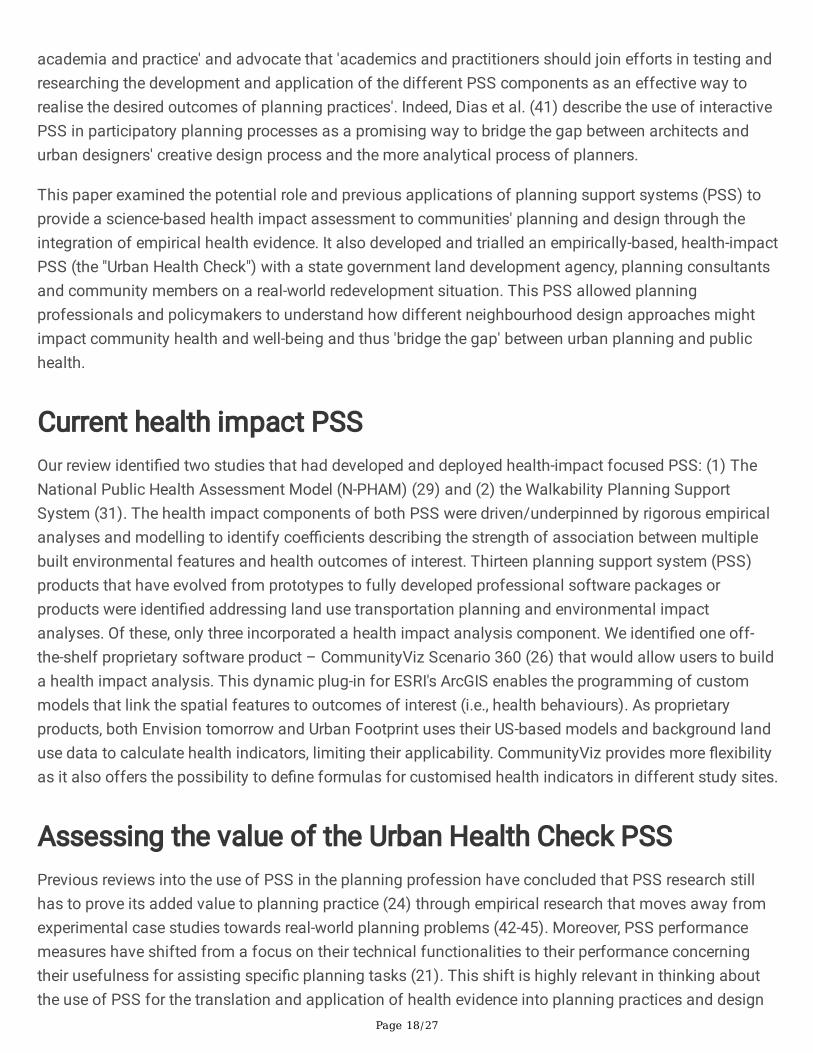
Problem identi�cation and agenda-setting: The site and context benchmarking and gap analysesprovided important information for the planning consultants to consider in the design concepts theyproduced, identifying the area or need or over/under provision and access within the communitysurrounding the redevelopment site.
Design review: There was a general agreement that the use of the Urban Health Check PSS couldsupport a case for greater emphasis on health and well-being in planning projects. Moreover, therewas a consistent view that strength was the ability to customise the Urban Health Check PSS byadding indicators to assess other health behaviours or outcomes and environmental outcomes thatalso impact health and sustainability (i.e. air quality, temperature / urban heat islands). The metrics'calculation allowed the planning team and design consultants to compare the different designoptions and identify their impact on the surrounding community and potential health impacts. Thesehelped the team discuss and evaluate alternatives, trade-offs and compromises to optimise thesubsequent design concept. Another perceived strength of the tool was reviewing the designconcepts or proposals plans throughout and at different stages of their conceptualisation anddevelopment. The workshop participants felt it provided e�ciencies as unworkable ideas could berapidly tested and eliminated to allow for more advanced solutions to be identi�ed.
Community consultation and engagement: The feedback and re�ection from the planning staff inattendance at the community consultation event were positive for the Urban Health Check PSS.There was consensus that the PSS allowed community members to explore their current situationand the impact/bene�t of the proposed design concept to them. They were then encouraged to'zoom out' to explore the potential bene�ts to the broader community. Planning staff believed thatthis approach and the visualisation and quanti�cation of 'bene�ts' took the participants out ofa"what about m" frame of mind to a more community-minded assessment of the plan. Feedbackfrom the Development WA staff and planning team is that this approach quelled angst and anxietyand helped the community members to feel 'listened to.' Moreover, the visual change results and theanalytical data were immediately available for the community members, planners, and stakeholdersto consider together. The immediate visual feedback on community members ideas sketched into thesystem stimulated conversation and discussion with DevelopmentWA staff, the design team andplanning consultants around the trade-offs and di�culties in balancing a diverse number of factorsconcerning the site's redevelopment.
DiscussionThe intersection of planning support science and spatial analytics, combined with health research, isoffering new possibilities for data-driven approaches to urban planning and for the translation of healthevidence to equip designers and planners with multidisciplinary, science-based information to makebetter-informed decisions that positively in�uence the design and planning of urban areas (38, 39).Biderman and Swiatek (2020) (39) stress the need for and added value of collaboration between politicsand knowledge institutes (i.e., 'evidence-based public policymaking in partnership with research institutesand universities', p.267). In the same vein, Luque-Martın and Pfeffer (2020) (40) promote 'bridging
Page 18/27
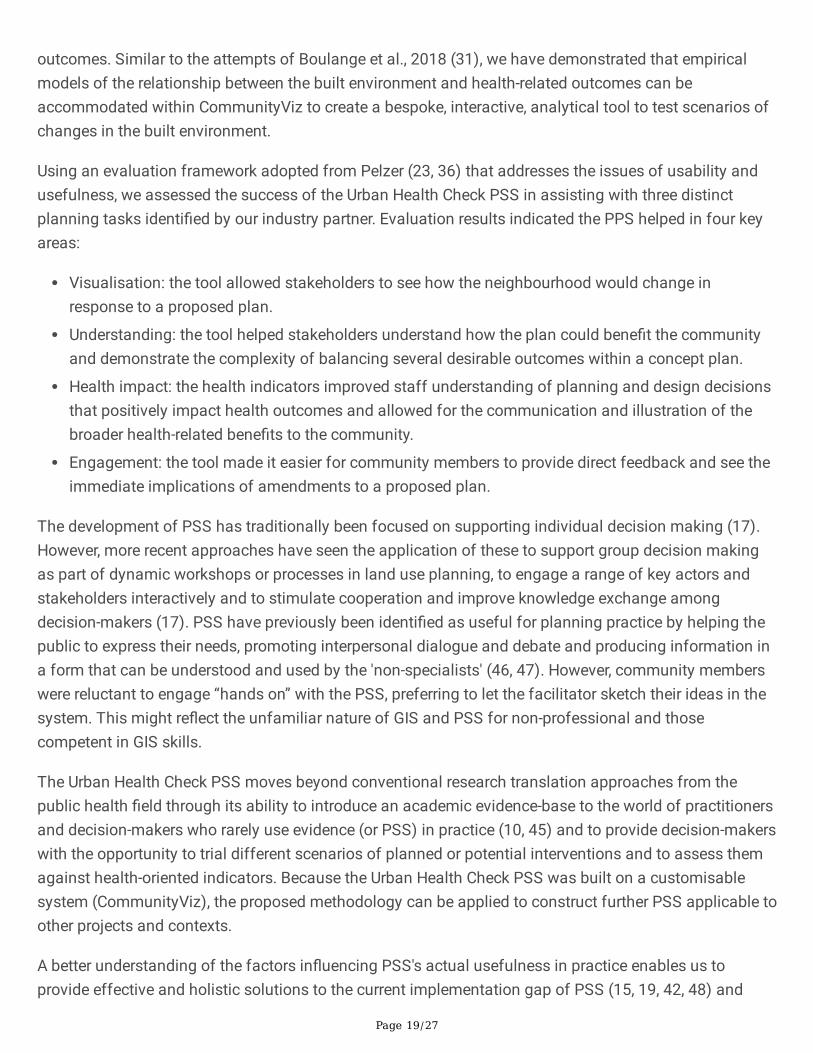
academia and practice' and advocate that 'academics and practitioners should join efforts in testing andresearching the development and application of the different PSS components as an effective way torealise the desired outcomes of planning practices'. Indeed, Dias et al. (41) describe the use of interactivePSS in participatory planning processes as a promising way to bridge the gap between architects andurban designers' creative design process and the more analytical process of planners.
This paper examined the potential role and previous applications of planning support systems (PSS) toprovide a science-based health impact assessment to communities' planning and design through theintegration of empirical health evidence. It also developed and trialled an empirically-based, health-impactPSS (the "Urban Health Check") with a state government land development agency, planning consultantsand community members on a real-world redevelopment situation. This PSS allowed planningprofessionals and policymakers to understand how different neighbourhood design approaches mightimpact community health and well-being and thus 'bridge the gap' between urban planning and publichealth.
Current health impact PSSOur review identi�ed two studies that had developed and deployed health-impact focused PSS: (1) TheNational Public Health Assessment Model (N-PHAM) (29) and (2) the Walkability Planning SupportSystem (31). The health impact components of both PSS were driven/underpinned by rigorous empiricalanalyses and modelling to identify coe�cients describing the strength of association between multiplebuilt environmental features and health outcomes of interest. Thirteen planning support system (PSS)products that have evolved from prototypes to fully developed professional software packages orproducts were identi�ed addressing land use transportation planning and environmental impactanalyses. Of these, only three incorporated a health impact analysis component. We identi�ed one off-the-shelf proprietary software product – CommunityViz Scenario 360 (26) that would allow users to builda health impact analysis. This dynamic plug-in for ESRI's ArcGIS enables the programming of custommodels that link the spatial features to outcomes of interest (i.e., health behaviours). As proprietaryproducts, both Envision tomorrow and Urban Footprint uses their US-based models and background landuse data to calculate health indicators, limiting their applicability. CommunityViz provides more �exibilityas it also offers the possibility to de�ne formulas for customised health indicators in different study sites.
Assessing the value of the Urban Health Check PSSPrevious reviews into the use of PSS in the planning profession have concluded that PSS research stillhas to prove its added value to planning practice (24) through empirical research that moves away fromexperimental case studies towards real-world planning problems (42-45). Moreover, PSS performancemeasures have shifted from a focus on their technical functionalities to their performance concerningtheir usefulness for assisting speci�c planning tasks (21). This shift is highly relevant in thinking aboutthe use of PSS for the translation and application of health evidence into planning practices and design
Page 19/27
outcomes. Similar to the attempts of Boulange et al., 2018 (31), we have demonstrated that empiricalmodels of the relationship between the built environment and health-related outcomes can beaccommodated within CommunityViz to create a bespoke, interactive, analytical tool to test scenarios ofchanges in the built environment.
Using an evaluation framework adopted from Pelzer (23, 36) that addresses the issues of usability andusefulness, we assessed the success of the Urban Health Check PSS in assisting with three distinctplanning tasks identi�ed by our industry partner. Evaluation results indicated the PPS helped in four keyareas:
Visualisation: the tool allowed stakeholders to see how the neighbourhood would change inresponse to a proposed plan.
Understanding: the tool helped stakeholders understand how the plan could bene�t the communityand demonstrate the complexity of balancing several desirable outcomes within a concept plan.
Health impact: the health indicators improved staff understanding of planning and design decisionsthat positively impact health outcomes and allowed for the communication and illustration of thebroader health-related bene�ts to the community.
Engagement: the tool made it easier for community members to provide direct feedback and see theimmediate implications of amendments to a proposed plan.
The development of PSS has traditionally been focused on supporting individual decision making (17).However, more recent approaches have seen the application of these to support group decision makingas part of dynamic workshops or processes in land use planning, to engage a range of key actors andstakeholders interactively and to stimulate cooperation and improve knowledge exchange amongdecision-makers (17). PSS have previously been identi�ed as useful for planning practice by helping thepublic to express their needs, promoting interpersonal dialogue and debate and producing information ina form that can be understood and used by the 'non-specialists' (46, 47). However, community memberswere reluctant to engage “hands on” with the PSS, preferring to let the facilitator sketch their ideas in thesystem. This might re�ect the unfamiliar nature of GIS and PSS for non-professional and thosecompetent in GIS skills.
The Urban Health Check PSS moves beyond conventional research translation approaches from thepublic health �eld through its ability to introduce an academic evidence-base to the world of practitionersand decision-makers who rarely use evidence (or PSS) in practice (10, 45) and to provide decision-makerswith the opportunity to trial different scenarios of planned or potential interventions and to assess themagainst health-oriented indicators. Because the Urban Health Check PSS was built on a customisablesystem (CommunityViz), the proposed methodology can be applied to construct further PSS applicable toother projects and contexts.
A better understanding of the factors in�uencing PSS's actual usefulness in practice enables us toprovide effective and holistic solutions to the current implementation gap of PSS (15, 19, 42, 48) and
Page 20/27
improve the support function of dedicated health impact PSS for healthy cities – helping to bridge thecurrent research-practice gap between public health and urban planning. Traditionally PSS have beendeveloped by academic researchers for planning professionals (37). More recently, Russo et al., 2018 (45)have emphasised the need for a co-design approach to the development of PPS that includes theparticipation of the planning professionals in the PSS design team to address the common problem ofmismatch between PSS functionality with end-user expectations (43, 49). The Urban Health Check PSSwas developed in collaboration with our industry partner to ensure it matched the planning tasks required.The spatial and health indicators were chosen to address the project's speci�c design principles andcommunity concerns, thus ensuring their relevance and �t for purpose.
LimitationsThere are some limitations to this research. A limited set of scenarios were developed for the case studysite. Ideally, more might be tested; however, this met the needs of the industry partner, and its applicationin a real-world setting is a progression in PSS development and deployment. In this case study, nointerventions were made on the street network to connect the residential dwellings and local livingdestinations. These interventions warrant further investigations and could be deployed in anotheralternative scenario. There are also limitations associated with the underlying health impact model: Alimited set of built environmental variables were included. Other design factors may also impacttransport-walking participation, for example, the presence of footpaths, shade or tra�c volumes, butthese were not tested in the PSS or included in the statistical model. Finally, the linear modellingapproach for the health impact indicator has limitations because it does not consider the dynamicenvironment in which walking is undertaken. Alternative statistical models should be tested to simulatebetter the complex pathways through which neighbourhoods' design in�uences walking.
The Urban Health Check PSS could be further developed to include other health outcomes as well asother built environment variables, including policy speci�c indicators, and could be expanded to evaluatepolicy compliance and coherence with planning standards by creating indicators that re�ect local policyrequirements (8). Given the limited resources, economic estimates can help make public health policydecisions by quantifying the costs and bene�ts of different alternatives (50). Monetising the healthimpacts and evaluating design scenarios will further assist in land use and transportation decisions andresearch translation. PSS also present an opportunity to explicitly communicate information about thepotential health impacts of urban planning policies using spatial indicators that re�ect local policypolicies and are essential for research translation (8, 10, 11).
ConclusionOurs is one of very few projects to develop a robust, empirically-based health impact PSS that has beenspeci�cally developed to estimate baseline and custom scenario health impacts of planning and urbandesign concepts. We propose that the use of health-impact PSS could be transformative for thetranslation and application of health evidence into planning policy and practice. Furthermore, it

Page 21/27
represents a signi�cant paradigm shift within the industry, providing, for the �rst time, those responsiblefor the policy and practice of designing and creating our communities with access to quanti�able,evidence-based information about how their decisions might impact community health. This shift couldstimulate strategic decisions and prioritise design solutions tailored to optimising communities' healthoutcomes and ultimately produce better, healthier on-ground communities. We provide severalrecommendations on how such PSS could be adopted to assist with the integration of empirical healthresearch and empirical evidence in practice:
Empowering planning professionals: Provides those responsible for the policy and practice ofdesigning and creating our communities with access to quanti�able, evidence-based informationabout how their decisions might impact community health & well-being, testing scenarios andgetting answers in real-time, in a form suited to their existing working processes & practices.
Educate elected members on the potential health impacts of their decisions – providing them withthe knowledge, evidence and con�dence to support their decision making, often in the face ofcommunity resistance to change
Enable planners to better communicate and engage the community in the consultation processesand improve community awareness and understanding of proposed design and redevelopmentproposals' potential health bene�ts. The application of an evidence-based health-impact planningsupport system might help de-politicise the problem. The visualisation of the health data makes itmore accessible, the impacts transparent, and the conversations evidence-based, allowing for a morerational conversation.
Equip the next generation of young and future planners whose education, training and professionaldevelopment have not traditionally incorporated a health promotion focus with the knowledge andskills to design the health-promoting communities of the future. Speci�cally, training future plannersto use PSS tools throughout their university studies would assist in the con�dence of planners inusing these tools in practice, as reported by Russo et al. (2018) (45).
We recommend that those involved in the development, use and research of health-impact PSS employthese lessons to improve the quality of PSS and their practical application and evaluate the use of healthevidence. In so doing, PSS may progress to becoming the valuable tools for enhancing the role of healthevidence and knowledge in planning, thereby enabling and facilitating more evidence-based planning (44,45) and bridging the gap between public health research and planning policy and practice.
List Of AbbreviationsPSS – planning support systems
GIS - Geographical Information Systems
Declarations
Page 22/27
Ethics approval and consent to participateThe urban health check PSS study was approved by The University of Western Australia's HumanResearch Ethics Committee (#RA/4/1/9190).
Consent for publicationNot applicable
Availability of data and materialsNot applicable
Competing interestsNot applicable
FundingThe study was funded by an NHMRC CRE in Healthy Liveable Communities (#1061404). PH is supportedby a Healthway Research Fellowship (#32892).
SF is supported by an ARC Discovery Early Career Researcher Award (DE160100140) and an RMIT VCFellowship.
Authors' contributionsAll authors participated in the design of the study. CB, GA, CP and PH developed the search strategy andCB and GA undertook the literature review. PH, CB and SF developed and deployed the Urban HealthCheck PSS. PH undertook the analysis with assistance from CB and drafted the manuscript. JB was amajor contributor in writing the manuscript. All authors contributed to, read, critically revised andapproved the �nal manuscript.
AcknowledgementsNot applicable
References
Page 23/27
1. Australian Institute of Health and Welfare. Australia’s health 2020: in brief. Canberra; 2021.
2. World Health Organization. The Health and Environment Linkages Initiative (HELI): Health impactassessment 2020 [Available from: https://www.who.int/heli/impacts/hiabrief/en/.
3. Chandrabose M, Rachele JN, Gunn L, Kavanagh A, Owen N, Turrell G, et al. Built environment andcardio-metabolic health: systematic review and meta-analysis of longitudinal studies. ObesityReviews. 2019;20(1):41-54.
4. Smith M, Hosking J, Woodward A, Witten K, MacMillan A, Field A, et al. Systematic literature review ofbuilt environment effects on physical activity and active transport – an update and new �ndings onhealth equity. International Journal of Behavioral Nutrition and Physical Activity. 2017;14(1):158.
5. United Nations. Sustainable development goals. Goal 11: Make cities inclusive, safe, resilient andsustainable. 2016. . 2016.
�. Corburn J. Confronting the challenges in reconnecting urban planning and public health. Am J PublicHealth. 2004;94(4):541-6.
7. Giles-Corti B, Sallis JF, Sugiyama T, Frank LD, Lowe M, Owen N. Translating active living research intopolicy and practice: one important pathway to chronic disease prevention. J Public Health Policy.2015;36(2):231-43.
�. Hooper P, Foster S, Giles-Corti B. A Case Study of a Natural Experiment Bridging the 'Research intoPolicy' and 'Evidence-Based Policy' Gap for Active-Living Science. Int J Environ Res Public Health.2019;16(14).
9. Durand CP, Andalib M, Dunton GF, Wolch J, Pentz MA. A systematic review of built environmentfactors related to physical activity and obesity risk: implications for smart growth urban planning.Obesity Reviews. 2011;12(5):e173-e82.
10. Allender S, Cavill N, Parker M, Foster C. `Tell us something we don't already know or do!' Theresponse of planning and transport professionals to public health guidance on the built environmentand physical activity. Journal of Public Health Policy. 2009;30(1):102-16.
11. Oliver K, Innvar S, Lorenc T, Woodman J, Thomas J. A systematic review of barriers to andfacilitators of the use of evidence by policymakers. BMC Health Services Research. 2014;14(1):1-12.
12. Klosterman RE. Planning Support Systems: A New Perspective on Computer-Aided Planning. Journalof Planning Education and Research. 1997;17(1):45-54.
13. Corburn J. Confronting the Challenges in Reconnecting Urban Planning and Public Health. AmericanJournal of Public Health. 2004;94(4):541-6.
14. Shrestha R, H K, J F, J M, M vM. Interactive Knowledge Co-Production and Integration for HealthyUrban Development. Sustainability. 2017;9:1945.
15. Geertman S, Stillwell J. Planning support systems: an inventory of current practice. Computers,Environment and Urban Systems. 2004;28(4):291-310.
1�. Geertman S, Stillwell J. Planning Support Systems: Best Practice and New Methods2009.

Page 24/27
17. Arciniegas G, Janssen R. Spatial decision support for collaborative land use planning workshops.Landscape and Urban Planning. 2012;107(3):332-42.
1�. Pettit C, Bakelmun A, Lieske SN, Glackin S, Hargroves KC, Thomson G, et al. Planning supportsystems for smart cities. City, Culture and Society. 2018;12:13-24.
19. Geertman S, Stillwell J. Planning support science: Developments and challenges. Environment andPlanning B: Urban Analytics and City Science. 2020;0(0):2399808320936277.
20. Ulmer JM, Chapman JE, Kershaw SE, Campbell M, Frank LD. Application of an evidence-based tool toevaluate health impacts of changes to the built environment. Can J Public Health. 2015;106(1 Suppl1).
21. Champlin C, te Brömmelstroet M, Pelzer P. Tables, Tablets and Flexibility: Evaluating PlanningSupport System Performance under Different Conditions of Use. Applied Spatial Analysis and Policy.2019;12(3):467-91.
22. Klosterman RE, Pettit CJ. An Update on Planning Support Systems. Environment and Planning B:Planning and Design. 2005;32(4):477-84.
23. Pelzer P. Usefulness of planning support systems: A conceptual framework and an empiricalillustration. Transportation Research Part A: Policy and Practice. 2017;104:84-95.
24. Vonk G, Geertman S, Schot P. A SWOT Analysis of Planning Support Systems. Environment andPlanning A: Economy and Space. 2007;39(7):1699-714.
25. Flacke J, R S, R A. Strengthening Participation using Interactive Planning Support Systems: ASystematic Review. International Journal of Geo-Information. 2019;9(1).
2�. City Explained Inc. CommunityViz: Urban Analytics for Planners 5.1. Charlotte, NC: City Explained Inc;2020.
27. Pettit CJ, Klosterman RE, Delaney P, Whitehead AL, Kujala H, Bromage A, et al. The Online What if?Planning Support System: A Land Suitability Application in Western Australia. Applied SpatialAnalysis and Policy. 2015;8(2):93-112.
2�. Pettit C, Biermann S, Pelizaro C, Bakelmun A. A Data-Driven Approach to Exploring Future Land Useand Transport Scenarios: The Online What If? Tool. Journal of Urban Technology. 2020;27(2):21-44.
29. Schoner J, Chapman J, Brookes A, MacLeod KE, Fox EH, Iroz-Elardo N, et al. Bringing health intotransportation and land use scenario planning: Creating a National Public Health Assessment Model(N-PHAM). Journal of Transport and Health. 2018;10:401-18.
30. Boulange C, Pettit C, Giles-Corti B. The walkability planning support system: An evidence-based toolto design healthy communities. Lecture Notes in Geoinformation and Cartography2017. p. 153-65.
31. Boulange C, Pettit C, Gunn LD, Giles-Corti B, Badland H. Improving planning analysis and decisionmaking: The development and application of a Walkability Planning Support System. Journal ofTransport Geography. 2018;69:129-37.
32. Badland H, M W, G M, S E, S M, Pettit C, et al. Using simple agent-based modeling to inform andenhance neighborhood walkability. International Journal of Health Geographics. 2013;12(58).

Page 25/27
33. Lowe M, Arundel J, Hooper P, Rozek J, Higgs C, Roberts R, et al. Liveability aspirations and realities:Implementation of urban policies designed to create healthy cities in Australia. Social Science &Medicine. 2020;245:112713.
34. MapSup. MapSup's MapTable 2020 [Available from: https://www.mapsup.nl/.
35. Neilsen J. Usability Engineering Massachusetts Avenue, Cambridge, MA: Academic Press, Inc.; 1993.
3�. Pelzer P, Arciniegas G, Geertman S, Lenferink S. Planning Support Systems and Task-Technology Fit:a Comparative Case Study. Applied Spatial Analysis and Policy. 2015;8(2):155-75.
37. Brömmelstroet MT, Schrijnen PM. From Planning Support Systems to Mediated Planning Support: AStructured Dialogue to Overcome the Implementation Gap. Environment and Planning B: Planningand Design. 2010;37(1):3-20.
3�. Miller W. Introducing Geodesign: The Concept. Redlands, California: ESRI; 2012.
39. Biderman C, DC S. Challenging the conventional wisdom: The case of MobiLab, Sao Paulo, Brazil. In:Geertman S, Stillwell J, editors. Handbook of Planning Support Science. Cheltenham: Edward Elgar;2020. p. 257–68.
40. Luque-Martín I, Pfeffer K. Limitations and potential of planning support systems application inplanning in southern Spain: bridging academia and practice. In: Geertman S, Stillwell J, editors.Handbook of Planning Support Science. Cheltenham: Edward Elgar; 2020. p. 257–68.
41. Dias E, M L, A R, E K, H S. Beauty and Brains: Integrating Easy Spatial Design and Advanced UrbanSustainability Models. In: S G, F T, J S, editors. Planning Support Systems for Sustainable UrbanDevelopment Lecture Notes in Geoinformation and Cartography. 195. Berlin, Heidelberg: Springer;2013.
42. Geertman S. PSS: Beyond the implementation gap. Transportation Research Part A: Policy andPractice. 2017;104:70-6.
43. Vonk G, Geertman S, Schot P. Bottlenecks Blocking Widespread Usage of Planning Support Systems.Environment and Planning A: Economy and Space. 2005;37(5):909-24.
44. Russo P, Costabile MF, Lanzilotti R, Pettit CJ. Usability of Planning Support Systems: An EvaluationFramework. In: Geertman S, Ferreira JJ, Goodspeed R, Stillwell J, editors. Planning Support Systemsand Smart Cities. Cham: Springer International Publishing; 2015. p. 337-53.
45. Russo P, Lanzilotti R, Costabile MF, Pettit CJ. Towards satisfying practitioners in using PlanningSupport Systems. Computers, Environment and Urban Systems. 2018;67:9-20.
4�. Pelzer P, Geertman S, van der Heijden R. A comparison of the perceived added value of PSSapplications in group settings. Computers, Environment and Urban Systems. 2016;56:25-35.
47. te Brömmelstroet. Making planning support systems matter : improving the use of planning supportsystems for integrated land use and transport strategy-making. Amsterdam, the Netherlands:University of Amsterdam; 2010.
4�. Geertman S. Participatory Planning and GIS: A PSS to Bridge the Gap. Environment and Planning B:Planning and Design. 2002;29(1):21-35.
Page 26/27
49. Pelzer P, Geertman S, Heijden Rvd, Rouwette E. The added value of Planning Support Systems: Apractitioner’s perspective. Computers, Environment and Urban Systems. 2014;48:16-27.
50. Glied S, Teutsch SM. How Can Economics Advance Prevention? American Journal of PreventiveMedicine. 2016;50(5):s4-s5.
Figures
Figure 1
PSS interface, developed using CommunityViz, used at the community consultation
Figure 2

Page 27/27
Survey results from community members