Embed Size (px)
Citation preview
HAL Id: hal-01294644https://hal-enpc.archives-ouvertes.fr/hal-01294644
Submitted on 29 Mar 2016
HAL is a multi-disciplinary open accessarchive for the deposit and dissemination of sci-entific research documents, whether they are pub-lished or not. The documents may come fromteaching and research institutions in France orabroad, or from public or private research centers.
L’archive ouverte pluridisciplinaire HAL, estdestinée au dépôt et à la diffusion de documentsscientifiques de niveau recherche, publiés ou non,émanant des établissements d’enseignement et derecherche français ou étrangers, des laboratoirespublics ou privés.
BEVs and PHEVs in France: Market trends and keydrivers of their short-term developmentEleonora Morganti, Virginie Boutueil, Fabien Leurent
To cite this version:Eleonora Morganti, Virginie Boutueil, Fabien Leurent. BEVs and PHEVs in France: Market trendsand key drivers of their short-term development : Project Corri-door Task 4.1: Evolution of EV/PHEVmarket Interim report Final version 1. [Research Report] Corri-Door Consortium. 2015, pp.37. �hal-01294644�
BEVs and PHEVs in France:
Market trends and key drivers of their short-term development
Project Corri-door
Task 4.1: Evolution of EV/PHEV market
Interim report Final version 1.1
April 2015
Author: Eleonora Morganti, ParisTech
Co-authors: Virginie Boutueil, Fabien Leurent, Laboratoire Ville Mobilité Transport, École des Ponts - ParisTech
2
About this report Authors: Eleonora Morganti Virginie Boutueil Fabien Leurent
Laboratoire Ville Mobilité Transport École des Ponts - ParisTech 6-8 Avenue Blaise Pascal Cité Descartes Champs-sur-Marne 77455 Marne-la-Vallée cedex 2 Phone: + 33 01.81.66.89.21
Version Final 1.1 Date April 2015 Approved by the Corri-door Steering Committee 12 May 2015 Last edited 26 June 2015 Disclaimer This document was prepared as a result of work sponsored by the Corri-door project. The opinions, findings, and conclusions are those of the authors and do not necessarily represent the views of Corri-door consortium partners. Acknowledgements We thank the Innovation & Networks Executive Agency INEA for partially funding this project. We thank Bastien Batt and Olivier Paturet (Nissan), Sabrine Labiadh (BMW), Sebastien Albertus and Thomas Orsini (Renault), Michael Schrieber and Philippe Raimondi (Volkswagen AG), and Marie Castelli (AVERE-France) for their valuable inputs. Special thanks go to Patrick Gagnol (EDF). For More Information Contact Eleonora Morganti, [email protected]
3
Contents Outline .................................................................................................................................................. 5
1. Introduction .................................................................................................................................. 6
1.1 General background .............................................................................................................. 6 1.2 Preliminary insights into the market conditions for PEVs in France .................................... 6
1.3 Structure of the report ............................................................................................................ 8
2. Methodology ................................................................................................................................ 9
2.1 Data collection and analysis for the interim report ............................................................... 9 2.2 Laying the ground for EV market assessment ....................................................................... 9
3. PEV market trends ..................................................................................................................... 11
3.1 Global PEV sales ................................................................................................................. 11
3.2 PEV sales in Europe ............................................................................................................ 12 3.3 PEV Sales in France ............................................................................................................ 14 3.4 Neighboring markets ........................................................................................................... 17
4. Market forecasts and potential market projections .................................................................... 19 4.1 Available market forecasts .................................................................................................. 19 4.2 Potential market projections ................................................................................................ 19
5. Identifying key drivers of the short-term market development ................................................. 22 5.1 Insights from the literature .................................................................................................. 22 5.2 Three main barriers to the uptake of PEVs ......................................................................... 24 5.3 BARRIER #1. High retail prices ......................................................................................... 24 5.4 BARRIER #2. Low level of consumer acceptance ............................................................. 25 5.5 BARRIER #3. Lack of charging infrastructure ................................................................... 26
6. Focus on fast-charging infrastructure ........................................................................................ 28 6.1 Main fast-charging networks in Europe .............................................................................. 28 6.2 Range anxiety and average distance between fast chargers ................................................ 29
6.3 French fast-charging infrastructure ..................................................................................... 30 7. Concluding remarks ................................................................................................................... 31
7.1 2017 as a pivotal year? ........................................................................................................ 31 7.2 Additional food for thought ................................................................................................. 31
References .......................................................................................................................................... 33
4
List of Acronyms
AC Alternating Current ACEA European Automobile Manufacturer's Association ADEME Agence de l’environnement et de la maîtrise de l’énergie AVERE European Association for Battery, Hybrid and Fuel Cell Electric Vehicles BEV Battery-Electric Vehicle CCFA Comité des Constructeurs Français d'Automobiles DC Direct Current EC European Commission ECV EDF
Total Electrically Charged Vehicle Électricité de France
EEI Edison Electric Institute EGT Enquête Globale Transport
EMD Enquête Ménages Déplacements ENTD Enquête Nationale Transports Déplacements EU European Union ICE Internal Combustion Engine ICCT International Council in Clean Transportation
IEA International Energy Agency
INEA Innovation & Networks Executive Agency ITF International Transport Forum LPG Liquefied petroleum gas MEDDE Ministère de l'Ecologie, du Développement Durable et de l'Energie MEEDDAT Ministère de l’Ecologie, de l’Energie, du Développement Durable et de l’Aménagement du Territoire NEV Neighborhood Electric Vehicle NG Natural Gas NRC National Research Council OEM Original Equipment Manufacturer
PEV Plug-in Electric Vehicle (including BEV and PHEV) PHEV Plug-in Hybrid-Electric Vehicle QC Quick Charger
TCO Total Costs of Ownership TEN-T Trans European Network - Transport UNRAE Unione Nazionale Rappresentanti Autoveicoli Esteri
5
Outline
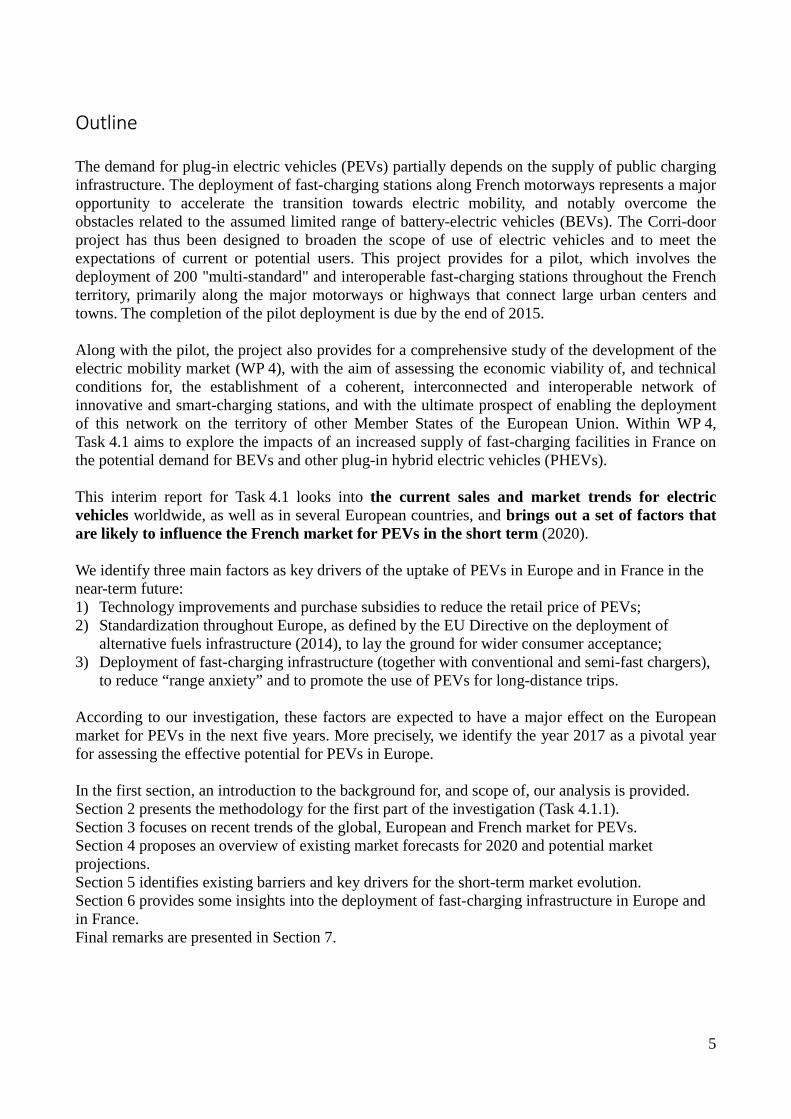
The demand for plug-in electric vehicles (PEVs) partially depends on the supply of public charging infrastructure. The deployment of fast-charging stations along French motorways represents a major opportunity to accelerate the transition towards electric mobility, and notably overcome the obstacles related to the assumed limited range of battery-electric vehicles (BEVs). The Corri-door project has thus been designed to broaden the scope of use of electric vehicles and to meet the expectations of current or potential users. This project provides for a pilot, which involves the deployment of 200 "multi-standard" and interoperable fast-charging stations throughout the French territory, primarily along the major motorways or highways that connect large urban centers and towns. The completion of the pilot deployment is due by the end of 2015. Along with the pilot, the project also provides for a comprehensive study of the development of the electric mobility market (WP 4), with the aim of assessing the economic viability of, and technical conditions for, the establishment of a coherent, interconnected and interoperable network of innovative and smart-charging stations, and with the ultimate prospect of enabling the deployment of this network on the territory of other Member States of the European Union. Within WP 4, Task 4.1 aims to explore the impacts of an increased supply of fast-charging facilities in France on the potential demand for BEVs and other plug-in hybrid electric vehicles (PHEVs). This interim report for Task 4.1 looks into the current sales and market trends for electric vehicles worldwide, as well as in several European countries, and brings out a set of factors that are likely to influence the French market for PEVs in the short term (2020). We identify three main factors as key drivers of the uptake of PEVs in Europe and in France in the near-term future: 1) Technology improvements and purchase subsidies to reduce the retail price of PEVs; 2) Standardization throughout Europe, as defined by the EU Directive on the deployment of
alternative fuels infrastructure (2014), to lay the ground for wider consumer acceptance; 3) Deployment of fast-charging infrastructure (together with conventional and semi-fast chargers),
to reduce “range anxiety” and to promote the use of PEVs for long-distance trips. According to our investigation, these factors are expected to have a major effect on the European market for PEVs in the next five years. More precisely, we identify the year 2017 as a pivotal year for assessing the effective potential for PEVs in Europe. In the first section, an introduction to the background for, and scope of, our analysis is provided. Section 2 presents the methodology for the first part of the investigation (Task 4.1.1). Section 3 focuses on recent trends of the global, European and French market for PEVs. Section 4 proposes an overview of existing market forecasts for 2020 and potential market projections. Section 5 identifies existing barriers and key drivers for the short-term market evolution. Section 6 provides some insights into the deployment of fast-charging infrastructure in Europe and in France. Final remarks are presented in Section 7.
6
1. Introduction
1.1 General background
The uptake of plug-in electric vehicles (PEVs) is a main priority in the transition towards a more sustainable mobility in Europe. Indeed, being identified as an alternative clean technology by the European Commission (2013), PEVs could contribute to reduce the excessive reliance of the European passengers and freight transport system on oil (94%) which is largely imported from politically unstable regions. Raising energy security by reducing Europe's dependence on imported oil is not the only advantage of electric mobility: other benefits include stimulating long-term economic growth through the development of new technologies and industries (Cambridge econometrics et al. 2013; EC 2013), improving public health through better local air quality, and decreasing greenhouse gas (GHG) emissions – especially when electricity is partially derived from renewable sources (EC 2006).
However, as of 2015, there are economic, technical, and social obstacles to the widespread uptake of electric vehicles. Some of these obstacles stem from technical or economic limitations related to PEVs, including high upfront costs, uncertain resale values, limited driving ranges, and long charging times (Windisch 2013). Other obstacles stem from the fact that people are still unfamiliar with electric vehicles, are uncertain about their overall performance as well as their costs and benefits, and have diverse mobility needs which the current electric mobility system might only partially fulfill (NRC 2013). The deployment of large recharging infrastructure networks throughout the European territory arises from the conception that an increase in the density of the recharging infrastructure can partially remove some of the above-mentioned financial and non-financial barriers to the widespread uptake of battery-electric vehicles (BEVs) and other plug-in hybrid-electric vehicles (PHEVs) in Europe.
1.2 Preliminary insights into the market conditions for PEVs in France
Over the last five years, the French government has raised its commitment on enhancing the adoption of clean vehicles and, under the French environmental roadmap defined by the Energy and Sustainable Development Ministry, up to 750 million EUR could be assigned to initiatives aiming at the development of PEVs. Indeed, France has set the ambitious target of having 2 million PEVs on the roads by 2020 (Borloo and Estrosi 2010) and about 7 million private and public charging stations by 2030 (MEDDE 2015d)1. As part of this roadmap, in January 2015, the government increased the bonus offered for the purchase of low-carbon emission vehicles: the incentive has been raised to 10,000 EUR for BEVs (when trading-in a 14 years-old diesel car) and 6,500 EUR for PHEVs, only for private cars. Additional incentives are planned at city level, including access permits on high-pollution days, free parking, etc. In the case of Paris, the anti-smog plan sets progressive phase-out of old diesel-powered vehicles, banning diesel cars, two-wheels and vans registered before the end of 1997 by July 2016 (Mairie de Paris, 10 February 2015). About 12,000 new PEVs were registered in France in 2014 (CCFA 2015) and the existing stock accounts for about 32,000 cars. Sales of electric cars increased at a slower pace than expected by OEMs and policymakers that consider French households to be generally well adapted to the needs and limitations of electric vehicles: 35 % of them are motorized, have access to parking
1 For the record, there were 17,200 public and private sockets in France as of 2014 according to ChargeMap.
7
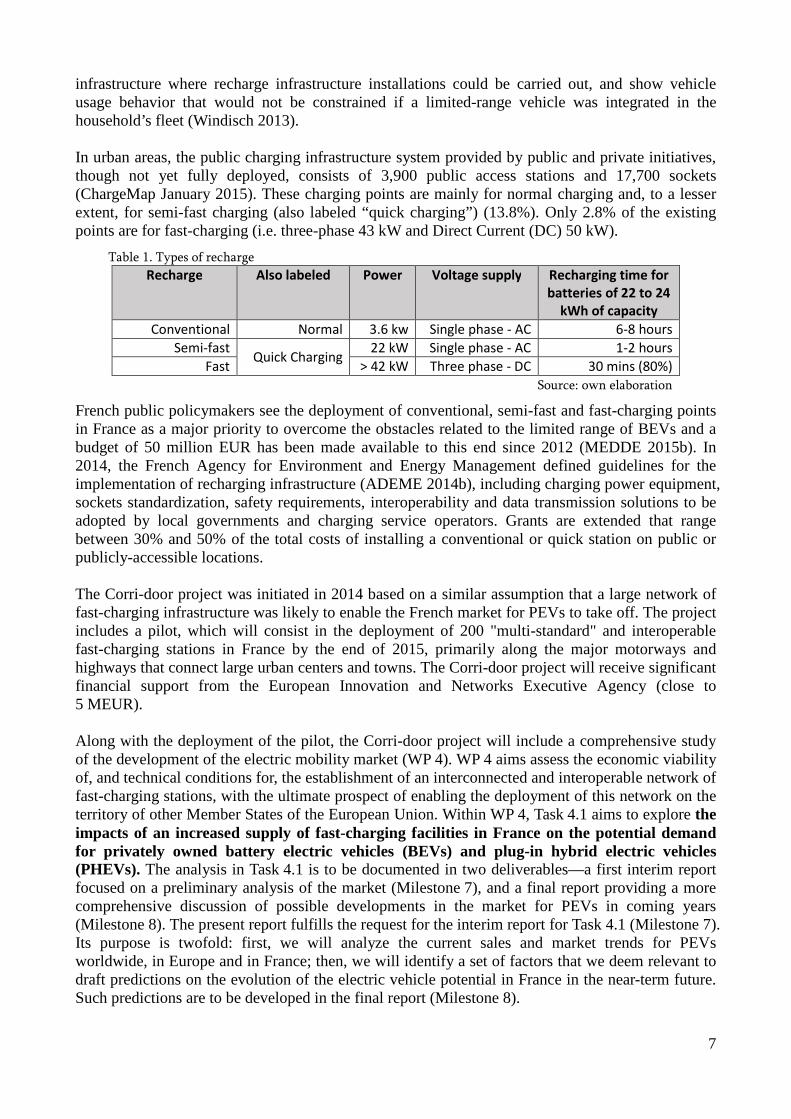
infrastructure where recharge infrastructure installations could be carried out, and show vehicle usage behavior that would not be constrained if a limited-range vehicle was integrated in the household’s fleet (Windisch 2013). In urban areas, the public charging infrastructure system provided by public and private initiatives, though not yet fully deployed, consists of 3,900 public access stations and 17,700 sockets (ChargeMap January 2015). These charging points are mainly for normal charging and, to a lesser extent, for semi-fast charging (also labeled “quick charging”) (13.8%). Only 2.8% of the existing points are for fast-charging (i.e. three-phase 43 kW and Direct Current (DC) 50 kW).
Table 1. Types of recharge
Recharge Also labeled Power Voltage supply Recharging time for
batteries of 22 to 24
kWh of capacity
Conventional Normal 3.6 kw Single phase - AC 6-8 hours
Semi-fast Quick Charging
22 kW Single phase - AC 1-2 hours
Fast > 42 kW Three phase - DC 30 mins (80%)
Source: own elaboration
French public policymakers see the deployment of conventional, semi-fast and fast-charging points in France as a major priority to overcome the obstacles related to the limited range of BEVs and a budget of 50 million EUR has been made available to this end since 2012 (MEDDE 2015b). In 2014, the French Agency for Environment and Energy Management defined guidelines for the implementation of recharging infrastructure (ADEME 2014b), including charging power equipment, sockets standardization, safety requirements, interoperability and data transmission solutions to be adopted by local governments and charging service operators. Grants are extended that range between 30% and 50% of the total costs of installing a conventional or quick station on public or publicly-accessible locations. The Corri-door project was initiated in 2014 based on a similar assumption that a large network of fast-charging infrastructure was likely to enable the French market for PEVs to take off. The project includes a pilot, which will consist in the deployment of 200 "multi-standard" and interoperable fast-charging stations in France by the end of 2015, primarily along the major motorways and highways that connect large urban centers and towns. The Corri-door project will receive significant financial support from the European Innovation and Networks Executive Agency (close to 5 MEUR). Along with the deployment of the pilot, the Corri-door project will include a comprehensive study of the development of the electric mobility market (WP 4). WP 4 aims assess the economic viability of, and technical conditions for, the establishment of an interconnected and interoperable network of fast-charging stations, with the ultimate prospect of enabling the deployment of this network on the territory of other Member States of the European Union. Within WP 4, Task 4.1 aims to explore the impacts of an increased supply of fast-charging facilities in France on the potential demand for privately owned battery electric vehicles (BEVs) and plug-in hybrid electric vehicles (PHEVs). The analysis in Task 4.1 is to be documented in two deliverables—a first interim report focused on a preliminary analysis of the market (Milestone 7), and a final report providing a more comprehensive discussion of possible developments in the market for PEVs in coming years (Milestone 8). The present report fulfills the request for the interim report for Task 4.1 (Milestone 7). Its purpose is twofold: first, we will analyze the current sales and market trends for PEVs worldwide, in Europe and in France; then, we will identify a set of factors that we deem relevant to draft predictions on the evolution of the electric vehicle potential in France in the near-term future. Such predictions are to be developed in the final report (Milestone 8).
8
The Corri-door consortium is led by the French utility EdF and its affiliate Sodétrel. Other partners include the Original Equipment Manufacturers (OEMs) Renault, Nissan, BMW and Volkswagen, as well as the public institute for scientific cooperation ParisTech. ParisTech is the designated coordinator for WP 4. The study under Task 4.1 is directed by Laboratoire Ville Mobilité Transport (LVMT), a laboratory of École des Ponts ParisTech.
1.3 Structure of the report
This report covers the following issues: - a description of the current market for electric vehicles; - an overview of existing policies and large-scale projects related to the recharging
infrastructure (with insights into the current status of interoperability); - a selection of relevant factors to include in our future assessment of the potential market for
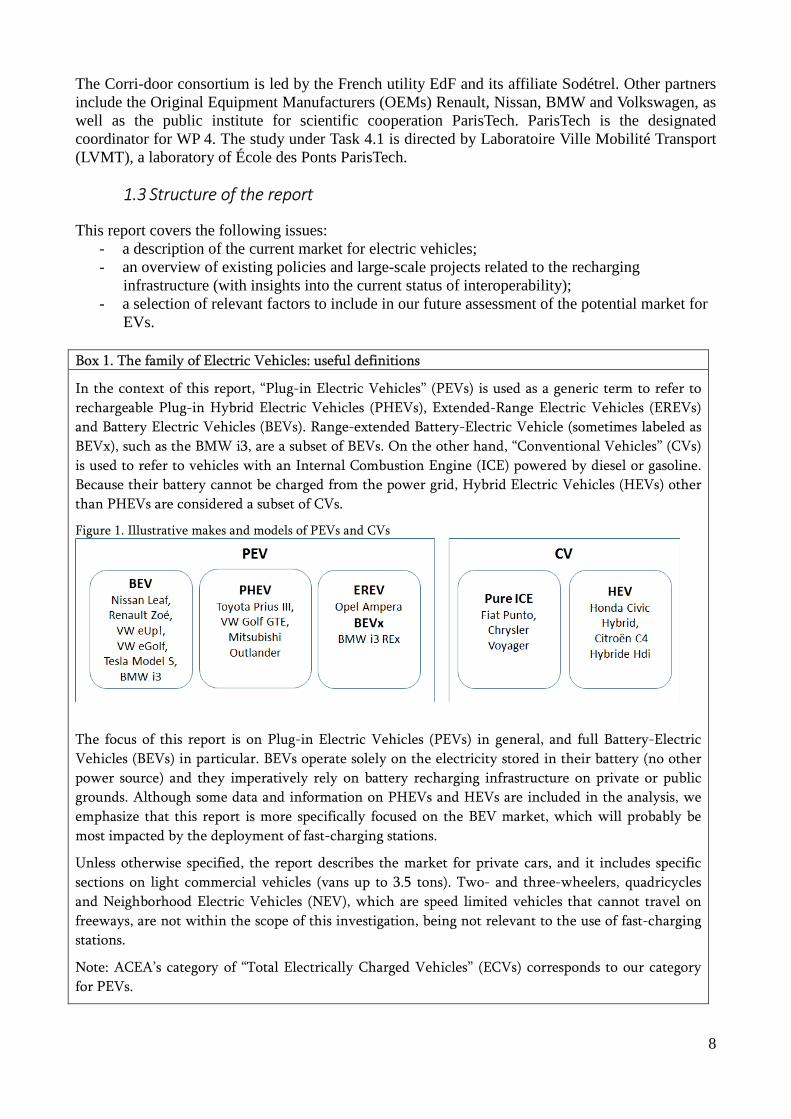
EVs. Box 1. The family of Electric Vehicles: useful definitions
In the context of this report, “Plug-in Electric Vehicles” (PEVs) is used as a generic term to refer to
rechargeable Plug-in Hybrid Electric Vehicles (PHEVs), Extended-Range Electric Vehicles (EREVs)
and Battery Electric Vehicles (BEVs). Range-extended Battery-Electric Vehicle (sometimes labeled as
BEVx), such as the BMW i3, are a subset of BEVs. On the other hand, “Conventional Vehicles” (CVs)
is used to refer to vehicles with an Internal Combustion Engine (ICE) powered by diesel or gasoline.
Because their battery cannot be charged from the power grid, Hybrid Electric Vehicles (HEVs) other
than PHEVs are considered a subset of CVs.
Figure 1. Illustrative makes and models of PEVs and CVs
The focus of this report is on Plug-in Electric Vehicles (PEVs) in general, and full Battery-Electric
Vehicles (BEVs) in particular. BEVs operate solely on the electricity stored in their battery (no other
power source) and they imperatively rely on battery recharging infrastructure on private or public
grounds. Although some data and information on PHEVs and HEVs are included in the analysis, we
emphasize that this report is more specifically focused on the BEV market, which will probably be
most impacted by the deployment of fast-charging stations.
Unless otherwise specified, the report describes the market for private cars, and it includes specific
sections on light commercial vehicles (vans up to 3.5 tons). Two- and three-wheelers, quadricycles
and Neighborhood Electric Vehicles (NEV), which are speed limited vehicles that cannot travel on
freeways, are not within the scope of this investigation, being not relevant to the use of fast-charging
stations.
Note: ACEA’s category of “Total Electrically Charged Vehicles” (ECVs) corresponds to our category
for PEVs.
9
2. Methodology
2.1 Data collection and analysis for the interim report
In this preliminary stage of research, our investigation combined a literature review with survey activities. Data collected through these two methods proved complementary information to depict a more comprehensive picture of current market conditions for PEVs and to identify the factors af-fecting market evolution in France. Our fieldwork, which commenced on 15 September 2014 and was completed on 5 February 2015, comprised the following:
• Seven interviews with representatives of French and foreign automotive manufacturers and their suppliers,
• Desktop research and analysis of: – Publicly available information relevant to the objective of the study, – Non-public information, including EV sales and production in-house forecasts by several OEMs.
Individual face-to-face interviews were conducted based on the following semi-structured ques-tions:
• What are the key factors driving growth in the light-duty PEV market in Europe and especially in France? What are the specific drivers for the passenger car segment?
• How will light-duty PHEV and BEV sales be affected by fast-charging infrastructure deployment in France?
• What are the European, national and regional policies regarding EVs that will affect EV sales in France?
• How will fuel prices and advances in lithium-ion (Li-ion) batteries affect light-duty EV sales in France?
The seven respondents were selected among representatives of OEM partners of the Corri-door project, industry and sector associations, government agencies, scholars, and experts in the electrification process of passenger and freight transport systems. The literature review set out to collect data on the existing PEV market from various stakeholders, including automotive OEMs, European and French government agencies, industrial associations, consumers’ community. It included an analysis of official documents, academic and consulting studies, articles in the trade press and reports by research institutions. Data on market sales was col-lected from the literature and from manufacturers’ websites, because official statistics, at European and national level, are still limited. For the sake of clarity, we emphasize that this analysis is based on the observation of current market conditions and includes only preliminary considerations and projections of PEV market scenarios, based on a set of pre-determined average annual growth rates.
2.2 Laying the ground for EV market assessment
This preliminary stage of our investigation provides us with a list of factors which we plan to incorporate in our further analysis (which will be developed in the second stage of the analysis planned under Task 4.1) in order to explore the impacts of an increased supply of fast-charging facilities in France on the potential demand for privately owned PEVs. Based on available data from

10
the French national (and/or local) transport surveys2, we will present an assessment of the impacts of the locational patterns for fast-charging stations on the household demand for EVs. Based on the national light-commercial vehicle survey3, we will also present a preliminary assessment of the potential market for light-duty freight transport services using EVs. We will use the results of the ongoing pilot project Corri-door as an additional input in our analysis of the early market deployment of EVs. The main purposes of our overall study will be to discuss: (1) whether PEVs will be present in the French light-duty vehicle fleet in the short term; (2) what future key drivers will impact the PEV market; (3) what role infrastructure will play in encouraging the market diffusion of PEVs.
2 The French survey “Enquête Nationale Transport et Déplacement” (ENTD) is a nationwide household travel survey. It was last carried out in France in 2007/2008: data was then collected from 30.000 households to depict their habits and behaviors with regards to transport and mobility. 3 The French survey “Enquête nationale sur l’utilisation des Véhicules Utilitaires Légers” (VUL) provides data on vans and pickups, describing existing fleet and trips. It was last carried out in 2010.
11
3. PEV market trends
3.1 Global PEV sales
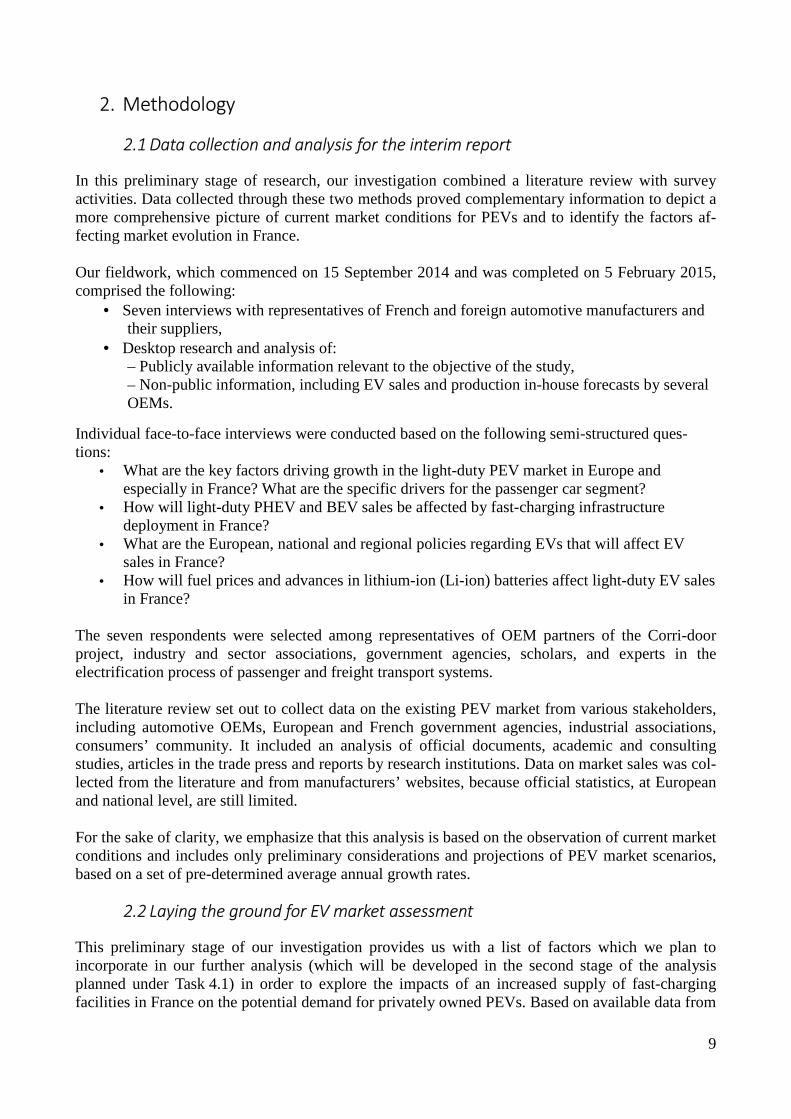
As of early 2015, the number of electric vehicles on the roads can be assessed around 720,000 units worldwide (Mock and Yang 2014; InsideEV 2015) and 2014 annual sales amounted to about 320,000 vehicles worldwide (InsideEV 2015). In 2011, this number was much lower, around 40,000 units were sold, and EVs then represented only 0.06 percent of the 51.1 million cars and vans which were altogether sold on the European market, the U.S. market, and key Asian markets (Proff et Kilian 2012). These figures show how the market is evolving quickly as more automakers embrace the technology: the current generation of PEVs offers performance and drivability comparable to those of conventional vehicles, an increased battery range (between 150 and 300 km, depending on the model) and a wider choice of models. This phase began with the introduction of the Nissan Leaf in December 2010. Other car models recently entered the market, e.g. the Renault Zoe (in March 2013), BMW i3 and Volkswagen E-Up! (in October 2013). As a result, almost every OEM currently includes a battery-electric and/or plug-in hybrid-electric version of their classic ICE models. Whereas the market offered very few PEVs only four years ago, the largest automotive manufacturers in the EU, the US and Japan now market altogether more than 20 models of electric passenger cars and light commercial vehicles (see Box 1). Moreover, lithium batteries are still expensive, but increases in sales volume and technology improvements are pulling the costs down (EII 2014) at the same time private investors are enhancing the network of charging stations and developing complementary services. According to Vergis and Turrentine (2014), these elements concur that EV development is currently in “the age of mass production", which started in 2008. The global PEV market indeed shows a consistent upward trend in sales, especially in Western countries and Asian countries. China, for example, represent one of the biggest emerging market where sales of PEV in 2014 reached 74,763 units, 3.2 times from a year earlier, of which BEV was 45,048 units and PHEV was 29,715 units, respectively 2.1 times and 8.8 times (CAAM 2015). As shown in Figure 2, the raise in PEV sales was not affected by the downturn in oil prices that occurred in the second half of 2014. However, over such a short period of time (less than a semester), it is hard to assess whether the reduction in oil prices will end up having an effect on the market in the form of a decrease in PEV sales. Comparing monthly sales in last quarter of 2014 and 2013, for example, a decrease of 7,7% in the market share of PEVs was registered in Europe (ACEA 2015). If the downward trend in oil prices is confirmed over the medium term, it would be interesting to test the hypothesis proposed by Zuleta (2015), who states that the process of electrification in the global automotive industry could be one of the drivers of the recent decrease in oil prices, through driving downwards the demand for major petroleum derivatives (e.g. gasoline and diesel). The Chinese government, the European Commission and an increasing number of countries are in fact fostering the mass introduction of electric vehicles to reduce the dependency on oil of their respective transport systems.
12
Figure 2. Global EV sales vs oil prices
Source: our own elaboration, based on Mock and Yang 2014; InsideEV 2015; EIA 2015
3.2 PEV sales in Europe
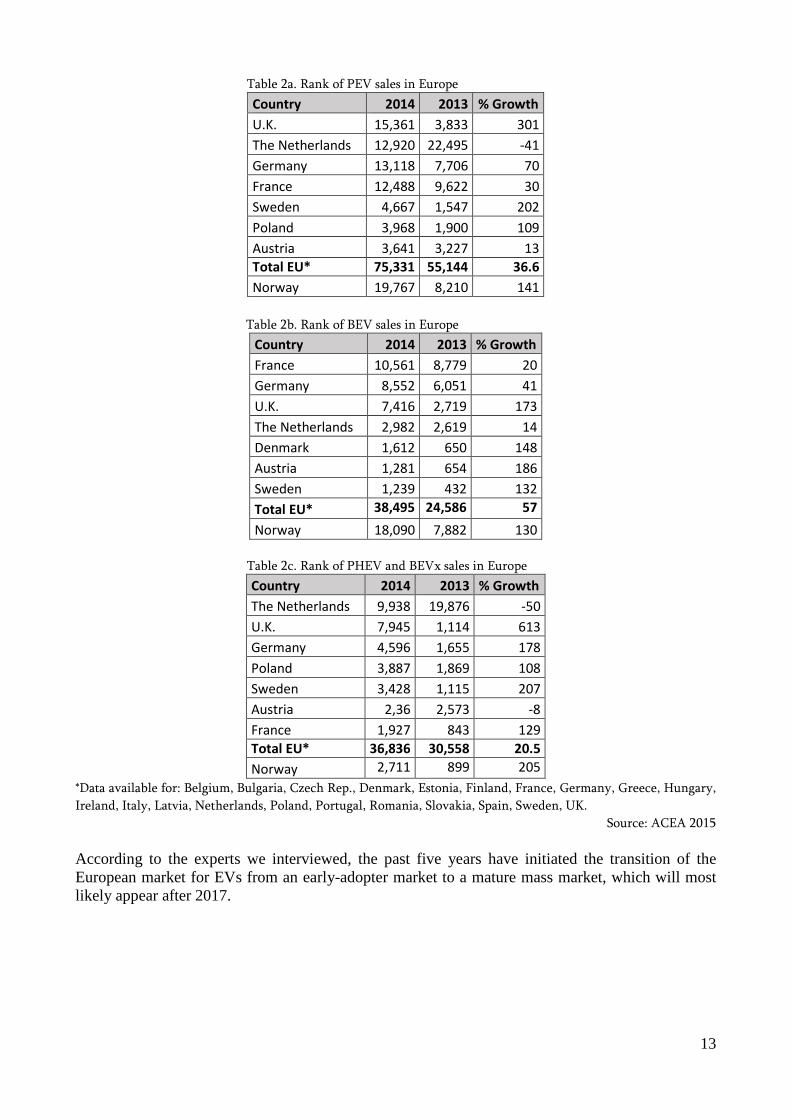
Altogether, Europe accounts for about a quarter of worldwide EV sales, second only to the U.S. market, which records over 40% of global EV sales (ACEA 2015, InsideEV 2015). Similar to the U.S., PEVs in the EU make up about 0.6 % of new vehicle registrations and market shares vary widely among European countries. For example, the market penetration of PEVs in the Netherlands was 5.5 % of all new sales in 2013 (ICCT 2014), whereas only 10 electric vehicles were sold in Romania and Bulgaria in 2014 (ACEA 2015). In 2014, the EU4 Member States registered 75,331 new PEVs, up by 36.6% from 2013 levels, and by 550% from 2011 levels (ACEA 2015). It is worth noticing that PEV sales across Europe were split evenly between hybrid vehicles (PHEVs and BEVx) on the one hand, and plug-in electric cars on the other hand, with the total number of registrations representing just 0.6 percent of the overall market for passenger cars (ACEA 2015). Indeed, BEV sales rose to 38,495 units in 2014, up from 24,586 units in 2013, while the sales of PHEVs and BEVx rose to 36,836 units in 2014, up from 30,558 units in 2013. Looking at the major European markets, the UK saw a massive increase in PEV sales in 2014 (+300% from 2013), followed by Germany (+70%) and France (+30%). As illustrated in Table 2a, new electric vehicle registrations vary significantly among the European countries. Not surprisingly, Norway, for the third consecutive year, ranked first in Europe in 2014, with 19,767 new PEV registrations (ACEA 2015), more than twice the number of registrations recorded in 2013 (+141%). The second largest market was the UK (15,361), then came the Netherlands (12,920), Germany (13,118) and, ranking fifth, France (12,488). Looking at the BEV market, the ranking is slightly different, France ranking second, with 10,561 new battery-electric car registrations, second only to Norway (18,980).
4 Data available for car sales in: Belgium, Bulgaria, Czech Rep., Denmark, Estonia, Finland, France, Germany, Greece, Hungary, Ireland, Italy, Latvia, Netherlands, Poland, Portugal, Romania, Slovakia, Spain, Sweden, UK.
13
Table 2a. Rank of PEV sales in Europe
Country 2014 2013 % Growth
U.K. 15,361 3,833 301
The Netherlands 12,920 22,495 -41
Germany 13,118 7,706 70
France 12,488 9,622 30
Sweden 4,667 1,547 202
Poland 3,968 1,900 109
Austria 3,641 3,227 13
Total EU* 75,331 55,144 36.6
Norway 19,767 8,210 141
Table 2b. Rank of BEV sales in Europe
Country 2014 2013 % Growth
France 10,561 8,779 20
Germany 8,552 6,051 41
U.K. 7,416 2,719 173
The Netherlands 2,982 2,619 14
Denmark 1,612 650 148
Austria 1,281 654 186
Sweden 1,239 432 132
Total EU* 38,495 24,586 57
Norway 18,090 7,882 130
Table 2c. Rank of PHEV and BEVx sales in Europe
Country 2014 2013 % Growth
The Netherlands 9,938 19,876 -50
U.K. 7,945 1,114 613
Germany 4,596 1,655 178
Poland 3,887 1,869 108
Sweden 3,428 1,115 207
Austria 2,36 2,573 -8
France 1,927 843 129
Total EU* 36,836 30,558 20.5
Norway 2,711 899 205
*Data available for: Belgium, Bulgaria, Czech Rep., Denmark, Estonia, Finland, France, Germany, Greece, Hungary,
Ireland, Italy, Latvia, Netherlands, Poland, Portugal, Romania, Slovakia, Spain, Sweden, UK. Source: ACEA 2015
According to the experts we interviewed, the past five years have initiated the transition of the European market for EVs from an early-adopter market to a mature mass market, which will most likely appear after 2017.
14
Box 2. Early-adopter markets and subsidy programs in the EU
In Europe, two countries present a more mature market development for EVs: (i) Norway, which has
the highest share of electric automobile sales (BEVs and PHEVs combined), with about 13% of all pas-
senger cars sold in 2014; and (ii) the Netherlands, the second-highest market share, with about 5.6%
(ICCP 2014). These two countries with relatively small populations (respectively 5 and 16 million in-
habitants) are examples where strong EV tax incentives combined with high diesel costs result in a
comparative advantage for EV users in terms of total cost of ownership. As a result, both countries show
high EV market growth rates and market shares (Mock and Yang 2014). While in Norway only BEVs
are exempted from VAT and registration tax, in the Netherlands, the fiscal incentives apply to both,
BEVs and PHEVs. The effects on the market are illustrated by the high penetration of PHEVs in the
Netherlands (Table 2c).
Outside Europe, another territory shows interesting results on the EV market: California has one of the
largest market shares for EVs worldwide, with more than 3% of new passenger car sales in 2014 (Center
for Sustainable Energy 2015). A little more than half of the 40,000 PEV registrations in 2014 were
BEVs, which put the total stock of BEVs in California at 90,000 (Center for Sustainable Energy 2015).
The EV passenger car market share for the US as a whole was about 1.3% in 2013, up by 70% from 2012
levels. The Californian market for EVs was even more dynamic, recording an 85% increase between
2012 and 2013. California started a subsidy program in the early 2000s to foster the adoption of EVs
with a focus on demand, through reducing the purchase price of EVs. Additional measures have been
enacted which can also contribute to the success of EVs on this market. On the user side, the free access
to dedicated lanes (i.e. high-occupancy vehicle lanes) for BEVs and PHEVs is a significant incentive to
users in California, particularly in the Los Angeles and San Francisco metropolitan areas, where high
congestion rates are registered. On the supply side, the Zero Emission Mandate (ZEV) requires manu-
facturers that sell on the Californian market to produce and sell a predetermined share of EVs.
A more complete picture of the new light-duty vehicle market in France would include an overview of the light commercial vehicle (LCV) segment, which consists of vans up to 3.5 tons. LCVs are an ever-more important element of urban freight transport, both for goods delivery and for the provision of a wide range of critical services (Browne et al. 2010), especially in European city centers where there are increasing access restrictions for trucks (such as the lorry ban in London and the old diesel-vehicle ban in Paris). In this context, electric vans and new format vehicles for urban freight transport (electrically-assisted cargo tricycles, minivans, etc.) represent a new market with high potential sales in the European countries. New models of battery-electric vans have thus been released by major manufacturers, namely Nissan and Peugeot, while Mercedes and Renault offer an electric version of existing models. Moreover other (limited) options exist for hybrid vehicles. However, in 2012 just over 0.5% of the newly-registered vans in Europe (1.1 million) were pure electric vehicles (EEA 2014).
3.3 PEV Sales in France
Passenger car registrations in France show an upward trend in BEV and PHEV sales over the period 2011-2014, although these categories only represented, respectively, 0.6% and 0.1% of total new passenger car registrations in France in 20145 (CCFA 2014, AVERE 2015, AVEM 2015). It is worth noticing, yet, that EV sales have remained on an upward trend in spite of the low performance of the automotive sector, which has experienced a slow recovery after the economic crisis of 2008. 5 In France, the number of light-duty vehicles is about 37 million, with 2 million new units sold every year (cars and vans) (CCFA 2013).
15
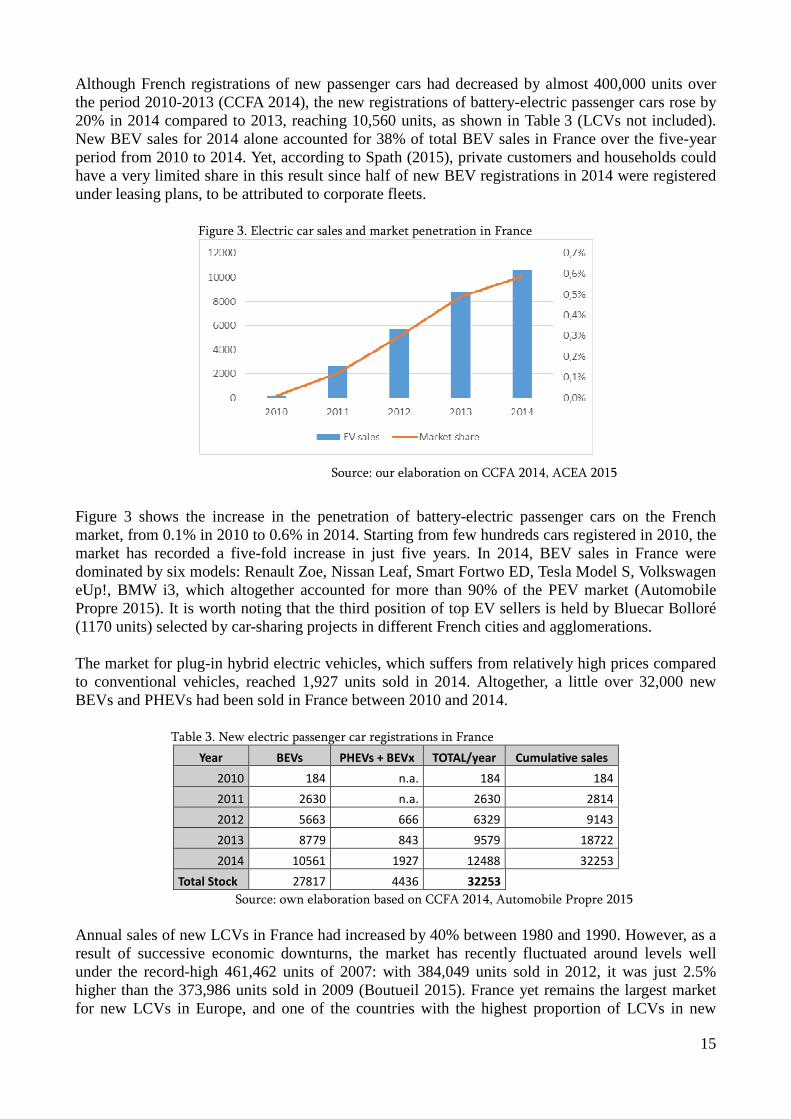
Although French registrations of new passenger cars had decreased by almost 400,000 units over the period 2010-2013 (CCFA 2014), the new registrations of battery-electric passenger cars rose by 20% in 2014 compared to 2013, reaching 10,560 units, as shown in Table 3 (LCVs not included). New BEV sales for 2014 alone accounted for 38% of total BEV sales in France over the five-year period from 2010 to 2014. Yet, according to Spath (2015), private customers and households could have a very limited share in this result since half of new BEV registrations in 2014 were registered under leasing plans, to be attributed to corporate fleets.
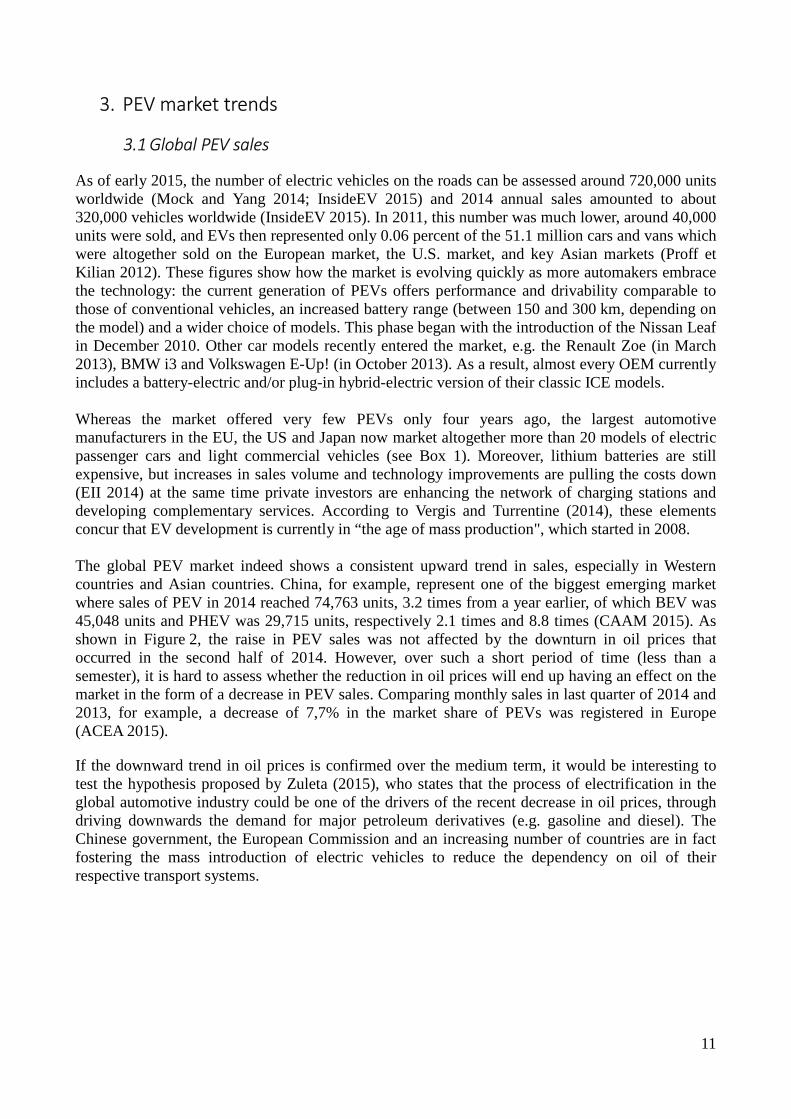
Figure 3. Electric car sales and market penetration in France
Source: our elaboration on CCFA 2014, ACEA 2015
Figure 3 shows the increase in the penetration of battery-electric passenger cars on the French market, from 0.1% in 2010 to 0.6% in 2014. Starting from few hundreds cars registered in 2010, the market has recorded a five-fold increase in just five years. In 2014, BEV sales in France were dominated by six models: Renault Zoe, Nissan Leaf, Smart Fortwo ED, Tesla Model S, Volkswagen eUp!, BMW i3, which altogether accounted for more than 90% of the PEV market (Automobile Propre 2015). It is worth noting that the third position of top EV sellers is held by Bluecar Bolloré (1170 units) selected by car-sharing projects in different French cities and agglomerations. The market for plug-in hybrid electric vehicles, which suffers from relatively high prices compared to conventional vehicles, reached 1,927 units sold in 2014. Altogether, a little over 32,000 new BEVs and PHEVs had been sold in France between 2010 and 2014. Table 3. New electric passenger car registrations in France
Year BEVs PHEVs + BEVx TOTAL/year Cumulative sales
2010 184 n.a. 184 184
2011 2630 n.a. 2630 2814
2012 5663 666 6329 9143
2013 8779 843 9579 18722
2014 10561 1927 12488 32253
Total Stock 27817 4436 32253 Source: own elaboration based on CCFA 2014, Automobile Propre 2015
Annual sales of new LCVs in France had increased by 40% between 1980 and 1990. However, as a result of successive economic downturns, the market has recently fluctuated around levels well under the record-high 461,462 units of 2007: with 384,049 units sold in 2012, it was just 2.5% higher than the 373,986 units sold in 2009 (Boutueil 2015). France yet remains the largest market for new LCVs in Europe, and one of the countries with the highest proportion of LCVs in new
16
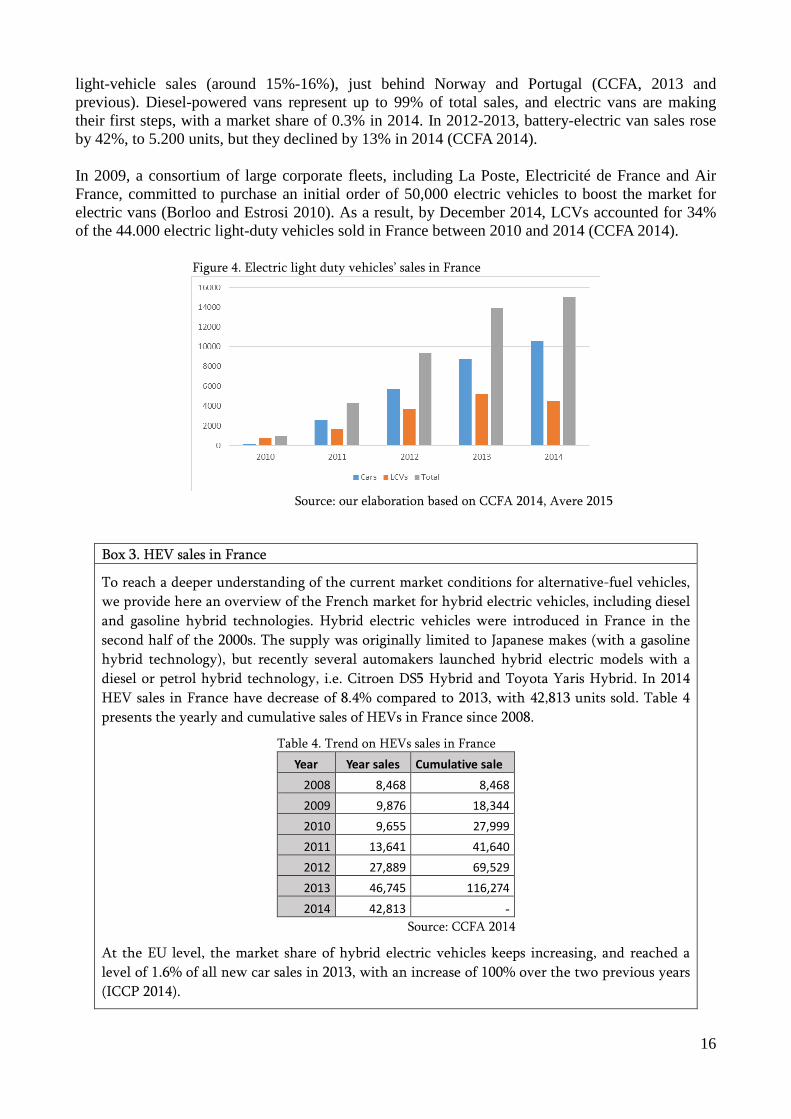
light-vehicle sales (around 15%-16%), just behind Norway and Portugal (CCFA, 2013 and previous). Diesel-powered vans represent up to 99% of total sales, and electric vans are making their first steps, with a market share of 0.3% in 2014. In 2012-2013, battery-electric van sales rose by 42%, to 5.200 units, but they declined by 13% in 2014 (CCFA 2014). In 2009, a consortium of large corporate fleets, including La Poste, Electricité de France and Air France, committed to purchase an initial order of 50,000 electric vehicles to boost the market for electric vans (Borloo and Estrosi 2010). As a result, by December 2014, LCVs accounted for 34% of the 44.000 electric light-duty vehicles sold in France between 2010 and 2014 (CCFA 2014).
Figure 4. Electric light duty vehicles’ sales in France
Source: our elaboration based on CCFA 2014, Avere 2015
Box 3. HEV sales in France
To reach a deeper understanding of the current market conditions for alternative-fuel vehicles,
we provide here an overview of the French market for hybrid electric vehicles, including diesel
and gasoline hybrid technologies. Hybrid electric vehicles were introduced in France in the
second half of the 2000s. The supply was originally limited to Japanese makes (with a gasoline
hybrid technology), but recently several automakers launched hybrid electric models with a
diesel or petrol hybrid technology, i.e. Citroen DS5 Hybrid and Toyota Yaris Hybrid. In 2014
HEV sales in France have decrease of 8.4% compared to 2013, with 42,813 units sold. Table 4
presents the yearly and cumulative sales of HEVs in France since 2008.
Table 4. Trend on HEVs sales in France
Year Year sales Cumulative sale
2008 8,468 8,468
2009 9,876 18,344
2010 9,655 27,999
2011 13,641 41,640
2012 27,889 69,529
2013 46,745 116,274
2014 42,813 - Source: CCFA 2014
At the EU level, the market share of hybrid electric vehicles keeps increasing, and reached a
level of 1.6% of all new car sales in 2013, with an increase of 100% over the two previous years
(ICCP 2014).
17
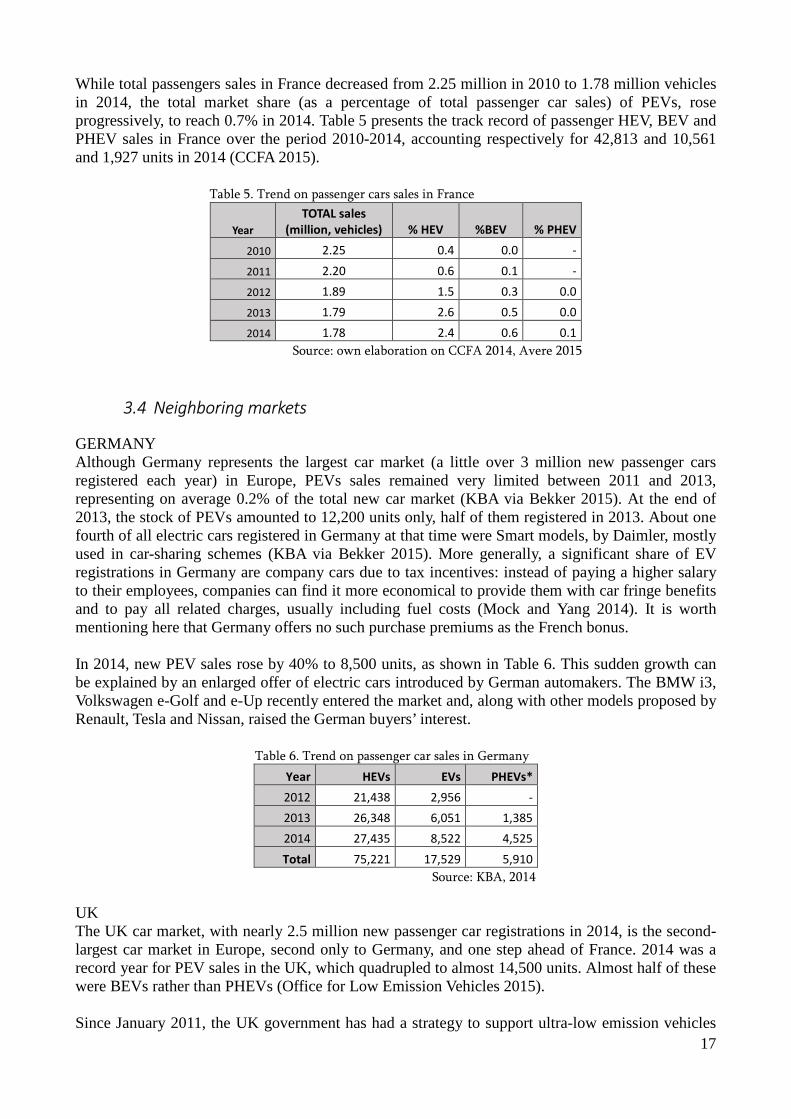
While total passengers sales in France decreased from 2.25 million in 2010 to 1.78 million vehicles in 2014, the total market share (as a percentage of total passenger car sales) of PEVs, rose progressively, to reach 0.7% in 2014. Table 5 presents the track record of passenger HEV, BEV and PHEV sales in France over the period 2010-2014, accounting respectively for 42,813 and 10,561 and 1,927 units in 2014 (CCFA 2015).
Table 5. Trend on passenger cars sales in France
Year
TOTAL sales
(million, vehicles) % HEV %BEV % PHEV
2010 2.25 0.4 0.0 -
2011 2.20 0.6 0.1 -
2012 1.89 1.5 0.3 0.0
2013 1.79 2.6 0.5 0.0
2014 1.78 2.4 0.6 0.1
Source: own elaboration on CCFA 2014, Avere 2015
3.4 Neighboring markets
GERMANY Although Germany represents the largest car market (a little over 3 million new passenger cars registered each year) in Europe, PEVs sales remained very limited between 2011 and 2013, representing on average 0.2% of the total new car market (KBA via Bekker 2015). At the end of 2013, the stock of PEVs amounted to 12,200 units only, half of them registered in 2013. About one fourth of all electric cars registered in Germany at that time were Smart models, by Daimler, mostly used in car-sharing schemes (KBA via Bekker 2015). More generally, a significant share of EV registrations in Germany are company cars due to tax incentives: instead of paying a higher salary to their employees, companies can find it more economical to provide them with car fringe benefits and to pay all related charges, usually including fuel costs (Mock and Yang 2014). It is worth mentioning here that Germany offers no such purchase premiums as the French bonus. In 2014, new PEV sales rose by 40% to 8,500 units, as shown in Table 6. This sudden growth can be explained by an enlarged offer of electric cars introduced by German automakers. The BMW i3, Volkswagen e-Golf and e-Up recently entered the market and, along with other models proposed by Renault, Tesla and Nissan, raised the German buyers’ interest. Table 6. Trend on passenger car sales in Germany
Year HEVs EVs PHEVs*
2012 21,438 2,956 -
2013 26,348 6,051 1,385
2014 27,435 8,522 4,525
Total 75,221 17,529 5,910
Source: KBA, 2014
UK The UK car market, with nearly 2.5 million new passenger car registrations in 2014, is the second-largest car market in Europe, second only to Germany, and one step ahead of France. 2014 was a record year for PEV sales in the UK, which quadrupled to almost 14,500 units. Almost half of these were BEVs rather than PHEVs (Office for Low Emission Vehicles 2015). Since January 2011, the UK government has had a strategy to support ultra-low emission vehicles

18
(ULEVs) by offering £5,000 purchase premiums for new plug-in electric vehicles. In February 2015, the UK Ministry of Transport announced the renewal of the subsidy scheme, providing for 50,000 additional grants during the period 2015-2017 and a budget of £43 million for infrastructure and research and development on plug-in vehicles (Office for Low Emission Vehicles 2015). ITALY Italy represents the fourth European market for private car registrations, with 1.36 million vehicles registered in 2014 (UNRAE 2015). The ICE technology dominates the new vehicle registrations, but, the market for clean fuel vehicles is already significant: indeed, vehicles propelled by liquefied petroleum gas (LPG) and natural gas (NG) represented respectively 9% of and 5,3% of total new car registrations in 2014. Yet, the market for electric vehicles has developed slowly over time: only 1,473 PEVs were registered in 2014, as compared with 1,174 in 2013 (ACEA 2015).
19
4. Market forecasts and potential market projections
4.1 Available market forecasts
Predictions for the short and long-term growth of electric vehicles have varied widely. We report here on selected studies, for both European and French scenarios, in order to describe the range of potential growth. Most experts and scholars assume a realistic EU market share for new PEVs to be in the range of 2 to 8% by 2020. Yet, policymakers and stakeholders set even more ambitious targets, planning PEV market shares up to 10%, in order to decarbonize transport systems and reduce their dependency on imported oil. This is the case of France, where the aspirational targets are: 2 million PEVs nationwide by 2020, including 400,000 in the Greater Paris region (Borloo and Estrosi 2010; Région Ile-de-France 2015). On a global level, the International Energy Agency (IEA 2013) considers that electric technology will progressively replace the petroleum-fueled ICE on the light-duty vehicle market and that, in a global scenario, 20 million PEVs could be on the roads by 2020, thereby representing 2% of the worldwide stock of cars and light commercial vehicles. In Europe, the IEA’s expected market share for PEVs on the light-duty vehicle market would result in 450,000 to 1,500,000 new registrations of plug-in electric vehicles by 2020 to 2025. According to Proff and Kilian (2012), in 2020, the European Union (EU-27) will have reached a total amount of 14.8 million new light-duty vehicle registrations (including passenger cars and light commercial vehicles). Key European markets such as Germany, France, the United Kingdom, Spain and Italy will present lower registrations, which will be compensated by increasing sales in Eastern Europe. Altogether, the market share for PEVs could reach 7 percent of the new light-duty vehicle market. More precisely, the study indicates that registrations of PEVs in the EU could include approximately 5% PHEVs, 1% BEVx and about 1% BEVs. Currently, French registrations of new electric vehicles are still below the initial expectations of stakeholders. BEVs have indeed become progressively more popular, but at a slow pace. However, all experts who have been interviewed in this study, believe that there is “no going back” in the transitioning process to electric mobility. Crucial questions now concern the development of the market share of PEVs in the near-term future and the selection of most effective initiatives to be supported in order to spread an environmentally sustainable and affordable mode of transport in the long term (cf. The White Paper on Evaluation of State-level US. Electric vehicle incentives, Jin et al. 2014).
4.2 Potential market projections
As already mentioned, the demand for PEVs may be influenced in the near-term future by a wide range of variables, such as, for example, the relative price increases/decreases for new vehicles, the relative prices of oil and electricity, new developments in battery prices and autonomy, changes in customer acceptance, or changes in the supply of recharge infrastructure. Forecasting the future developments in PEVs’ market size and relative market penetration in relation to the deployment of fast-charging infrastructure, requires further analyses, which we will provide in the second part of the research planned under Task 4.1. Nevertheless we consider useful, at this stage, to provide basic projections assuming pre-determined average annual growth rates. These projections are not to be understood as future scenarios of our elaboration, but rather as reference patterns to compare future developments in the PEV market (see Box 4).
20
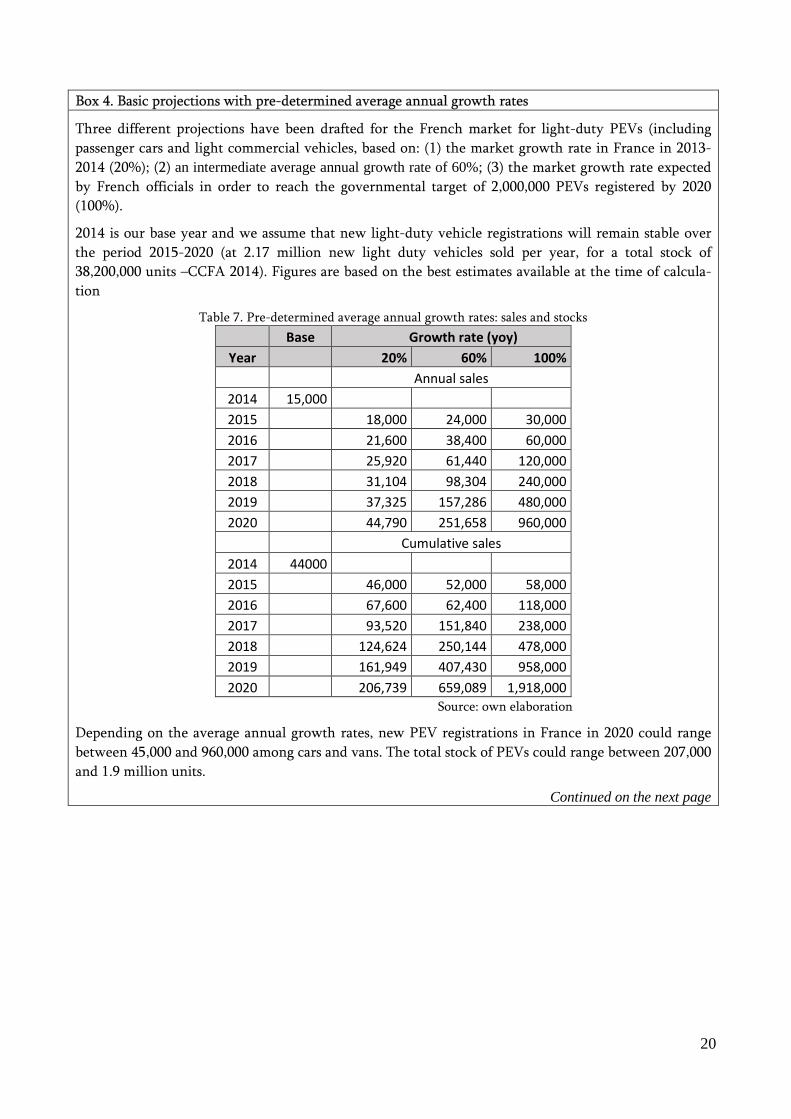
Box 4. Basic projections with pre-determined average annual growth rates
Three different projections have been drafted for the French market for light-duty PEVs (including
passenger cars and light commercial vehicles, based on: (1) the market growth rate in France in 2013-
2014 (20%); (2) an intermediate average annual growth rate of 60%; (3) the market growth rate expected
by French officials in order to reach the governmental target of 2,000,000 PEVs registered by 2020
(100%).
2014 is our base year and we assume that new light-duty vehicle registrations will remain stable over
the period 2015-2020 (at 2.17 million new light duty vehicles sold per year, for a total stock of
38,200,000 units –CCFA 2014). Figures are based on the best estimates available at the time of calcula-
tion
Table 7. Pre-determined average annual growth rates: sales and stocks
Base Growth rate (yoy)
Year
20% 60% 100%
Annual sales
2014 15,000
2015
18,000 24,000 30,000
2016
21,600 38,400 60,000
2017
25,920 61,440 120,000
2018
31,104 98,304 240,000
2019
37,325 157,286 480,000
2020
44,790 251,658 960,000
Cumulative sales
2014 44000
2015
46,000 52,000 58,000
2016
67,600 62,400 118,000
2017
93,520 151,840 238,000
2018
124,624 250,144 478,000
2019
161,949 407,430 958,000
2020
206,739 659,089 1,918,000
Source: own elaboration
Depending on the average annual growth rates, new PEV registrations in France in 2020 could range
between 45,000 and 960,000 among cars and vans. The total stock of PEVs could range between 207,000
and 1.9 million units.
Continued on the next page
21
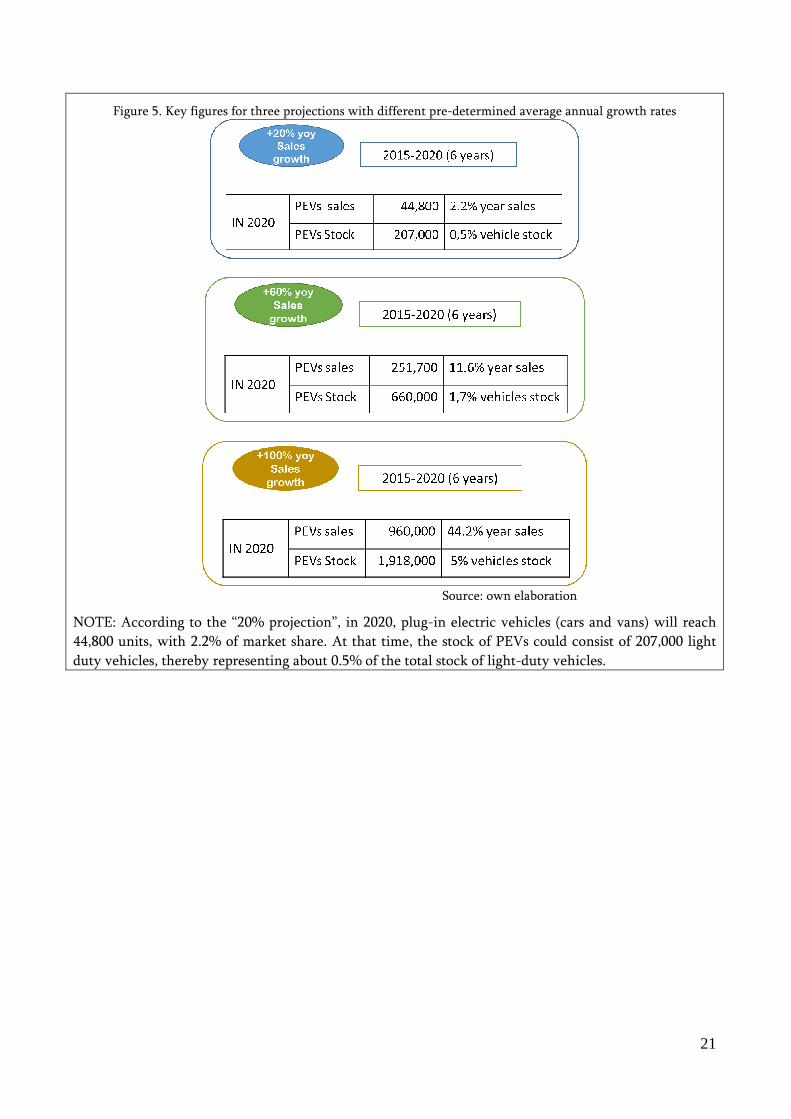
Figure 5. Key figures for three projections with different pre-determined average annual growth rates
Source: own elaboration
NOTE: According to the “20% projection”, in 2020, plug-in electric vehicles (cars and vans) will reach
44,800 units, with 2.2% of market share. At that time, the stock of PEVs could consist of 207,000 light
duty vehicles, thereby representing about 0.5% of the total stock of light-duty vehicles.
22
5. Identifying key drivers of the short-term market development
5.1 Insights from the literature
Previous research on French PEV market development for private cars has mostly focused on marketing studies and econometric approaches to capture consumer preferences. In particular, the demand for PEVs from private households, the core business for automakers, has been thoroughly investigated during the last decade in France, as well as the related subsidy policies. By modeling purchasing decisions, total costs of ownership (TCO) and vehicle use patterns, different scenarios have been drafted to evaluate economic barriers and French subsidy programs for EVs (Leurent and Windisch 2013; Mock and Yang 2014). Various forecasts on the development of cost parameters, technological developments and electric vehicle acceptance have been elaborated for France (von Pechmann 2014; MEEDDAT 2010) and various policy scenarios have been tested in order to derive a set of financial policy measures that would allow the development of electric mobility with French households (Windisch 2013). More recently, the outlooks for a large-scale uptake of electric vehicles by French corporate fleets have been discussed based on the existing policies targeting the corporate market (Boutueil 2015).
On the other hand, only limited investigation has been carried out about the potential impact of the charging infrastructure on the demand for electric vehicles in France.
In the US context, the provision of adequate recharge availability as one means to promote the BEV/PHEV market has been investigated by Lin and Greene (2011) among others. According to their results, improved charging availability allows PHEV owners to reduce fuel costs and BEV shoppers to perceive less range anxiety, and therefore can affect the consumer acceptance of PEVs. However, without significant technology improvements or policy changes, increase in charging availability alone is unlikely to result in substantially higher PEV penetration.
Non-cost barriers, such as range and recharging infrastructure in the US context, have been addressed by Barter et al. (2015) who suggest that mitigating the non-cost barriers can have significant influence on BEV adoption. Technology solutions to extend the BEV range, alleviate range anxiety, and also avoid concerns over public recharging availability, are needed. Nevertheless, even when a new BEV purchase replaces a conventional gasoline vehicle, longer trips beyond the recharging network will most likely be done with a conventional vehicle substitute.
Various studies provide useful insights intended for policy planning purposes. For instance, the National Research Council (NRC 2013) points out that the high costs of installing public charging stations, combined with the little revenue obtained from providing electricity, present challenges for developing sustainable business models. In the near term, the deployment of publicly accessible charging infrastructure can be achieved by public-private partnerships or other forms of continued government support.
Analytical and computational tools modeling a wide variety of policy and macroeconomic scenarios have been developed to assess the potential demand for PEVs. Market forecasts for electric vehicle sales are complicated for different reasons. One reason stems from the fact that there are only limited historical sales data series (since year 2011). Another reason stems from the fact that consumer acceptance of these technologies implies wide changes in consumer behavior, including a shift away from fueling at a gasoline station toward plugging in their personal vehicle (Al-Alawi and Bradley, 2012). More generally, the PEV development rate depends on many factors, such as market trends (i.e. electricity and oil prices), the market offer of electric vehicles, public subsidies, all measures promoting info- and infrastructure, etc. (Sadeghian et al., 2013), which makes it all the more arduous to grasp the separate and cumulated influence of each of them.
23
Box 5. Overview of consumer choice models
In the last 30 years, scholars have applied constraints analysis to the demand for electric vehicles, se-
lecting different sets of variables that could prevent or foster the adoption of this technology. In the
US, for example, Nesbitt et al. (1992) have been among the pioneers providing a constraint analysis that
takes recharge infrastructure issues into account, based on information on vehicle usage patterns and
household infrastructure included in the 1985 American Housing Survey.
Among the various studies on market forecasting for France, we hereafter introduce the models pro-
posed by Windisch (2013) and von Pechmann (2014), respectively an agent-based (consumer agent)
model and constraint analysis model. Both studies are based on the French household travel survey,
ENTD (Enquête Nationale Transports Déplacements 2007-2008), which is based on a sample of 20,000
French households.
Windisch focuses on public policy measures supporting the demand-side of the electric vehicle market
and assesses how the measures that are implemented will stimulate the demand for electric vehicles. In
order to account for changing cost parameters, advancing technologies and evolutions in consumer atti-
tudes over time, the study introduces various scenarios. The impact of diverse policy packages is tested
in order to derive a set of financial policy measures that would allow maintaining the identified electric
vehicle potential within certain thresholds until 2023. For estimating the actual vehicle demand,
Windisch adopts a consumer agent model, taking into account consumers’ demographics and prefer-
ences in France. Gender, age, income, location, social network, lifestyle, daily driving needs, transporta-
tion budget, ownership period, and preferences as to vehicle class, fuel type, safety, reliability, power-
train types, and performance are included in the assessment. In the study, the author underlines the
sensitivity of results to the purchase bonus. Regional differences identified are remarkable: whereas
households in predominantly rural areas appear to be much better adapted to electric vehicle uptake
than households in dense urban areas, the latter will be able to more easily generate a financial ad-
vantage from an electric vehicle purchase. Especially preferential parking policies and tariffs for electric
vehicle users will make such cost advantages possible. In case the purchase bonus does not drop under-
neath EUR 4,000, the potential cumulative electric vehicle sales to private households under the base-
line scenario are assessed at 3.9 million vehicles up until 2023. However, for this number to actually
materialize, all identified households with electric vehicle-compatible potential being in a vehicle pur-
chase decision have to decide for an electric vehicle.
Von Pechmann proposes the model USIDEV (User-centric SImulation for the Deployment of EV). The
model provides a tool to estimate and characterize the electric vehicle market, by quantifying the im-
pact of potential development actions. The potential for PEV is explored by applying different degrees
of difficulties to a set of variables that represent restrictions or incentives to the adoption of electric
vehicles. Results show the necessity to support the deployment of electric vehicles, in particular
through value-adding actions, and reveal the importance of a geographically differentiated deployment.
Since both studies strongly highlight the relevance of regional and local parameters on the process of
PEV adoption, we are currently evaluating the opportunity to conduct a regional case study, based on
regional travel surveys, which provide more detailed and recent information about territory peculiari-
ties. It is the case of the region of Strasbourg where a household survey on travel behavior (EMD
Enquête Ménages Déplacements) was conducted in 2009 for the region of Bas-Rhin, and of the region
of Paris where the last regional household travel survey (EGT Enquête Globale Transport) was conduct-
ed in 2010.
24
5.2 Three main barriers to the uptake of PEVs
Based on our review of scientific literature and sector press, and on our interviews with experts of the EV market, three key factors emerge as the most prevalent barriers to the early market for electric vehicles. These factors are also those identified by the EU Directive on the deployment of alternative fuels infrastructure (2014). To put it a nutshell, the full-scale deployment of electric vehicles has been held back by three main barriers:
1. the high retail prices of vehicles; 2. the low level of consumer acceptance; 3. the lack of infrastructure for recharging.
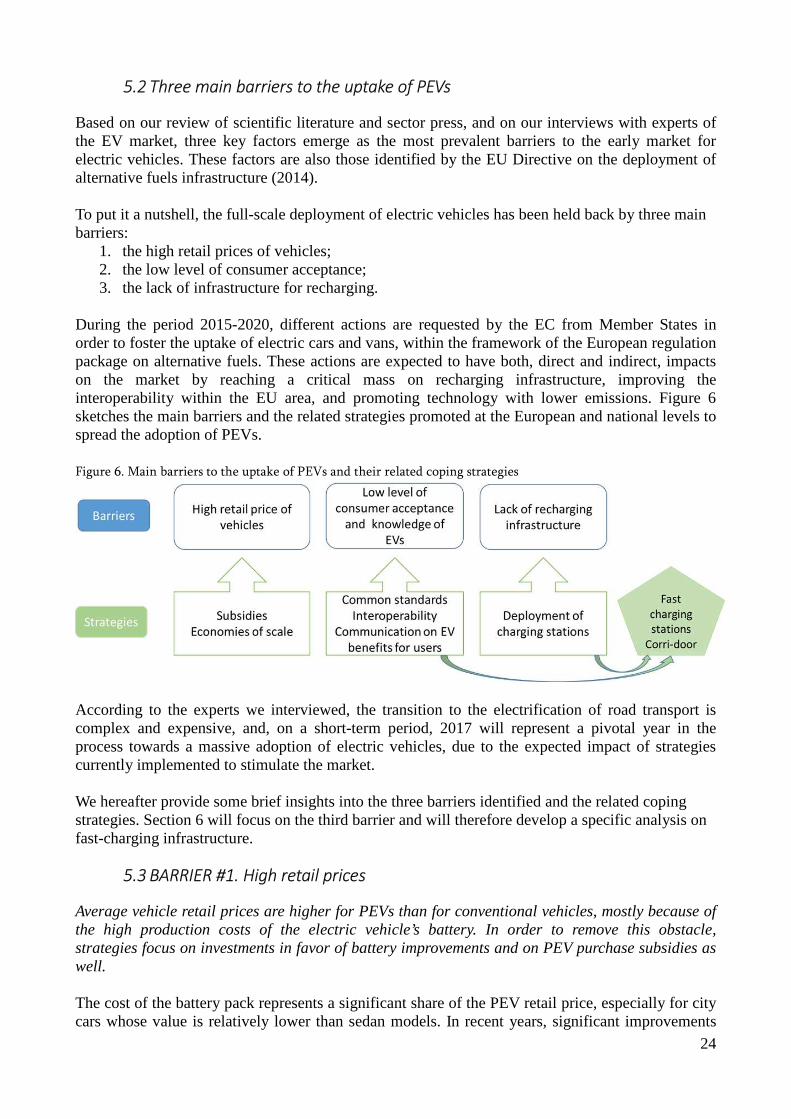
During the period 2015-2020, different actions are requested by the EC from Member States in order to foster the uptake of electric cars and vans, within the framework of the European regulation package on alternative fuels. These actions are expected to have both, direct and indirect, impacts on the market by reaching a critical mass on recharging infrastructure, improving the interoperability within the EU area, and promoting technology with lower emissions. Figure 6 sketches the main barriers and the related strategies promoted at the European and national levels to spread the adoption of PEVs. Figure 6. Main barriers to the uptake of PEVs and their related coping strategies
According to the experts we interviewed, the transition to the electrification of road transport is complex and expensive, and, on a short-term period, 2017 will represent a pivotal year in the process towards a massive adoption of electric vehicles, due to the expected impact of strategies currently implemented to stimulate the market. We hereafter provide some brief insights into the three barriers identified and the related coping strategies. Section 6 will focus on the third barrier and will therefore develop a specific analysis on fast-charging infrastructure.
5.3 BARRIER #1. High retail prices
Average vehicle retail prices are higher for PEVs than for conventional vehicles, mostly because of the high production costs of the electric vehicle’s battery. In order to remove this obstacle, strategies focus on investments in favor of battery improvements and on PEV purchase subsidies as well. The cost of the battery pack represents a significant share of the PEV retail price, especially for city cars whose value is relatively lower than sedan models. In recent years, significant improvements
25
have been achieved on battery performance by switching from nickel metal hydride batteries to lithium batteries. Although current battery technologies have now higher power densities, higher cycle life and greater safety than previous generations of battery chemistries, their cost remains high (EEI 2014). Automakers, battery producers and public institutions expect that increased sales volumes and technology improvements will significantly reduce the cost of batteries in the medium-term future (EII 2014). In the short term, PEV sales can be stimulated by incentives that reduce the retail price of PEV. In Europe, the countries with the highest market share of PEVs (such as Norway and the Netherlands) are the countries where governments and municipalities have set up relevant grant schemes with direct and/or indirect subsidies, or raised taxes on ICE vehicles. In France, for example, a one-time bonus helps to reduce the TCO of BEVs and, to a lesser extent, the TCO of PHEVs. Since January 2015, the French bonus on BEVs has been raised to 10,000 EUR, and the bonus on PHEVs has been raised to 6,500 EUR (when trading-in a diesel car first registered in 2000 or before). Free parking and free charging at public stations are additional measures that can directly contribute to reduce the costs of use of an electric car, as it is the case in Paris. Despite the large consensus shown by experts and scholars on placing cost competitiveness (whether in terms of TCO or purchase price) on top of all barriers to the large-scale uptake of electric vehicles, we noted that a survey conducted in California in 2014 by the Center for Sustainable Energy (2015) describes a different scenario. Almost 60% of PEV drivers claimed buses lane access as an extremely or very important motivator for vehicle purchase. Moreover the study reports that the primary motivations vary significantly among PEV owners of different models, ranging from environmental concerns to the search for fuel savings.
5.4 BARRIER #2. Low level of consumer acceptance
Of all the factors that may keep consumers from buying an EV, novelty appears to be a major obstacle. Although it is expected that a growing portion of car uses will be compatible with EVs following the diversification of EV and battery technologies, electric vehicle is still considered a novelty and people remain unfamiliar with it and therefore lack knowledge about the car’s capability and performance (Thiel et al. 2012). Moreover, scarce and non-standardized recharging infrastructure raises uncertainty among the potential buyers. This is especially true when considering cross-border trips, due to the fact that multiple plug designs and charging protocols exist throughout Europe. In order to remove this obstacle, automakers and service providers are improving user friendliness and the EU has called for standardization of electric vehicle charging systems, as reported by the EU Directive on the deployment of alternative fuels infrastructure (2014). It is the responsibility of public policymakers to provide an adequate legal framework under which the deployment of safe and harmonized charging systems for electric mobility at public and private premises can happen. All levels of jurisdiction, including European, national, regional and local governments, are involved in enabling, supporting and facilitating the electrification of road transport. Interoperability among the different charging networks, at both national and international scales, is thus requested and assured by a common standardization process, which encompasses not only the charging modes and plugs, but also procedures of identification and billing systems for electric vehicle drivers. In practice, the charging infrastructure implemented in Europe have to comply with: (a) two charging systems and plug designs –Type 2 and Combo 2–, which have been selected as the EU standard, (b) EU protocols that allow to identify the registered driver and to provide the charging service. Although in many countries it is still possible to charge the vehicle for free at
26
various publicly-accessible stations, both public and private, in the near-term future drivers will most likely be billed for the charging time and/or energy use. Ad hoc payment systems (using SMS or contactless card or payback payments) are thus implemented and new service providers take the floor.
5.5 BARRIER #3. Lack of charging infrastructure
Even if most private European drivers travel average daily distances below typical EV autonomy (Pasaoglu et al 2012), range is a major concern of the potential buyers of PEVs today (Thiel et al. 2012). A wider, more intensive coverage of charging infrastructure is thus needed on urban, suburban and highway roads in order to overcome this barrier. Even if daily driving distances of most private users are below the average 100-150 km range offered by the current offer of PEVs, infrastructure deployment is a fundamental element in the process of taking up electric mobility. The European institutions consider that the build-up of infrastructure is a necessary condition for a broad development of electric cars. The EU Directive on the deployment of alternative fuels infrastructure requires a minimum number of recharging points from each Member State, 10% of which should be publicly accessible (EU 2014). Initiatives to deploy conventional, semi-fast and fast chargers have been planned accordingly and, in some cases, already implemented by Member States. France has considered it is a necessity to build a publicly-accessible recharge infrastructure for the uptake of PEVs since 2010 (Nègre 2011). It ranks now among the countries with the highest number of charging stations in Europe. The French recharging infrastructure consists of multiple networks that were set up by utilities, private companies and local governments. Of the roughly 3,700 charging stations offering 10,000 public plugs about 2,000 are currently operated by Sodetrel, a subsidiary of the French utility EDF. On top of those, 300 QC and 600 DC plugs (7 kW) have been deployed by Nissan, 800 plugs are accessible at Renault dealerships, and 24 QC COMBO 2 are accessible at Volkswagen dealerships (Charge Map 2015, and OEMs original sources). Municipalities, local communities and regional governments have committed to supporting the installation of public charging infrastructure, and the French government estimates that 7 million publically accessible charge points will be installed by 2030, although doubts about the definition of a “charge point” exist. At national level, a network of 8,000 charging stations fitted with Type 2 sockets (16,000 in total) will be deployed by the French battery manufacturer Bolloré by 2018 (Les Echos, 8th December 2014). Paris alone has put over 2,000 electric vehicles and 4,700 charge points on the streets under its “Autolib” program, with free charge for PEV drivers (Autolib 2014). Other chargers have been installed by a number of large cities (e.g. Marseille, Strasbourg, Lyon) and some as part of individual pilot projects.
27
Box 6. The strategy of the European Commission
In 2011, the EC adopted the White Paper “Roadmap to a Single European Transport Area – Towards a
Competitive and Resource Efficient Transport System”, to redefine the EU’s transport system in order to
achieve a 60% reduction in CO2 emissions and comparable reduction in oil dependency. The main goals
of the European strategy are to:
° Reduce consumption of oil and decreases energy dependence from oil-producing countries.
(Decreasing oil imports will improve the balance of payments of countries with no oil production of
their own).
° Reduce GHG emissions according to the electricity generation mix.
° Improve air quality in cities and, as a consequence, public health of citizens.
° Increase the transport sector efficiency while the cost per kilometer of electric vehicles is
significantly lower than that of internal combustion engine vehicles.
Policy actions include promoting higher energy efficiency in transport and phasing out conventionally
fuelled cars from cities by 2050. Alternative-fuel vehicles, such as liquefied petroleum gas, natural gas
and biomethane, biofuels, hydrogen and electricity are thus identified as main contributors to the de-
carbonisation process.
As regards electric mobility, the White Paper highlights the need to develop “a sustainable alternative
fuels strategy including also the appropriate infrastructure” (Initiative 24) and issues “guidelines and
standards for recharging infrastructures” (Initiative 26) within the single European transport area.
These initiatives include different measures, partially funded through the Trans European Network
TEN-T Program (the Corri-door project is one of them). Here we list the most relevant initiatives with
regards to their potential impact on the short-term evolution of the market for electric vehicles:
- rules on the interoperability of charging infrastructure for clean vehicles;
- guidelines and standards for refueling infrastructures;
- demonstration projects for electro mobility (and other alternative fuels) including recharging
and refueling infrastructure and intelligent transport systems.
28
6. Focus on fast-charging infrastructure
The daily driving distance of a typical European driver ranges from an average of 40 km (UK) to an average of 80 km (Poland) in weekdays and it does not significantly increase over the weekends (Pasaoglu et al. 2012). Such distances can be comfortably covered by PEVs that are currently available on the market, which allow on average 100 to 150 km drive on a single charge, depending on the model and driving conditions. Despite the fact that existing technology is technically sufficient for the daily needs of most European drivers, it cannot satisfy their occasional, but probably important, needs for long-distance travel. Together with a good network of conventional and semi-fast charging points, fast-charging infrastructure (level III, direct current (DC) or alternate current (AC) charge) thus result to be a priority for the uptake of PEVs. For fast charging, three connector standards are currently in use in Europe:
- Two for DC charging (also known as Mode 4 charging): o the CHAdeMO plug, originally developed in Japan but which has been included in
the European standard for mode 4. o the “Combo” plug (also known as CCS), promoted initially by the German OEMs,
and also included in the European standard for mode 4. - One for the fast AC charging: the Type 2 plug (with cable attached)
The European directive on infrastructure states that all DC fast-charging stations should be equipped with at least a Combo Connector, and all AC fast-charging stations should be equipped with at least a Type 2 connector. In addition, a fourth connector for fast-charging exists, based on a proprietary interface (not standardized): the Tesla Supercharger. Depending on the battery pack (usually around 24 kWh) and the actual electricity flow provided by the charging station (usually around 43 to 50 kW power output), lithium-ion batteries can be charged up to 80 % in 20-30 minutes.
6.1 Main fast-charging networks in Europe
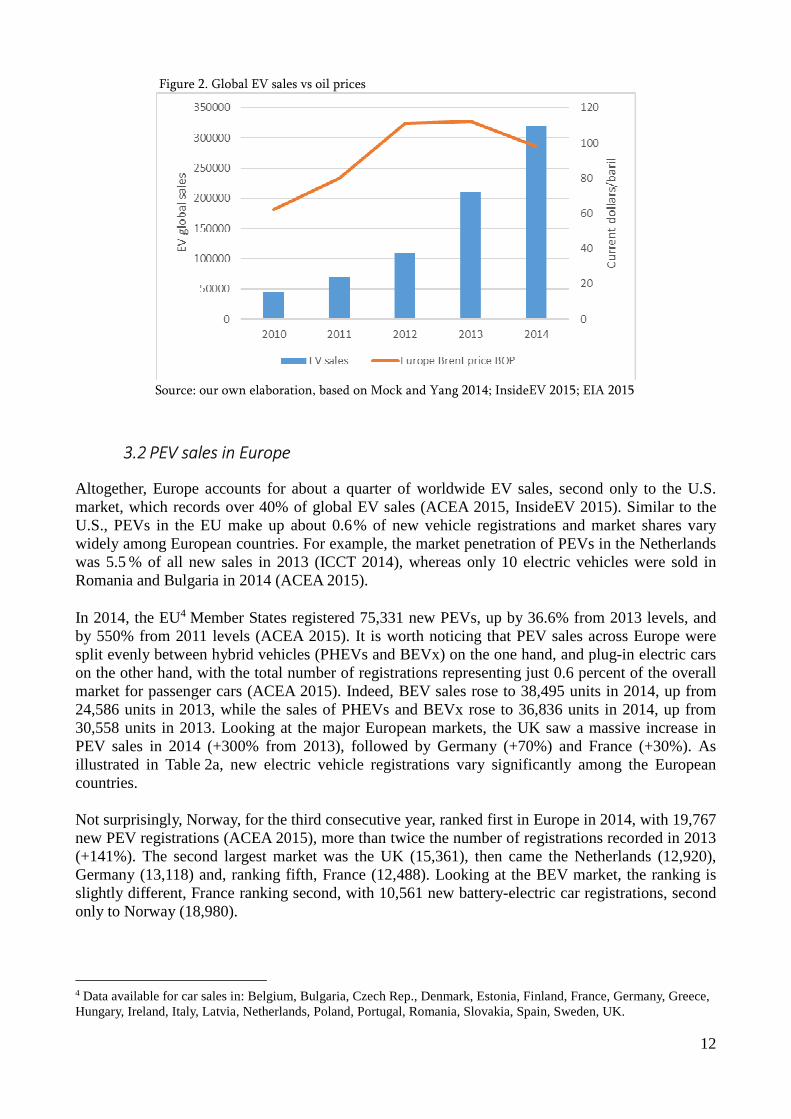
Over the last five years, private and public actors from different European countries have independently invested in fast-charging infrastructure, thereby building a composite fast-charging grid at the European level, as shown in Figure 5. Estonia was one of the first countries offering a network of fast chargers, with 100 fast-charging stations deployed in the cities and 65 by the main roads (ELMO 2014). Among the projects co-funded by the European Commission, under the EU Trans-European Transport Network (TEN-T) Programme, 46 fast-charging stations were deployed on highways in the Republic of Ireland and Northern Ireland (ESB 2013). The Rapid Charge Network (RCN) project, which is the follow up of the ESB project, will implement 74 fast-charging stations in the United Kingdom. In France, the project “Energy Corridor Alsace” provided 6 charging stations, as part of a wider cross-border project with Germany, CROME, which proved that vehicles may travel across the border and recharge in both countries (EDF 2012). More recently, different multi-country projects have been set up, with the support of INEA (2014), to foster the deployment of cross-border charging infrastructure and ensure interoperability. The Central European Green Corridors project for electric vehicles, should deploy 115 fast chargers in Austria (60), Slovakia (21), Slovenia (26), Germany (5) and Croatia (3), by the end of 2015. In Northern Europe, the European Long-distance Electric Clean Transport Road Infrastructure

29
Corridor (ELECTRIC) has been funded to create an open-access fast-charging corridor along major motorways. Altogether, 155 fast chargers for electric vehicles should be installed by the end of 2015 along the main highways connecting Sweden (35), Denmark (23), Germany (65) and the Netherlands (30). Figure 7. Fast-charging infrastructure in Europe
Source: Renault 2015, internal document
6.2 Range anxiety and average distance between fast chargers
A more granular deployment of fast-charging stations makes drivers feel more confident about getting where they want (ZERO, 2012). More precisely, fast-charging has been identified as a main solution to reduce range anxiety, as evidenced by the study carried out in Japan in 2007 by the Tokyo Electric Power Company (TEPCO) (cited in Botsford ans Szczepanek, 2009). After the installation of fast-charging stations in the selected area, more PEV drivers were circulating and they were returning their vehicles at a battery state of charge lower than before. Fast chargers stir up a large and effective psychological effect (Botsford ans Szczepanek, 2009), that appears to be crucial in the early stages of PEV adoption (Bakker, 2011).
planne
in
Por
Lis-
Lon-
Man-
Pi
Flo-
Du-
Mila Bo-
Rimini
Lau-
Ge-
Zu-
Bir-
Bel-
Brus-
Antwer-
Rotter-
Amster-
Tal-
Mu-
Brati- Ljubl-
Salz- Vien
Mo-
Pa-
Lil
Bor-
Mar-
Tou-
Le
Ly
Osl
Par
Ber-
Gothen-
Mal
Ham-
30
Given the absence of specific guidelines from the European Commission on the relevant frequency of fast-charging stations along the highways, we refer to the recommendations drafted by ZERO (2012), which states that “chargers would probably have to be available every 40-60 km for maximum effect”. Such a close-knit grid of fast chargers would make electric vehicles capable of covering an even larger portion of people’s transportation needs.
6.3 French fast-charging infrastructure
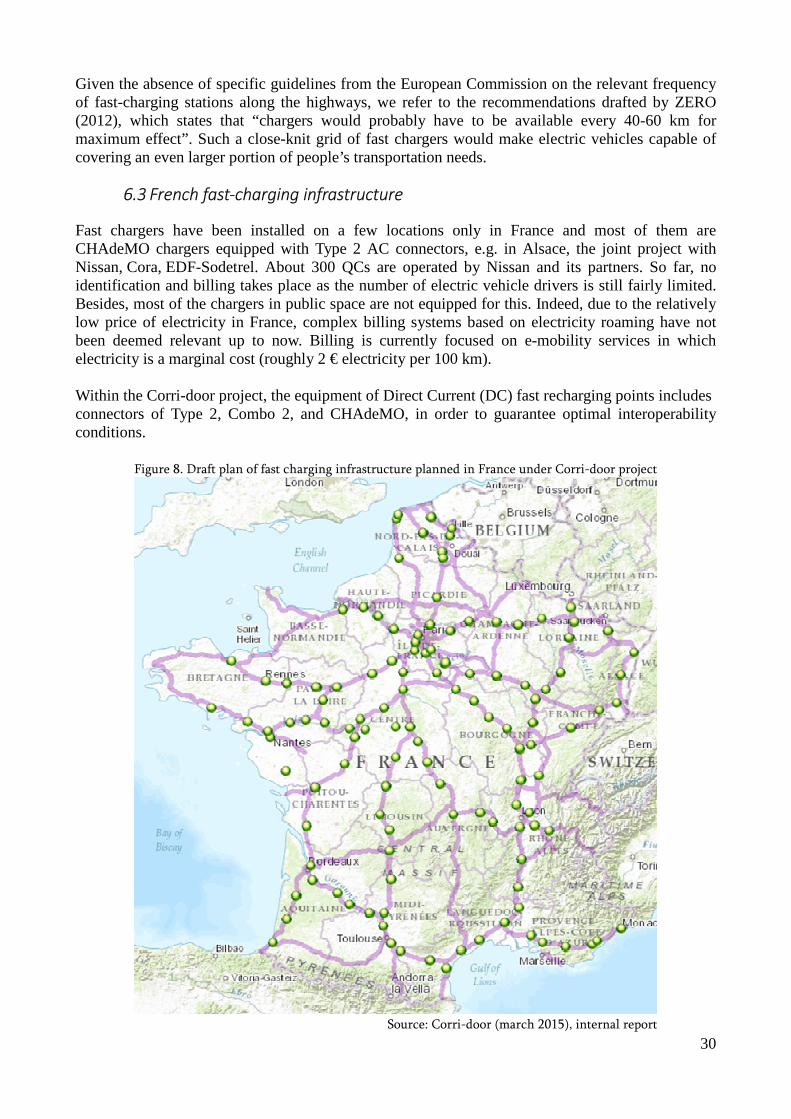
Fast chargers have been installed on a few locations only in France and most of them are CHAdeMO chargers equipped with Type 2 AC connectors, e.g. in Alsace, the joint project with Nissan, Cora, EDF-Sodetrel. About 300 QCs are operated by Nissan and its partners. So far, no identification and billing takes place as the number of electric vehicle drivers is still fairly limited. Besides, most of the chargers in public space are not equipped for this. Indeed, due to the relatively low price of electricity in France, complex billing systems based on electricity roaming have not been deemed relevant up to now. Billing is currently focused on e-mobility services in which electricity is a marginal cost (roughly 2 € electricity per 100 km). Within the Corri-door project, the equipment of Direct Current (DC) fast recharging points includes connectors of Type 2, Combo 2, and CHAdeMO, in order to guarantee optimal interoperability conditions.
Figure 8. Draft plan of fast charging infrastructure planned in France under Corri-door project
Source: Corri-door (march 2015), internal report
31
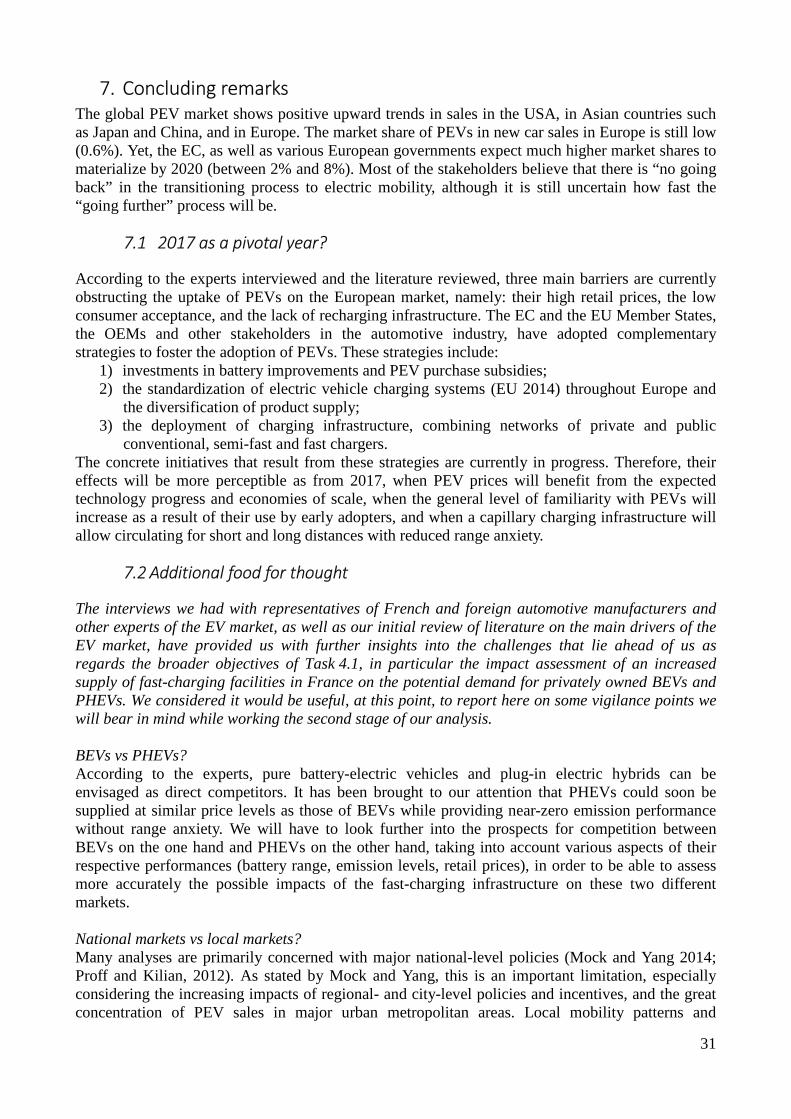
7. Concluding remarks
The global PEV market shows positive upward trends in sales in the USA, in Asian countries such as Japan and China, and in Europe. The market share of PEVs in new car sales in Europe is still low (0.6%). Yet, the EC, as well as various European governments expect much higher market shares to materialize by 2020 (between 2% and 8%). Most of the stakeholders believe that there is “no going back” in the transitioning process to electric mobility, although it is still uncertain how fast the “going further” process will be.
7.1 2017 as a pivotal year?
According to the experts interviewed and the literature reviewed, three main barriers are currently obstructing the uptake of PEVs on the European market, namely: their high retail prices, the low consumer acceptance, and the lack of recharging infrastructure. The EC and the EU Member States, the OEMs and other stakeholders in the automotive industry, have adopted complementary strategies to foster the adoption of PEVs. These strategies include:
1) investments in battery improvements and PEV purchase subsidies; 2) the standardization of electric vehicle charging systems (EU 2014) throughout Europe and
the diversification of product supply; 3) the deployment of charging infrastructure, combining networks of private and public
conventional, semi-fast and fast chargers. The concrete initiatives that result from these strategies are currently in progress. Therefore, their effects will be more perceptible as from 2017, when PEV prices will benefit from the expected technology progress and economies of scale, when the general level of familiarity with PEVs will increase as a result of their use by early adopters, and when a capillary charging infrastructure will allow circulating for short and long distances with reduced range anxiety.
7.2 Additional food for thought
The interviews we had with representatives of French and foreign automotive manufacturers and other experts of the EV market, as well as our initial review of literature on the main drivers of the EV market, have provided us with further insights into the challenges that lie ahead of us as regards the broader objectives of Task 4.1, in particular the impact assessment of an increased supply of fast-charging facilities in France on the potential demand for privately owned BEVs and PHEVs. We considered it would be useful, at this point, to report here on some vigilance points we will bear in mind while working the second stage of our analysis. BEVs vs PHEVs? According to the experts, pure battery-electric vehicles and plug-in electric hybrids can be envisaged as direct competitors. It has been brought to our attention that PHEVs could soon be supplied at similar price levels as those of BEVs while providing near-zero emission performance without range anxiety. We will have to look further into the prospects for competition between BEVs on the one hand and PHEVs on the other hand, taking into account various aspects of their respective performances (battery range, emission levels, retail prices), in order to be able to assess more accurately the possible impacts of the fast-charging infrastructure on these two different markets. National markets vs local markets? Many analyses are primarily concerned with major national-level policies (Mock and Yang 2014; Proff and Kilian, 2012). As stated by Mock and Yang, this is an important limitation, especially considering the increasing impacts of regional- and city-level policies and incentives, and the great concentration of PEV sales in major urban metropolitan areas. Local mobility patterns and

32
infrastructure directly influence consumer behavior, thereby possibly generating peculiarities (or exacerbating existing ones) on the passenger car market at the local level. Our analysis of the prospective development of the PEV market in France will have to be as sensitive as possible to peculiarities of local mobility patterns, infrastructure and policies at the city level. Long-distance trips vs. extended catchment areas? It is our view, based on our preliminary analyses, that different types of mobility patterns may be impacted differently by the deployment of a large-scale fast-charging infrastructure. Indeed, fast-charging might be more appealing to private households as part of their occasional long-distance trips (e.g. for holidays), as opposed to their daily mobility routines, whereas corporate users might consider the fast-charging infrastructure as an opportunity to extend their catchment area on a daily basis (e.g. by charging the delivery vehicle during the driver’s lunch break). Although our analysis will mainly focus on the private household market, we will endeavor to provide additional insights into the corporate market for light commercial vehicles as well.

33
References
ACEA (European Automobile Manufacturer's Association) (2015), New electric vehicle registration in the European Union http://www.acea.be/uploads/press_releases_files/ACEA_Electric_Vehicle_registrations_Q4_14-13.pdf
[Accessed:6th February 2015] ADEME (Agence de l’environnement et de la maîtrise de l’énergie) (2014a), L’exercice de prospective de l’ADEME « Vision 2030-2050 » ADEME (Agence de l’environnement et de la maîtrise de l’énergie) (2014b), Dispositif d'aide au déploiement d'infrastructures de recharge Autolib (2015) https://www.autolib.eu/ Automobile Propre (2015), Chiffres de vente & immatriculations de voitures électriques en France
http://www.automobile-propre.com/dossiers/voitures-electriques/chiffres-vente-immatriculations-france/ [Accessed:16th February 2015]
AVERE (European Association for Battery, Hybrid and Fuel Cell Electric Vehicles) - Les ventes de véhicules électriques en hausse en 2013, 9th May 2014 http://www.avere-
france.org/Site/Article/?article_id=5842&from_espace_adherent=0 [Accessed: 16th November 2014] Alalawi, B.M., Bradley, T.H., (2013), Review of hybrid, plug-in hybrid, and electric vehicle market modeling Studies. Renewable and Sustainable energy Reviews, 21, pp.190–203. http://dx.doi.org/10.1016/j.rser.2012.12.048 [Accessed: 27th October 2014] Bakke, J.J. (2011), Contesting Range Anxiety: The Role of Electric Vehicle Charging Infrastructure in the Transportation Transition. Master’s Thesis, Eindhoven University of Technology, Eindhoven, The Netherlands, 2011 http://alexandria.tue.nl/extra2/afstversl/tm/Bakker_2011.pdf Bakker, S. (2013), Standardization of EV Recharging Infrastructures Report Project E-Mobility NSR Barter, G., Tamor M., Manley D., West T. (2015) The implications of modeling range and infrastructure barriers to battery vehicle adoption, TRB annual meeting, 11-16 January 2015, Washington USA Bekker, H. (2015), Germany: Electric and Hybrid Car 2014 Sales Statistics http://www.best-selling-
cars.com/germany/2014-germany-electric-hybrid-car-sales-statistics/ [Accessed: 20th January 2015] Berman, B., Gartner, J. (2012), Plug-in electric vehicles battery electric and plug-in hybrid electric vehicles: OEM strategies, demand drivers, technology issues, key industry players, and global market forecasts http://www.navigantresearch.com/wp-assets/uploads/2012/06/PEV-12-Exe cutive-Summary.pdf. [Accessed: 25th November 2014] Bogenberger, K. (2015), Long-Trip Optimization of Charging Strategies for Battery Electric Vehicles , TRB TRB annual meeting, 11-16 January 2015, Washington USA Borloo, J.L., Estrosi, C. (2010), Grenelle Environnement http://www.developpement
durable.gouv.fr/IMG/pdf/Dossier_de_presse-final-2.pdf [Accessed: 14th January 2015] Botsford, C., Szczepanek, A. (2009), Fast Charging vs. Slow Charging: Pros and Cons for the New Age of Electric Vehicles. In Proceedings of the EVS24 International Battery, Hybrid and Fuel Cell Electric Vehicle Symposium, Stavanger, Norway, 13–16 May 2009. Boutueil, V. (forthcoming 2015), Towards a sustainable mobility system: Leveraging corporate car fleets to foster innovation, PhD dissertation, Université Paris Est, France
34
Browne, M., Allen, J., Nemoto, T., Visser, J. (2010), Light Goods Vehicles in Urban Areas, Procedia—Social and Behavioral Sciences, 2, pp. 5911–5919 CAAM (China Association of Automobiles Manufacturers) (2015) The sales and production of new energy vehicles boomed, 14th January 2015 http://www.caam.org.cn/AutomotivesStatistics/20150114/0905144510.html [Ac-cessed: 19th February 2015] Cambridge Econometrics, elementeenergy, Ricardo-AEA (2013), Fuelling Europe’s Future. How auto inno-vation leads to EU jobs. http://www.camecon.com/Libraries/Downloadable_Files/Fuelling_Europe_s_Future-
_How_auto_innovation_leads_to_EU_jobs.sflb.ashx. [Accessed: 14th February 2015] CCFA (Comité des Constructeurs Français d'Automobiles) (2013), L’industrie automobile française – Ana-lyses et statistiques 2012 http://www.ccfa.fr/IMG/pdf/ccfa_ra12_bat-2.pdf [Accessed: 8th January 2015] CCFA (Comité des Constructeurs Français d'Automobiles) (2014), L’industrie automobile française – Ana-lyses et statistiques 2013 http://www.ccfa.fr/IMG/pdf/ccfa_ra13_bat-2.pdf [Accessed: 8th January 2015] Center for Sustainable Energy (2015), CVRP Rebate Statistics http://energycenter.org/clean-vehicle-rebate-
project/rebate-statistics [Accessed: 15th February 2015] Center for Sustainable Energy (2014), What drives California’s Plug-in Electric Vehicles Owners? http://energycenter.org/clean-vehicle-rebate-project/vehicle-owner-survey/feb-2014-survey [Accessed: 15th February 2015] CHAdeMo Association. CHAdeMo Global Deployments, 16 July 2014, http://www.chademo.com/wp/blog/2013/01/07/chademo-global-deployments-japan/ [Accessed: 16th November 2014] EC (European Commission) (2009), Regulation (EC) No 443/2009 setting emission performance standards for new passenger cars. http://eurlex.europa.eu/LexUriServ/LexUriServ.do?uri=OJ:L:2009:140:0063:008:en:PDF. [Ac-cessed: 25th November 2014] EC (European Commission) (2011a), Reduction of pollutant emissions from light vehicles. Legislation summary http://europa.eu/legislation_summaries/environment/air_pollution/l28186en.htm. [Accessed: 27th October 2014] EC (European Commission) (2011b), Roadmap to a Single European Transport Area – Towards a competi-tive and resource efficient transport system. White Paper. COM(2011) 144 final. http://eurlex.europa.eu/LexUriServ/LexUriServ.do?uri=COM:2011:0144:FIN:en:PDF. [Accessed: 5th October 2014] EC (European Commission) (2013), Clean Power for Transport: A European alternative fuels strategy COM(2013) 17 final http://cor.europa.eu/en/activities/stakeholders/Documents/com2013-17.pdf [Accessed: 5th Oc-tober 2014] EU (European Union) (2014), Directive 2014/94/EU of the European Parliament and of the council of 22 October 2014 on the deployment of alternative fuels infrastructure. http://eur-lex.europa.eu/legal-
content/EN/TXT/PDF/?uri=CELEX:32014L0094&from=EN [Accessed: 27th October 2014] EDF (Electricité de France), E-Mobility Newsletter N.265 “ALSACE ENERGY CORRIDOR”: The installa-tion of the first rapid charging terminal, June 2012 EEA (European Environmental Agency) (2014), Van manufacturers must make new models more efficient by 2020 http://www.eea.europa.eu/highlights/van-manufacturers-must-make-new [Accessed: 9th November 2014] EEI (Edison Electric Institute) (2014), Transportation Electrification Utility Fleets Leading the Charge http://www.eei.org/issuesandpolicy/electrictransportation/FleetVehicles/Documents/EEI_UtilityFleetsLeadingTheCharge.pdf [Ac-cessed: 10th October 2014]
35
ELMO (Estonian Electromobility programme) (2013), About the programme http://elmo.ee/about/ [Accessed: 5th February 2015] ESB (Electricity Supply Board), Powering across the Nation, 27th June 2013 http://www.esb.ie/electric-cars/electric-
car-charging/charge-point-rollout.jsp [Accessed: 10th February 2015] EU (European Union) (2011), White Paper: Roadmap to a single European transport area – towards a com-petitive and resource efficient transport system, Brussels European Union EU (2014) Directive 2014/94/EU of the European Parliament and of the Council of 22 Oc-tober 2014 on the deployment of alternative fuels infrastructure http://eur-lex.europa.eu/legal-content/EN/TXT/?uri=CELEX:32014L0094 [Accessed: 5th March 2015] Howell S., Lee H., Heal A. (2014), Leapfrogging or Stalling Out? Electric Vehicles in China Working Paper Series Harvard Kennedy School ICCT (International Council in Clean Trasportation) (2014), European Vehicle Market Statistics Pocketbook 2014 http://www.theicct.org/sites/default/files/publications/EU_pocketbook_2014.pdf [Accessed: 10th February 2015] IEA (International Energy Agency) (2013), Global EV outlook. Understanding the Electric Vehicle Land-scape to 2020 http://www.iea.org/publications/globalevoutlook_2013.pdf [Accessed: 19th November 2014] INEA (Innovation & Networks Executive Agency) (2014), TEN-T 2013 Annual Call Proposal for an Imple-menting Decision on the selection of projects http://inea.ec.europa.eu/download/publications/2014/2013_ap_final_web.pdf
[Accessed: 13th December 2014] InsideEV (2015), Monthly Plug-In Sales Scorecard http://insideevs.com/monthly-plug-in-sales-scorecard/ [Accessed: 10th February 2015] ITF (International Transport Forum) (2010), Transport Greenhouse Gas Emissions – Country Data. http://www.internationaltransportforum.org/Pub/pdf/10GHGcountry.pdf. [Accessed: 20th December 2014] Jin L., Searle S., Lutsey N., (2014), The White Paper on Evaluation of State-level US. Electric vehicle incentives, The ICCP publications. http://www.theicct.org/sites/default/files/publications/ICCT_state-EV-incentives_20141030.pdf [Accessed: 26th January 2015] KBA (German Federal Motor Transport Authority) (2013) Neuzulassungen an Pkw in den Jahren 2003 bis 2013, http://www.kba.de/DE/Statistik/Fahrzeuge/Neuzulassungen/Umwelt/n_umwelt_z_teil_2.html?nn=652326
Leurent F., Windisch E. (2011), Triggering the development of electric mobility: a review of public policies European Transport Research Review, 3- 4, pp 221-235 Lin, Z., Greene D. L. (2011), Promoting the Market for Plug-in Hybrid and Battery Electric Vehicles: The Role of Recharge Availability. Transportation Research Record, Vol. 2252, 2011, pp. 49–56 http://assets.conferencespot.org/fileserver/file/31418/filename/12laqa.pdf Les Echos (2014). Bolloré veut installer 16.000 bornes de recharge d’ici à 2018, 8th December 2014 http://www.lesechos.fr/industrie-services/tourisme-transport/0203999780417-bollore-veut-installer-16000-bornes-de-recharge-en-france-1072748.php [Accessed: 26th January 2015]
MEEDDAT (2010), Plan national pour le développement des véhicules électriques et hybrides rechargeables – 14 actions concrètes. http://www.developpement-durable.gouv.fr/IMG/pdf/la_presentation_powerpoint.pdf MEDDE (2015a), Le déploiement des infrastructures http://www.developpement-durable.gouv.fr/Le-deploiement-des-
infrastructures,26811.html [Accessed: 4th February 2015]

36
MEDDE (2015b) Le renforcement de l’infrastructure de recharge accessible au public, 2 February 2015 http://www.developpement-durable.gouv.fr/Le-renforcement-de-l.html [Accessed: 16th February 2015] MEDDE (2015c), Guide technique pour la conception et l’aménagement des infrastructures de recharge pour véhicules électriques et hybrides rechargeables http://www.developpementdurable.gouv.fr/IMG/pdf/Guide_technique_pour_la_conception_et_l_amenagement_des_IRVE_-_decembre_2014_vf-1.pdf [Accessed: 4th February 2015] MEDDE (2015d), Projet de loi relatif à la transition énergétique pour la croissance verte, 29 January 2015 http://www.senat.fr/leg/pjl14-264.html [Accessed: 17th February 2015] Mock P., Yang Z. (2014), Driving electrification. A global comparison of fiscal incentive policy for electric vehicles pp.23 Nègre, L. (2011), Livre vert sur les infrastructures de recharge ouvertes au public pour les véhicules « décarbonés », April 2011, pp.198. http://www.developpement-durable.gouv.fr/IMG/pdf/Livre_vert_L-
_NEGRE_Infrastrucutres_recharge_pour_les_vehicules_decarbones.pdf [Accessed: 5th March 2015]
NRC (National Research Council) (2013), Overcoming Barriers to Electric-Vehicle Deployment: Interim Report The National Academies Press, Washington pp.68 http://gabrielse.physics.harvard.edu/gabrielse/papers/2013/OvercomingBarriersToElectricVehicleDeployment.pdf Office for Low Emission Vehicles (2015), Take-up of plug-in car grant continues to rise 26 February 2015 https://www.gov.uk/government/organisations/office-for-low-emission-vehicles [Accessed: 27th February 2015] Pasaoglu G., Fiorello D., Martino A., Scarcella G., Alemanno A., Zubaryeva A., Thiel C. (2012), Driving and parking patterns of European car drivers - a mobility survey. European Commission, Joint Research Centre Institute for Institute for Energy and Transport Report EUR 25627 EN Proff, H., Kilian, D. (2012), Competitiveness of the EU Automotive Industry in Electric Vehicles Final Report http://ec.europa.eu/enterprise/sectors/automotive/files/projects/report-duisburg-essen-electric-vehicles_en.pdf Région Ile-de-France (2015) La Région donne un coup d’accélérateur au développement des Nouveaux Vé-hicules Urbains, 14th February 2015 http://www.iledefrance.fr/region-donne-coup-accelerateur-au-developpement-nouveaux-
vehicules-urbains [Accessed: 16th February 2015] Sadeghian, S., Thebert, M., Leurent, F., Sajous, P. (2013) Actors’ positions and inclinations towards the electromobility system in France. In: Transportation Research Board Annual Meeting Compendium of Papers. Washington D.C., US, 13th-17th January 2013. Washington D.C.: TRB. Spath, F.,Voitures électriques : des ventes 2014 en demi-teinte, Breezcar, Janvier 2015 http://www.breezcar.com/actualites/article/immatriculations-voitures-electriques-2014-France [Accessed: 17th February 2015] Thiel, C., Alemanno, A., Scarcella G., Zubaryeva, A., Pasaoglu G. (2012), Attitude of European car drivers towards electric vehicles: a survey. JRC Research and Policy reports. https://setis.ec.europa.eu/system/files/Attitude_of_European_car_drivers_towards_electric_vehicles-a_survey.pdf [Accessed: 11th February 2015] UNRAE Unione Nazionale Rappresentanti Autoveicoli Esteri (2015) Analisi del mercato autoveicoli in Italia http://www.unrae.it/pubblicazioni/book-statistiche-annuali/3035/book-unrae-2014 [Accessed: 25th January 2015]
Vergis, S., Turrentine, T. S. (2014), Plug-In Electric Vehicles : A Case Study of Seven Markets. Windisch, E. (2013), Driving electric? A financial assessment of electric vehicle policies in France. PhD.
Dissertation, Université Paris-Est Marne-la-Vallée

37
WRI (World research Institute) (2009), World Greenhouse Gas Emissions in 2005. WRI Working Paper. http://pdf.wri.org/working_papers/world_greenhouse_gas_emissions_2005.pdf. [Accessed: 20th December 2014] ZERO (Zero Emission Resource Organisation) (2012), Taking charge Introducing fast chargers in Norway http://www.zero.no/publikasjoner/introducing-fast-chargers-in-norway.pdf [Accessed: 23th November 2014]
Zuleta, J.C., (2015) EV Sales Continue Despite Low Oil Prices, 15 January 2015 http://oilprice.com/Finance/investing-and-trading-reports/EV-Sales-Continue-Despite-Low-Oil-Prices.html