Embed Size (px)
Citation preview

on June 20, 2018http://rsob.royalsocietypublishing.org/Downloaded from
rsob.royalsocietypublishing.org
ResearchCite this article: Yuan R et al. 2017 Beyond
cancer genes: colorectal cancer as robust
intrinsic states formed by molecular
interactions. Open Biol. 7: 170169.
http://dx.doi.org/10.1098/rsob.170169
Received: 10 July 2017
Accepted: 6 October 2017
Subject Area:systems biology
Keywords:colorectal cancer, systems biology, robust
dynamical states, endogenous molecular –
cellular network, stochastic nonlinear dynamics
Authors for correspondence:Ping Ao
e-mail: [email protected]
Xiaomei Zhu
e-mail: [email protected]
†Present address: Department of Systems
Biology, Harvard Medical School, Boston,
MA 02115, USA.
Electronic supplementary material is available
online at http://dx.doi.org/10.6084/m9.
figshare.c.3911893.
& 2017 The Authors. Published by the Royal Society under the terms of the Creative Commons AttributionLicense http://creativecommons.org/licenses/by/4.0/, which permits unrestricted use, provided the originalauthor and source are credited.
Beyond cancer genes: colorectal canceras robust intrinsic states formed bymolecular interactions
Ruoshi Yuan1,† Suzhan Zhang2,3, Jiekai Yu2,3, Yanqin Huang2,3, Demin Lu2,3,Runtan Cheng1, Sui Huang4, Ping Ao1,5, Shu Zheng2,3, Leroy Hood4
and Xiaomei Zhu1,5
1Key Laboratory of Systems Biomedicine, Ministry of Education, Shanghai Center for Systems Biomedicine,Shanghai Jiao Tong University, Shanghai 200240, People’s Republic of China2Key Laboratory of Cancer Prevention and Intervention, Chinese Ministry of Education, Key Laboratory ofMolecular Biology in Medical Sciences, Hangzhou, Zhejiang Province 310009, People’s Republic of China3Second Affiliated Hospital, School of Medicine, Zhejiang University, Hangzhou 310009, People’s Republic of China4Institute for Systems Biology, 401 Terry Ave. N., Seattle, WA 98109-5234, USA5Shanghai Center of Quantitative Life Sciences, Shanghai University, Shanghai 200444, People’s Republic of China
RY, 0000-0002-9508-7326; PA, 0000-0001-7109-628X; XZ, 0000-0002-3674-3565
Colorectal cancer (CRC) has complex pathological features that defy the linear-
additive reasoning prevailing in current biomedicine studies. In pursuing a
mechanistic understanding behind such complexity, we constructed a core
molecular–cellular interaction network underlying CRC and investigated its
nonlinear dynamical properties. The hypothesis and modelling method has
been developed previously and tested in various cancer studies. The network
dynamics reveal a landscape of several attractive basins corresponding to both
normal intestinal phenotype and robust tumour subtypes, identified by their
different molecular signatures. Comparison between the modelling results
and gene expression profiles from patients collected at the second affiliated
hospital of Zhejiang University is presented as validation. The numerical ‘driv-
ing’ experiment suggests that CRC pathogenesis may depend on pathways
involved in gastrointestinal track development and molecules associated
with mesenchymal lineage differentiation, such as Stat5, BMP, retinoic acid
signalling pathways, Runx and Hox transcription families. We show that the
multi-faceted response to immune stimulation and therapies, as well as differ-
ent carcinogenesis and metastasis routes, can be straightforwardly understood
and analysed under such a framework.
1. IntroductionColorectal cancer (CRC) is a leading cause of cancer deaths in the USA [1] and
around the world [2,3]. The current research on combined molecular-targeting
agents [4], the need for better risk models to incorporate genetic, lifestyle and
environmental effects [5], and the development for early detection method [6]
all require a better understanding at the molecular level. Ideally, a causal and
quantitative model may be used as a ‘dry-experiment’ platform to recapitulate
carcinogenesis and metastasis routes, and to test efficacy of drug combinations.
Towards such a goal, we investigated CRC under the framework that cancer is a
robust state(s) evolutionarily formed from the underpinning endogenous mol-
ecular–cellular interaction network [7,8]. The method has been developed and
tested in recent years [9–12]. The model construction and analysis are presented
in this work. We show that the model indeed captures the essential features of
CRC complexity. The nonlinearity of the interaction network dynamics is
directly responsible for the formation of the robust CRC subtypes and their
differential responses to intervention.

rsob.royalsocietypublishing.orgOpen
Biol.7:170169
2
on June 20, 2018http://rsob.royalsocietypublishing.org/Downloaded from
CRC is a clinically heterogeneous disease. About 40% of
patients with CRC develop liver metastasis at the time of presen-
tation, with approximately 20% presenting as synchronous
metastasis and the remaining 20% as metachronous metastasis
[13–15]. Classification schemes are researched to associate clinical
outcome with both genetic and phenotypic biomarkers, such as
KRAS/BRAF mutations [16], overall mutation frequency [17],
mesenchymal character [18], methylation [19] and gene
expression profiles [20]. Forexample, patients who differ in micro-
satellite instability, which accounts for 7–20% of all patients,
appear to have a different prognosis and benefit from chemother-
apy [18]. However, these tumour classification schemes have
intrinsic difficulties in themselves, such as the choice and
comparison across and within different patient sets used in associ-
ation studies [21]. In addition, the classification schemes do not
directly translate molecular heterogeneity of CRC into the disease
progression and response to therapies mechanistically. A better
understanding for CRC heterogeneity is still needed. Neverthe-
less, a remarkable finding of a possible robust classification
system, by analysing six independent classification systems and
their convergence into four consensus molecular subtypes [22],
suggests that CRC may have intrinsic robust subtypes regardless
of approaching angles. This observation of robust molecular sub-
types is consistent with our hypothesis that cancer corresponds to
intrinsic robust states formed by an endogenous molecular–cellu-
lar interaction network [7].
The hypothesis of an endogenous molecular–cellular
interaction network for cancer has been tested in hepatocellu-
lar [9], prostate [10] and gastric cancers [11], and acute
promyelocytic leukaemia [12]. The major assumption is that
the collective effects of interactions among molecular/cellular
agents lead to robust states including normal physiological
states and cancer subtypes. Carcinogenesis may be understood
as a transition from a normal state to cancer state(s). The effect
of mutations is naturally incorporated [23]. The idea of collec-
tive emergence in biology goes back to Waddington and
Delbruck, followed by Monod and Jacob, Hinshelwood and
Kauffman [24–29]. High-dimensional attractor states in gene
expression patterns and their functional robustness have
meanwhile been experimentally demonstrated [30,31].
Genetic and epigenetic studies have identified dozens of
genes and molecular pathways, which could possibly have
causal relation to CRC. Large-scale molecular profiling, on
the other hand, has identified thousands of molecules differ-
entially expressed in CRC and its progression [32,33]. As
constructing a network that includes all the genes known to
be differentially expressed in CRC and their regulatory mol-
ecules is not practical and may not be necessary to provide
a picture for the mechanism, we focused on the ones which
may be casual to CRC pathology. In addition to well-
known molecules and pathways in carcinogenesis, such as
p53, Myc, Wnt and NF-kB [34–36], we included molecules
important in embryonic development, notably of the gastro-
intestinal (GI) track and mesenchymal lineage. The
feedbacks from intra- and extracellular signalling as well as
other molecular interactions are collected from molecular
biology and biochemical low-throughput experiments
designed to be valid under normal physiological conditions.
The network dynamics simulation reveals the robust states,
their transition paths and the associated drives by the orche-
strated activities of key regulatory molecules. The calculated
robust heterogeneity is validated by the reported phenotypes
in the literature and microarray experiments. The implication
of such a roadmap in carcinogenesis and metastasis potential
is considered in the Discussion section. The intrinsic landscape
of CRC may also shed new light on the debate about the sti-
mulating/inhibitory effect of immune response to cancer.
Future clinical and biological studies are needed to fully vali-
date these predictions and explore for therapeutic purposes.
2. Results2.1. Molecular – cellular network model for colorectal
cancerThe molecular–cellular network we constructed is aimed to
be a consolidated and simplified core network for studying
CRC development (figure 1). Some of the nodes in the net-
work represent pathways, such as Notch, SHH and Wnt
signalling pathways. Cascading effects within these path-
ways are included in the same manner. Similarly, EGFR,
VEGF represent pathway activities, not the expression level
of these proteins. Growth factor feedback loops are assumed
to be self-contained within the tumour tissue. For example,
although VEGF receptors are primarily expressed on endo-
thelial cells, tumour cells might also express them [37].
Production of cytokines is not assumed to be from tumour
cells but from the tumour tissue, and emphasis in defining
interactions is on receptors/ligands and crosstalk between
signalling pathways. Importantly, the model involves cell–
cell interactions because of the feedback from cytokines and
extracellular matrix. To keep the model simple, only repre-
sentative molecules of given functional modules are
included. For example, for cell cycle regulation, only Cyclin
E and Cyclin D are included. The nodes and edges of the
CRC network that represent molecules, pathways and their
interactions are listed in electronic supplementary material,
table S1. Cell cycle, apoptosis, growth factor signalling, differ-
entiation, immune response, stress response, angiogenesis
and metastasis are incorporated in the model. The inter-
actions among molecules are obtained from the literature,
with preference given to interactions with solid biochemical
basis. The constructed network is presented in electronic sup-
plementary material, table S1, with detailed references in
electronic supplementary material, table S2.
The network construction is hypothesis-driven in seve-
ral respects. First, a number of important molecules and
pathways identified in previous genetic and molecular
biological studies (such as APC and KRAS), with a causal
relationship to CRC development, are included as nodes in
the network. Second, we assumed that there are intrinsic mol-
ecular feedback loops of these genes or molecules. We looked
into developmental programmes for these feedback loops.
There are studies showing that overactive pathways can
lead to pathological conditions. For example, the Wnt path-
way, which is active in the developmental process, induced
a programme of intestinal genes in the developing lung
[38]. Third, we hypothesized that feedback loops mediated
by immune response also might have a developmental link
in haematopoiesis. Development of leucocyte is orchestrated
by the comprehensive regulation of inflammation-related
molecular programmes. In addition, physiological inflam-
mation in response to external stimulation dissolves after
withdrawal of stimuli, while the developmental programme
presumably requires self-sustained feedbacks to quarantine

cell cycle
apoptosis
differentiation
immune response
NRgrowth factor
ECM
stress response
modules
dynamical model (ODE, SDE, Boolean network)
network
Myc p53
Bcl-2
TGF-
HNF1
Wnt
Cdx2
p21
attractors
S1 S2 S3 S4 S5 S6 S7 S8 S9 S10
S1 S2 S3 S4 S5 S6 S7 S8 S9 S10
Cyclin D/Cdk4,6 G-CSFR
Cyclin E/Cdk2 IL-1
E2F IL-10
Myc IL-3
p21 IL-6
p27 i B
pRb NF- B
Ras Stat3
Stat5
TGF-
TNF-
BMP
CCK
EGFR
FGF2
FGF4/8
FGF7
C/EBP FGF9
C/EBP FGFR2
Cdx2 FGFR3
Foxa1 FGFR4
Foxa2 Gast
Gata1/2 HGF
Gata4/6 IR
Hes1 VEGF
Hey2 Akt
HNF1 AP2
HNF4 c-Jun
Hoxa10 HIF
Hoxa3 MAPK
Hoxa5 Mkp2
Hoxa9 PKA
PGC-1 PTEN
PRDM14 p53
Pu.1 E-Cadherin
Runx1 HSPG2
Runx2 Integrin
Sox2 Notch
Sox4 NGAL
Sox7 NOG
Sox9 OPN
PPAR SHH
GR Wnt
NR4A
RARs
NR2F2
Bad
Bax
Bcl-2
Bcl-xL
Bim
Caspase 3
Cytochrome C
Fas
XIAP
0 1.0
attractor attractor
cell
cycl
e
imm
une response
apop
tosi
s
growth factors
stress responseE
CM
NR
diff
eren
tiatio
n
0.5
molecular biologyexperiments
phenotypical molecular profiles
phenotypical molecular profiles
hete
roge
neity
of cancer
hete
roge
neity
of cancer
multiple
su
b-ne
twor
ks
multiple
su
b-ne
twor
ks
S2S2
S1S1
intestine
CRC subtype
transitions between attractors
drug targets
drug effects
biomarkers
induced transitions
modeling
resu
lts
AP2
E-Cadherin
Foxa1
p21
p53
PTEN
Bax
S6
Bcl-2
Bim
CCK
c-Jun
Cdx2
Hoxa5
HGF Hoxa3 Sox7
p27
Foxa2Ras
HNF1
HNF4α
RARs
VEGF
XIAP
Sox4
NR2F2
S5S5 and S6
effective network S5 versus. S6
?
node S1 S2 S3 S4 S6 S5
Cyclin D/Cdk4, 6
Cyclin E/Cdk2
E2F
Myc
p21
p27
Ras
symbol
CCND1
CCNE1
E2F1
MYC
CDKN1A
CDKN1B
HRAS
drug targets
bio
I II III IV
cell
cycl
e
comaprison with microarray data
attractors on landscape
(BMP, SHH)
(RARs, Stat3,TGF-b)
(PPA
Rg, S
tat3
, Sta
t5)
(HN
F4a,
AP2
, p53
)
(PTEN, p21, Myc)
S5
S1 S2
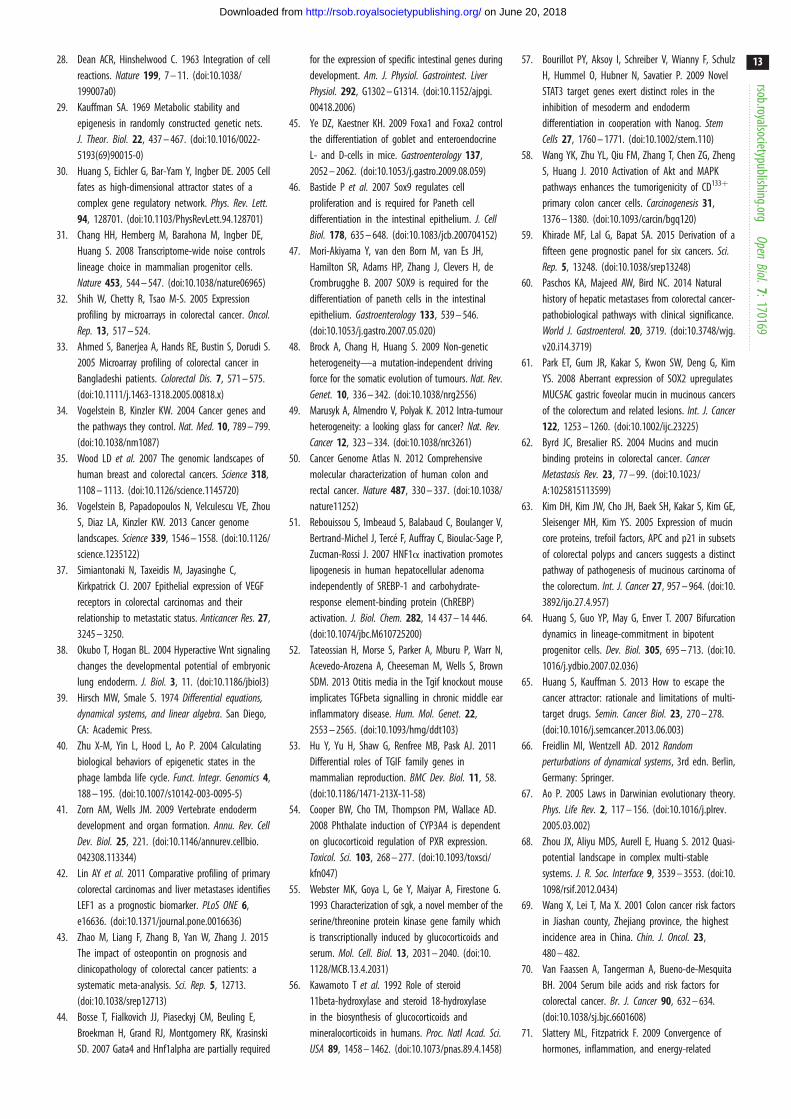
Figure 1. Schematics of endogenous molecular – cellular network construction and modelling. We started with a minimal core network representing regulation ofbasic cellular functions, such as cell cycle, apoptosis and stress response, similar to previous cancer models [9 – 12]. Molecules and molecular pathways specific for GItrack development and functions, such as transcription factors Cdx2, HNF1, glucocorticoids signalling pathways, were added to the minimal core network. Themolecular interactions were collected from the literature, with priority given to those verified by molecular biology experiments. Feedback loops related to inflam-mation and hematopoiesis were also included. Dynamical system equations (described in electronic supplementary material) were used to compute the attractorstates generated by the defined network structure, as well as saddle points for spontaneous transitions between attractors. Random parameter tests were performedto demonstrate robustness of the obtained results. Comparison of gene activity profiles predicted by the attractors with microarray data validated the modelling.Specifically, CRC subtypes as well as normal intestinal phenotype corresponded to the attractors of network dynamics.
rsob.royalsocietypublishing.orgOpen
Biol.7:170169
3
on June 20, 2018http://rsob.royalsocietypublishing.org/Downloaded from
robustness. More details can be found in the electronic
supplementary material.
2.2. From network model to phenotypes: robust statesIn a molecular network, due to the interactions in the net-
work that include feedbacks only for a limited number of
combinations, these interactions are ‘balanced’, that is, do
not exert any driving force to change the network state. Math-
ematically, these ‘balanced states’ correspond to fixed-point
solutions of a nonlinear dynamical system [39]. If a fixed
point is also stable under perturbation, it is an attractor of
the system. These attractors are more likely to occur and
have a longer residence time in real biological systems with
the presence of noise. Saddle points or other fixed points
that are partially (i.e. in a subset of state space directions)
stable can serve as passes for stochastic transitions between
attractors. The attractors are interpreted as cell phenotypes
because of their stability, which affords homeostatic robust-
ness to the specific molecular profile that determines
phenotype [9,10,40]. We obtained 10 attractors from the
network constructed (figure 2), representing the predicted
phenotypes. These attractors are robust over a large range
of parameters. Among them, attractors S7–S10 display mol-
ecular profiles that resemble apoptotic states. Attractors S1
and S2 are proliferation phenotypes, epitomized by upregula-
tion of E2F, Cyclin D/E. By contrast, attractors S5 and S6
represent differentiated phenotypes. Attractors S3 and S4
appear to encode cell cycle arrested state, but otherwise
resemble the proliferation attractors S1 and S2.
Among the two growth states with predicted active cell
cycle activity (attractors S1 and S2 in figure 2), one seems to rep-
resent growth factor-stimulated proliferation, characterized by
active FGF, HGF, IGF, EGF signalling, consistent with epithe-
lia-to-mesenchymal transition and endoderm organ
formation (attractor S1 in figure 2) [41], while the other appears
more typical of CRC: active Wnt pathway [42], high expression
of Runx1 and osteopontin [43]. These two growth states might
both contribute to cancer progression because they intercon-
vert into each other relatively easily. The growth-factor-
stimulated state (attractor S1) is inducible from attractor S2
by reduction in Stat3 pathway (figure 3). By contrast, the typi-
cal CRC-like state (attractor S2) is not inducible from attractor
S1 by inflammation alone. Instead, attractor S2 is induced by
both inflammatory and immune suppression from attractor
S1 by increasing TNF-a and TGF-b. There are different ways

S1 S2 S3 S4 S5 S6 S7 S8 S9 S10
S1 S2 S3 S4 S5 S6 S7 S8 S9 S10
Cyclin D/Cdk4,6 G-CSFR
Cyclin E/Cdk2 IL-1
E2F IL-10
Myc IL-3
p21 IL-6
p27 ikB
pRb NF-kB
Ras Stat3
Bad Stat5
Bax TGF-bBcl-2 TNF-a
Bcl-xL BMP
Bim CCK
Caspase 3 EGFR
Cytochrome C FGF2
Fas FGF4/8
XIAP FGF7
C/EBPa FGF9
C/EBPb FGFR2
Cdx2 FGFR3
Foxa1 FGFR4
Foxa2 Gast
Gata1/2 HGF
Gata4/6 IR
Hes1 VEGF
Hey2 Akt
HNF1 AP2
HNF4a c-Jun
Hoxa10 HIF
Hoxa3 MAPK
Hoxa5 Mkp2
Hoxa9 PKA
PGC-1 PTEN
PRDM14 p53
Pu.1 E-Cadherin
Runx1 HSPG2
Runx2 Integrin
Sox2 Notch
Sox4 NGAL
Sox7 NOG
Sox9 OPN
PPARg SHH
GR Wnt
NR4A
RARs
NR2F2 0 1.0
attractor attractor
cell
cycl
e imm
une response
apop
tosi
s
growth factors
stress responseE
CM
NR
diff
eren
tiatio
n
0.5
Figure 2. The molecular profiles of the attractors in the dynamical system model of the CRC network (see also electronic supplementary material, table S1). Thecorresponding equations are listed in electronic supplementary material. Note that attractors S1 and S2, which correspond to proliferating, differ mainly in Stat5activities. This difference may influence metastasis. Attractors S3 and S4 correspond to non-proliferating states but are otherwise similar to S1 and S2. S5 representsthe normal intestine phenotype. S6 resembles a differentiated phenotype with a secretory signature. S7 – S10 map into apoptotic states.
rsob.royalsocietypublishing.orgOpen
Biol.7:170169
4
on June 20, 2018http://rsob.royalsocietypublishing.org/Downloaded from

S1 proliferating state Runx1 OPN Stat3 Stat5 E2F p21 p53
S2 proliferating state Runx1 OPN Stat3 Stat5 E2F p21 p53
S3 non-proliferating, S1 like Runx1 OPN Stat3 Stat5 E2F p21 p53
S4 non-proliferating, S2 like Runx1 OPN Stat3 Stat5 E2F p21 p53
S5 differentiated state Runx1 OPN Stat3 Stat5 HNF1 Cdx2 p53
S6 differentiated state Runx1 OPN Stat3 Stat5 HNF1 Cdx2 p53
S7 apoptotic state
S8 apoptotic state
S9 apoptotic stateS10 apoptotic state
cytochrome C
cytochrome C
similar to S2
similar to S1
similar to S4similar to S3
caspase 3 cytochrome C
caspase 3
caspase 3
caspase 3
cytochrome C
S3S6
S5
S1 S2S9
S3
S6S5
S1 S2
S4
S7 S8
S10
attractors on landscape induced phenotype transitions
S4
(BMP, SHH)
p21/E2F
(RARs, Stat3, TGF-b)
(PPA
Rg, S
tat3
, Sta
t5)
Stat3
p21/E2F
Myc/(A
P2,MA
PK,N
R2F2)
(E2F, N
otch, TG
F-b)
Stat
5/R
unx1
(PPARg, Stat3, Stat5)
Myc/E2F
(Runx1, E2F)
Stat
5/R
unx1
/Sta
t3
(HN
F4a,
AP2
, p53
)
(NF-kB, T
NF-a, RARs)
C/EBPa/SHH/AP2/RARs
Gata/B
MP/C
dx2/Wnt/Sox4
NF-kB/NR4A/AP2/HNF4a
(Runx1, E2F)
(PTEN, p21, Myc)
(AP2, NR2F2) /Stat3
(RA
Rs, p53, c-Jun, C
dx2, CC
K,
HN
F1, Sox4, Sox7, NR
2F2, VEG
F)
(a) (b)
Figure 3. (a) Spontaneous transitions between the attractors characterized by saddle/unstable fixed points. In addition to attractors, the dynamical model also containsfixed points of different types, including saddles and other unstable fixed points. These points usually play the role of passes for spontaneous transitions between theattractors. S1 – S10 represent the attractors, as shown in figure 2. The saddle/unstable fixed points are denoted by small dots. The flows of cell states from saddle/unstable fixed points to the attractors are represented by arrowed lines. (b) Predicted switching between these attractors triggered by induction ( perturbation of geneactivity). Multiple paths for transitions between any two attractors, representing (tumour) cell type conversions (only selected are shown). Inducers in the same bracketsmust be operated simultaneously to induce a switch. The slash ‘/’ represents different paths triggered by different inducers. Red/green represents upregulation/down-regulation. For clarity, the corresponding phenotypes of these attractors are also listed. Attractor S5 is normal intestine-like, while all the other attractors might contributeto CRC. Since attractors S3 and S4 are similar to S1 and S3, there are essentially three attractors contributing to CRC subtypes: S1, S2 and S6.
rsob.royalsocietypublishing.orgOpen
Biol.7:170169
5
on June 20, 2018http://rsob.royalsocietypublishing.org/Downloaded from
to interpret the possible phenotypes represented by attractors
S1 and S2, but it is apparent that they have characteristics of
both an aberrant developmental process and inflammation.
The differentiated states (attractor S5) represent an intes-
tine-like phenotype, characterized by activated Cdx2 and
HNF1. Both genes are indispensable for intestinal function
[44]. Attractor S5 also has higher GATA4/6 level, consistent
with an intestinal epithelial cell phenotype [44]. Attractor S6
differs from S5 by being Foxa1,2/SHH/Sox-positive. It might
represent stomach or intestinal secretory cell lineage [11,45–
47]. For these attractors, the active network nodes (with a
high expression level) can be identified, as shown in electronic
supplementary material, figure S1. This is a way to visualize
the effective subnetwork specific for each attractor. The active
nodes for the normal intestine-like state (attractor S5) are com-
pared with those for S1, S2 and S6 separately in electronic
supplementary material, figure S1. The network topology
indeed suggests that attractors have their own separate positive
feedback loops. Also, attractors have mutual suppressing
relations, as shown in the graph, although not in the simple
form as seem in direct node-to-node switches.
2.3. Comparison with observations I: common featuresof colorectal cancer
CRC is a disease that exhibits inter-individual variation both
in pathology and in its response to treatment. The model pre-
dicts multiple fixed points. This multi-stability opens the
possibility that cells in a tumour occupy distinct attractors,
and possibly interconvert between them—giving rise to mix-
tures of cell phenotypes—which would explain the widely

TGFB1TGFB2
SERPINE1TGFBR1TGFBR2 3.0
TGIF1TGIF2
TGIF2LYSULF1
PIM3 1.5KLF4SGK1
NR3C1NR3C2
CYP11B1 0CYP3A4HNF1B
PCK1HNF4A
SCD –1.5GPI
GATA2E2F1
SREBF1PPARG –3.0
CFDACOX1
CDX2CDH1
HN
F1
SHH
calculatedCRC versus normal CRC tissue normal tissue
TG
F-b
path
way
Stat
3G
R p
athw
ay(a)
Figure 4. Comparison between computed results and microarray data. The microarray profiles were obtained from the second affiliated hospital of ZhejiangUniversity for a total of 17 normal tissues and 26 CRC tissues of different patients. Every column is the profile of a computed attractor, the profile of relativegene activity between CRC and normal, as indicated, or a microarray profile from CRC tissue. Comparison of the predicted attractors profiles with observed microarraydata show common features as listed in (a) and (b). The cell cycle module is shown in (b). The list of genes for (b) were obtained from Theilgaard-Monch et al.[104]. (c) A broad comparison of the model prediction and observation. Normal tissues are in group IV. Group I are patients showing attractor S6 signature, group IIpatients showing some normal like attractor S5 signature, and group III patients showing a signature of attractor S1 and S2, but not S6. References used forannotations are [105 – 110]. A full list of data and references is available in electronic supplementary material, file S1. (Parts (b) and (c) shown on following pages.)
rsob.royalsocietypublishing.orgOpen
Biol.7:170169
6
on June 20, 2018http://rsob.royalsocietypublishing.org/Downloaded from
observed non-genetic cellular heterogeneity of tumour tissues
[48,49]. However, obviously transcriptome analyses of
tumours [50] still can identify subtypes of CRC, perhaps
because some attractor dominates. Thus, we first identified
common features in CRC profiles derived from modelling
and compared them with clinical measurements.
Attractor S5 (figure 2) represents normal intestinal pheno-
type. If the intestinal cells were trapped in other attractors,
they would be pathological, although not necessarily CRC.
We assume that cancer tissue is a heterogeneous combination
of attractors S1–S4 and S6, then compare with real tumours.
Figure 2 shows that HNF1, HNF4, Cdx2, TGF-b pathway,
E-cadherin and glucocorticoid pathway characterize normal
intestine. They are unambiguously downregulated in every
possible abnormal state in the computed attractors S1–S4
and S6. The microarray profile from patients obtained from
the second affiliated hospital of Zhejiang University showed
downregulation of HNF1B expression in CRC patients.
As expected [51], HNF1B transcript downregulation
accompanied a decrease in gluconeogenesis (manifest in
PCK1, phosphoenolpyruvate carboxykinase), upregulated
glycolysis (GPI, glucose-6-phosphate isomerase) and lipogen-
esis (SCD, stearoyl-CoA desaturase). Microarray results for
Cdx2 and HNF4A were not conclusive. TGF-b signalling
impairment is consistent with upregulation of negative regu-
lators TGIFs [52,53]. Glucocorticoid receptor NR3C1 and
mineralocorticoid receptor NR3C2 were both downregulated
in CRC patients. Glucocorticoids target genes CYP3A4 [54],
SGK1 [55] and CYP11B1 (steroid 11-b-hydroxylase), which
are required for synthesis of glucocorticoids [56], were down-
regulated in CRC patients. The model predicts upregulation
of Stat3 in attractors S1–S4. Expression of several Stat3
target genes, SULF1, PIM3 and KLF4 [57] was altered accord-
ingly, as shown in figure 4a. In addition to transcripts, the
kinase activities of the Akt and MAPK pathways were
shown to be active in CRC stem cells [58], consistent with
both attractors S1 and S2. These experimental results show
that network modelling results are consistent with obser-
vation. One application for these common features (shown
in figure 4a,b) predicted by models is to use them as molecu-
lar signature in prognosis and diagnosis. Unlike signatures
defined by brute-force statistical analysis of data [50,59],
attractor-informed patterns capture the natural constraints
imposed by the underlying regulatory network.
2.4. Comparison with observations II: heterogeneousfeatures of colorectal cancer
The computed attractors S1–S4 and S6 (figure 2) together with
their combination define a set of subtypes that the network
model predicts. There are two proliferating attractors S1 and
S2. Stat3 and Stat5 pathways are both active in attractor S1,
while only Stat3 is active in attractor S2. Runx1, interleukin sig-
nalling, Wnt pathways and NR4A are more active in attractor
S2, while Hox genes and FGF signalling are more active in S1

CCND3S100A6
G0S2CCPG1
RBL2ERF
CDKN1BCSK
CCNG2CCNDBP1
SIPA1CDK5R1
DUSP6PPP1R15A
DUSP1FOXO4
IRF1BCL3
CDKN2DHERC5
CDK9CIZ1
NCAPD2TFDP1SMC3CUL1
GTSE1PSMD8
ANAPC7CCNF
AURKARAD17CDC23
UBE2V2CDC16
CDKN2CPTMA
BRCA2MLH1
SUGT1CCNCCDK2
NCAPHNRASCCNH
CCND2CDC25C
NUDCMYC
NSUN6CACYBP
CDK6E2F5
CHAF1ARBBP6
MAD2L1SKP2
CCNB1NCAPG
TTKBTG3
CDK10PLK1TP53
CCNE1E2F6
CCNG1CDC20
ATRMCM5CDK4CKS2WEE1
BUB1BCCNE2
CDK3NUCKS1
CDK2AP1SMC1AAURKBCHEK1TBRG4KNTC1
SMC4RAD1
CUL4AMCM2
CCNA2CDKN3
MSH2MCM6CKS1BRBBP4
BUB1PA2G4ABL1
CCNB2RAN
CDC7GMNN
CDC25BMCM3
ANAPC5NEK1
CCND1GADD45A
BIN1MYB
CRC tissue normal tissue calculated (normal versus C
RC
)
(b)
Figure 4. (Continued.)
rsob.royalsocietypublishing.orgOpen
Biol.7:170169
7
on June 20, 2018http://rsob.royalsocietypublishing.org/Downloaded from
attractor. Attractor S2 also predicts upregulated OPN, which
favours metastasis [60]. When comparing patients’ mRNA pro-
files, we can determine which attractor the profile of an
individual tumour is closer to. For example, patient 6 (in elec-
tronic supplementary material, file 2) is close to attractor S2,
with high OPN, Runx1 and low Hoxa10. Compared with

node S1 S2 S3 S4 S6 S5 symbol
CCND1
CCNE1
E2F1
MYC
CDKN1A
CDKN1B
HRAS
BAD
BAX
BCL2
BCL2L1
BCL2L11
CASP3
CASP8
FAS
XIAP
CEBPA
CEBPB
CDX2
FOXA1
FOXA2
GATA1
GATA2
GATA4
GATA6
HES1
HEY2
HNF1B
PCK1
SCD
GPI
HNF4A
HOXA10
HOXA3
HOXA5
HOXA9
PPARGC1A
PPARGC1B
PRDM14
SPI1
IL8
RUNX1
RUNX2
SOX2
MUC1
MUC2
MUC5AC
MUC5B
SOX4
SOX7
SOX9
PPARA
PPARD
PPARG
SGK1
NR3C1
NR3C2
CYP11B1
CYP3A4
NR4A1
NR4A2
RARA
NR2F2
CSF3R
IL1B
IL10
IL3
IL6
NFKBIA
RELA
SULF1
PIM3
KLF4
TGFB1
TGFB2
SERPINE1
TGFBR1
TGFBR2
TGIF1
TGIF2
TGIF2LY
TNF
BMP4
BMP7
CCK
EGFR
FGF2
FGF4
FGF7
FGF9
FGFR2
FGFR3
FGFR4
GAST
HGF
MET
IGF2R
VEGFA
TFAP2A
TFAP2B
MAPK8
HIF1A
MAP3K4
PTEN
TP53
CDH1
HSPG2
ITGA6
NOTCH1
NOTCH4
HES6
HEY1
LCN2
NOG
SPP1
SHH
WNT5A
APC
SFRP2
SFRP4
EC
MN
Rim
mun
e re
spon
segr
owth
fac
tors
stre
ss r
espo
nse
apop
tosi
sdi
ffer
entia
tion
Cyclin D/Cdk4,6
Cyclin E/Cdk2
E2F
Myc
p21
p27
Ras
Bad
Bax
Bcl-2
Bcl-xL
Bim
Caspase 3
Cytochrome C
Fas
XIAP
C/EBPaC/EBPb
Cdx2
Foxa1
Foxa2
Hes1
Hey2
HNF4aHoxa10
Hoxa3
Hoxa5
Hoxa9
PRDM14
Pu.1
Runx1
Runx2
Sox4
Sox7
Sox9
RARs
NR2F2
G-CSFR
IL-1
IL-10
IL-3
IL-6
ikB
NF-kB
TNF-a
CCK
EGFR
FGF2
FGF4/8
FGF7
FGF9
FGFR2
FGFR3
FGFR4
Gast
IR
VEGF
c-Jun
HIF
MAPK
PTEN
p53
E-Cadherin
HSPG2
Integrin
NGAL
NOG
OPN
SHH
PPARg
GR
Stat3
BMP
AP2
NR4A
TGF-b
HGF
Notch
Wnt
Sox2
Gata1/2
Gata4/6
HNF1
PGC-1
I II III IV
cell
cycl
e
(c)
Figure 4. (Continued.)
rsob.royalsocietypublishing.orgOpen
Biol.7:170169
8
on June 20, 2018http://rsob.royalsocietypublishing.org/Downloaded from
patient 6, patient 9 is closer to attractor S1, with low OPN,
Runx1 and high Hoxa10. Attractor S6 resembles a differen-
tiated state with possible secretory signature. There are
reports of mucinous CRCs [61–63], which express Sox2,
MUC5AC, MUC2, MUC5B and p21 (CDKN1A). In the micro-
array data (in electronic supplementary material, file 2), several

rsob.royalsocietypublishing.orgOpen
Biol.7:170169
9
on June 20, 2018http://rsob.royalsocietypublishing.org/Downloaded from
tumours (of patients 2, 3, 4, 5, 7, 15) exhibit a molecular profile
resembling that of S6, characterized by upregulated p53 or p27
and upregulated mucins. However, there is a difference
between attractor S6 and these patients’ profiles, in that the
apparent Stat3 activity is high in these patients, as suggested
by elevated SULF1, PIM3 and KLF4. It is now well documented
that most (if not all) tumours, including CRC, contain multiple
cell types, even among the isogenic cells [58]. Such phenotypic
heterogeneity is best explained by multi-stability [48,49]. One
possibility is that these patients’ tumours may contain cell
types other than S6 that would map into attractor S1 or S2.
These p53- or p27-positive patients are particularly interesting
because they have a worse clinical outcome.
2.5. Transition between robust statesMathematically, in addition to attractors, the network dynamics
also predict saddles and other unstable fixed points. However,
these states are not locally stable. When perturbed, they will
flow to different attractors, driven by molecular interactions
[9,10,64,65]. The saddle points have straightforward dynamical
interpretation as the point of passage of the ‘least effort’ path for
spontaneous transitions between attractors driven by noise
[66–68]. Such paths are shown in figure 3a. Attractors S1–S4
are connected through multiple saddles and other unstable
fixed points to each other. Therefore, it is likely that cells inter-
convert due to external perturbations or internal fluctuations.
The exception is attractor S6, which is not connected to prolifer-
ating states represented by S1 and S2. As S6 resembles a non-
proliferative and differentiated state, it has to coexist with
either S1 or S2 to allow for tumour growth. This heterogeneity
of growth behaviour fits the biological framework of cancer
stem cells that drive tumour growth. Among the possible
CRC attractors S1–S4, attractor S3 is connected by a saddle
point to the normal intestine-like attractor S5. This would
suggest the possibility that carcinogenesis could be initiated
by a transition from the normal intestine-cell-type attractor
S5–S3 through the saddle point.
Transition from one attractor to another in the model can
also be enforced by resetting the values of a few selected
nodes of the network, which in reality maps into upregulat-
ing or downregulating of the corresponding molecules by
external induction. Starting from normal intestine-like attrac-
tor S5, if Myc is upregulated, and p21 and PTEN
downregulated simultaneously, this would cause a switch
to the proliferative state S2, with typical CRC molecular pro-
file. In the model, when NF-kB is numerically upregulated in
the normal intestine-like attractor S5, the cell will switch to
attractor S3, consistent with the notion of inflammation as
promoter of carcinogenesis. A switch from attractor S3–S1
is caused by activation of Myc. Computed trajectories for
selected attractor switching are shown in figure 3b. Consistent
with the modelling results that attractor S6 is not as closely
connected through saddles or other unstable fixed points to
the rest of the attractors, inducing S6 from S5 is more difficult.
2.6. Validation of the modelling resultsWe use standard hypothesis testing for the validation.
Comparison between modelling results and clinical data:Vector (a). Extracting results from clinical data. We use the
average gene expression value of the microarray data from
CRC (26 samples) versus the average value of those from
normal tissue (17 samples) to generate a vector (a column
matrix) with 1 and 21 elements. The rule is listed below: if
the expression level of a gene from the CRC data over that
from the normal tissue is larger than 1 plus a threshold
value, we consider this gene is upregulated in CRC and vice
versa. In case the upregulation or downregulation is not deter-
mined by data, we remove the gene from the list, because we
cannot distinguish the two possibilities that (i) the upregula-
tion or downregulation of the gene is not shown due to
inaccurate measurements, and (ii) the gene expression level is
similar in CRC and normal tissue.
CRC
Normal. 1þ threshold, 1 (upregulated in CRC)
Normal
CRC. 1þ threshold, � 1 (downregulated in CRC)
Otherwise, 0 ðundetermined by data, removed) :
8>>>><>>>>:
Vector (b). The vector (with 21, 1, 0 elements) for the mod-
elling results can be similarly generated without removing
zeros, because zeros mean that the modelling results predict
a similar gene expression level. We use the same threshold for
the two vectors (a) and (b). We could then compare the two
vectors directly and compute an accuracy rate for the consist-
ency (see electronic supplementary material, file 3 for details).
For a 5% threshold value, the accuracy is about 73% with a
total of 78 genes, which is close to the accuracy of microarray
data based on our previous experience [8,10–12,23]. We also
compute the accuracy with a varying threshold value in
figure 5b. It demonstrates the robustness of our results.
Test 1: Comparison with random guess. We generate 1 million
random vectors with uniformly distributed 1 and 21. For
better matching with the data, we do not include zeros here.
The distribution of the accuracy is shown in electronic sup-
plementary material, figure S3. The test shows that our
modelling results have p , 0.00001.
Test 2: Comparison with randomly rewiring networks. The null
hypothesis is that the accuracy of the results from the CRC net-
work model versus clinical data is not significant compared
with results generated from randomly rewiring networks.
For randomly rewiring networks that have the same total
number of interactions but are randomly rewired the connec-
tions and interaction types (inhibition or activation), we
compute the accuracy rate distribution shown in figure 5a.
For each randomly rewiring network, we compute its dyna-
mical stable states and the optimal two-state combination
(assigned to cancer and normal separately) compared with
the data. The estimated distribution from 200 networks
shows that the p-value is less than 0.005, such that the null
hypothesis should be rejected.
3. Discussion3.1. Clinical implications: colorectal cancer
carcinogenesis, metastasis and treatmentCRC development may take years and involve multiple risk fac-
tors [3,69–71]. Intermediate steps have been observed. The
molecular network constructed here exhibits both normal intes-
tine-like attractors and proliferating CRC-like attractors. The
predicted possibility for switching from normal intestinal to
CRC states may be relevant to carcinogenesis summarized in
figure 3. The results are consistent with the heterogeneous

0.2 0.4 0.6 0.8 1.0accuracy
0
1
2
3
4
5
0.5 1.0 1.5 2.0threshold
0
0.2
0.4
0.6
0.8
1.0
accu
racy
70%70%
60%60%
modelling resultsacurracy = 73%p-value < 0.005
modelling results
(a) (b)
Figure 5. Validation of the modelling results through comparison with randomly rewiring networks. (a) Distribution of consistency with clinical data for a group of 200randomly rewiring networks. Our model has 73% accuracy, which is significantly larger than randomly rewiring networks with p , 0.005. (b) The influence of the thresholdparameter in the comparison with the clinical data is not significant. The details of the comparison are provided in the electronic supplementary material, file S3.
rsob.royalsocietypublishing.orgOpen
Biol.7:170169
10
on June 20, 2018http://rsob.royalsocietypublishing.org/Downloaded from
nature of carcinogenesis and the role of inflammation and stress
[72,73]. The network model naturally allows for a multitude of
paths for the transition to the cancerous attractors [74], many of
which are associated with an inflammatory programme.
Specifically, the model predicts that tumour attractors can be
reached through changes in Myc, p21 or PTEN, or activation
of NF-kB as intermediate steps. In addition, increased stress
and p53, in combination with loss of retinoic inducible tran-
scription factor AP2 and nuclear factor HNF4, may also lead
to switching to CRC, from normal intestine-like attractor S5–S1.
The network supports several attractors that might associ-
ate with distinct phenotypes; in principle, how they
contribute to metastasis can be discussed. For instance, the
proliferating attractors S1 and S2 differ in Stat5 pathway
activities. Stat5 signalling has been shown to have an inde-
pendent effect on cell morphology via regulation on the
expression of adhesion molecules [75,76]. Impaired Stat5 sig-
nalling leads to non-healing wounds in the intestine [76]. The
loss of intestinal barrier due to Stat5 dysfunction might con-
tribute to metastasis in the phenotypes given by the network.
Another metastasis-related protein, PRL-3, is a downstream
target of Stat5 and Stat3 [77,78]. Note that all the network-
supported phenotypes of CRC have metastasis potential.
The Runx1 and OPN high/low phenotype might favour
metastasis through loss of intestinal barrier/activate PRL-3.
Transition from CRC to normal intestine state, on the other
hand, might be relevant to the prevention and treatment of
CRC. There are three major types of CRC, represented by the
type with positive p53 or p27 (S6), and the OPN- and Runx1-
positive (S2/S4) and-negative (S1/S3) types. For the OPN-
and Runx1-negative phenotype, switching to the normal intes-
tinal phenotype requires a suppression of the inflammation
programme, which could be achieved through a transition
from S3 to S5 by reducing Stat3 and Stat5. For the OPN- and
Runx1-positive phenotype, switching to the normal intestinal
phenotype would require first a switching to the OPN- and
Runx1-negative phenotype, from S2 to S1, through suppression
of RARs signalling and simultaneous anti-inflammation (redu-
cing Stat3, increasing TGF-b signalling). The p53/p27-positive
CRC type could be converted to the OPN- and Runx1-positive
phenotype via S4, by promoting inflammation (NF-kB and
TNF-a) and suppressing retinoic acid signalling RARs.
The theoretical base under immunotherapies is the cancer
immunosurveillance hypothesis [79]. However, experimental
evidence leads to various conclusions, ranging from that the
immune system naturally protects against cancer [80] to that
the immune reaction is almost always stimulatory to the
tumour’s growth [81]. The current focus on the differential
responses to immunotherapy is usually about the state of the
immune system, such as the T cell population and types
[82,83]. Our results show that different intrinsic robust cancer
subtypes may respond to immune cells, such as T cells and
macrophages, differently (figure 3b). Since the focus of the
model is on tumour cells, the calculated different responses are
due to the network-wide regulation over NF-kB and Stat3/5
inside tumour cells. If the internal status of a tumour does not
favour NF-kB activation, the remaining effect of cytokines is
left as a growth factor. Therefore, the calculated likely routes
for transitions between normal and cancer states, corresponding
to the genesis and development of cancer and transition among
subtypes, have non-identical dependence on immune activation.
The network for CRC presented in this work is essentially a
core decision-making network for intestinal development and
function. Signal transduction and transcriptional regulation are
two main molecular interaction types included. There are no
particular cancer-specific genes or cancer pathways in the net-
work. As consequences of the network wiring diagram, its
dynamics generate multiple attractors, which are robust
states and correspond to both normal intestinal phenotype
and CRC subtypes. For each of the robust state, a subnetwork
of the active nodes thus represents ‘cancer network’ or ‘normal
network’ separately, although they are part of the same
endogenous network. Interestingly, the nodes active in the
normal and CRC-like attractors have mutual inhibiting effects.
The concept of multiple attractors emanating from a single net-
work naturally suggests that healthy and abnormal cell states
are ‘alternative sides of the same coin’—a feature not manifest
in the traditional notion of specific linear pathways implicated
in individual ‘hallmarks’ of cancer [84,85]. Here, we tested the
cancer attractor concept, which has a solid foundation in a
formal framework, but typically has been articulated in generic
terms. We link it for the first time to specific biological obser-
vations, both in terms of the network topology (by modelling
experimentally tested molecular interactions) and network

rsob.roy
11
on June 20, 2018http://rsob.royalsocietypublishing.org/Downloaded from
dynamics (by comparing measured transcriptomes with
predicted attractors). We show high consistency in that
our network model predicted features of CRC including its
diversity among individual patients.
alsocietypublishing.orgOpen
Biol.7:170169
4. Material and methods4.1. Network constructionThe construction of the network followed an incremental pro-
cedure aimed at capturing the essential features of CRC while
keeping the network to the core level. To start with, we first
built a minimal cellular model, with cell cycle, apoptosis,
growth factor signalling, immune response and stress
response modules, similar to previous works [9–12]. Mol-
ecules and molecular pathways well established in cancer,
such as PTEN, p53, Myc, Ras and NF-kB, were in this mini-
mal model. Then we added several additional modules
specific to CRC. First, Cdx2 [86] and Notch signalling path-
way [87] were included for their role in intestinal
differentiation. Cdx2, HNF1 and Gata family were added
for their indispensable roles for intestinal function [44]. Wnt
[88,89], SHH and BMP signalling pathways [90–92] were
also included for mesoderm development. Wnt signalling is
active in posterior endoderm in early mouse development.
Wnt induces Cdx2, a cell fate switch of intestinal differen-
tiation [93]. Glucocorticoid pathway was included for its
effect on GI mucosa [94] and PPARg for inhibiting intestinal
inflammation [95,96]. We explored inflammation beyond
NF-kB pathway, into haematopoiesis because of many
shared transcription factors in CRC and leukaemia. One poss-
ible feedback link is Runx1, which is often over-expressed in
CRC. Runx1 is both a gastric gene and indispensable in haema-
topoiesis, and associates with the myeloid leukaemia [97–99].
A number of leukaemia-related genes and molecular signal-
ling pathways (Hox family, Pu.1, IL3) were also added for
their possible role in immune response. Finally, angiogenesis
and metastasis modules were included in the model.
4.2. Network modellingThe dynamical model for the CRC network was constructed
based on a framework of the endogenous molecular–cellular
network proposed previously [7,8]. Endogenous network
models have been built for hepatocellular [9], prostate [10]
and gastric cancers [11], as well as acute promyelocytic leukae-
mia [12]. As detailed knowledge about the interactions
between the network nodes (e.g. in vivo parameters) is usually
absent, a coarse-grained modelling of the network dynamics
was employed. The interactions between the network nodes
(agents) were described by activation/inhibition using
differential equations [9–12], as a refinement of coarser
descriptions such as the threshold Boolean network [100,101].
The dynamical equations for the concentration/activity
of an agent xi under the influence of other agents
x ¼ ðx1, x2, . . . , xnÞ take the following form:
dxi
dt¼ fiðxÞ �
xi
ti:
This expression consists of a generation term and a degra-
dation term, which is consistent with the chemical rate
equation. The degradation time is set to be unity for all
agents (i.e. ti ¼ 1). The underlying assumption is that the
baseline decay times for the agents are of the same order of
magnitude. Although protein degradation time may vary sig-
nificantly, most of the agents in the network for the core
endogenous interactions operate at the regulatory level rel-
evant to cell proliferation and death. It has been shown that
the lifetimes of more than 4000 proteins in a non-dividing
mammalian cell are narrowly distributed, with a median
value of 35.5 h [102]. No structural proteins with a long life-
time are included in the model. For the signal transduction
processes, the signalling pathways are treated as a whole
until downstream transcription takes effect, avoiding the
possible short response time of the initial stages. The active
regulations of protein degradation, such as the regulation of
PTEN stability, are included as activation/inhibition in the
network [103].
Here, we use a nonlinear Hill function to implement the
coarse-grained activation and inhibition. For example (see
electronic supplementary material, table S1), HNF1 is acti-
vated by HNF4 a and Notch, and inhibited by C/EBP a;
the equation has the form
dxHNF1
dt¼
aðxnHNF4a þ xn
NotchÞ1þ aðxn
HNF4a þ xnNotchÞ
� 1
1þ axnC=EBPa
� xHNF1:
In general, if an agent x is activated by agents y1, y2, . . . , yk
and inhibited by agents z1, z2, . . . , zl, we have
dxdt¼ aSk
i¼1 yni
1þ aSki¼1 yn
i
� 1
1þ aSli¼1 zn
i
� x,
where two parameters n and a can be tuned in the equation.
Note that our differential equation modelling results are con-
sistent with those from the parameter-free Boolean dynamics
(see electronic supplementary material, table S6), such that
the model is intrinsically not sensitive to parameters. Our
large-scale random parameter tests also validate this point
(see electronic supplementary material, figure S2).
The value for each agent is normalized from zero to one.
The dynamics have a conservation property: they will keep
the value of each agent normalized (between zero and one).
A full list of 89 equations can be viewed in the electronic sup-
plementary material. The equations can generate several local
attractors with biological significance. In this CRC model, we
obtained 10 attractors, as well as 14 saddle points and seven
other unstable fixed points (shown in electronic supplemen-
tary material, table S3 and table S7 separately). A series of
random searches crossing several magnitudes in the number
of random initial points are executed. It turns out that no
new attractors can be found, which means the results may
cover the major attractors that are biologically stable (with a
relatively large attractive basin) in the state space.
To validate the modelling results: (i) we use both New-
ton’s iteration method and Euler’s method separately to
obtain attractors from the differential equations (electronic
supplementary material, table S3); (ii) we made a series of
random parameter tests (see electronic supplementary
material, figure S2) that allow independent random Hill coef-
ficient n and prefactor a for each interaction (total of 525
interactions), and the obtained results are almost invariant;
(iii) we used alternative forms of equations and the attractors
are reproduced (electronic supplementary material, tables S4
and S5); and (iv) we computed the Boolean network model
and found the result supports nine of the 10 attractors

rsob.royalsocietypublishing.orgOpen
Biol.7:170169
12
on June 20, 2018http://rsob.royalsocietypublishing.org/Downloaded from
obtained from the differential equations (see electronic sup-
plementary material, table S6).
4.3. Sample collection and microarray experimentsColorectal tumour and normal tissue specimens from 26 CRC
patients with clinical outcome and three healthy individuals
were collected from the second affiliated hospital of Zhejiang
University. All samples were concurrently analysed using
Affymetrix Human Genome U133 Plus 2.0 microarrays.
The extraction of RNA was performed following standard
protocols provided by the manufacturers.
4.4. Microarray data analysesFor gene expression analysis, tumour and adjacent normal tis-
sues were investigated using an Affymetrix Human Genome
U133 Plus 2.0 microarray. Data were acquired by GENECHIP
operating software v. 1.4. After quality checks, raw intensity
data were processed by quantile normalization with robust
multi-array average to remove systematic bias using Affymetrix
EXPRESSION CONSOLE v. 1.12. The complete table of microarray
data with recognized gene symbol and function is provided in
electronic supplementary material, file S2.
Ethics. The Ethics Committee of the Second Affiliated Hospital, Zhe-jiang University School of Medicine approved this study. Writteninformed consent for participation was obtained from each patient.
Data accessibility. All data of this work are available in the electronic sup-plementary material.
Authors’ contributions. R.Y., X.Z. and P.A. constructed endogenous net-work, performed data and model analyses; Su.Z., J.Y., Y.H., D.L.and Sh.Z. collected and analysed data from patients; X.Z., R.Y.,P.A., Su.Z., Sh.Z. and L.H. conceived the study; all authors wrotethe manuscript.
Competing interests. We declare we have no competing interests.
Funding. This work was supported in part by the Natural ScienceFoundation of China No. NSFC91329301 and No. NSFC91529306;and by the grants from the State Key Laboratory of Oncogenes andRelated Genes (No. 90-10-11).
References
1. US Cancer Statistics Working Group. 2014 UnitedStates cancer statistics: 1999 – 2010 incidence andmortality web-based report. Atlanta, GA:Department of Health and Human Services, Centersfor Disease Control and Prevention.
2. Yang L, Parkin DM, Li LD, Chen YD, Bray F. 2004Estimation and projection of the national profile ofcancer mortality in China: 1991 – 2005. Br. J. Cancer90, 2157 – 2166. (doi:10.1038/sj.bjc.6601813)
3. Sung JJ et al. 2008 Asia Pacific consensusrecommendations for colorectal cancer screening. Gut57, 1166 – 1176. (doi:10.1136/gut.2007.146316)
4. Heinemann V, Douillard JY, Ducreux M, Peeters M.2013 Targeted therapy in metastatic colorectalcancer—an example of personalised medicine inaction. Cancer Treat. Rev. 39, 592 – 601. (doi:10.1016/j.ctrv.2012.12.011)
5. Chan AT, Giovannucci EL. 2010 Primary preventionof colorectal cancer. Gastroenterology 138,2029 – 2043. (doi:10.1053/j.gastro.2010.01.057)
6. Zamanianazodi M, Rezaeitavirani M, Hasanzadeh H,Rahmati RS, Dalilan S. 2015 Introducing biomarker panelin esophageal, gastric, and colon cancers; a proteomicapproach. Gastroenterol. Hepatol. Bed Bench 8, 6 – 18.
7. Ao P, Galas D, Hood L, Zhu X. 2008 Cancer as robustintrinsic state of endogenous molecular-cellularnetwork shaped by evolution. Med. Hypotheses 70,678 – 684. (doi:10.1016/j.mehy.2007.03.043)
8. Yuan R, Zhu X, Wang G, Li S, Ao P. 2017 Cancer asrobust intrinsic state shaped by evolution: a keyissues review. Rep. Prog. Phys. 80, 042701. (doi:10.1088/1361-6633/aa538e)
9. Wang G-W, Zhu X-M, Gu J-R, Ao P. 2014Quantitative implementation of the endogenousmolecular-cellular network hypothesis inhepatocellular carcinoma. Interface Focus 4,20130064. (doi:10.1098/rsfs.2013.0064)
10. Zhu X, Yuan R, Hood L, Ao P. 2015 Endogenousmolecular-cellular hierarchical modeling of prostate
carcinogenesis uncovers robust structure. Prog.Biophys. Mol. Biol. 117, 30 – 42. (doi:10.1016/j.pbiomolbio.2015.01.004)
11. Li S, Zhu X, Liu B, Wang G, Ao P. 2015 Endogenousmolecular network reveals two mechanisms ofheterogeneity within gastric cancer. Oncotarget 6,13 607 – 13 627. (doi:10.18632/oncotarget.3633)
12. Yuan R, Zhu X, Radich JP, Ao P. 2016 Frommolecular interaction to acute promyelocyticleukemia: calculating leukemogenesis and remissionfrom endogenous molecular-cellular network. Sci.Rep. 6, 24307. (doi:10.1038/srep24307)
13. Manfredi S, Lepage C, Hatem C, Coatmeur O, FaivreJ, Bouvier A-M. 2006 Epidemiology andmanagement of liver metastases from colorectalcancer. Ann. Surg. 244, 254 – 259. (doi:10.1097/01.sla.0000217629.94941.cf )
14. Leporrier J, Maurel J, Chiche L, Bara S, Segol P,Launoy G. 2006 A population-based study of theincidence, management and prognosis of hepaticmetastases from colorectal cancer. Br. J. Surg. 93,465 – 474. (doi:10.1002/bjs.5278)
15. Cummings LC, Payes JD, Cooper GS. 2007 Survivalafter hepatic resection in metastatic colorectalcancer: a population-based study. Cancer 109,718 – 726. (doi:10.1002/cncr.22448)
16. Yeh JJ et al. 2009 KRAS/BRAF mutation status andERK1/2 activation as biomarkers for MEK1/2inhibitor therapy in colorectal cancer. Mol. CancerTher. 8, 834. (doi:10.1158/1535-7163.MCT-08-0972)
17. Sammalkorpi H, Alhopuro P, Lehtonen R, Tuimala J,Mecklin J-P, Jarvinen HJ, Jiricny J, Karhu A,Aaltonen LA. 2007 Background mutation frequencyin microsatellite-unstable colorectal cancer. CancerRes. 67, 5691 – 5698. (doi:10.1158/0008-5472.CAN-06-4314)
18. Roepman P et al. 2014 Colorectal cancer intrinsicsubtypes predict chemotherapy benefit, deficientmismatch repair and epithelial-to-mesenchymal
transition. Int. J. Cancer 134, 552 – 562. (doi:10.1002/ijc.28387)
19. Ogino S. 2009 CpG island methylator phenotype,microsatellite instability, BRAF mutation and clinicaloutcome in colon cancer. Gut 58, 90 – 96. (doi:10.1136/gut.2008.155473)
20. Marisa L et al. 2013 Gene expression classification ofcolon cancer into molecular subtypes:characterization, validation, and prognostic value.PLoS Med. 10, e1001453. (doi:10.1371/journal.pmed.1001453)
21. Sztupinszki Z, Gyorffy B. 2016 Colon cancersubtypes: concordance, effect on survival andselection of the most representative preclinicalmodels. Sci. Rep. 6, 37169. (doi:10.1038/srep37169)
22. Guinney J et al. 2015 The consensus molecularsubtypes of colorectal cancer. Nat. Med. 21,1350 – 1356. (doi:10.1038/nm.3967)
23. Wang G, Su H, Yu H, Yuan R, Zhu X, Ao P. 2016Endogenous network states predict gain or loss offunctions for genetic mutations in hepatocellularcarcinoma. J. R. Soc. Interface 13, 20151115.(doi:10.1098/rsif.2015.1115)
24. Waddington CH. 1957 The strategy of the genes: adiscussion of some aspects of theoretical biology.New York, NY: Macmillan.
25. Waddington CH. 1977 Tools for thought: how tounderstand and apply the latest scientific techniquesof problem solving. St Albans, UK: Paladin.
26. Delbruck M. 1949 Unites biologiques douees decontinuite genetique Colloques Internationaux ducentre national de la Recherche Scientifique, pp 33 –35. Paris, France: CNRS.
27. Monod J, Jacob F. 1961 General conclusions:teleonomic mechanisms in cellular metabolism,growth, and differentiation. In Cold Spring HarborSymposia on Quantitative Biology (ed. L Frisch), pp.389 – 401. Cold Spring Harbor, NY: Cold SpringHarbor Laboratory Press.
rsob.royalsocietypublishing.orgOpen
Biol.7:170169
13
on June 20, 2018http://rsob.royalsocietypublishing.org/Downloaded from
28. Dean ACR, Hinshelwood C. 1963 Integration of cellreactions. Nature 199, 7 – 11. (doi:10.1038/199007a0)
29. Kauffman SA. 1969 Metabolic stability andepigenesis in randomly constructed genetic nets.J. Theor. Biol. 22, 437 – 467. (doi:10.1016/0022-5193(69)90015-0)
30. Huang S, Eichler G, Bar-Yam Y, Ingber DE. 2005 Cellfates as high-dimensional attractor states of acomplex gene regulatory network. Phys. Rev. Lett.94, 128701. (doi:10.1103/PhysRevLett.94.128701)
31. Chang HH, Hemberg M, Barahona M, Ingber DE,Huang S. 2008 Transcriptome-wide noise controlslineage choice in mammalian progenitor cells.Nature 453, 544 – 547. (doi:10.1038/nature06965)
32. Shih W, Chetty R, Tsao M-S. 2005 Expressionprofiling by microarrays in colorectal cancer. Oncol.Rep. 13, 517 – 524.
33. Ahmed S, Banerjea A, Hands RE, Bustin S, Dorudi S.2005 Microarray profiling of colorectal cancer inBangladeshi patients. Colorectal Dis. 7, 571 – 575.(doi:10.1111/j.1463-1318.2005.00818.x)
34. Vogelstein B, Kinzler KW. 2004 Cancer genes andthe pathways they control. Nat. Med. 10, 789 – 799.(doi:10.1038/nm1087)
35. Wood LD et al. 2007 The genomic landscapes ofhuman breast and colorectal cancers. Science 318,1108 – 1113. (doi:10.1126/science.1145720)
36. Vogelstein B, Papadopoulos N, Velculescu VE, ZhouS, Diaz LA, Kinzler KW. 2013 Cancer genomelandscapes. Science 339, 1546 – 1558. (doi:10.1126/science.1235122)
37. Simiantonaki N, Taxeidis M, Jayasinghe C,Kirkpatrick CJ. 2007 Epithelial expression of VEGFreceptors in colorectal carcinomas and theirrelationship to metastatic status. Anticancer Res. 27,3245 – 3250.
38. Okubo T, Hogan BL. 2004 Hyperactive Wnt signalingchanges the developmental potential of embryoniclung endoderm. J. Biol. 3, 11. (doi:10.1186/jbiol3)
39. Hirsch MW, Smale S. 1974 Differential equations,dynamical systems, and linear algebra. San Diego,CA: Academic Press.
40. Zhu X-M, Yin L, Hood L, Ao P. 2004 Calculatingbiological behaviors of epigenetic states in thephage lambda life cycle. Funct. Integr. Genomics 4,188 – 195. (doi:10.1007/s10142-003-0095-5)
41. Zorn AM, Wells JM. 2009 Vertebrate endodermdevelopment and organ formation. Annu. Rev. CellDev. Biol. 25, 221. (doi:10.1146/annurev.cellbio.042308.113344)
42. Lin AY et al. 2011 Comparative profiling of primarycolorectal carcinomas and liver metastases identifiesLEF1 as a prognostic biomarker. PLoS ONE 6,e16636. (doi:10.1371/journal.pone.0016636)
43. Zhao M, Liang F, Zhang B, Yan W, Zhang J. 2015The impact of osteopontin on prognosis andclinicopathology of colorectal cancer patients: asystematic meta-analysis. Sci. Rep. 5, 12713.(doi:10.1038/srep12713)
44. Bosse T, Fialkovich JJ, Piaseckyj CM, Beuling E,Broekman H, Grand RJ, Montgomery RK, KrasinskiSD. 2007 Gata4 and Hnf1alpha are partially required
for the expression of specific intestinal genes duringdevelopment. Am. J. Physiol. Gastrointest. LiverPhysiol. 292, G1302 – G1314. (doi:10.1152/ajpgi.00418.2006)
45. Ye DZ, Kaestner KH. 2009 Foxa1 and Foxa2 controlthe differentiation of goblet and enteroendocrineL- and D-cells in mice. Gastroenterology 137,2052 – 2062. (doi:10.1053/j.gastro.2009.08.059)
46. Bastide P et al. 2007 Sox9 regulates cellproliferation and is required for Paneth celldifferentiation in the intestinal epithelium. J. CellBiol. 178, 635 – 648. (doi:10.1083/jcb.200704152)
47. Mori-Akiyama Y, van den Born M, van Es JH,Hamilton SR, Adams HP, Zhang J, Clevers H, deCrombrugghe B. 2007 SOX9 is required for thedifferentiation of paneth cells in the intestinalepithelium. Gastroenterology 133, 539 – 546.(doi:10.1053/j.gastro.2007.05.020)
48. Brock A, Chang H, Huang S. 2009 Non-geneticheterogeneity—a mutation-independent drivingforce for the somatic evolution of tumours. Nat. Rev.Genet. 10, 336 – 342. (doi:10.1038/nrg2556)
49. Marusyk A, Almendro V, Polyak K. 2012 Intra-tumourheterogeneity: a looking glass for cancer? Nat. Rev.Cancer 12, 323 – 334. (doi:10.1038/nrc3261)
50. Cancer Genome Atlas N. 2012 Comprehensivemolecular characterization of human colon andrectal cancer. Nature 487, 330 – 337. (doi:10.1038/nature11252)
51. Rebouissou S, Imbeaud S, Balabaud C, Boulanger V,Bertrand-Michel J, Terce F, Auffray C, Bioulac-Sage P,Zucman-Rossi J. 2007 HNF1a inactivation promoteslipogenesis in human hepatocellular adenomaindependently of SREBP-1 and carbohydrate-response element-binding protein (ChREBP)activation. J. Biol. Chem. 282, 14 437 – 14 446.(doi:10.1074/jbc.M610725200)
52. Tateossian H, Morse S, Parker A, Mburu P, Warr N,Acevedo-Arozena A, Cheeseman M, Wells S, BrownSDM. 2013 Otitis media in the Tgif knockout mouseimplicates TGFbeta signalling in chronic middle earinflammatory disease. Hum. Mol. Genet. 22,2553 – 2565. (doi:10.1093/hmg/ddt103)
53. Hu Y, Yu H, Shaw G, Renfree MB, Pask AJ. 2011Differential roles of TGIF family genes inmammalian reproduction. BMC Dev. Biol. 11, 58.(doi:10.1186/1471-213X-11-58)
54. Cooper BW, Cho TM, Thompson PM, Wallace AD.2008 Phthalate induction of CYP3A4 is dependenton glucocorticoid regulation of PXR expression.Toxicol. Sci. 103, 268 – 277. (doi:10.1093/toxsci/kfn047)
55. Webster MK, Goya L, Ge Y, Maiyar A, Firestone G.1993 Characterization of sgk, a novel member of theserine/threonine protein kinase gene family whichis transcriptionally induced by glucocorticoids andserum. Mol. Cell. Biol. 13, 2031 – 2040. (doi:10.1128/MCB.13.4.2031)
56. Kawamoto T et al. 1992 Role of steroid11beta-hydroxylase and steroid 18-hydroxylasein the biosynthesis of glucocorticoids andmineralocorticoids in humans. Proc. Natl Acad. Sci.USA 89, 1458 – 1462. (doi:10.1073/pnas.89.4.1458)
57. Bourillot PY, Aksoy I, Schreiber V, Wianny F, SchulzH, Hummel O, Hubner N, Savatier P. 2009 NovelSTAT3 target genes exert distinct roles in theinhibition of mesoderm and endodermdifferentiation in cooperation with Nanog. StemCells 27, 1760 – 1771. (doi:10.1002/stem.110)
58. Wang YK, Zhu YL, Qiu FM, Zhang T, Chen ZG, ZhengS, Huang J. 2010 Activation of Akt and MAPKpathways enhances the tumorigenicity of CD133þ
primary colon cancer cells. Carcinogenesis 31,1376 – 1380. (doi:10.1093/carcin/bgq120)
59. Khirade MF, Lal G, Bapat SA. 2015 Derivation of afifteen gene prognostic panel for six cancers. Sci.Rep. 5, 13248. (doi:10.1038/srep13248)
60. Paschos KA, Majeed AW, Bird NC. 2014 Naturalhistory of hepatic metastases from colorectal cancer-pathobiological pathways with clinical significance.World J. Gastroenterol. 20, 3719. (doi:10.3748/wjg.v20.i14.3719)
61. Park ET, Gum JR, Kakar S, Kwon SW, Deng G, KimYS. 2008 Aberrant expression of SOX2 upregulatesMUC5AC gastric foveolar mucin in mucinous cancersof the colorectum and related lesions. Int. J. Cancer122, 1253 – 1260. (doi:10.1002/ijc.23225)
62. Byrd JC, Bresalier RS. 2004 Mucins and mucinbinding proteins in colorectal cancer. CancerMetastasis Rev. 23, 77 – 99. (doi:10.1023/A:1025815113599)
63. Kim DH, Kim JW, Cho JH, Baek SH, Kakar S, Kim GE,Sleisenger MH, Kim YS. 2005 Expression of mucincore proteins, trefoil factors, APC and p21 in subsetsof colorectal polyps and cancers suggests a distinctpathway of pathogenesis of mucinous carcinoma ofthe colorectum. Int. J. Cancer 27, 957 – 964. (doi:10.3892/ijo.27.4.957)
64. Huang S, Guo YP, May G, Enver T. 2007 Bifurcationdynamics in lineage-commitment in bipotentprogenitor cells. Dev. Biol. 305, 695 – 713. (doi:10.1016/j.ydbio.2007.02.036)
65. Huang S, Kauffman S. 2013 How to escape thecancer attractor: rationale and limitations of multi-target drugs. Semin. Cancer Biol. 23, 270 – 278.(doi:10.1016/j.semcancer.2013.06.003)
66. Freidlin MI, Wentzell AD. 2012 Randomperturbations of dynamical systems, 3rd edn. Berlin,Germany: Springer.
67. Ao P. 2005 Laws in Darwinian evolutionary theory.Phys. Life Rev. 2, 117 – 156. (doi:10.1016/j.plrev.2005.03.002)
68. Zhou JX, Aliyu MDS, Aurell E, Huang S. 2012 Quasi-potential landscape in complex multi-stablesystems. J. R. Soc. Interface 9, 3539 – 3553. (doi:10.1098/rsif.2012.0434)
69. Wang X, Lei T, Ma X. 2001 Colon cancer risk factorsin Jiashan county, Zhejiang province, the highestincidence area in China. Chin. J. Oncol. 23,480 – 482.
70. Van Faassen A, Tangerman A, Bueno-de-MesquitaBH. 2004 Serum bile acids and risk factors forcolorectal cancer. Br. J. Cancer 90, 632 – 634.(doi:10.1038/sj.bjc.6601608)
71. Slattery ML, Fitzpatrick F. 2009 Convergence ofhormones, inflammation, and energy-related

rsob.royalsocietypublishing.orgOpen
Biol.7:170169
14
on June 20, 2018http://rsob.royalsocietypublishing.org/Downloaded from
factors: a novel pathway of cancer etiology. CancerPrev. Res. 2, 922 – 930. (doi:10.1158/1940-6207.CAPR-08-0191)
72. Trinchieri G. 2012 Cancer and inflammation: an oldintuition with rapidly evolving new concepts. Annu.Rev. Immunol. 30, 677 – 706. (doi:10.1146/annurev-immunol-020711-075008)
73. Fordyce CA, Patten KT, Fessenden TB, DeFilippis R,Hwang ES, Zhao J, Tlsty TD. 2012 Cell-extrinsicconsequences of epithelial stress: activation ofprotumorigenic tissue phenotypes. Breast CancerRes. 14, R155. (doi:10.1186/bcr3368)
74. Huang S. 2011 On the intrinsic inevitability ofcancer: from foetal to fatal attraction. Semin. CancerBiol. 21, 183 – 199. (doi:10.1016/j.semcancer.2011.05.003)
75. Miyoshi K et al. 2001 Signal transducer andactivator of transcription (Stat) 5 controls theproliferation and differentiation of mammaryalveolar epithelium. J. Cell Biol. 155, 531 – 542.(doi:10.1083/jcb.200107065)
76. Gilbert S, Zhang R, Denson L, Moriggl R,Steinbrecher K, Shroyer N, Lin J, Han X. 2012Enterocyte STAT5 promotes mucosal wound healingvia suppression of myosin light chain kinase-mediated loss of barrier function and inflammation.EMBO Mol. Med. 4, 109 – 124. (doi:10.1002/emmm.201100192)
77. Rios P, Li X, Kohn M. 2013 Molecular mechanismsof the PRL phosphatases. FEBS J. 280, 505 – 524.(doi:10.1111/j.1742-4658.2012.08565.x)
78. Zhou J et al. 2011 PRL-3, a metastasis associatedtyrosine phosphatase, is involved in FLT3-ITDsignaling and implicated in anti-AML therapy. PLoSONE 6, e19798. (doi:10.1371/journal.pone.0019798)
79. Burnet FM. 1970 The concept of immunologicalsurveillance. Prog. Exp. Tumor. Res. 13, 1 – 27.(doi:10.1159/000386035)
80. Corthay A. 2014 Does the immune system naturallyprotect against cancer? Front. Immunol. 5, 197.(doi:10.3389/fimmu.2014.00197)
81. Prehn RT. 2010 The initial immune reaction to anew tumor antigen is always stimulatory andprobably necessary for the tumor’s growth. Clin.Dev. Immunol. 2010, 5. (doi:10.1155/2010/851728)
82. Disis ML. 2010 Immune regulation of cancer. J. Clin.Oncol. 28, 4531 – 4538. (doi:10.1200/JCO.2009.27.2146)
83. Draghiciu O, Nijman HW, Daemen T. 2011 Fromtumor immunosuppression to eradication: targetinghoming and activity of immune effector cells totumors. Clin. Dev. Immunol. 2011, 439053. (doi:10.1155/2011/439053)
84. Hanahan D, Weinberg RA. 2011 Hallmarks ofcancer: the next generation. Cell 144, 646 – 674.(doi:10.1016/j.cell.2011.02.013)
85. Breitkreutz D, Hlatky L, Rietman E, Tuszynski JA.2012 Molecular signaling network complexity is
correlated with cancer patient survivability. Proc.Natl Acad. Sci. USA 109, 9209 – 9212. (doi:10.1073/pnas.1201416109)
86. Sherwood RI, Maehr R, Mazzoni EO, Melton DA.2011 Wnt signaling specifies and patterns intestinalendoderm. Mech. Dev. 128, 387 – 400. (doi:10.1016/j.mod.2011.07.005)
87. Stanger BZ, Datar R, Murtaugh LC, Melton DA. 2005Direct regulation of intestinal fate by Notch. Proc.Natl Acad. Sci. USA 102, 12 443 – 12 448. (doi:10.1073/pnas.0505690102)
88. Theodosiou NA, Tabin CJ. 2003 Wnt signalingduring development of the gastrointestinal tract.Dev. Biol. 259, 258 – 271. (doi:10.1016/S0012-1606(03)00185-4)
89. Korinek V, Barker N, Moerer P, van Donselaar E, HulsG, Peters PJ, Clevers H. 1998 Depletion of epithelialstem-cell compartments in the small intestine ofmice lacking Tcf-4. Nat. Genet. 19, 379 – 383.(doi:10.1038/1270)
90. Roberts DJ. 2000 Molecular mechanisms ofdevelopment of the gastrointestinal tract. Dev. Dyn.219, 109 – 120. (doi:10.1002/1097-0177(2000)9999:9999,::AID-DVDY1047.3.3.CO;2-Y)
91. Kedinger M, Simon-Assmann P, Bouziges F, ArnoldC, Alexandra E, Haffen K. 1990 Smooth muscle actinexpression during rat gut development andinduction in fetal skin fibroblastic cells associatedwith intestinal embryonic epithelium. Differentiation43, 87 – 97. (doi:10.1111/j.1432-0436.1990.tb00434.x)
92. Apelqvist A, Ahlgren U, Edlund H. 1997 Sonichedgehog directs specialised mesodermdifferentiation in the intestine and pancreas. Curr.Biol. 7, 801 – 804. (doi:10.1016/S0960-9822(06)00340-X)
93. Gao N, White P, Kaestner KH. 2009 Establishment ofintestinal identity and epithelial – mesenchymalsignaling by Cdx2. Dev. Cell 16, 588 – 599. (doi:10.1016/j.devcel.2009.02.010)
94. Quaroni A, Tian JQ, Goke M, Podolsky DK. 1999Glucocorticoids have pleiotropic effects on smallintestinal crypt cells. Am. J. Physiol. 277,G1027 – G1040.
95. Su CG et al. 1999 A novel therapy for colitis utilizingPPAR-gamma ligands to inhibit the epithelialinflammatory response. J. Clin. Invest. 104, 383.(doi:10.1172/JCI7145)
96. Dubuquoy L, Jansson EA, Deeb S, Rakotobe S,Karoui M, Colombel J-F, Auwerx J, Pettersson S,Desreumaux P. 2003 Impaired expression ofperoxisome proliferator-activated receptor gammain ulcerative colitis. Gastroenterology 124,1265 – 1276. (doi:10.1016/S0016-5085(03)00271-3)
97. Pradhan MP, Prasad NK, Palakal MJ. 2012 A systemsbiology approach to the global analysis oftranscription factors in colorectal cancer. BMC Cancer12, 331. (doi:10.1186/1471-2407-12-331)
98. Scheitz CJF, Lee TS, McDermitt DJ, Tumbar T. 2012Defining a tissue stem cell-driven Runx1/Stat3signalling axis in epithelial cancer. EMBO J. 31,4124 – 4139. (doi:10.1038/emboj.2012.270)
99. Levanon D et al. 2001 Spatial and temporalexpression pattern of Runx3 (Aml2) and Runx1(Aml1) indicates non-redundant functions duringmouse embryogenesis. Mech. Dev. 109, 413 – 417.(doi:10.1016/S0925-4773(01)00537-8)
100. Bornholdt S. 2008 Boolean network models ofcellular regulation: prospects and limitations.J. R. Soc. Interface 5(Suppl. 1), S85 – S94. (doi:10.1098/rsif.2008.0132.focus)
101. Kauffman S, Peterson C, Samuelsson B, Troein C.2003 Random Boolean network models and theyeast transcriptional network. Proc. Natl Acad. Sci.USA 100, 14 796 – 14 799. (doi:10.1073/pnas.2036429100)
102. Cambridge SB, Gnad F, Nguyen C, Bermejo JL,Kruger M, Mann M. 2011 Systems-wide proteomicanalysis in mammalian cells reveals conserved,functional protein turnover. J. Proteome Res. 10,5275 – 5284. (doi:10.1021/pr101183k)
103. Chen Z et al. 2005 Crucial role of p53-dependentcellular senescence in suppression of Pten-deficienttumorigenesis. Nature 436, 725 – 730. (doi:10.1038/nature03918)
104. Theilgaard-Monch K, Jacobsen LC, Borup R,Rasmussen T, Bjerregaard MD, Nielsen FC, CowlandJB, Borregaard N. 2005 The transcriptional programof terminal granulocytic differentiation. Blood 105,1785 – 1796. (doi:10.1182/blood-2004-08-3346)
105. Hollnagel A, Oehlmann V, Heymer J, Ruther U,Nordheim A. 1999 Id genes are direct targets ofbone morphogenetic protein induction in embryonicstem cells. J. Biol. Chem. 274, 19 838 – 19 845.(doi:10.1074/jbc.274.28.19838)
106. Dai X et al. 2013 Requirement for integrin-linkedkinase in neural crest migration and differentiationand outflow tract morphogenesis. BMC Biol. 11,107. (doi:10.1186/1741-7007-11-107)
107. Bhatia B, Hsieh M, Kenney AM, Nahle Z. 2011Mitogenic sonic hedgehog signaling drives E2F1-dependent lipogenesis in progenitor cells andmedulloblastoma. Oncogene 30, 410 – 422. (doi:10.1038/onc.2010.454)
108. Craven SE, Lim KC, Ye W, Engel JD, de Sauvage F,Rosenthal A. 2004 Gata2 specifies serotonergicneurons downstream of sonic hedgehog.Development 131, 1165 – 1173. (doi:10.1242/dev.01024)
109. Wang X, Shi M, Li H, Wang N. 2011 Hedgehogsignaling pathway and adipogenesis. Chin. J. CellBiol. 8, 017.
110. Suh JM, Gao X, McKay J, McKay R, Salo Z, Graff JM.2006 Hedgehog signaling plays a conserved role ininhibiting fat formation. Cell. Metab. 3, 25 – 34.(doi:10.1016/j.cmet.2005.11.012)


![Rab1 interacts with GOLPH3 and controls Golgi structure ...rsob.royalsocietypublishing.org/content/royopenbio/7/1/...related macular degeneration [3], Lowe syndrome [4], female infertility](https://img.pdfslide.net/doc/110x75/5ac77fbd7f8b9aa3298b4c95/rab1-interacts-with-golph3-and-controls-golgi-structure-rsobro-macular-degeneration.jpg)

![The reverse, but coordinated, roles of Tor2 (TORC1) and ...rsob.royalsocietypublishing.org/content/royopenbio/1/3/110007.full.pdf · Cut2 is a chaperon-inhibitor for Cut1 [39,40]](https://img.pdfslide.net/doc/110x75/5acdd39e7f8b9a27628e1a86/the-reverse-but-coordinated-roles-of-tor2-torc1-and-rsobro-is-a-chaperon-inhibitor.jpg)

![ESCRT-II controls retinal axon growth by regulating DCC ...rsob.royalsocietypublishing.org/content/royopenbio/6/4/150218.full.pdf · cytosis and local protein synthesis (LPS) [5]](https://img.pdfslide.net/doc/110x75/5ad7a2907f8b9a991b8c5247/escrt-ii-controls-retinal-axon-growth-by-regulating-dcc-rsobro-and-local-protein.jpg)