Embed Size (px)
Citation preview
* Policy Analyst, RAND, Santa Monica, California. LL.B., 1992, University ofMelbourne; M.P.H., Sc.D., 1998, Harvard School of Public Health.
** Professor of Law and Public Health, Harvard School of Public Health; Professor ofMedicine, Harvard Medical School; President, Brigham and Women’s Physician Organization.M.A., 1978, Oxford University; M.P.H., M.D., J.D., 1984, Yale University. Professor Brennan wasthe 1997 McDonald-Merrill-Ketcham Lecturer. The McDonald-Merrill-Ketcham Lecture andAward was initiated through a joint bequest to the Indiana University Schools of Medicine andLaw—Indianapolis by Dorothy M. Ketcham. The award is designed to bridge the gap between lawand medicine through honoring an individual, distinguished in both fields, who will share theirexpertise with students, faculty, and leaders of the medical and legal professions.
*** Assistant Professor of Medicine, University of Texas Medical School. M.D., 1989,University of Texas Southwestern Medical School; M.P.H., 1992, Harvard School of Public Health.
1. See GUIDO CALABRESI, THE COSTS OF ACCIDENTS: A LEGAL AND ECONOMIC ANALYSIS
(1970).
2. See generally STEPHEN J. CARROLL ET AL., NO-FAULT APPROACHES TO COMPENSATING
Indiana Law ReviewVolume 33 2000 Number 4
ARTICLE
BEYOND DEAD RECKONING: MEASURES OF MEDICAL
INJURY BURDEN, MALPRACTICE LITIGATION, AND
ALTERNATIVE COMPENSATION MODELS FROM
UTAH AND COLORADO
DAVID M. STUDDERT*
TROYEN A. BRENNAN**
ERIC J. THOMAS***
INTRODUCTION
In the three decades since Guido Calabresi’s landmark study of accidents,1
interest in the empirical examination of tort law has flourished. Torts, unlikemany branches of law, is particularly amenable to quantitative analysis. Tortsusually involve discrete, identifiable events that feed into large, accessiblerepositories of information. Jury verdict reports, administrative data fromliability insurers, and measures of injury rates across specific sectors all providerich opportunities for measurement. Researchers from diverse disciplinarybackgrounds—including law, economics, statistics, management, public health,psychology, operations research, and political science—have taken advantage ofthese data sources, and have begun to sketch a fairly detailed picture of therelationship between injuries, claims, compensation, and behavioral responsesto litigation. 2
1644 INDIANA LAW REVIEW [Vol. 33:1643
PEOPLE INJURED IN AUTOMOBILE ACCIDENTS (1991); PATRICIA M. DANZON, MEDICAL
MALPRACTICE: THEORY, EVIDENCE, AND PUBLIC POLICY (1985); DON DEWEES ET AL., EXPLORING
THE DOMAIN OF ACCIDENT LAW: TAKING THE FACT SERIOUSLY (1996); JAMES K. HAMMITT & JOHN
E. ROLPH, LIMITING LIABILITY FOR AUTOMOBILE ACCIDENTS: ARE NO-FAULT TORT THRESHOLDS
EFFECTIVE? (1985); DEBORAH R. HENSLER ET AL, COMPENSATION FOR ACCIDENTAL INJURIES IN THE
UNITED STATES (1991); Michael J. Saks, Do We Really Know Anything About the Behavior of the
Tort Litigation System—and Why Not?, 140 U. PA. L. REV. 1147 (1992).
3. “Severity,” as it is used here, refers to the dollar magnitude of payments in claims where
the plaintiff obtains such payments, whether by settlement or court judgment.
4. See, e.g., DEWEES ET AL, supra note 2; MICHAEL J. MOORE & W. KIP VISCUSI,
COMPENSATION MECHANISMS FOR JOB RISKS: WAGES, WORKERS’ COMPENSATION AND PRODUCT
LIABILITY (1990); Henry W. Herzog & Alan M. Schlotman, Valuing Risks in the Workplace:
Market Price, Willingness to Pay, and the Optimal Provision of Safety, 72 REV. ECON. &
STATISTICS 463 (1990); W. Kip Viscusi, Liability for Occupational Accidents and Illnesses, in
LIABILITY: PERSPECTIVES AND POLICY (Robert Litan & Clifford Winston eds., 1988).
5. See, e.g., STEVEN GARBER, PRODUCT LIABILITY AND THE ECONOMICS OF
PHARMACEUTICALS AND MEDICAL DEVICES (1993).
6. See, e.g., id.; JAMES S. KAKALIK ET AL., COSTS OF ASBESTOS LITIGATION (1983); W. KIP
VISCUSI, FATAL TRADEOFFS: PUBLIC AND PRIVATE RESPONSIBILITIES FOR RISK (1992).
7. The litigation process should be interpreted broadly here to include alternatives to
litigation, such as arbitration and mediation, along with standard conduits to litigation such as
liability insurance companies.
8. For examples of studies in each of these areas, see Randall R. Bovbjerg et al.,
Administrative Performance of No-Fault Compensation for Medical Injury, 60 LAW & CONTEMP.
PROBS. 1 (differential success rates); Randall R. Bovbjerg et al., Valuing Life and Limb in Tort:
Scheduling “Pain and Suffering,” 83 NW. U. L. REV. 908 (1989) (consistency); James S. Kakalik,
Just “Speedy” and Inexpensive?; Judicial Case Management Under the Civil Justice Reform Act,
80 JUDICATURE 184 (1997) (speed and consistency); Robert MacCoun, Inside the Black Box: What
Empirical Research Tells Us About Decisionmaking by Civil Juries, in VERDICT: ASSESSING THE
Three approaches to the empirical study of torts predominate. The firstapproach is concerned with the consequences of litigation. How do the type,volume, and, severity of litigation affect the behavior of individuals,3
organizations and markets? The deterrence function of tort law is oftenexamined within this framework; for example, in studies that measure the effectof litigation on (would-be) tortfeasors’ safety practices. Other studies in this4
category test the impact of accident litigation on prices of and demand forservices in particular sectors, workers’ wages, and the financial stability of5
firms. 6
A second approach, probably the one most widely pursued in empiricalanalyses of tort law, focuses on the performance of the tort system in a narrowersense. It involves measurement of outcomes directly related to the litigationprocess. Commonly used measures include the speed and consistency of7
resolution, differential success rates among litigants, jury decision-making, andthe impact of litigant characteristics, such as the defendant’s wealth, on theoutcomes of cases. The defining feature of the observations that form the basis8
2000] BEYOND DEAD RECKONING 1645
CIVIL JURY SYSTEM 137, 155-56 (Robert E. Litan ed., 1993) (jury decision-making); Frank A.
Sloan & Chee Ruey Hsieh, Variability in Medical Malpractice Payments: Is the Compensation
Fair?, 24 LAW & SOCIETY REV. 997 (1990) (consistency); Neil Vidmar, Empirical Evidence on the
Deep Pockets Hypothesis: Jury Awards for Pain and Suffering in Medical Malpractice Cases, 43
DUKE L.J. 217 (1993) (litigant characteristics).
9. “Population-based” methods are concerned with investigation of the frequency,
distribution and determinants of specific events (e.g., an injury, claim, or verdict) as they occur in
the real world. Generally, population-based studies proceed by drawing a sample from a larger
population, usually in a random manner, investigating the events of interest in the sample, and then
drawing inferences about the population from the findings. These methods are central to the field
of epidemiology—the study of disease patterns in communities—where population-based analysis,
relying heavily on the mathematical theory of probability, has developed steadily since the mid-
Nineteenth Century. See CHARLES H. HENNEKENS & JULIE E. BURING, EPIDEMIOLOGY IN MEDICINE
3-13 (1987).
10. As these terms are used in epidemiology, “prevalence” refers to the proportion of
individuals in a population who have the disease of interest at a given point in time. “Incidence”
refers to the number of new events or cases of the disease that develop in a population of
individuals during a specified time interval. See id. at 57.
11. See HENSLER ET AL., supra note 2, at 13.
of performance, or process-related, analyses of tort law is entry into the system;thus, the relevant data surface contingent upon the filing of a lawsuit, or when aclaim is made to a private body, such as a commercial insurer, or to a public one,such as a workers’ compensation agency.
A third approach addresses the relationship between the underlying rates ofactionable (or potentially actionable) harms, on the one hand, and claim filingbehavior and litigation, on the other. Because the harms are not necessarilyearmarked by entry into the legal system, no tidy store of data points exists.Rather, investigators must use population-based methods to detect the9
“incidence” and “prevalence” of injuries at their source—locations such ashighways, hospitals, the home, and the workplace. In pursuing these methods,10
investigators tend to borrow heavily from primary data collection techniquesdeveloped in other disciplines, particularly epidemiology and empiricaleconomics.
The infrequency of most injuries in the general population means that largestudy samples must be drawn, which quickly drives up data and laborrequirements, and with them, the price tag for research projects. But population-based studies remain the only way in which a complete picture of access to anduse of the legal system can be assembled; they are unique in their ability toevaluate the compensation and deterrence functions of tort law by taking accountof its full audience—actual, as well as prospective, users. The two leadingexamples of such studies, to date, have employed different data collectionstrategies. Deborah Hensler and her colleagues studied accidental injuries in theUnited States by surveying nearly 26,000 households. The Harvard Medical11
Practice Study searched medical records for documented evidence of iatrogenic
1646 INDIANA LAW REVIEW [Vol. 33:1643
12. See Howard H. Hiatt et al., A Study of Medical Injury and Medical Malpractice, 321
NEW ENG. J. MED. 480, 481-82 (1989); see also Troyen A. Brennan et al., Incidence of Adverse
Events and Negligence in Hospitalized Patients: Results of the Harvard Medical Practices Study
I, 324 NEW ENG. J. MED. 370, 370 (1991).
13. For overviews of empirical work in medical malpractice, see DEWEES ET AL., supra note
2, at 95-187; FRANK A. SLOAN ET AL., SUING FOR MEDICAL MALPRACTICE (1993); PAUL C. WEILER,
MEDICAL MALPRACTICE ON TRIAL (1991).
14. See Daniel Kessler & Mark McClellan, Do Doctors Practice Defensive Medicine?, 111
Q.J. ECON. 353, 386 (1996).
15. See Henry S. Farber & Michelle J. White, A Comparison of Formal and Informal
Dispute Resolution in Medical Malpractice, 23 J. LEGAL STUD. 777, 778 (1994); Mark I. Taragin
et al., The Influence of Standard of Care and Severity of Injury on the Resolution of Medical
Malpractice Claims, 117 ANNALS INTERNAL MED. 780, 783-84 (1992).
16. See, e.g., Thomas B. Metzloff et al., Empirical Perspectives on Mediation and
Malpractice, 60 LAW & CONTEMP. PROBS. 107, 116 (1997).
17. See CAROL J. DE FRANCES ET AL., U.S. DEP’T OF JUSTICE, CIVIL JUSTICE SURVEY OF
STATE COURTS, 1992: CIVIL JURY CASES AND VERDICTS IN LARGE COUNTIES 2 (1995).
18. See WEILER, supra note 13, at 2-5.
injury, reviewing information on more than 30,000 episodes of care. 12
A significant portion of the empirical analysis of tort law reported to date hascentered on the medical malpractice system. A review of the malpracticeliterature reveals numerous examples of each of the three investigationalapproaches outlined above. For example, one recent study of malpractice13
liability reforms tested the effect if laws that had narrowed physicians’ exposureto suit, finding that such laws appeared to reduce hospital expenditures withoutincreasing mortality. Analyses of insurance company records have found that14
compensation reasonably follows negligent injury, while several studies of15
courtroom verdicts have suggested that juries make reasonable assessments ofdamages in malpractice litigation, even agreeing with independent expertassessments. 16
Reasons for the focus on medical malpractice are not difficult to find. First,it accounts for an appreciable share of the tort litigation: excluding automobileaccident litigation, medical malpractice accounts for approximately thirteenpercent of the tort caseload and eighteen percent of cases that proceed to trial.17
Second, public and political unrest about malpractice spiraled along with claimsrates in the mid-1980s, raising its profile as a public policy issue and rousing18
the interest of research funding agencies. Third, and perhaps most significantly,quantitative research into medical malpractice appears to have ridden a wave ofenthusiasm generated by scholars from two major empirical movements of thelast decade—health services research and “law and economics”—converging,and stumbling upon an area of mutual interest. Justifiably, both camps claimimportant perspectives.
Despite an outpouring of malpractice analyses, the Harvard Medical PracticeStudy (“HMPS”), completed in 1991, stands as the sole population-based study
2000] BEYOND DEAD RECKONING 1647
19. See Randall R. Bovbjerg & Frank A. Sloan, No-Fault for Medical Injury: Theory and
Evidence, 67 UNIV. CIN. L. REV. 53, at 56 n.11 (1998).
20. In year 2000 dollars, the total cost of the Harvard Medical Practice Study was
approximately $4.7 million.
21. Iatrogenic injuries are those caused by the diagnosis or manner of treatment by the
physician.
22. CAL. MED. ASS'N & CAL. HOSP. ASS'N, REPORT ON THE MEDICAL INSURANCE
FEASIBILITY STUDY (Don H. Mills ed., 1977); see also Donald Harper Mills, Medical Insurance
Feasibility Study—A Technical Summary, 128 WESTERN J. MED. 360 (1978).
23. See Mills, supra note 22.
in this area. No doubt the principal explanation is cost. Because of the sample19
size demands and the need to obtain specific information on each injury andclaim, the resource requirements for population-based studies are generallyprohibitive.20
From 1995 to 1998, we had the opportunity to conduct a research project inUtah and Colorado designed to test the HMPS results in a new environment.This Article overviews the results of those studies and explores some policyimplications. Part I recaps the intellectual and methodological heritage of ourstudy. Part II describes important changes in the health care system andpeculiarities of the New York study that made repetition of a large-scale studyof iatrogenic injury worthwhile. Part III gives a brief account of the origins ofour study. Part IV outlines each of the four main areas of analysis that comprisedthe Utah-Colorado Medical Practice Study (“UCMPS”): incidence of medicalinjury; malpractice claiming behavior; the economic consequences of medicalinjury; and the feasibility of alternative approaches to compensation. We alsodescribe key results from analyses in each of these areas. The final Partsummarizes our findings, and discusses their implications for health care policy.
I. A SHORT HISTORY OF POPULATION-BASED STUDIES OF MALPRACTICE
Perhaps the most significant contribution from malpractice research to ageneral understanding of tort law comes from a series of studies of iatrogenicinjury, its economic consequences, and the resolution of associated claims. The21
pioneering work was undertaken in California in the late 1970s and early 1980s.Responding to a perceived crisis in malpractice litigation in the mid-1970s, theCalifornia Medical Association and the California Hospital Association jointlycommissioned a study of medical records to measure rates of injury inhospitalized patients. A team of medico-legal experts, led by Don Harper Mills,reviewed nearly 21,000 records in twenty-three hospitals across the state andfound 970 incidents of disability caused by health care management. Because22
the hospitals were carefully selected to be representative of hospitals statewidein terms of size, ownership, teaching status, and region, the findings of theMedical Insurance Feasibility Study (“MIFS”) implied that approximately 4.6%,or roughly one in twenty Californians hospitalized in the mid-1970s sufferedsome sort of iatrogenic injury. One in every one hundred inpatients suffered an23
1648 INDIANA LAW REVIEW [Vol. 33:1643
24. See id.
25. See DANZON, supra note 2, at 58-65;WEILER, supra note 13, at 5, 8;
26. Frank P. Grad, Medical Malpractice and the Crisis of Insurance Availability: The
Waning Options, 36 CASE W. RES. 1058, 1058-59 (1986); David J. Nye et al., The Causes of the
Medical Malpractice Crisis: An Analysis of Claims, 76 GEO. L.J. 1495, 1495-98 (1988).
27. See Mills, supra note 22.
28. DANZON, supra note 2;WEILER, supra note 13.
29. See DANZON, supra note 2, at 24.
30. For a fuller description of the origins of the study and the team of investigators involved,
see the preface of HARVARD MEDICAL PRACTICE STUDY, PATIENTS, DOCTORS, AND LAWYERS:
MEDICAL INJURY, MALPRACTICE LITIGATION, AND PATIENT COMPENSATION IN NEW YORK (1990).
injury that gave rise to permanent or grave disability. 24
These findings were somewhat at odds with the zeitgeist. After creepingsteadily upward for fifteen years, the frequency of claims against physicians, thesize of payments made to plaintiffs, and (consequently) malpractice insurancepremiums all rose dramatically through the period 1973 through 1976.25
Resentment of lawsuits, and the “cowboy” lawyers that brought them, wasrunning high, especially among members of the medical profession. Thus,26
MIFS presented an ticklish scenario: injury rates dwarfed claims rates, increasesin litigation notwithstanding. But a formal injury-claims comparison was notmade. The sponsors of the study shelved it. Aside from a brief technicalsummary, the findings were published only as an in-house document. 27
In the early 1980s, the so-called malpractice “crisis” had largely subsided,with claims rates nationwide returning to manageable if not quite pre-crisislevels, when a RAND economist, Patricia Danzon, picked up the results of28
MIFS and took the important step of actually comparing the frequency of injuryto the litigation rates. Relying on aggregate claims data collected by the NationalAssociation of Insurance Commissioners in surveys of private insurers, Danzonestimated that hospital injuries did indeed exceed malpractice claims and,strikingly, they did so by a factor of ten to one. Because she was unable to link29
the injury data collected in MIFS with claims data at the individualpatient/plaintiff level, however, it was not possible to measure the extent ofoverlap between the two populations.
In the midst of a second surge in malpractice claims in the mid-1980s, agroup of investigators led by Dr. Howard Hiatt, the former Dean of the HarvardSchool of Public Health, resolved to undertake a comprehensive evaluation ofmalpractice litigation in a single state. The objective was to answer three30
questions: 1) How frequently do medical injuries occur in hospitals, particularlythe subset of injuries attributable to negligent care? 2) What portion of thoseinjuries give rise to litigation and, conversely, how much litigation proceeds inthe absence of such injuries? and 3) what are the economic consequences ofmedical injuries? The Harvard investigators soon recognized that answeringthese questions would require a costly and labor intensive study, involvingreview of medical records, access to malpractice claims files, and interviews withpatients.
2000] BEYOND DEAD RECKONING 1649
31. See supra note 20.
32. For a full description of the HMPS sampling methodology, see supra note 30.
33. More than 200 reviewers were employed in the chart review process.
34. Physician reviewers separately registered their confidence in both the causation and the
standard of care components of negligence on a six-point scale: 1, little or no evidence medical
management caused the event; 2, slight evidence; 3, not quite likely (less than 50:50 but a close
call); 4, more likely than not (greater than 50:50 but a close call); 5, strong evidence; and 6,
virtually certain evidence. The threshold for both determinations was a confidence score of four
or greater.
35. See W. PAGE KEETON ET AL., PROSSER & KEETON ON THE LAW OF TORTS § 30, at 164-65
(5th ed. 1984).
36. See HARVARD MEDICAL PRACTICE STUDY, supra note 30, at 7-10 to 7-24.
37. See PAUL C. WEILER ET AL., A MEASURE OF MALPRACTICE: MEDICAL INJURY,
MALPRACTICE LITIGATION, AND PATIENT COMPENSATION 64-65 (1993).
38. See id.
39. See HARVARD MEDICAL PRACTICE STUDY, supra note 30, at 7-24 to 7-27.
Dr. Hiatt secured a significant funding commitment from the New YorkDepartment of Health and from the Robert Wood Johnson Foundation toundertake the study. After three years of design work, the investigators31
commenced data collection in New York. They assembled a representativesample of fifty-two hospitals from among the more than 300 acute care hospitalsin New York, and randomly sampled medical records from those hospitals. The32
study sample was “weighted,” that is, specially designed to allow statisticaltransformation of results from this selection of institutions and records intostatewide estimates. Teams of physicians and nurses then reviewed each record,looking for evidence of “adverse events”—defined as injuries caused by medicalpractice, as opposed to a disease process, which either prolonged the patient’shospital stay or resulted in disability at the time of discharge. When an adverse33
event was detected, the chart review protocol directed the physician reviewers tojudge whether it had been caused by negligence. Negligence was defined, in34
accordance with standard tort criteria, as actual injuries proximately resultingfrom a treating physician's failure to meet the standard of care expected in hispractice community. 35
While record review proceeded, the investigators contacted more than twentyinsurance companies underwriting malpractice risk in New York for injury year1984. Unfortunately, by the time this process began in 1990, the effects of a36
second tort crisis in the mid-1980s had been felt. Many insurers had gone intostate receivership, having failed as a result of unanticipated increases inexpenditures on litigation and settlements. This made the task of identifying37
claims quite arduous. Nonetheless, investigators successfully created a databaseof nearly 68,000 malpractice claims filed between 1974 and 1989.38
Patients were then linked to claimants using software programs designed tomaximize the possibility of identifying matches between individuals. The39
matching algorithms allowed for errors and differences in name spelling, thentested the veracity of candidate matches by referring to the descriptive
1650 INDIANA LAW REVIEW [Vol. 33:1643
40. See WEILER ET AL., supra note 37, at 117-31.
41. See William G. Johnson et al., The Economic Consequences of Medical Injuries, 267
JAMA 2487 (1992).
42. For a summary of published articles from HMPS through 1993, see WEILER ET AL.,
supra note 37, at 155-75.
43. See Brennan et al., supra note 12, at 370.
44. See id.
45. See id.
46. See, e.g., Errors by Doctors in Hospitals Tracked Drug Problems, Wound Infections
Cited, Chi. Trib., Feb. 7, 1991, at C3; New Study of Hospitals Finds Inadequate Care, SAN FRAN.
CHRON., Feb. 7, 1991, at A2; New York Study Shows Poor Care in Hospitals Is Leading to Injuries,
N.Y. TIMES, Feb. 7, 1991, at B4.
47. See, e.g., Lucian L. Leape, Error in Medicine, 272 JAMA 1851 (1994); Lucian L. Leape
et al., Promoting Patient Safety by Preventing Medical Error, 280 JAMA 1444 (1998).
information in the patient and claimant databases. In this way, investigators wereable to identify which patients, from those whose medical records were examinedin the chart review, were involved in litigation.
Finally, a survey of individuals who had suffered adverse events wasconducted to gather information on the economic consequences of the injuries.40
This survey occurred more than four years after the injury itself to allow areasonable assessment of the repercussions of the injury to be made. Butunfortunately the respondents’ ability to recall actual costs appeared to besignificantly impaired by the time elapsed. The site team applied unit costestimates to information obtained in the surveys to assess overall costs ofinjury.41
The results of the HMPS have been widely reported. The investigators42
detected a slightly lower rate of adverse events than had been found in MIFS.Approximately 3.7% of patients hospitalized in New York in 1984 wereestimated to have suffered a medical injury associated with their stay. Just over43
one quarter of those injuries was due to negligence. Relatively benign-soundingpercentages in epidemiological analysis often create shock value when “up-weighted” to total numbers of injuries, an extrapolation that was not possible inthe MIFS because of its non-representative sampling design. In the HMPS,however, investigators were able to estimate that approximately 100,000 NewYorkers suffered medical injuries in 1984, 13,000 of which resulted in death.44
Negligence gave rise to approximately 20,000 injuries disabling injuries and7000 deaths.45
These alarming statistics have become the chief legacy of the HMPS. For thefirst time, the burden of morbidity and mortality from medical injuries waswidely publicized. This attention, in turn, helped to spawn interest in error46
measurement and prevention—one of the most vibrant fields of inquiry in healthservices research today. Efforts to understand medical error, however, remain47
largely contained within a frame of analysis concerned with improving qualityof clinical care. Commentators and researchers involved in the study oferror—many of them clinicians—typically view the law’s role with disdain and
2000] BEYOND DEAD RECKONING 1651
48. See, e.g., Bryan A. Liang, Error in Medicine: Legal Impediments to U.S. Reform, 24
J. HEALTH POL. POL’Y & L. 27 (1999).
49. See WEILER ET AL., supra note 37, at 77-134.
50. See A. Russell Localio et al., Relation Between Malpractice Claims and Adverse Events
to Negligence: Results of the Harvard Medical Practice Study III 1991, 325 NEW ENG. J. MED.
245, 248 (1991).
51. WEILER ET AL., supra note 37, at 71.
52. Localio et al., supra note 50, at 248.
53. See David M. Studdert et al., Negligent Care and Malpractice Claiming Behavior in
Utah and Colorado, 38 MED. CARE 250 (2000).
54. See WEILER ET AL., supra note 37, at 75. Note, however, that this phenomenon does not
necessarily lend support views about greedy personal injury lawyers and vexatious plaintiffs. “[I]t
is more likely due to the fact,” Weiler argues that “that (previously ill) patients and their lawyers
have a difficult time identifying in advance valid claims that demonstrate that something went
wrong in treatment.” Paul C. Weiler, Fixing the Tail: The Place of Malpractice in Health Care
Reform, 47 RUTGERS L. REV. 1157, 1162 (1995).
55. Richard Abel, The Real Tort Crisis—Too Few Claims, 48 OHIO ST. L.J. 443, 443-48
(1987).
pay it little attention. Few have explored legal means for deterring accidents.48
The patient safety movement’s orientation away from scrutiny of the legalsystem is problematic, given the solid evidence from HMPS that the tort systemwas failing in both its compensation and deterrence functions. In total,49
approximately 3600 malpractice claims relating to injury year 1984 were madein New York. A comparison to the 27,000 negligent adverse events arising in50
that year produces a negligence-to-claims ratio of 7.5—not much smaller than thegap identified by Danzon a decade earlier. Even when the injury sample isnarrowed to a subset of more “valuable” tort claims—those involving seriousinjury to patients less than seventy years old—a ratio of five to two persists. 51
But HMPS analysis of litigation analysis went a step further by matchingspecific claims to specific injuries. This exercise shed new light on thedimensions of the disconnection between claims and injuries: not only did fewdocumented instances of negligent injury give rise to claims, the majority ofclaims that were initiated did not appear to be grounded in identifiable instancesof negligence. Investigators estimated that, among the 3600 claims in New Yorkrelating to injury suffered in 1984, more than one-half arose from instances inwhich there was neither negligence nor any identifiable injury and one-thirdarose from instances of injury but no negligence; only one-sixth responded to“true” negligent incidents. We have previously described this paradoxical52
relationship as simultaneously lopsided and mismatched. Paul Weiler draws53
an analogy to a traffic officer ticketing random drivers who are not violatingtraffic laws while allowing many violators to pass. That many patients who54
suffer medical injury go uncompensated by tort litigation was not an altogethersurprising finding; “under-claiming” in liability insurance programs had beenwell recognized in other areas. The prevalence of over-claiming, however, was55
new information, as was the insight that claims were largely settled on the basis
1652 INDIANA LAW REVIEW [Vol. 33:1643
56. See Troyen A. Brennan et al., Relation Between Negligent Adverse Events and the
Outcomes of Medical Malpractice Litigation, 335 N. ENG. J MED 1963 (1996).
57. For a discussion of the obstacles to effective deterrence created by haphazard claiming
behavior, see David M. Studdert & Troyen A. Brennan, Deterrence in a Divided World: Medical
Malpractice Law in an Era of Managed Care, 15 BEHAVIORAL SCI. & THE LAW 21, 26-27 (1997).
58. See Ann G. Lawthers et al., Physicians’ Perceptions of the Risk of Being Sued, J.
HEALTH POL., POL’Y & L. 463, 464 (1992).
59. See Troyen A. Brennan, The Role of Regulation in Quality Improvement, 76 MILBANK
QUARTERLY 709, 714-16 (1998).
60. See Kenneth S. Abraham & Paul C. Weiler, Enterprise Liability and the Evolution of
the American Health Care System, 108 HARV. L. REV. 381, 381 (1994); William M. Sage et al.,
Enterprise Liability for Medical Malpractice and Health Care Quality Improvement, 20 AM. J.L.
& MED. 1, 17-18 (1994).
61. See JAMES REASON, HUMAN ERROR (1990).
62. See WEILER ET AL., supra note 37, at 139-149.
of severity of injury, not the degree of negligence. 56
This dysfunctional situation clearly implies that compensation and deterrenceobjectives are not fully realized by malpractice law. The claims-negligence57
mismatch also makes it difficult to understand how there could be any sharp oreffective deterrence signal associated with malpractice litigation. Heuristics mayplay an important, salvaging role. HMPS investigators were surprised todiscover that, despite the manifest inaccuracies in general claiming behavior, themalpractice claiming system did appear to command the attention of physicians.Many believed that there was a high probability they would be sued if theynegligently injured one of their patients. 58
However, the only clear evidence of a relationship between malpracticeclaiming and actual behavioral responses was found at the level of the hospital,and here the important signal was the overall number of medical injuries, not thenumber of medical injuries actually due to negligence. This finding intimated59
that institutions may best be positioned to channel the liability threat andexperience toward injury-reduction strategies, an argument made persuasively byseveral legal commentators and one that resonates with contemporary60
organizational theories of safety. Overall, HMPS investigators did not interpret61
their findings about the dynamics of litigation as supporting the need for ongoingreliance on individually targeted tort litigation to ensure about patient safety.62
II. HMPS TODAY: THE NEED FOR VALIDATION
Why does the HMPS require validation? The most obvious reasons stemfrom market transitions in the United States. The HMPS studied medical injuriesconnected to hospital stays in 1984. The ensuing sixteen years have seentumultuous change in the health care arena. Two changes are particularlytroubling to the interpretability of HMPS findings today. One is the emergenceof managed care as a force in American medicine. The penetration of managedcare in New York in 1984 was minimal. Managed care’s rapid rise began in the
2000] BEYOND DEAD RECKONING 1653
63. See generally WALTER A. ZELMAN & ROBERT A. BERENSON, THE MANAGED CARE
BLUES AND HOW TO CURE THEM (1998); James C. Robinson, Health Care Purchasing and Market
Changes in California, HEALTH AFF., Winter 1995, at 117; James C. Robinson & Lawrence P.
Casalino, Vertical Intergration and Organizational Networks in Healthcare, HEALTH AFF., Spring
1996, at 7; C.B. Sullivan & T. Rice, The Health Insurance Picture in 1990, HEALTH AFF, Summer
1991, at 104-15.
64. See ZELMAN & BERENSON, supra note 63, at 112-15; Gary Claxton et al., Public Policy
Issues in Nonprofit Conversions: An Overview, HEALTH AFF., Summer 1997, at 9; Robert Kuttner,
Columbia/HCA and the Resurgence of the For-Profit Hospital Business (Part II), 335 NEW ENG.
J. MED. 446, 449-50 (1996); Jack Needleman et al., Hospital Conversion Trends, HEALTH AFF.,
Summer 1997, at 187;.
65. See TROYEN A. BRENNAN & DONALD M. BERWICK, NEW RULES: REGULATION,
MARKETS, AND THE QUALITY OF AMERICAN HEALTH CARE 151-74 (1995).
66. See Michael S. Sparer, Nothing Exceeds Like Success: Managed Care Comes to
Medicaid in New York City, 77 MILBANK QUARTERLY 205, 205-23 (1999).
67. It is noteworthy that these same distinctive features apply to California, the only other
state from which comprehensive data on injuries and claims have emerged. For data on attorney
concentration, see AMERICAN BAR ASSOCIATION, MEMBERSHIP RANKING BY STATE (Aug. 1997).
late 1980s, not only in New York but also in many regions of the country, andwithin several years had taken root as a new way of life in the practice ofmedicine. The other market shift concerns proprietary medicine. New York63
had no for-profit sector of hospital care in 1984. By the early 1990s, for-profitinstitutions were well established in many markets around the United States,including those in New York. Thus, managed care and for-profit medicine, and64
the points of intersection between these two phenomena, have largelytransformed the health care industry that existed before 1990. No period ofchange in American medicine has been more dramatic. Consequently, as any65
good student of health services research would point out, there are serious doubtsabout how representative and relevant the HMPS findings are for modernsystems of health care delivery and financing.
It must also be acknowledged that New York has always been a unique statein terms of its health policy and litigation environment. The Department of66
Health effectively exerted what was in effect “all-payer” control overreimbursement from the late 1970s until the late 1990s. Complex reimbursementformulae meant that Medicaid patients, and even the uninsured, enjoyed greateraccess to services in New York than their counterparts in other states. Moreover,any study of New York hospitals must be significantly influenced by the uniquehealth demands and care systems of New York City. Large impoverished areasof the city require teaching hospitals that are heavily subsidized by Medicaregraduate medical education funds. The influence of these teaching hospitals ismuch more pronounced than that of the relatively small tertiary care centers inother states. With regard to litigation, New York is distinctive in ways that couldpotentially affect the negligence-claims relationship: it is heavily populated,ranks among states with the highest per capita concentrations of lawyers, and isrenowned for having consistently high rates of malpractice litigation. In sum,67
1654 INDIANA LAW REVIEW [Vol. 33:1643
For historical claims rates, see U.S. GENERAL ACCOUNTING OFFICE, MEDICAL MALPRACTICE: SIX
STATE CASE STUDIES SHOW CLAIMS AND INSURANCE COSTS STILL RISE DESPITE REFORMS, PUB. NO.
GAO/HRD-87-21 (Dec. 1986.)
68. See, e.g., RICHARD ANDERSON, AN EPIDEMIC OF MEDICAL MALPRACTICE? A
COMMENTARY ON THE HARVARD MEDICAL PRACTICE STUDY, 27 CIVIL JUSTICE MEMORANDUM
(1996), available at <http://manhattan-institute.org/html/cjm_27.htm7> (visited July 24, 2000).
See also Troyen A. Brennan et al., Reliability and Validity of Judgments Concerning Adverse
Events Suffered by Hospitalized Patients, 27 MED. CARE 1148 (1989); A. Russell Localio et al.,
Identifying Adverse Events Caused by Medical Care: Degree of Physician Agreement in a
Retrospective Chart Review, 125 ANN. INTERNAL MED. 457 (1996). Critics questioning the rates
of injuries in New York can also point to the experience of Australian investigators who recently
estimated the incidence of injuries in Australia. Using methodology that was very similar to that
of the Medical Practice Study, the Australians reported an adverse event rate of over 15%. See
Ross M. Wilson et al., The Quality in Australian Health Care Study, 163 MED. J. AUST. 458 (1995).
The fact that similar methods in another set of investigators hands could produce four-fold
differences in injury raised concerns about the viability of results in all studies using the HMPS
methods.
69. See Taragin et al., supra note 15, at 782; Michelle J. White, The Value of Liability in
Medical Malpractice, HEALTH AFF., Fall 1994, at 75, 79-80.
70. Note, however, that the discrepancy between the HMPS and previous studies referred
to here relates only to the issue of the legitimacy of claims made; only HMPS quantified
underclaiming.
a number of state-specific factors raise further doubts about whether the findingsfrom New York in 1984 can be generalized to the rest of the United States today.
Issues of generalizability aside, a series of recurring questions have arisenabout aspects of the HMPS itself. First, with regard to identification of medicalinjuries, a number of critics have pointed out that the reliability of judgmentsconcerning injury and negligence are less than stellar. We hypothesized that68
one important reason for this was that the HMPS had six different directors of therecord review. Each conducted their own training programs in differentgeographic locations. Fragmented reviewer supervision training may well havehad a deleterious effect on the reliability of the reviewer judgments in New York.
Second, questions have persisted about the extent of the gap identifiedbetween malpractice claims and medical injuries in the HMPS. Investigatorsreviewing the records of malpractice insurers have found both that a largeproportion of the claims appear to be valid and that independent evaluations ofnegligence generally accord with decisions about compensation. We have69
reservations about whether such evaluations really qualify as independent whenmade by insurers. Nonetheless, the fact remains that the weight of most othermalpractice claims analysis suggests a smaller mismatch between claims andnegligence than was identified in the HMPS.70
Third, the task of collecting data on malpractice claims in New York provedto be particularly challenging. One obstacle was the volatile malpracticeenvironment in New York in 1984. As many as twenty different companies were
2000] BEYOND DEAD RECKONING 1655
71. See HARVARD MEDICAL PRACTICE STUDY, supra note 30, at 7-10 to 7-13.
72. See id. at 7-13.
73. See WEILER ET AL., supra note 37, at 68.
74. See id.
75. See id.
76. See Johnson et al., supra note 41, at 2488.
77. See HENNEKENS & BURING, supra note 9, at 35.
78. WEILER ET AL, supra note 37, at 97-109.
79. See id. at 106-09.
underwriting malpractice insurance in New York in 1984. Several went into71
receivership over the next four years; others merged or were acquired by largerorganizations. Such market instability raises significant questions about howcomprehensive the review of malpractice claims could have been. A relatedcomplication—although one that is certainly not peculiar to New York, then ornow—is the long tail on claims resolution. Fifty percent of the claims analyzed72
in the HMPS were closed more than 5.5 years after the (alleged) date of theinjury and twenty-five more than 7.5 years out. After ten years, approximately73
ten percent of claims still had not closed. This considerable lag frustrates74
efforts to understand malpractice claiming behavior.Fourth, the methods for identifying the costs of injury in New York were
based on survey data. Five to six years elapsed between the date of injury and75
interviews, in which a sample of patients, or their surviving dependents, wereasked about health status and services utilized in the intervening period. While76
the gap served the investigators’ interests in the gathering information on the fullrepercussions of injury, it also necessitated reliance on the long-term recall ofindividuals who had suffered adverse events. Recall biases are a well-documented phenomenon in epidemiological research. 77
Fifth, HMPS investigators did not have the tools to estimate the cost ofdifferent compensation models, or compare these costs to those of the tortsystem. Consequently, assessments of the economic feasibility of alternativeschemes, such as “no-fault” compensation, were crude. Investigators simply78
compared the total costs of medical injury to estimated costs of the malpracticesystem, with some minor modifications, to account for administrative expensesassociated with dispensing compensation in a no-fault system.79
En mass, this set of defects and unanswered questions is very serious. Beforepolicymakers could reasonably be expected to rely on the HMPS findings, webelieved it was necessary to validate the study. In bringing the medical injurystatistics up do date, we sought states that differed markedly from New York,both regionally and in terms of their demographic mix. Another importantcriterion was the existence of a mature health care industry, including a managedcare and for-profit hospital presence. To simplify and improve the study ofmalpractice litigation, we also hoped to find states with relatively stable,monopolistic indemnity insurance markets.
1656 INDIANA LAW REVIEW [Vol. 33:1643
80. See Studdert et al., supra note 53; Eric J. Thomas et al., Costs of Medical Injuries in
Colorado and Utah in 1992, 36 INQUIRY 255 (1999) [hereinafter Thomas et al, Costs of Medical
Injuries]; Eric J. Thomas et al., Incidence and Risk Factors for Adverse Events and Negligent Care
in Utah and Colorado in 1992, 38 MED. CARE 261 (2000).
81. As originally envisioned by the study consortia, the shift toward no-fault compensation
III. STUDY ORIGINS
In 1995, the Robert Wood Johnson Foundation, under the auspices of aninitiative led by Robert Berenson, provided us with a grant to undertake a studysimilar to the HMPS in Utah and Colorado. We worked closely with thelegislatures and dominant physician insurers in these two states. Collaboratorsprovided us with an unprecedented level of access to hospital data systems andmalpractice claims. In collecting and analyzing these data, we re-deployed thebasic methods of the HMPS, making several design changes and running repairsin places where we thought significant deficiencies existed.
We recently reported results from the Utah-Colorado Medical Practice Study(“UCMPS”) in the medical literature. However, we have not previously80
published a comprehensive overview of our findings. The remainder of thisArticle summarizes our main analyses and results and identifies some of the keypolicy implications of the UCMPS.
Before turning to that summary, however, a brief word about the politicalframework in which the study evolved may be helpful. Our interests inconducting the UCMPS extended beyond a desire to validate the HMPS findings.Convinced by the results of the HMPS that a no-fault system of compensation formedical injuries presented a superior alternative to the tort regime, we soughtcollaborators who might be interested proceeding with no-fault trials. Tworemarkable individuals joined us in this effort.
At the time the study commenced, K. Mason Howard was the President ofthe Colorado Physicians’ Insurance Company (“COPIC’), the major physicianinsurer in Colorado. Over years of experience with the malpractice system, heformed the view that a no-fault compensation program for medical injuries heldout the promise of significant improvement on the status quo. Howard mobilizedCOPIC’s support behind the Colorado portion of the study, and sparked theinterest of nearly all of the key players in that state, including physician groups.Elliott Williams was the architect of the Utah portion of the study. One of themost experienced malpractice litigators in Utah, Williams had read extensivelyon alternatives to tort litigation, and proceeded to convince many health careleaders in his state that a trial of no-fault compensation was possible. Withoutthe persistence and insight of Howard and Williams, the UCMPS would not haveoccurred.
In both Utah and Colorado, we met with legislators and health policy opinionleaders in 1994 and 1995. Over the next four years we worked on empirical andtheoretical aspects of no-fault design in order to inform the policy debate. Wealso assisted in preparing draft legislation that outlined a statutory framework fora no-fault system of compensation.81
2000] BEYOND DEAD RECKONING 1657
was to proceed differently in each state. In Utah, the scheme would be introduced incrementally,
beginning with several large hospitals. Colorado was to move more rapidly toward statewide
replacement of tort with no-fault, and the participation of patients and physicians was to be
mandatory, although some “grand-fathering” was recognized as necessary to accommodate claims
relating to injury dates that preceded the effective date of no-fault legislation.
82. See ANDERSON, supra note 68.
83. E.g., Localio et al., supra note 68.
Unfortunately, enthusiasm for such large-scale tort reform had waned byspring 1998. The policy focus had clearly shifted to the uninsured and consumerprotection issues in managed care. Thus, the current system remains intact today,replete with secrecy about malpractice claims and arbitrary divisions betweenrisk management, injury prevention and general quality improvement activities.But despite the fact that UCMPS results have not (yet) affected the organizationstructure of the tort system in Utah and Colorado, they do provide a third,population-based estimate of the incidence, types, and costs of iatrogenic injury,and the best estimates to date on the economic feasibility of a no-fault alternativefor medical injury compensation.
IV. RESULTS OF THE UTAH-COLORADO MEDICAL PRACTICE STUDY
A. The Health Burden of Medical Injury
The UCMPS essentially replicated the methods used in the HMPS. Ourvalidation goals demanded that the pool of injuries detected in the mountainstates be directly comparable with those from New York. As we have noted,however, the reliability of judgments by record reviewers—both adverse eventand negligence determinations—was a major focal point of methodologicalcritiques that followed release of the New York findings. Drawing upon82
knowledge gained from work in the interim on “inter-rater reliability” and83
ongoing analyses of the New York experience, we made several modificationsto the review process. Most notably, reviewer-training practices were revampedand we instituted a series of quality checks on physician-reviewers’ judgments.
Like the HMPS, sampling work was focused at two levels: the hospitals andthe records themselves. There were 112 eligible hospitals in the two states ofwhich thirteen were selected in Utah and fifteen in Colorado. The group selectedconsisted of two major teaching hospitals (one from each state) and eight minorteaching hospitals (two from Utah and six from Colorado). Four, for-profithospitals, from each state were also included. From among all discharges incalendar year 1992 at these hospitals, we then sampled 15,000 medicalrecords—5000 in Utah in 10,000 in Colorado.
The medical records were sampled randomly. However, the guidingobjectives of UCMPS meant that it was not appropriate to select participatinghospitals in a purely random manner. Rather, we sought to load the hospitalsample with institutions that would be expected to play key roles in thedevelopment of a no-fault insurance plan in each state. Nonetheless, our
1658 INDIANA LAW REVIEW [Vol. 33:1643
84. The longitudinal nature of the medical records allowed nurses and physician-reviewers
to make this type of inquiry. However, one methodological limitation of the study is that an adverse
event marker such as unplanned readmission was not observable if the patient returned to a different
hospital or to an outpatient facility.
85. See Localio et al., supra note 50, at 245-46.
86. See Localio et al., supra note 68, at 462.
sampling design preserved the opportunity to “up-weight” results to produce thekind of statewide totals that had attracted so much interest in New York.Moreover, several mitigating factors allowed us to honor basic statistical rulesof representativeness with the participating hospitals and to avoid sampling bias.First, as had been done in New York, we classified all eligible hospitals intostrata based on their size, location, type of ownership, and whether or not theywere teaching hospitals. At least one hospital from each stratum was then invitedto participate in UCMPS. Second, none of the invited hospitals refused toparticipate. Third, we had no prior knowledge of adverse event rates in any ofthe eligible hospitals.
We made few alterations to the nurse component of the two-stage reviewprocess used in New York. Teams of nurses scanned all records searching forone of nineteen different referral criteria. These criteria encapsulated commonmarkers of injury, such as the occurrence of unexpected events during thehospital stay or unplanned readmissions. The same screening criteria had been84
used in the HMPS and demonstrated high reliability and validity. 85
On the other hand, the physician review procedures underwent twosignificant modifications. First, the training procedures were streamlined andconsolidated. Only two investigators, Dr. Thomas and Dr. Brennan, trained thephysician-reviewers; this was carried out in a single series of sessions in bothstates. Thus, to the extent diffuse reviewer training programs introducedvariation into the New York findings, it was largely eliminated in Utah andColorado.
Second, we designed a series of targeted, quality control strategies for thephysician review based on knowledge gained during the HMPS about aspects ofthe process that were associated with unreliable judgments. One strategyaddressed “outlier” reviewers. Much of the disagreement between reviewers inthe HMPS was shown to have occurred among physicians who had markedly lowand high adverse event detection rates. Accordingly, physicians whose adverse86
event detection rate was two or more standard deviations below or above themean for reviewers in their state had their charts re-examined by theinvestigators. If ten percent or more of the records classified as adverse eventsby the original reviewer were found not to fit the study definition of adverseevents, all of the charts of the offending reviewer were re-assigned for freshreview.
Another quality control strategy involved investigator verification. Byinspecting a clinical summary of each adverse event identified in record review,investigators checked to ensure it met the study definition of an adverse event.False positives were eliminated. A similar process was undertaken to verify
2000] BEYOND DEAD RECKONING 1659
87. Use of adverse event criteria is an appropriate and conservative method for delineating
candidate negligent adverse events because “causation” and the presence of substantive injury, the
crux of the adverse event judgment, are also pivotal criteria in the legal definition of negligence.
KEETON ET AL., supra note 35. The other key component of that definition, evidence that the injury
was due to substandard care, was initially addressed by reviewers, and then revisited by
investigators.
88. This iterative process bears some resemblance to that used to decide the issue of
negligence in court, wherein multiple physician testimonies are weighed. Moreover, a 10-year
follow-up of the Harvard Medical Practice Study found that, in all but three of 46 litigated cases,
reviewers' judgments of negligence correlated closely with expert assessments subsequently made
by insurers. See Brennan et al., supra note 56, at 1967.
89. See Figure 1, infra.
90. See Figure 1, infra.
negligent adverse events, although investigators also had some opportunity hereto address false negatives. Because the adverse event determination delineatedthe pool of cases eligible for reviewers’ subsequent judgments aboutnegligence, physician and attorney members of our team were able to comb87
that pool of injuries to ensure that none had been overlooked as having been dueto negligence. 88
Our final strategy was aimed at testing the general reliability of the reviewprocess. It involved re-review of a random sample of 500 records referred bynurses to physicians. The re-review showed eighty-four percent agreementamong reviewers.
Figure 1 overviews the results from the review process. We completed89
review of 4943 (98.9%) of the 5000 sampled records in Utah and 9757 (97.6%)of the 10,000 records in Colorado. Of these records, Utah nurse reviewersreferred 854 records (17.2%) for physician review and their counterparts inColorado referred 2014 records (20.1%). Physicians reviewed ninety-eightpercent of the referred records. The rest were categorized as missing.
The profile of patients included in our study closely resembled the generalpopulation of patients discharged from each state’s hospitals in 1992. Forexample, the mean age of the patients whose records we reviewed was 38.9years; the mean age of all patients discharged from Colorado and Utah hospitalswas 38.2 years. These results help to confirm that our sampling techniqueachieved representativeness, at least across key sociodemographic characteristics.
Physician-reviewers identified a total of 169 adverse events in Utah and 418adverse events in Colorado. When these totals are up-weighted to the state90
populations, they yield estimates of 5614 adverse events among hospitalizedpatients in Utah in 1992, and 11,578 in Colorado. We estimated an adverse eventrate of 2.9% in both states, a remarkable similarity considering that medicalrecords were reviewed by completely different teams of physicians in each state.In Utah, 828, or 32.6%, of the adverse events were judged due to negligence,whereas in Colorado the figures were 3179 and 27.5% respectively.
For purposes of exploring types of adverse events we pooled the results.
1660 INDIANA LAW REVIEW [Vol. 33:1643
91. See Table 1, infra.
92. For a detailed analysis of the surgical adverse events identified in UCMPS, see Atul A.
Gawande et al., The Incidence and Nature of Surgical Adverse Events in Colorado and Utah in
1992, 126 SURGERY 66 (1999).
93. These percentages relate to the proportion of drug-related events due to negligence, not
drug related adverse events in general.
94. See, e.g., Rodney A. Hayward et al., An Evaluation of Generic Screens for Poor Quality
of Hospital Care on a General Medicine Service, 31 MED. CARE 394 (1993).
Table 1 shows the up-weighted figures for each leading type of event, and the91
proportion of injuries that involved negligence and permanent disability. Themost prevalent injury type was adverse events connected to surgery, accountingfor approximately half (44.9%) of adverse events across both states. Nearly one92
third of these were the result of technical complications in the operation. Only16.9% of surgical adverse events involved negligence. Approximately the sameproportion resulted in permanent disability.
Drug-related adverse events were the next most prevalent group. Theyaccounted for more than one-third of the balance of injuries. The four mostcommon classes of drugs involved were antibiotics (24.9%), cardiovascularagents (17.4%), analgesics (8.9%), and anticoagulants (8.6%). Strikingly, morethan one third of all drug-related adverse events detected were due to negligence.The mistakes that led to these instances of substandard care included prescriptionof the wrong drug (20.9%), prescription of the wrong dose (7.9%), andprescription of a drug to a patient with a known allergy to that drug (5.7%).93
Compared to findings from New York, iatrogenic death was a relatively rareoccurrence in the mountain states. Only 6.6% of adverse events resulted indeath, although the death rate was slightly higher (8.8%) among negligentadverse events. In total, 439 patients hospitalized in Utah and Colorado in 1992died due to negligent care; another 160 victims of negligence suffered grave ormajor disability.
These mortality statistics certainly shock. They confirm the existence of anepidemic of potentially preventable iatrogenic death in the United States.However, they present a considerably less bleak picture than emerged from NewYork eight years earlier. When extrapolated to the Unites States population,iatrogenic deaths detected the HMPS suggested there were nearly 200,000 deathsa year due to adverse events, whereas the UCMPS suggests no more than 65,000deaths. The difference widens when it comes to negligent adverse events:120,000 negligent deaths nationwide versus less than 25,000, extrapolating fromthe HMPS and the UCMPS rates respectively. This fivefold difference in deathsdue to negligent care is particularly striking.
There are several explanations. First, by the time we initiated the UCMPSwe had become aware of a growing literature suggesting that severity of injurytended to inappropriately color judgments about quality of care. Therefore,94
during reviewer training, we dealt specifically with the need to differentiate theinjury severity from the judgment of causation or negligence. Second, thestandard of medical care may simply have been better in Colorado and Utah in
2000] BEYOND DEAD RECKONING 1661
95. For a discussion of this possibility, see Troyen A. Brennan, The Institute of Medicine
Report on Medical Errors - Could It Do Harm?, 342 N. ENG. J. MED. 1123, 1124 (2000).
96. For a recent critique of questionable role of reviewer consensus, see T.P. Hofer et al.,
Discussion Between Reviewers Does Not Improve Reliability of Peer Review of Hospital Quality,
38 MED. CARE 152 (2000).
97. See Wilson et al., supra note 68, at 458, 470. QAHCS investigators did not make
determinations about negligence. Instead, physician-reviewers were asked to determine whether
each adverse event detected was “preventable,” defined as “an error in management due to failure
to follow accepted practice at an individual or system level.” “Accepted practice” in this definition
was taken to be “the current level of expected performance of the average practitioner or system that
manages the condition in question.” Id. at 461.
98. See Eric J. Thomas et al., A Comparison of Iatrogenic Injury Studies in Australia and
America II: Context, Methods, Casemix, Population, Patient and Hospital Characteristics
(unpublished manuscript, 2000).
1992 than in New York in 1984. Third, we cannot, of course, rule out the95
possibility that limitations in the methods we used, principally chart review, atleast partly explain disparities between the two studies.96
But despite the differences noted above, the story that emerges fromcomparison of results of the HMPS and UCMPS is chiefly one of tremendoussimilarity. Beginning with the overall adverse event rate itself—there is actuallyno statistically significant difference between the proportion of hospitaldischarges that give rise to adverse events (3.7% versus 2.9%)—inter-studyanalyses across a variety of different measures show that the UCMPS findingsessentially reinforce those from the HMPS. For example, the proportion ofoperative adverse events is remarkably stable between studies. Slightly morethan one-half of all negligent adverse events in both studies occurred in theemergency department, and a very high proportion of all adverse eventsattributed to emergency physicians were judged to be due to negligence (70.4%in New York and 52.6% in Utah and Colorado). This is likely a result of thechallenging environment in the emergency department in which critical humanfactors, such as uncertainty, changing plans, high work load, and multipleconcurrent tasks are brought to bear on health professionals in the emergencyroom.
However, not all studies of medical injury mirror the UCMPS and HMPSfindings. In August 1995, to much public clamor, the Australian governmentannounced results from the Australian Quality in Health Care Study (“QAHCS”).Ross Wilson and colleagues estimated that 16.6% of admissions to Australianhospitals were associated with adverse events, fifty-one percent of which wereconsidered preventable. Having consulted with QAHCS investigators97
throughout their study, these results surprised us because the Australians alsodrew a sample from 1992, identical in size to UCMPS, and then closely modeledtheir methods, as we had, on those developed during HMPS. Yet they detectednearly six times more adverse events than the UCMPS did. A closer analysis ofthe respective study methods and samples showed that several relativelystraightforward adjustments were necessary to allow direct comparability.98
1662 INDIANA LAW REVIEW [Vol. 33:1643
99. See id.
100. See Lori B. Andrews et al., An Alternative Strategy for Studying Adverse Events in
Medical Care, THE LANCET, Feb. 1, 1997, at 309, 309.
101. Chief among these differences is the fact that Andrews and colleagues focused on
surgery—the area in which we had detected the highest rates of adverse events in the general
hospital population we examined.
However, such adjustments still only reduced the disparity to a fourfolddifference. 99
Our results are also quite different from those obtained by Lori Andrews andcolleagues in Illinois. Using ethnographic measurement techniques to track100
adverse events occurring in “real time,” they found rates of 17.7% in oneuniversity teaching hospital. However, fairly major differences betweensampling and other aspects of the methodologies used in the Andrews study andthe UCMPS limit their comparability.101
In summary, the UCMPS produced results similar to its predecessor in NewYork. Approximately, three percent to four percent of hospitalizations appear togive rise to adverse events. Insofar as these adverse events are the results oferrors in care-givers behavior, they follow similar patterns. In other words, notmuch appears to have changed from 1984 to 1992 in terms of the role of humanfactors in medical injury causation. Together, the two studies provideoverwhelming evidence that the burden of iatrogenic injury is large, enduring,and an innate feature of hospital care in the United States.
B. The Relationship Between Malpractice Claims and Medical Injuries
An important component of the UCMPS, like the HMPS the before it, wasto link the medical injuries identified in record review to malpractice claims.Thanks to the more stable claims environment in the mountain states, the taskwas significantly less onerous than had been the case in New York. Claims fileswere more detailed and readily accessible, and there were several dominantindemnity insurers. In Utah, we collected malpractice claims data from thestate’s major commercial insurer, the Utah Medical Indemnity Association, andtwo important self-insurers, Intermountain Health Care and the UniversityHospital. Together these entities are responsible for close to eighty percent ofphysician liability insurance policies written in Utah annually.
The malpractice insurance market in Colorado is dominated by the ColoradoPhysicians’ Insurance Company (“COPIC”), which covers approximately three-quarters of insured physicians. One other commercial insurer, The Doctors’Company, and two self-insured institutions, Kaiser Permanente and theUniversity Hospital, write most of the remaining policies. All four entitiesparticipated in our study which allowed us access to claims data from more thanninety percent of the physician liability insurance market in Colorado. Thisunprecedented level of cooperation by insurers, some of them businesscompetitors, was largely due to the advocacy efforts of Howard and Williams.
As in the HMPS, we used computer-matching techniques to identify patients
2000] BEYOND DEAD RECKONING 1663
102. For details of the software packages used and the algorithms that underlie the matching
techniques, see generally M.A. Jaro, Probabilistic Linkage of Large Public Health Data Files, 14
STATISTICS IN MEDICINE 491 (1995); T.B. Newman & A.N. Brown, Use of Commercial Record
Linkage Software and Vital Statistics to Identify Patient Deaths, 4 J. AMER. MED. INFORMATICS
ASSOC. 233 (1997).
103. See Table 2, infra.
104. Eight of the 10 claims adjudged not to involve an adverse event on record review did
not meet fundamental adverse event criteria. In the two cases that did meet these fundamental
criteria, but were then adjudged not to be adverse events, physician reviewers found only slight to
modest evidence (score of two) that management caused the injury in question. Of the eight claims
judged to involve adverse events, reviewers were virtually certain that an adverse event had
from the medical record review who filed malpractice claims during or after1992. In addition to name, we used a range of demographic characteristics to102
test for matches, including date of birth, date of alleged injury, hospital,admission date, and discharge date. We began with fairly generous assumptionsabout the possibility of coincident identities. For example, ranges on birth dateswere used, as were multiple phonetic variations on each name. We then movedthrough a process of eliminating false positives by closely inspecting eachcandidate match. Finally, after narrowing the candidate list to those sampledpatients who had filed claims, a physician investigator compared the informationin the relevant claims file to the record review documentation to ensure that theclaim actually related to an episode of care examined during the record review.
We identified eighteen malpractice claims arising from records that we hadreviewed, eight in Utah and ten in Colorado. Seven of the eighteen matchedclaims involved allegations of negligence relating to surgical procedures. Sixclaims involved allegations of a failure to diagnose or treat. Of the remainingfive claims, three related to perinatal medical management and two related tomiscellaneous primary care treatments.
The low number of matches was anticipated, given the relatively smallsample size of both medical records and claims in the UCMPS, as compared tothe HMPS. It meant that statistically significant differences between membersof the matched group and the full sample of patients we studied in chart reviewwere impossible to detect. Nonetheless, as Table 2 shows, the two groups103
appeared to diverge along several important dimensions: the matched orclaimant group was slightly younger (mean of thirty-six years of age versus fortyyears of age years), a larger proportion was covered by private health insurance(seventy-percent versus fifty-two percent), none was uninsured, and only one wasa Medicare beneficiary. As one would expect, adverse event and negligentadverse event rates were higher among the matched group than in the generalmedical population. (These were, after all, the select few patients who weremotivated to sue.) However, the negligence rates, as determined ex ante byUCMPS record reviewers, were not as high as many might demand from anefficient, effectively functioning malpractice system. Of the eighteen matches,only four involved identifiable instances of negligence. Moreover reviewers hadnot even flagged the occurrence of an adverse event in ten of them.104
1664 INDIANA LAW REVIEW [Vol. 33:1643
occurred in five (score of six), they found strong evidence in two (score of five), and one was a
borderline call (score of four). In the four claims judged negligent adverse events, reviewers either
found strong evidence or were virtually certain of their judgment.
105. See Table 3, infra.
106. See AMERICAN BAR ASSOCIATION, supra note 67.
107. See UNITED STATES GENERAL ACCOUNTING OFFICE, MEDICAL MALPRACTICE: SIX STATE
CASE STUDIES SHOW CLAIMS AND INSURANCE COSTS STILL RISE DESPITE REFORMS (1986).
108. See Table 3, infra.
109. See Table 3, infra.
Table 3 summarizes the relationship between negligent adverse events and105
claims across the four states in which population-based analyses of malpracticehave been conducted over the past twenty-five years. The statistics shown in thetable combine results from the record review and matching studies withinformation on claims volume in each state, and tell a remarkably consistent storyabout the claims-negligence dynamic.
The figures in Row 1 set the scene by illustrating the markedly differentlitigation environments that prevailed in the four states at the time of each study.California and New York were experiencing frenetic claims activity, whereas thesituation in Utah and Colorado was relatively calm at the time of the medico-legal measurements in UCMPS. The high litigation rates on the East and Westcoasts are no doubt partly attributable to the medical malpractice “crises” thatunfolded in the mid-1970s and mid-1980s. However, California and New Yorkare distinctive in other ways that could affect claims, incidence of negligence,and negligence-claims dynamics: both are heavily populated, they are among thestates with the highest lawyer to population ratios, and both are renowned for106
having consistently high rates of malpractice litigation.107
Row 2 of Table 3 restates findings from chart review: it illuminates that108
fact that volume of litigation has no significant bearing on the incidence ofmalpractice. Nor do litigation rates appear to affect accuracy of claiming, asshown in Row 4. However, fewer claims and steady negligence rates must meanthat, what we have called, the malpractice gap narrows. Row 3 shows that thedegree to which instances of substandard care outstrip claims that allege the sameis less in Utah (ratio of 5.1 to 1) and Colorado (ratio of 6.7 to 1) than it was in thehigh litigation states of New York (ratio of 7.6 to 1) and California (ratio of 10.0to 1). Taken together, the data in Table 3 suggest that the dysfunctional109
characteristics of the medical malpractice system—most notably, its adequacyand its accuracy—have a resilience over time and across jurisdictions whenviewed through an epidemiological lens.
Two caveats are in order. First, regardless of the similarity in methodsbetween the studies that generated these comparative data, any conclusions aboutinter-temporal and cross-regional trends must be tempered by anacknowledgment that these are not truly longitudinal data. Because we have noevidence that the disconnections observed between negligent injury and claimingbehavior existed in the mountain states in earlier periods, we are unable to inferthat it is insensitive to overall rates of claims, and stable across time and regions
2000] BEYOND DEAD RECKONING 1665
110. See White, supra note 69, at 75-87
111. For an excellent summary of these studies, see MEDICAL MALPRACTICE AND THE
AMERICAN JURY: CONFRONTING THE MYTHS ABOUT JURY INCOMPETENCE, DEEP POCKETS, AND
OUTRAGEOUS DAMAGE AWARDS (1997). But cf. Brennan et al., supra note 56, at 1963-67.
112. William L.F. Felstiner et al., The Emergence and Transformation of Disputes: Naming,
Blaming, Claiming . . ., 15 LAW & SOC’Y 631, 635-37 (1980-81).
113. See Table 2, infra.
114. Regression analysis is a statistical approach widely used in the social sciences to explain
or predict the variability of a “dependent” variable (in this case, a patient’s claimant status) using
information about one or more “independent” variables” (e.g. age, gender, race etc.) Multivariate
regression refers to analyses that use three or more independent variables. The principal advantage
of regression techniques is that they allow researchers to examine the relation between a dependent
variable and each independent variable while simultaneously “holding constant” the effect of the
other independent variables. DAVID G. KLEINBAUM ET AL., APPLIED REGRESSION ANALYSIS AND
OTHER MULTIVARIATE METHODS 36-40 (1988).
115. Helen R. Burstin et al., Do the Poor Sue More?, 270 JAMA 1679 (1993).
of the country. However, our findings certainly lend plausibility to the argumentthat the findings from Utah, Colorado, New York, and California are areasonably reflection of the situation in other states.
Second, just as claims or process focused studies can say little about therelationship between the epidemiology of negligence and claims, a population-based study like the UCMPS is not specifically designed to evaluate theperformance of the malpractice system once a claim is initiated. There is some110
evidence to suggest that the malpractice system deals appropriately with theclaims it receives. Viewed as an omniscient perspective above the hospital111
floor, however, news of those system strengths may, to misquote the Gershwinbrothers, sound like a sore case of “nice recompense if you can get it.”
Which victims of negligence might express this sentiment, and what preventsthem from “naming” their loss, “blaming” a provider or institution for it, and“claiming” compensation? These questions led directly to the second set of112
analyses in our study of malpractice litigation. The raw comparison in Table 2113
between the claimants in our sample and the general study population hinted atimportant socio-demographic differences, especially in the age and insurancecoverage. But to tease out the true association between whether or notindividuals claim and their socio-demographic characteristics, it is necessary touse multivariate regression techniques. 114
To understand what characteristics were associated with claiming in theHMPS, investigators had undertaken multivariate comparison of the fifty-oneclaims matched to chart reviews in that study with a specially selected group of“controls” from the larger study sample. But despite having nearly three times115
more claimants to work with than the UCMPS, the meager sample size limitedthe kind of analyses that were possible. Specifically, HMPS investigators couldnot measure factors that influenced claiming behavior among patients who hadsuffered negligence because only eight of the fifty-one fell into this group. Inorder to gather information on this population, and circumvent the sample size
1666 INDIANA LAW REVIEW [Vol. 33:1643
116. See Table 4, infra.
117. See Burstin et al., supra note 115, at 1679.
118. See generally U.S. CONGRESS, OFFICE OF TECHNOLOGY ASSESSMENT, DO MEDICAID AND
MEDICARE PATIENTS SUE PHYSICIANS MORE OFTEN THAN OTHER PATIENTS? (1992); U.S. GENERAL
ACCOUNTING OFFICE, PUB. NO. GAO/HRD-87-55, MEDICAL MALPRACTICE: CHARACTERISTICS OF
CLAIMS CLOSED IN 1984, at 27 (1987); OPINION RESEARCH CORPORATION, AMERICAN COLLEGE OF
OBSTETRICIANS AND GYNECOLOGISTS, HOSPITAL SURVEY ON OBSTETRICAL CLAIM FREQUENCY BY
PATIENT PAYER CATEGORY (1988); Mark Sager et al., Do the Elderly Sue Physicians?, 150 ARCH.
INTERNAL MED. 1091 (1990).
119. See LuAnn Dubay et al., The Impact of Malpractice Fears on Cesarean Section Rates,
18 J. HEALTH ECON. 491 (1999).
120. See generally WILLIAM H. LANDES & RICHARD A. POSNER, THE ECONOMIC STRUCTURE
OF TORT LAW (1987); STEVEN SHAVELL, ECONOMIC ANALYSIS OF ACCIDENT LAW (1987).
121. See generally HERBERT M. KRITZER, THE JUSTICE BROKER: LAWYERS AND ORDINARY
LITIGATION (1990).
problem, we pursued a new analytical approach. We sought to take advantageof the wealth of information gathered in the UCMPS on 157 patients who werefound to have suffered negligence but had not sued by comparing them toindividuals who had sued for injuries allegedly suffered in 1992. Information onthe latter group was obtained directly from insurers.
The differences hinted at in comparison of the matches with the generalstudy population were borne out in multivariate analysis (Table 4).116
Predictably, people who did not claim despite having suffered negligence weremore likely to have suffered minor injury (odds ratio [“OR”] 6.3; ninety-fivepercent confidence interval [“CI”], 2.7 to 14.9). Non-claimants were also muchmore likely to be Medicare recipients (odds ratio [OR], 3.5; ninety-five percentconfidence interval [CI], 1.3-9.6), Medicaid recipients (OR, 3.6; ninety-percentCI, 1.4-9.0), seventy-five years or older (OR, 7.0; 95% CI, 1.7-29.6), and lowincome earners (OR, 1.9; ninety-five percent CI, 0.9-4.2).
As a result of work done in the HMPS, Burstin and colleagues had suggestedthat, when negligently injured, the elderly and the poor were less likely to sue fornegligence. Other studies have yielded conflicting answers to this question117 118
and there is anecdotal evidence of a popular perception that the reverse is true,a perception which may well influence medical practice patterns. Our study119
lends weight to Burstin’s suspicions.How can the strong association between the sociodemographic factors we
identified and underclaiming be explained? Financial incentives provide oneexplanation. Economic theories of tort law suggest that individuals who arepoor, or who do not earn income, whether or not they are poor, will be less likelyto sue. Malpractice litigation is rarely initiated without attorney involvement,120
hence a prospective litigant’s ability to claim typically hinges on an attorney’swillingness to take on their case. Because the financial return accruing toplaintiffs' attorneys in tort cases is generally linked to the size of the awardthrough contingency fees, and lost income typically forms a significant121
component of malpractice awards, a plaintiff’s lawyer would tend to maximize
2000] BEYOND DEAD RECKONING 1667
122. See John C. Coffee, Jr., Understanding the Plaintiff’s Attorney: The Implications of
Economic Theory for Private Enforcement of Law Through Class and Derivative Actions, 86
COLUM. L. REV. 669, 678 (1986); Barry R. Furrow, Medical Malpractice and Cost Containment:
Tightening the Screws, 36 CASE W. RES. L. REV. 985, 1022 (1985-86).
123. See 45 C.F.R. § 1609 (1999); Molly McNulty, Are Poor Patients Likely to Sue for
Malpractice?, 262 JAMA 1391, 1391-92 (1989).
his own income by choosing to act for clients with ongoing sources of income.122
(Indeed, the costs of costs of bringing a claim may simply exceed the damagesrecoverable.) The elderly and the poor are particularly unlikely to generateincome. Moreover, any income they do generate is less likely to be "lost"because of a decline in physical capacity occasioned by negligent injury. Inaddition, the size of any award to elderly patients will usually be constrained bytheir shorter life expectancy. Some elderly may also have trouble recognizingthat they have suffered a medical injury, much less substandard care.
Other factors that we did not account for in our statistical analysis may alsoplay a role in defining the non-claimant group. For example, a lower level ofeducation, an inability to discern the occurrence of a negligent injury, a shorterlife-expectancy, and the absence of third-party advice are all factors potentiallyrelated to both the distinctive characteristics of members of the non-claimantgroup we identified and their failure to bring suit. Regulatory barriers may alsorestrict the opportunity for poor patients to secure legal representation. Forexample, federal law prevents legal services attorneys, often the only attorneysavailable in poor neighborhoods, from taking on “fee generating” work such asmalpractice, except in extenuating circumstances. In addition, older, poorer123
patients may be simply more reluctant to sue than wealthier patients.Whatever the true underlying cause of patients failure to claim despite having
suffered negligence, the critique leveled at the efficacy of the current malpracticesystem is the same: factors other than individual merit appear to play a strongrole in determining who uses the malpractice system and who receivescompensation from it. These concerns should be understood in the context of ourmore general findings that claims lag well behind the incidence of negligentinjury, and the two are seldom connected in the current system.
We believe these results generally validate the findings of the HMPS. Asnoted earlier, our biggest fear was that the New York data, gleaned from asomewhat unstable tort environment, would not be reflective of state malpracticelitigation. This appears not to be the case. A significant gap exists betweenmedical injuries and malpractice litigation, although it is probably not as largetoday as it was in the mid-1980s.
How generalizable are our measures of malpractice litigation to other states?By the end of the second tort crisis in the late-1980s, a mature industry ofmalpractice litigation had emerged. The number of plaintiffs’ firms engaged inmalpractice litigation in most metropolitan areas had stabilized. Also, mostdefense attorneys retained by insurance companies had ten to fifteen years ofexperience in this type of litigation. Over the course of the 1990s, we have seenthe same sets of defendants’ and plaintiffs’ attorneys battling over similar cases.
1668 INDIANA LAW REVIEW [Vol. 33:1643
124. See PHYSICIAN INSURER’S ASSOCIATION OF AMERICA, CLAIM TREND ANALYSIS (1997)
(unpublished data on file with authors).
125. A third option may potentially exist for studies aimed at measuring injury costs in
“closed” populations, such as workers compensation systems: investigators may gather information
on lost wages and medical costs from administrative databases. For a methodology that approaches
this technique see, e.g., MARK A. PETERSON ET AL., COMPENSATING PERMANENT WORKPLACE
INJURIES: A STUDY OF THE CALIFORNIA SYSTEM (1997). Given the diffuse nature of administrative
data sources that would generally collect cost information on injuries, however, this approach is
infeasible in studies of injuries in general populations.
126. See Johnson et al., supra note 41, 2489.
127. See Thomas et al., Costs of Medical Injuries, supra note 80, at 255.
128. We used the used the National Association of Insurance Commissioners Severity of
Injuries Scale. See NATIONAL ASSOCIATION OF INSURANCE COMMISSIONERS, MALPRACTICE
CLAIMS: FINAL COMPILATION (M. Sowka ed., 1980).
Claim rates have changed relatively little, although the average size of verdictsand settlements is increasing at a moderate rate. This industry stability124
suggests to us that the UCMPS findings are likely to reflect the prevailingsituation in most states.
C. Economic Burden of Medical Injury
Health service researchers faced with identifying the costs of medical injuriesin the general population have two options. They may survey injured125
individuals and use information about ongoing disability, health care utilization,and the range of restrictions a person’s injury has imposed to calculate costsattributable to the injury. Alternatively, they may ask experts to estimate costsbased on their experience and available information about the injured individualand the nature of the injury itself.
Using the former approach, the HMPS reported that adverse events amongpatients hospitalized in New York in 1984 led to $3.8 billion in total health carecosts. This figure implied total national costs of slightly more than fifty billion126
dollars in 1984. After carefully weighing a mix of considerations, including127
residual reservations from the HMPS about potential recall biases, resourceconstraints, and the ethical complexities associated with re-contacting patientswith knowledge in hand both about injuries they had suffered and causes of thoseinjuries, we chose to use experts’ judgments in the UCMPS.
We began by creating a summary of each adverse event was created byhaving two physician-investigators, Thomas and Brennan, review the eleven-pageform onto which physician reviewers had transcribed information about both thepatient and the injury. These physician review forms included a narrative of theadverse event, various sociodemographic details about the patient, includingoccupation type, and a rating of severity of the disability made by the physicianreviewers and confirmed by investigators. To calculate disability, investigators128
first reviewed the adverse event summary and estimated the patient’s disability,time off work, and lifetime health care utilization based on their own expert
2000] BEYOND DEAD RECKONING 1669
129. See BUREAU OF THE CENSUS, U.S. DEP’T OF COMMERCE, STATISTICAL ABSTRACT OF THE
UNITED STATES 1994 (114th ed. 1994).
130. See ECONOMIC REPORT OF THE PRESIDENT 332, tbl. B-45 (1996).
131. See BUREAU OF LABOR STATISTICS, U.S. DEP’T OF LABOR, EMPLOYER COSTS FOR
EMPLOYEE COMPENSATION (1992).
132. In the case of adverse events resulting in death, it was also necessary to apply some of
the finer points of labor economics and make a deduction from the household production figure;
the deduction represents the amount that deceased individuals would have spent on personal
expenses, such as food and clothing, had they not died.
133. See, e.g., W. KEITH BRYANT ET AL., COLLEGE OF HUMAN ECOLOGY, CORNELL
judgment. Health care utilization estimates included number of inpatient days,outpatient visits, home health visits, physical and occupational therapy sessions,nursing home stays, and medication and medical supplies likely to be occasionedby the injury, as distinct from whatever other underlying illnesses or diseases thepatient may have been suffering at the time. Next, four experienced malpracticeclaims adjusters from Utah and six from Colorado reviewed the case summariesand made their own estimates on each of the same measures. The investigatorsand adjusters then met to discuss the results and reach a consensus where therewere disagreements.
Disability and health care utilization estimates were converted into dollars byapplying unit costs drawn from a range of sources. The Census Bureau’s CurrentPopulation Survey (“CPS”) was used to identify mean annual income for eachinjured patient, taking into account their age bracket, gender, and occupation.129
In some cases, the latter was missing from the physician review form so onlygender and age were used. We emulated real earnings growth by inflating incomeat an annual rate of 0.7%. 130
When the injuries suffered were permanent and disabling, or the patient dieddue to an adverse event, we estimated lost income up to the expected age of deathor seventy-five, assuming that earnings would be negligible after the age ofseventy-five. Life expectancy was estimated by returning to CPS data. Someadjustments were made for life expectancy, given that many patients had adverseevents as part of other co-morbid illness. The study investigators jointlyestimated life expectancy for those individuals we doubted would recoversufficiently to reach average life expectancy. We also controlled for laborparticipation rates by using CPS data on labor force participation. Fringe benefitswere assumed to be equal to twenty-seven percent of gross income and wereadded if a patient suffered permanent disability or death.131
In addition to lost wages, we estimated lost household production to accountfor the fact that some adult patients would unable to perform household dutiessuch as childcare, cooking, and cleaning because of their injuries. Here, we132
used a replacement costs method, calculating the amount it would have cost tohire someone else to perform the task. We relied on the precedent of Utah’s no-fault automobile insurance system to value such household production at twentydollars per day, a paltry sum, but consistent with per diem figures used in otherindependent research in this area. 133
1670 INDIANA LAW REVIEW [Vol. 33:1643
UNIVERSITY, THE DOLLAR VALUE OF HOUSEHOLD WORK (1992).
134. See Mark Crane, What Your Colleagues Are Charging, 69 MED. ECON. 190, 191-217
(1992).
135. See MONTALVE, RED BOOK: MEDICAL ECONOMICS DATA (1992).
136. See HEALTH CARE FINANCING ADMINISTRATION, U.S. DEP’T OF HEALTH AND HUMAN
SERVICES, PUB. NO. 03354, STATE DATA BOOK ON LONG-TERM CARE PROGRAM AND MARKET
CHARACTERISTICS (1994).
137. See Table 5, infra.
138. Using similar methods to those used by Wilson and colleagues in the Australian study
of adverse events, see Thomas et al., supra note 98, Thomas and Brennan rendered a judgment
about the preventability of each adverse event. This process was separate from and subsequent to
identification of the adverse events themselves in record review. Like negligence, and the adverse
event judgment itself, preventability judgements were recorded on a six-point confidence scale, see
supra note 33 and accompanying text. Similar implicit judgment methodologies have been used
by other researchers to judge preventability of adverse events. See, e.g., David W. Bates et al.,
Incidence of Adverse Drug Events and Potential Adverse Drug Events, 274 JAMA 29 (1995).
Health care costs were more straightforward to estimate. We derived averagepayments for inpatient days from health insurers in each state. Physician feeswere based on a survey of physicians in the western United States.134
Pharmaceutical costs could be estimated by using the average wholesale price fordrugs, obtained from the Red Book of pharmaceutical prices. We employed135
Medicaid average per patient payments to nursing homes for those patients forwhom admission to long-term care was projected.136
Each of these key expenditure items, lost wages, lost household production,and health care costs, were then incorporated into an economic consequencesmodel. We multiplied the population weight of each patient, determined by thesampling scheme, times the economic consequences calculated for that patient’sadverse event. We discounted to 1996 dollars for future costs, using a realinterest rate of 2.75%. Finally, data for the two states were combined in theinterests of achieving more stable estimates.
The total economic consequences of all adverse events estimated to haveoccurred in Utah and Colorado in 1992 were $661.9 million, as shown in Table5. A subset of all adverse events judged to have been preventable accounted137
for nearly one-half of this total, or $308.3 million. Postoperative complications138
and adverse drug events were the most expensive type of adverse events, with theformer giving rise to $232 million in costs and the latter, $213.7 million.
The largest share of the total was accounted for by health care costs. Morethan $348 million was spent on treatment resulting from adverse events sufferedin hospitals in the two states in 1992. (Lost household wages were the secondhighest component, accounting for $160.9 million.) Surprisingly, one-half ofthese health care costs were attributable to nursing home care expenditures.Inpatient hospital costs absorbed the next largest portion (forty-one percent),followed by non-intensive care bed days (thirty-one percent) and intensive care(ten percent). In total, the health care costs of adverse events in Utah andColorado that accrued in outpatient settings, inclusive of nursing home costs,
2000] BEYOND DEAD RECKONING 1671
139. See Thomas et al., Costs of Medical Injuries, supra note 80, at 260-61.
140. See David W. Bates et al., The Costs of Adverse Drug Events in Hospitalized Patients,
277 JAMA 277 (1997); David C. Classen et al., Adverse Drug Events in Hospitalized Patients
Excess Length-of-Stay Extra Costs Attributed Mortality, 277 JAMA 301 (1997).
were nearly twice as large as the inpatient costs. This finding is all the moreremarkable when one considers that adverse events suffered in the inpatientsetting were the focus of the UCMPS.
When extrapolated to the thirty-three million discharges from Americanhospitals in 1992, our estimates put annual costs of adverse events nationwide atapproximately thirty-eight billion dollars. This is smaller, although not greatlydissimilar, to the fifty billion dollar figure derived from patient interviews in theHMPS. Of course, some of this difference is driven by the slightly higher139
adverse event rate detected in New York. When adjusted to 1996 dollars andrecalculated with UCMPS adverse event rates, the New York data suggest annualcosts of $147 per capita; the UCMPS estimates are $132 per capita. Some of theresidual differential between these figures is explained by the greater severity ofinjuries in New York. However, the proximity of the two estimates is noteworthyin light of the fact that the studies used two quite different methodologies.
One lesson from our cost analyses concerns the importance of lookingbeyond inpatient health care costs in estimating the effects of iatrogenic injury.Our estimates suggest that more than sixty percent of total health care costs maybe generated outside the hospital. This, in turn, suggests that other studies ofadverse event that have focused exclusively on inpatient costs—for example,those undertaken in the field of drug-related adverse events —are likely to have140
missed the full economic implications of the medical injuries they examined.Even UCMPS estimates of outpatient care are appropriately interpreted as alower bound on these costs for two reasons. First, as noted above, inpatientadverse events were the unit of analysis in our study. Those injuries thattranspired exclusively in the outpatient setting would not have been captured.Second, we used average Medicaid payments in each state as an indicator ofcosts; such payments do not consider out-of-pocket spending or private insurancecosts associated with the injuries.
Our findings also provide some targets for improvement. The costliest areasappear to be surgical adverse events, adverse drug events, and those adverseevents due to incorrect diagnoses. Front-end expenditures devoted to preventingmedical error in these areas could yield savings overall, although preciseestimates of the cost trade-offs involved are desperately needed. Thus, the nextphase of research into the economic consequences of medical injury may wellbelong to cost-effectiveness analysts. We believe the input of researchers in thisfield may well be the key to hastening market-driven quality improvement efforts.But even without the benefit of such analyses, the economic research to datesuggests that, as a whole, American hospitals are almost certainly underspendingin their efforts to prevent adverse events. More than one-half of the adverseevents we detected were judged preventable. If such prevention occurred, itwould relieve the U.S. health care system of nearly twenty billion dollars in
1672 INDIANA LAW REVIEW [Vol. 33:1643
141. See BUREAU OF THE CENSUS, U.S. DEP’T OF COMMERCE, STATISTICAL ABSTRACT OF THE
UNITED STATES 1997, Table 155.
142. See generally DANZON, supra note 2; Joshua Fruchter, Doctors on Trial: A Comparison
of American and Jewish Legal Approaches to Medical Malpractice, 19 AM. J.L. & MED. 453
(1993); Clark C. Havighurst & Laurence R. Tancredi, “Medical Adversity Insurance”—A No-Fault
Approach to Medical Malpractice and Quality Assurance, 51 MILBANK Q. 125 (1973); Michael A.
Jones, Medical Injury—The Fault with No-Fault, 83 PROF. NEG. (1987); Jeffrey O’Connell, No-
Fault Insurance for Injuries Arising from Medical Treatment: A Proposal for Elective Coverage,
24 EMORY L.J. 21 (1975); Geoffrey Palmer, The Ninth Monsanto Lecture: The Design of
Compensation Systems: Tort Principles Rule, O.K.?, 29 VAL. U. L. REV. 1115 (1995); Michael J.
Saks, Do We Really Know Anything About the Behavior of the Tort Litigation System—and Why
Not?, 140 U. PA. L. REV. 1147 (1992); Carolyn Sappideen, No Fault Compensation for Medical
Misadventure—Australian Expression of Interest, 9 J. CONTEMP. HEALTH L. & POL’Y 311 (1993);
Stephen D. Sugarman, Doing Away with Tort Law, 73 CAL. L. REV. 558 (1985).
143. See generally Paul C. Weiler, The Case for No-Fault Medical Liability, 52 MD. L. REV.
908 (1993).
144. See Elliott M. Abramson, The Medical Malpractice Imbroglio: A Non-Adversarial
Suggestion, 78 KY. L.J. 293, 304 (1989-1990); Randall R. Bovbjerg, Medical Malpractice:
Research and Reform, 79 VA. L. REV. 2155 (1993) (reviewing WEILER ET AL., supra note 37); Jerry
L. Mashaw & Theodore R. Marmor, Conceptualizing, Estimating, and Reforming Fraud, Waste,
and Abuse in Health Care Spending, 11 YALE J. ON REG. 455, 486-87 (1994); Michael J. Sacks,
Medical Malpractice: Facing Real Problems and Finding Real Solutions, 35 WM. & MARY L. REV.
693, 704-05 (1994) (reviewing WEILER ET AL., supra note 37); Steven D. Sugarman, 1499 Doctor
No, 58 U. CHI. L. REV. 1499-1516 (1991) (reviewing WEILER, supra note 13).
health care costs, or two percent of present health care expenditures. A greater141
investment in prevention strategies is crucial.
D. The Persistent Question: How to Improve Compensation of Medical Injuries?
Many commentators have suggested that alternative approaches tocompensating medical injuries should be considered in the United States. An142
administrative system, somewhat similar to current workers’ compensationregimes, that does not make compensation contingent on proof that fault ornegligence caused the injury in question, has long been heralded as the bestcandidate. But many concerns have been raised about the notion of a pure “no-143
fault” system, the principal one being that such a system would be inordinatelyexpensive to operate in his country. To some extent, our own findings in the144
HMPS and the UCMPS about the size of the medical injury problem, andassociated costs, may be interpreted as bolstering this argument. Recalling thegrand total reported in the previous section, a price tag of more than $650 millionwould substantially exceed the resources currently channeled into the medicalmalpractice systems in Utah and Colorado. According to our best estimates, andthose of our collaborators in Utah and Colorado, malpractice premiums paid inthose states in 1996 totaled approximately $60 million and $100 million
2000] BEYOND DEAD RECKONING 1673
145. See David M. Studdert et al., Can the United States Afford a "No-Fault" System of
Compensation for Medical Injury?, 60 LAW & CONTEMP. PROBS. 1, 31 (1997).
146. See WEILER ET AL., supra note 37, at 104-09.
147. DCEs are predetermined categories of medical injuries that are identified by medical
experts as statistically preventable given appropriate management. Proposals for systematic use of
such devices have been termed "selective no-fault": on the one hand, only those medical injuries
selected for coverage by professional judgment are included. ABA COMMISSION ON MEDICAL
PROFESSIONAL LIABILITY, DESIGNATED COMPENSABLE EVENT SYSTEM: A FEASIBILITY STUDY 8
(1990); Randall R. Bovbjerg et al., Obstetrics and Malpractice: Evidence on the Performance of
a Selective No-Fault System, 265 JAMA 2836, 2836 (1991); Havighurst & Tancredi, supra note
142; Laurence R. Tancredi & Randall R. Bovbjerg, Rethinking Responsibility for Patient Injury:
Accelerated Compensation Events, A Malpractice and Quality Reform Ripe for a Test, 54 LAW &
CONTEMP. PROBS. 147, 149 (1991).
148. See Carl Oldertz, The Patient, Pharmaceutical and Security Insurances, in
COMPENSATION FOR PERSONAL INJURY IN SWEDEN AND OTHER COUNTRIES 51 (Carl Oldertz & Eva
Tidefelt eds., 1998).
respectively.145
However, this kind of cost comparison is far too simplistic. Medicalmalpractice litigation compensates lost wages and some of the other losses weaccounted for in our economic consequences calculations. But certain medicalcosts and lost household production are not always addressed in tort awards.Conversely, our totals did not figure in some losses, most notably pain andsuffering, that the medical malpractice system includes in awards. But moreimportant than adjustment of these line items is the broader recognition that it isboth naïve and misleading to assess the merits of no-fault by imagining a schemethat would attempt to compensate the universe of iatrogenic injury. No suchscheme has ever been seriously proposed—indeed, administrative practicalitieswould render it inoperable.
Given the policy imperatives that motivated the UCMPS, evaluation of theeconomic feasibility of a practical, workable no-fault scheme was a key studygoal from the outset. HMPS investigators had completed some interestingtheoretical analyses of the feasibility of a no-fault program for compensatingmedical injuries, but they did not undertake a detailed assessment of its designor affordability. The leading contribution to design work in medical no-fault146
systems comes from Bovbjerg and Tancredi, who developed an innovative set ofadministrative compensation criteria. Designated compensable events (“DCEs”),and their later manifestation, accelerated compensation events (“ACEs”), arecriteria used for the purpose of efficiently deciding the question of compensationwith certain types of injury. Building on Bovbjerg and Tancredi’s ideas, we147
investigated design options for a more encompassing scheme. We were attractedto the Swedish Patient Injury Compensation Fund. Sweden has successfully148
operated the Fund, an administrative compensation program, for the past twodecades. The criteria used do not contemplate all adverse events as compensableinjuries. Rather, they incorporate consideration of the “avoidability” of the
1674 INDIANA LAW REVIEW [Vol. 33:1643
149. Studdert et al., supra note 145, at 104-09.
150. We had found that approximately one-half of the adverse events were preventable,
roughly double the number that could be attributed to negligence. See supra note 138.
151. See Studdert et al., supra note 145, at 8.
152. See MICHAEL L. BROOKSHIRE & STAN V. SMITH, ECONOMIC/HEDONIC DAMAGES: THE
PRACTICE BOOK FOR PLAINTIFF AND DEFENSE ATTORNEYS 161-66 (1990); Steven P. Croley & Jon
D. Hanson, The Nonpecuniary Costs of Accidents: Pain-and-Suffering Damages in Tort Law, 108
HARV. L. REV. 1785, 1837-41 (1995).
153. Randall R. Bovbjerg et al., Valuing Life and Limb in Tort: Scheduling Pain and
Suffering, 83 NW. U. L. REV. 908, 937 (1989).
154. A deductible or threshold period eliminates relatively minor injuries from the pool of
injuries eligible for compensation. It also has the benefit of channeling available funds to victims
injury—a notion we have previously described in detail. Avoidability149
essentially turns on whether the physicians could reasonably have acted in a waythat would have averted the injury at issue. Thus, it closely approximates thepreventability judgments to which we subjected all adverse events detected in theUCMPS as part of the economic analyses. 150
We hypothesized that designing a no-fault program around compensationcriteria that incorporated an avoidability/preventability component woulddemarcate a generous, yet manageable, body of medical injuries as eligible forcompensation. In conceptual terms, the size of the pool of injuries contemplatedlies between all adverse events (i.e., pure no-fault) and negligent adverse events(i.e., the malpractice system). We further hypothesized that compensating all151
avoidable adverse events would not be prohibitively expensive. It wasanticipated that the costs would in fact be comparable to those of the tort systembecause expenditures associated with the increased number of awards in ourmodel would largely be offset by administrative savings and the use of slightlymore modest awards than those parceled out in litigation.
Some stakeholders in Utah and Colorado indicated at the outset that a modelthat did not include pain and suffering would be politically untenable. Mostadministrative compensation schemes do not address pain and suffering,primarily because they do not rely on juries, and quantum of non-economic losseshas largely been understood as a jury determination. Previous analysis of jury152
verdict data by Bovbjerg and colleagues provided us with an opportunity toobtain “average” non-economic awards made to plaintiffs within specific age anddisability strata. To include consideration of the costs associated with other153
components of a reasonable compensation package—including lost wages, losthousehold production, and health care costs—we replicated calculations from oureconomic consequences analyses.
Use of the Swedish avoidability criteria yielded estimates of the totalcompensation budget, including projected administrative costs, which weresignificantly lower than the total injury costs obtained in our earlier analysis ofthe economic consequences of medical injury. Costs are further decreased if aneight-week disability (or “deductible”) period is added as a prerequisite toaccessing compensation In Utah, the total for compensating the Swedish154
2000] BEYOND DEAD RECKONING 1675
whose losses that are least likely to be covered by other sources of coverage, such as sick pay for
time lost from work. See Theodore F. Haas, On Reintegrating Workers’ Compensation and
Employers’ Liability, 21 GA. L. REV. 843, 891-95 (1987). In addition, we have previously noted
that application of a disability threshold can be expected to confer administrative, as well as
financial, benefits. Disentangling the harmful consequences of the original illness from those
attributable to the medical injury itself is a problem that is most acute in the immediate post-
treatment period. See WEILER ET AL., supra note 37, at 101-03.
155. These figures are in discounted 1996 dollars. For a detailed explanation of these
calculations, see Studdert et al., supra note 145, at 26 (Tab. 2).
156. See Table 6, infra.
157. See Katherine R. Levit et al., State Health Expenditure Accounts: Building Blocks for
State Health Spending Analysis, 17 HEALTH CARE FIN. REV. 201, 231 Tab. 11 (1995).
158. See Table 7, infra.
159. See id.
compensable events with an eight-week disability period, inclusive of pain andsuffering, lost wages and household production, and health care costs was $76.8million. In Colorado, the costs were almost exactly $100 million. 155
Table 6 compares of the affordability of candidate no-fault schemes by156
comparing their cost to estimates of the cost of the current medical malpracticesystem in each state. In Utah, one approach to compensation under considerationduring the UCMPS proposed use of Swedish compensable events, a $100,000 capon pain and suffering, a four week disability period, no household production,and sixty-six percent wage replacement. The estimated costs of such a program,after addition of administrative and birth injury costs, would be $54.9 million.In Colorado, the preferred model also involved use of Swedish compensableevents, an eight-week disability period, and did not include household production.Our calculations suggested total system costs of $102.4 million for Colorado.
Thus, our cost estimates for the Swedish-style systems in Utah and Coloradocompare favorably to the tort system: at $54.9 million, the Utah model wouldcost approximately the same as the tort system, while at eighty-two milliondollars, the Colorado model would actually be expected to reduce the costs ofcompensating medical injury by eighteen million to twenty-eight million dollarsannually. To keep these estimates in perspective, it is worth noting that in 1992,our study year, total personal health care expenditures were $3.8 billion in Utahand $9.4 billion in Colorado.157
Table 7 shows the “ratcheting” effects of removing household production158
and pain and suffering, items that some policy makers may believe aredispensable. The table also shows how the number of beneficiaries shifts withthe selection of different deductible periods. For example, the number of patientseligible for compensation in Colorado decreases from 5919 to 1604 with use ofa four-week deductible period, and to 973 with an eight-week period.Proportionally similar decreases occur in Utah when these time thresholds areapplied.
More generally, Table 7 illustrates the modular nature of the various159
components of the compensation package. Policymakers could use these methods
1676 INDIANA LAW REVIEW [Vol. 33:1643
160. See, e.g., AMARTYA SEN, INEQUALITY REEXAMINED (1995); Arti Kaur Rai, Rationing
Through Choice: A New Approach to Cost-Effectiveness Analysis in Health Care, 72 IND. L.J.
1015 (1997).
161. See Bovbjerg & Sloan, supra note 19, at 71-72. See generally David M. Studdert et al.,
The Jury Is Still in: Florida's Birth-Related Neurological Injury Compensation Association After
a Decade, 25 HEALTH POL. POL’Y & L. 469 (2000).
162. See Studdert et al., supra note 145, at 6.
to project the costs of high priority components in a compensation plan and to testthe budgetary impact of adding or eliminating other components. Decisionsabout the trade-offs involved across dimensions—the number of patients eligiblefor compensation, for example, and the importance of household production toawards—could play out in public and legislative debates around appropriate usesof scarce resources. Of course, such decisions go to the central problem ofdistributive justice in compensation.
Estimates such as those made the UCMPS inject some operational realitiesinto the debate about distributive justice. The view often espoused by plaintiffs’advocates is that when a medical injury occurs because of the negligence of aphysician or hospital, it should be compensated and compensated generously. Aswe have seen, however, the present system comes nowhere close to realizing thisideal. It is quite haphazard and fails to compensate many worthy individuals.Moreover, our analyses demonstrate that distributive justice is further undercutby systematic differences along socio-demographic lines in the enjoyment ofwhat compensation the malpractice system does provide.
But even when inefficiencies and inequities in the compensation process arereduced, the central problem of distributive justice remains: how should scarceresources be allocated? An administrative compensation scheme cannot160
circumvent this difficult question. But it would allow stakeholders to agree uponeligible injuries and obtainable remedies in advance, which should promoteequity, predictability and efficiency in the distribution process. In other words,an important feature of such a system would be to make more explicit the criteriaused for the allocation and distribution of resources used to compensate medicalinjury. At some level, explicit rationing must enter the fray, in the form ofdecisions to exclude household production losses, for example, or exclusion ofinjuries that caused disability lasting less than eight weeks. But we believe thisapproach is preferable to the implicit rationing that occurs by virtue of the factthat many victims of medical injury cannot or do not obtain compensation fortheir injuries from the Byzantine tort system.
Another advantage of a no-fault approach that warrants mention is that, ifcarefully designed, it could eliminate much of the adversarial nature of medicalmalpractice litigation. We were astonished to find that physicians in Sweden161
actively participate in sixty to eighty percent of the claims that are made, helpingtheir patients complete and file the relevant forms. Compensation appears to162
be culturally ingrained there as a matter of social justice, not as an admission ofprovider guilt or negligence. At its best, the injury compensation process inSweden supports, rather than conflicts, with the health care professional’s
2000] BEYOND DEAD RECKONING 1677
163. See Walter J. Wadlington, A Medical Malpractice Crisis in 1995?: Some Conceivable
Scenarios, 36 ST. LOUIS U. L.J. 897 (1992).
164. See generally Bovbjerg & Sloan, supra note 19.
165. See TO ERR IS HUMAN: BUILDING A SAFER HEALTH SYSTEM (L.T. Kohn et al. eds.,
1999). For examples of the media attention that surrounded release of the report, see, e.g., Bob
David & Julie Appleby, Medical Mistakes 8th Top Killer, USA TODAY, Nov. 30, 1999, at 1A; Ellen
commitment to the patient and to excellence in medical practice.
CONCLUSION
The main objectives of the UCPMS were to test the results of the HMPS ina new health care environment and to explore the feasibility of a no-fault systemfor compensating medical injury. With support from the Robert Wood JohnsonFoundation, cooperation from hospitals, physicians and malpractice insurers inUtah and Colorado, and the efforts of numerous collaborators, these objectiveswere achieved. Overall, the UCMPS lent strong support to the iatrogenic injuryrates, economic calculations, and malpractice patterns estimated in New Yorknearly a decade earlier. The UCMPS findings were no carbon copy, however.For instance, we found significantly lower iatrogenic death rates in Utah andColorado. We also gained fresh insights into the burden of iatrogenic injury byinvestigating previously understudied areas, such as the resources devoted tooutpatient services to treat the after-effects of adverse events.
The results of our efforts to conceptualize an administrative compensationscheme based on avoidability criteria and project its costs, provide considerablecause for optimism about the feasibility of a no-fault system. Even before ourwork was complete, however, it was apparent in both states that the enthusiasmof our collaborators would not be sufficient to transform the no-fault initiativeinto political action. The 1990s had contravened the predictions of somepundits, failing to produce the sort of malpractice “crisis” experienced in the163
preceding two decade. Relative stability in malpractice insurance marketsappeared to sap legislative interest in large-scale tort reform.
Thus, it is not without some foundation that skeptics may conclude that thetrue mission of the UCMPS failed; its empirical findings have not been used toinform meaningful policy reform. We prefer to take a longer-term view of thevalue of the study. It is our hope that when the political winds shift, a probableoccurrence given a history of cyclical interest in alternative compensationapproaches in the United States, the UCMPS methods and findings stand ready164
to be used by other policymakers who become interested in no-fault. Ironically,hints of just such a shift have surfaced at the federal level over the past sixmonths. But rather than being borne of dissatisfaction with the malpracticesystem as a mechanism for compensating injured patients, interest in malpracticealternatives has been invigorated by a spate of media and political attentiondirected at error in medicine. In particular, the widely-publicized report, To Erris Human, issued by the Institute of Medicine in December 1999, appears to haveraised the public awareness about the burden of medical error to a new level.165
1678 INDIANA LAW REVIEW [Vol. 33:1643
Goodman, In Hospitals, to Err Is Human, to Fess Up Is Necessary, BOSTON GLOBE, Dec. 9, 1999,
at A23; Robert Pear, Group Asking U.S. for New Vigilance in Patient Safety, N.Y. TIMES, Nov. 30,
1999, at A1.
166. See Donald M. Berwick & Lucian L. Leape, Reducing Errors in Medicine: It's Time to
Take This More Seriously, 319 BRITISH MED. J. 136 (1999).
167. See generally Robert L. Helmreich, On Error Management: Lessons from Aviation,
320 BRITISH MED. J. 781; Leape, supra note 47. Evidence that progress in reducing the burden of
iatrogenic illness lies in these directions has begun to accumulate. See Brennan, supra note 94.
168. See Liang, supra note 48.
The link between no-fault and error reduction is quite compelling. As thereport makes clear, many errors fall into the avoidable category and could bereduced if proper error-prevention strategies are put into place. Although thescience of error reduction in medicine is in its infancy and much remains to belearned about what strategies work best and how they should be implemented, itis already clear that attention to individual provider judgment and action,hallmarks of the malpractice system, will not be an important ingredient insolutions. On the contrary, there is a growing sense that this orientation feeds166
the problem. The most promising possibilities for advancement appear to lie ininterventions designed to modify the systems in which medicine is practiced,together with ignition of the sort of professional commitment to error-reductionthat has developed in certain areas of the airline industry.167
In addition, we believe that eliminating the specter of litigation would alsoremove the principal barrier to the free flow of information about medical errors.A centrally maintained registry of avoidable events could be an important sourceof data for those interested in applying continuous quality improvement andepidemiological techniques to prevent errors. A no-fault compensation authoritycould assume this function, but it is incompatible with the current structure of themedical malpractice industry. At present, most medical liability insurersmaintain their research in a manner heavily geared toward defense objectives.There is no overarching classification scheme and error-related aspects ofindividual claims are ignored, unless directly related to the question ofnegligence. Thus, it is virtually impossible to undertake cross-insurercomparisons of medical malpractice claims and no single insurer has a sufficientnumber of claims to support serious epidemiological analysis. A central registry,maintained with an administrative compensation scheme, would solve theseproblems. It could also be designed to integrate human factor analysis and otherclassifications that are helpful to error-prevention technologies and be updatedas the science evolves.
This is certainly a very hopeful scenario for the integration of errorprevention with an administrative compensation scheme. But an avoidability-based compensation scheme could provide an enormous boost to error reductionefforts by aligning the foci of the compensation and quality improvement systemsand centering attention on precisely those injuries that are eradicable.168
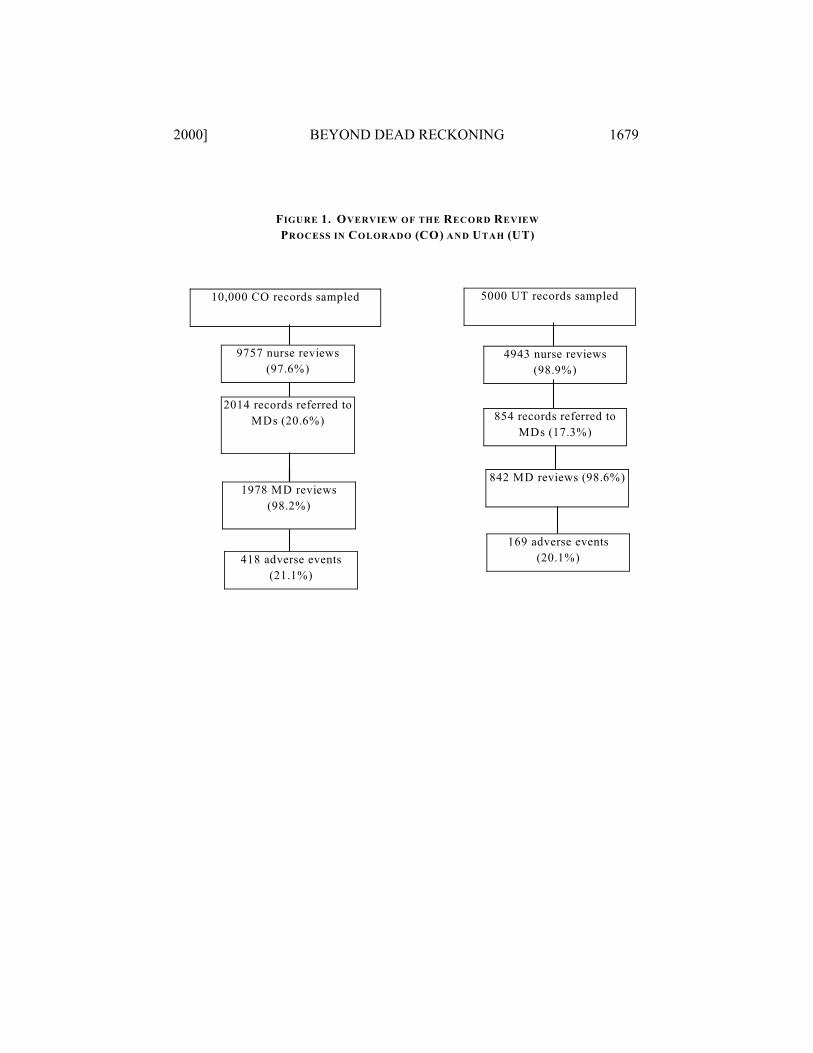
2000] BEYOND DEAD RECKONING 1679
FIGURE 1. OVERVIEW OF THE RECORD REVIEW
PROCESS IN COLORADO (CO) AND UTAH (UT)
10,000 CO records sampled
9757 nurse reviews
(97.6%)
2014 records referred to
MDs (20.6%)
1978 MD reviews
(98.2%)
418 adverse events
(21.1%)
5000 UT records sampled
4943 nurse reviews
(98.9%)
854 records referred to
MDs (17.3%)
842 MD reviews (98.6%)
169 adverse events
(20.1%)
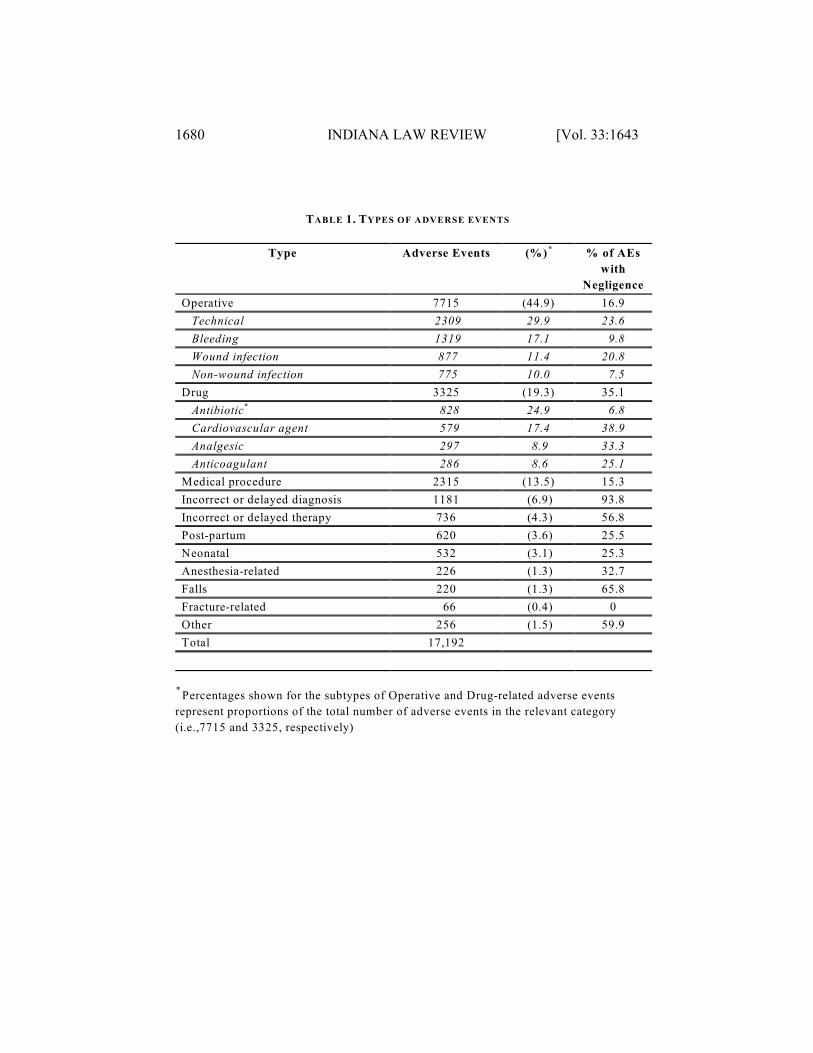
1680 INDIANA LAW REVIEW [Vol. 33:1643
TABLE 1. TYPES OF ADVERSE EVENTS
Type Adverse Events (%) % of AEs*
with
Negligence
Operative 7715 (44.9) 16.9
Technical 2309 29.9 23.6
Bleeding 1319 17.1 9.8
Wound infection 877 11.4 20.8
Non-wound infection 775 10.0 7.5
Drug 3325 (19.3) 35.1
Antibiotic* 828 24.9 6.8
Cardiovascular agent 579 17.4 38.9
Analgesic 297 8.9 33.3
Anticoagulant 286 8.6 25.1
Medical procedure 2315 (13.5) 15.3
Incorrect or delayed diagnosis 1181 (6.9) 93.8
Incorrect or delayed therapy 736 (4.3) 56.8
Post-partum 620 (3.6) 25.5
Neonatal 532 (3.1) 25.3
Anesthesia-related 226 (1.3) 32.7
Falls 220 (1.3) 65.8
Fracture-related 66 (0.4) 0
Other 256 (1.5) 59.9
Total 17,192
Percentages shown for the subtypes of Operative and Drug-related adverse events *
represent proportions of the total number of adverse events in the relevant category
(i.e.,7715 and 3325, respectively)
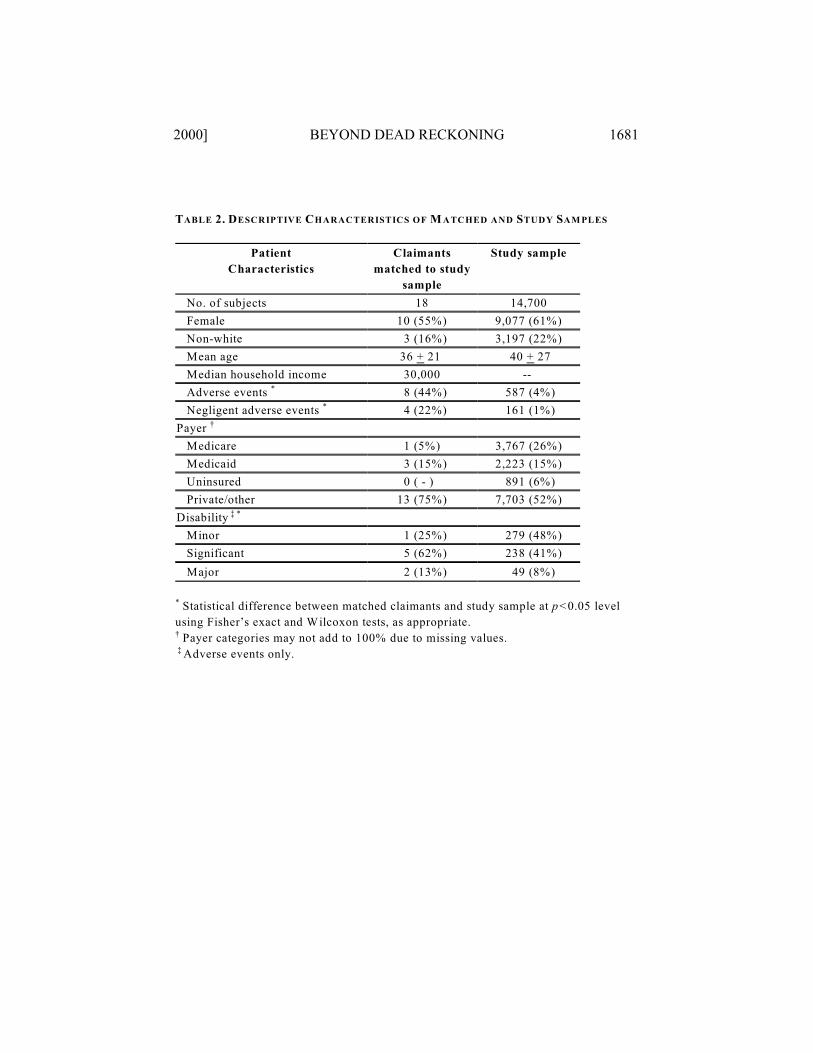
2000] BEYOND DEAD RECKONING 1681
TABLE 2. DESCRIPTIVE CHARACTERISTICS OF M ATCHED AND STUDY SAM PLES
Patient
Characteristics
Claimants
matched to study
sample
Study sample
No. of subjects 18 14,700
Female 10 (55%) 9,077 (61%)
Non-white 3 (16%) 3,197 (22%)
Mean age 36 + 21 40 + 27
Median household income 30,000 --
Adverse events 8 (44%) 587 (4%)*
Negligent adverse events 4 (22%) 161 (1%) *
Payer †
Medicare 1 (5%) 3,767 (26%)
Medicaid 3 (15%) 2,223 (15%)
Uninsured 0 ( - ) 891 (6%)
Private/other 13 (75%) 7,703 (52%)
Disability ‡ *
Minor 1 (25%) 279 (48%)
Significant 5 (62%) 238 (41%)
Major 2 (13%) 49 (8%)
Statistical difference between matched claimants and study sample at p<0.05 level*
using Fisher’s exact and Wilcoxon tests, as appropriate.
Payer categories may not add to 100% due to missing values.†
Adverse events only. ‡
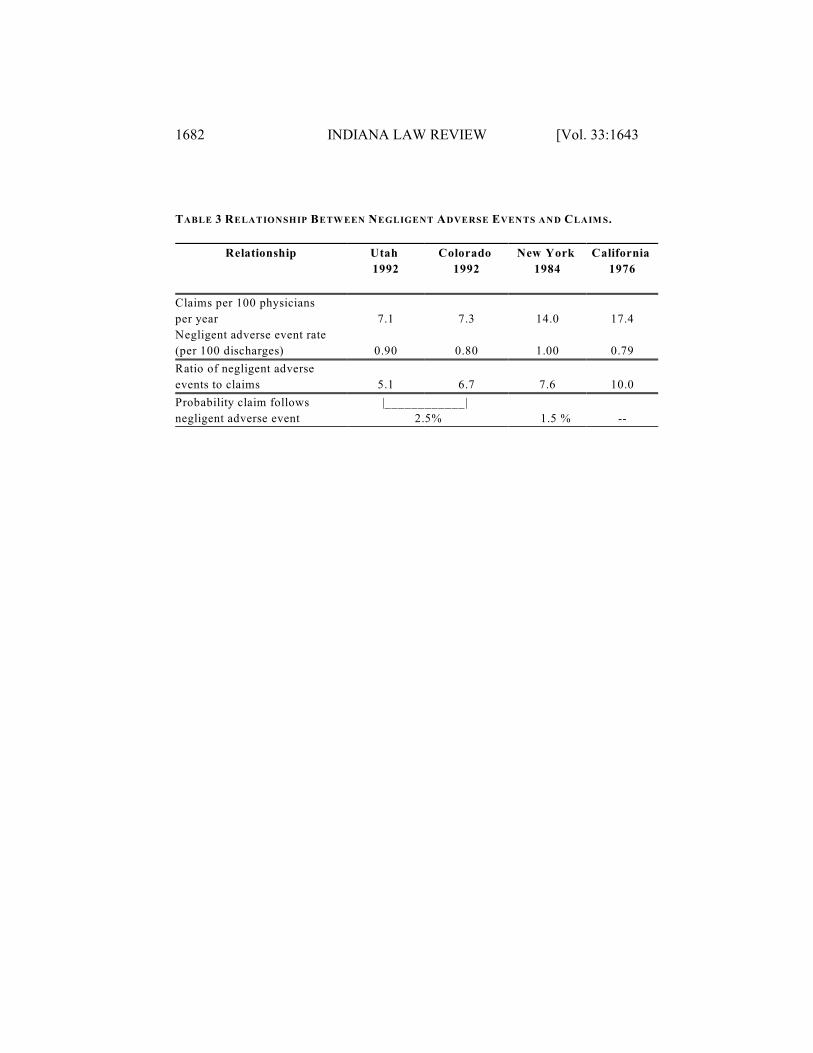
1682 INDIANA LAW REVIEW [Vol. 33:1643
TABLE 3 RELATIONSHIP BETW EEN NEGLIGENT ADVERSE EVENTS AND CLAIM S.
Relationship Utah
1992
Colorado
1992
New York
1984
California
1976
Claims per 100 physicians
per year 7.1 7.3 14.0 17.4
Negligent adverse event rate
(per 100 discharges) 0.90 0.80 1.00 0.79
Ratio of negligent adverse
events to claims 5.1 6.7 7.6 10.0
Probability claim follows
negligent adverse event
|______
2.
______|
5% 1.5 % --
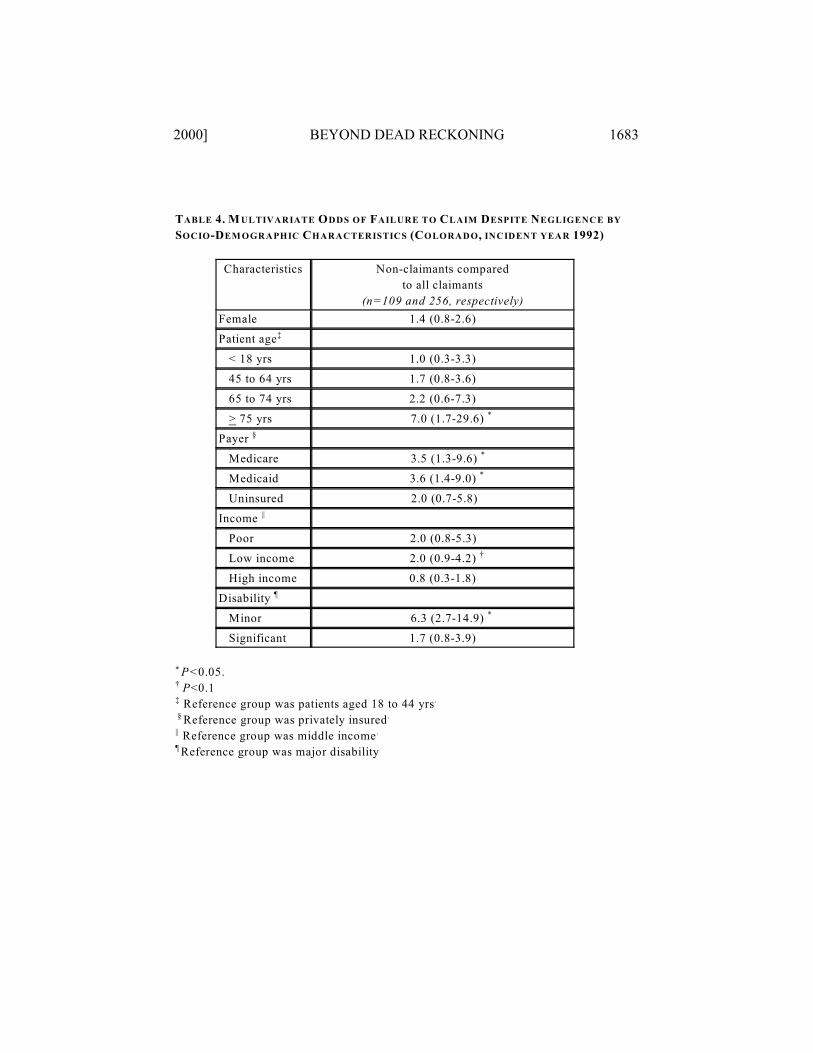
2000] BEYOND DEAD RECKONING 1683
TABLE 4. M ULTIVARIATE ODDS OF FAILURE TO CLAIM DESPITE NEGLIGENCE BY
SOCIO-DEM OGRAPHIC CHARACTERISTICS (COLORADO, INCIDENT YEAR 1992)
Characteristics Non-claimants compared
to all claimants
(n=109 and 256, respectively)
Female 1.4 (0.8-2.6)
Patient age‡
< 18 yrs 1.0 (0.3-3.3)
45 to 64 yrs 1.7 (0.8-3.6)
65 to 74 yrs 2.2 (0.6-7.3)
> 75 yrs 7.0 (1.7-29.6) *
Payer §
Medicare 3.5 (1.3-9.6) *
Medicaid 3.6 (1.4-9.0) *
Uninsured 2.0 (0.7-5.8)
Income ||
Poor 2.0 (0.8-5.3)
Low income 2.0 (0.9-4.2) †
High income 0.8 (0.3-1.8)
Disability ¶
Minor 6.3 (2.7-14.9) *
Significant 1.7 (0.8-3.9)
P<0.05.*
P<0.1†
Reference group was patients aged 18 to 44 yrs‡ .
Reference group was privately insured § .
Reference group was middle income|| .
Reference group was major disability¶
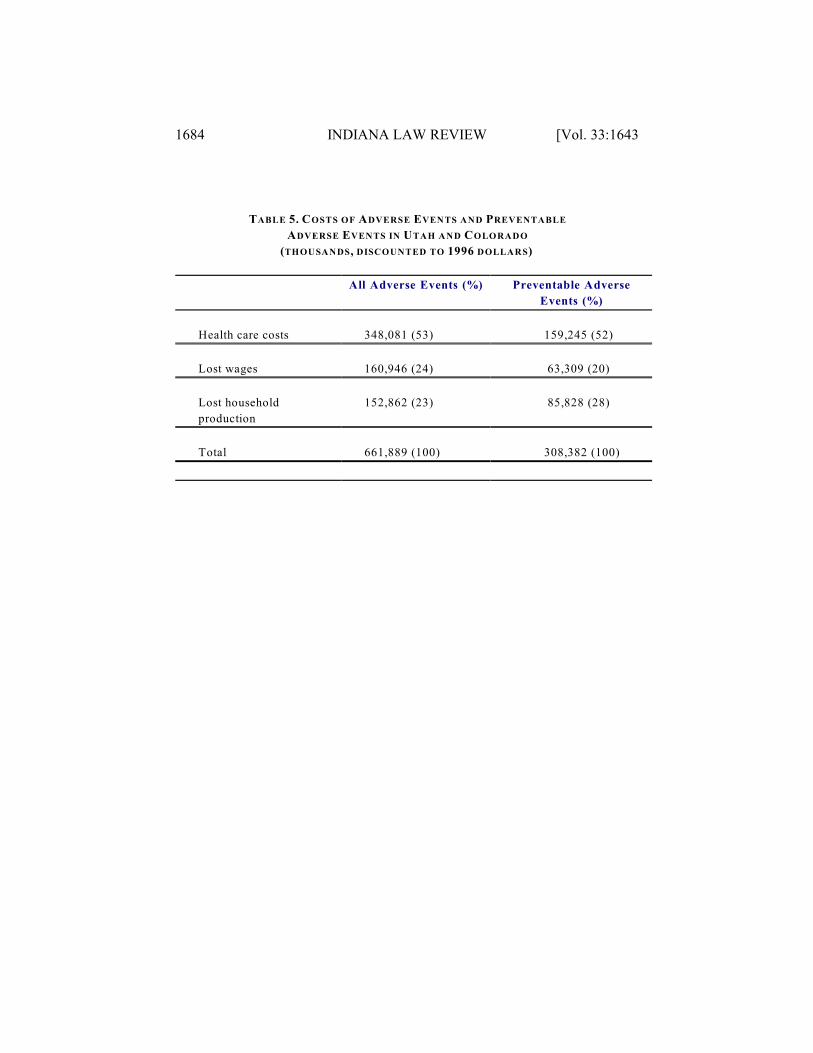
1684 INDIANA LAW REVIEW [Vol. 33:1643
TABLE 5. COSTS OF ADVERSE EVENTS AND PREVENTABLE
ADVERSE EVENTS IN UTAH AND COLORADO
(THOUSANDS, DISCOUNTED TO 1996 DOLLARS)
All Adverse Events (%) Preventable Adverse
Events (%)
Health care costs 348,081 (53) 159,245 (52)
Lost wages 160,946 (24) 63,309 (20)
Lost household
production
152,862 (23) 85,828 (28)
Total 661,889 (100) 308,382 (100)
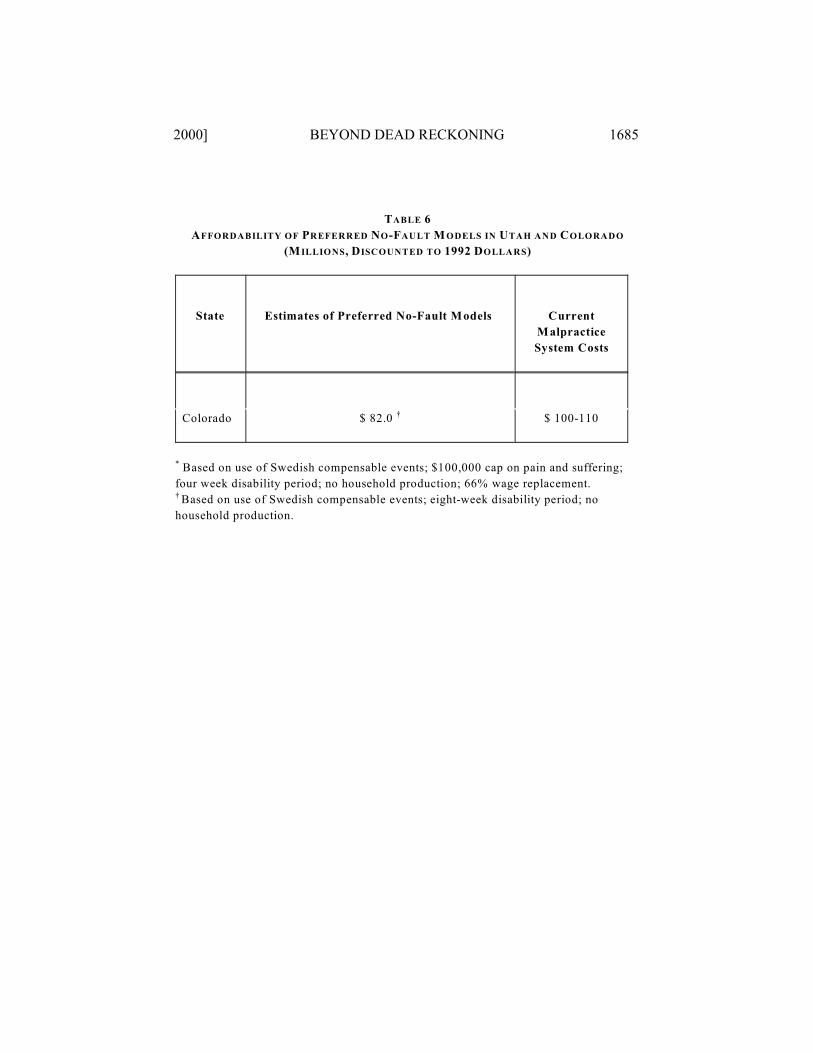
2000] BEYOND DEAD RECKONING 1685
TABLE 6
AFFORDABILITY OF PREFERRED NO-FAULT M ODELS IN UTAH AND COLORADO
(M ILLIONS, DISCOUNTED TO 1992 DOLLARS)
State Estimates of Preferred No-Fault Models Current
Malpractice
System Costs
Colorado $ 82.0 $ 100-110†
Based on use of Swedish compensable events; $100,000 cap on pain and suffering;*
four week disability period; no household production; 66% wage replacement.
Based on use of Swedish compensable events; eight-week disability period; no†
household production.
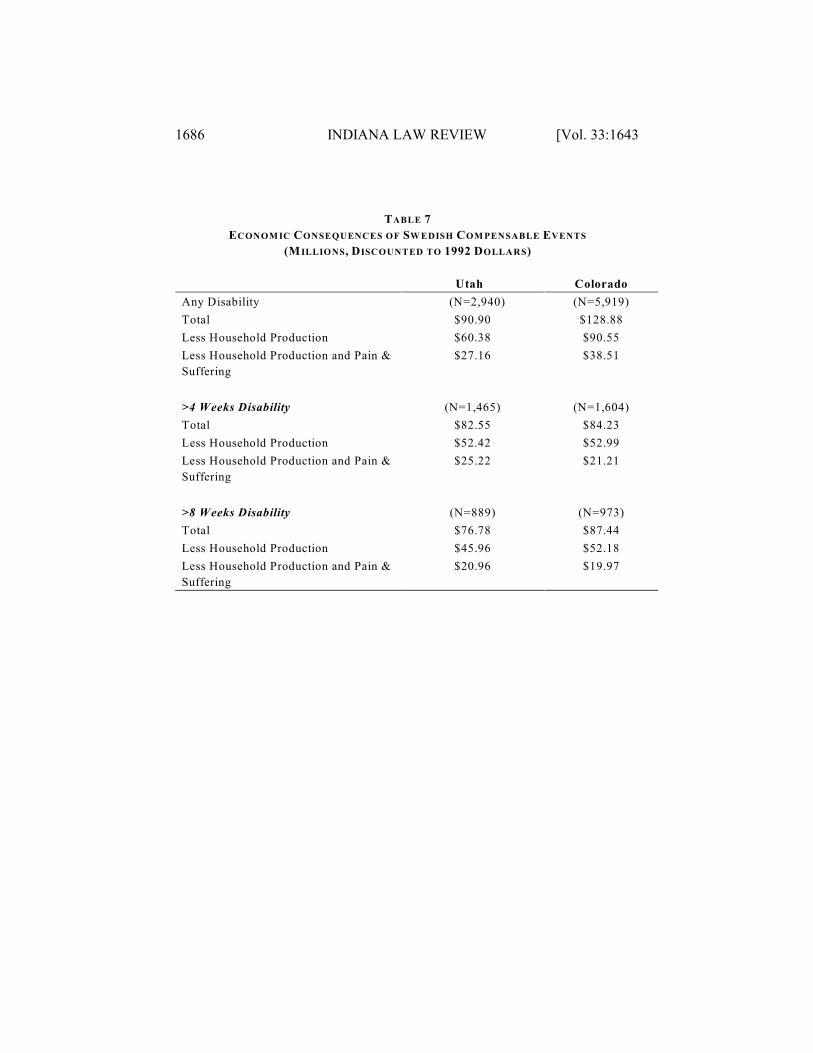
1686 INDIANA LAW REVIEW [Vol. 33:1643
TABLE 7
ECONOM IC CONSEQUENCES OF SW EDISH COM PENSABLE EVENTS
(M ILLIONS, DISCOUNTED TO 1992 DOLLARS)
Utah Colorado
Any Disability (N=2,940) (N=5,919)
Total $90.90 $128.88
Less Household Production $60.38 $90.55
Less Household Production and Pain &
Suffering
$27.16 $38.51
>4 Weeks Disability (N=1,465) (N=1,604)
Total $82.55 $84.23
Less Household Production $52.42 $52.99
Less Household Production and Pain &
Suffering
$25.22 $21.21
>8 Weeks Disability (N=889) (N=973)
Total $76.78 $87.44
Less Household Production $45.96 $52.18
Less Household Production and Pain &
Suffering
$20.96 $19.97
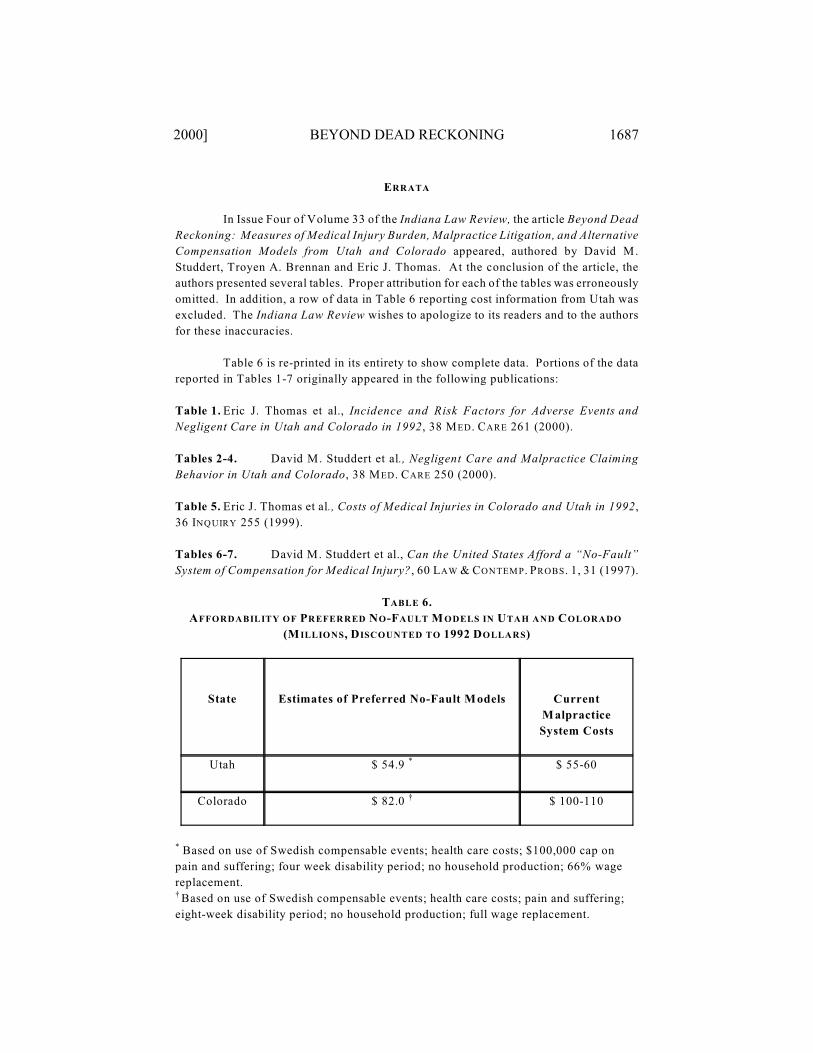
2000] BEYOND DEAD RECKONING 1687
ERRATA
In Issue Four of Volume 33 of the Indiana Law Review, the article Beyond Dead
Reckoning: Measures of Medical Injury Burden, Malpractice Litigation, and Alternative
Compensation Models from Utah and Colorado appeared, authored by David M.
Studdert, Troyen A. Brennan and Eric J. Thomas. At the conclusion of the article, the
authors presented several tables. Proper attribution for each of the tables was erroneously
omitted. In addition, a row of data in Table 6 reporting cost information from Utah was
excluded. The Indiana Law Review wishes to apologize to its readers and to the authors
for these inaccuracies.
Table 6 is re-printed in its entirety to show complete data. Portions of the data
reported in Tables 1-7 originally appeared in the following publications:
Table 1. Eric J. Thomas et al., Incidence and Risk Factors for Adverse Events and
Negligent Care in Utah and Colorado in 1992, 38 MED . CARE 261 (2000).
Tables 2-4. David M. Studdert et al., Negligent Care and Malpractice Claiming
Behavior in Utah and Colorado, 38 MED . CARE 250 (2000).
Table 5. Eric J. Thomas et al., Costs of Medical Injuries in Colorado and Utah in 1992,
36 INQUIRY 255 (1999).
Tables 6-7. David M. Studdert et al., Can the United States Afford a “No-Fault”
System of Compensation for Medical Injury?, 60 LAW & CONTEM P. PROBS. 1, 31 (1997).
TABLE 6.
AFFORDABILITY OF PREFERRED NO-FAULT M ODELS IN UTAH AND COLORADO
(M ILLIONS, DISCOUNTED TO 1992 DOLLARS)
State Estimates of Preferred No-Fault Models Current
Malpractice
System Costs
Utah $ 54.9 $ 55-60*
Colorado $ 82.0 $ 100-110†
Based on use of Swedish compensable events; health care costs; $100,000 cap on*
pain and suffering; four week disability period; no household production; 66% wage
replacement.
Based on use of Swedish compensable events; health care costs; pain and suffering;†
eight-week disability period; no household production; full wage replacement.