Embed Size (px)
Citation preview
Beyond the Audit: Discovering Opportunities for Program Improvement
Dr. Lee Funk, Special Education Director School Innovations & Achievement
Susan Kelch, Socorro ISD, Special Education Director, Retired
Former President of TCASE
Proprietary information. Not for copy or distribution.
1
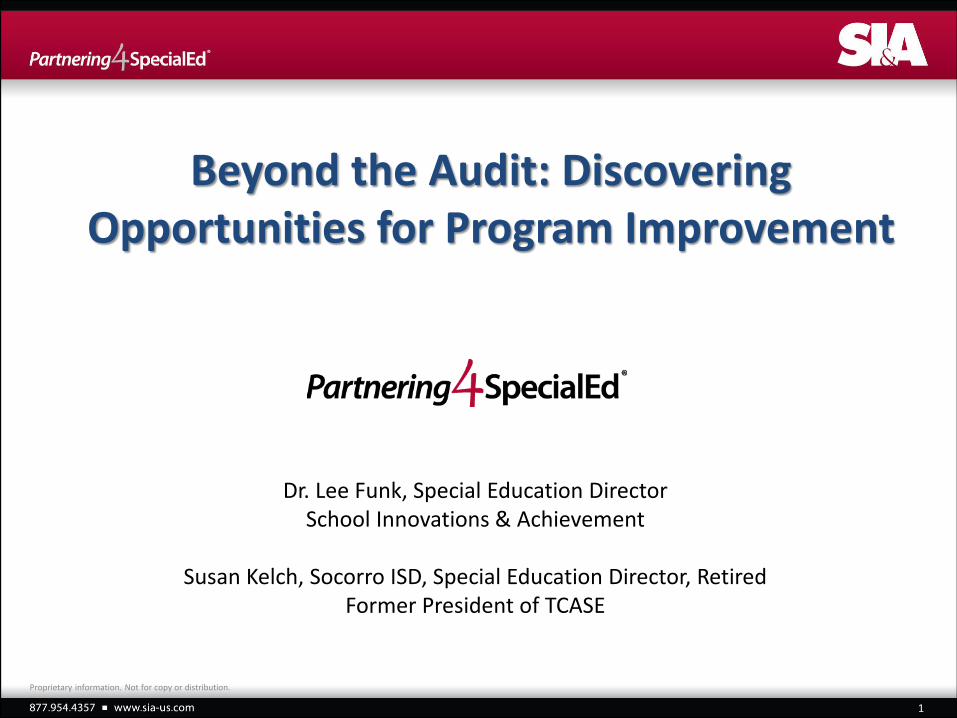
Objectives of Presentation
Review and discuss factors that contribute to a thorough evaluation of special education programs in order to guide decisions for program enhancements.
Discuss dominate trends throughout the nation to identify areas where informed actions can improve programs for better outcomes for students with disabilities.
Proprietary information. Not for copy or distribution.
2
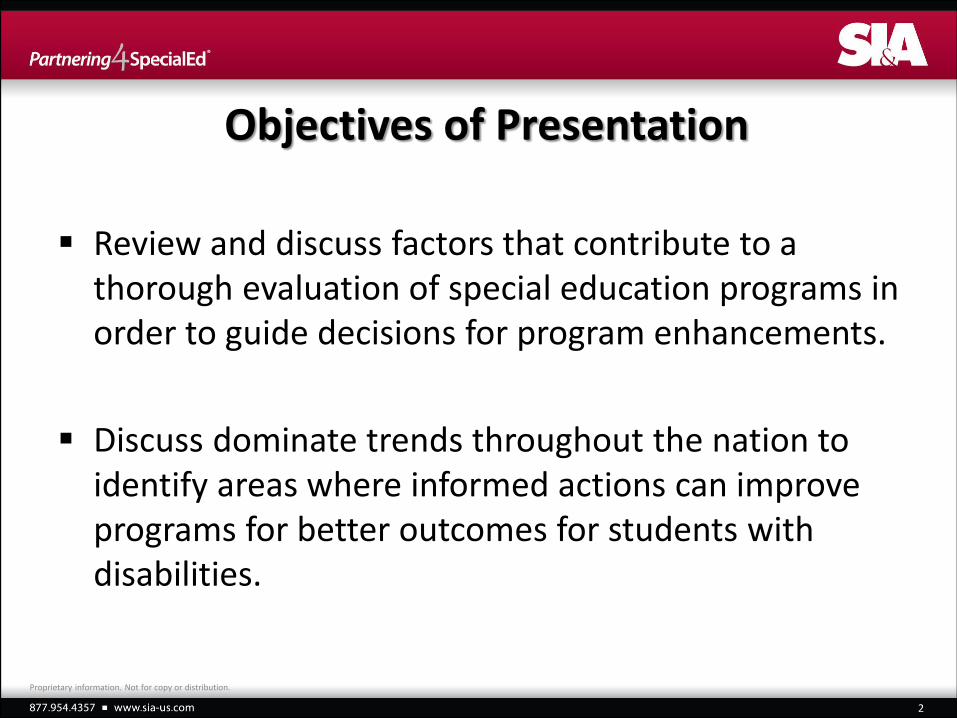
Going Beyond the Audit
What does that mean?
How is it different?
Why bother?
What matters?
How can it benefit my district in the short term?
How can it benefit my district in the long term?
How can we sustain the benefits?
What should we look for in a partnership?
Proprietary information. Not for copy or distribution.
3
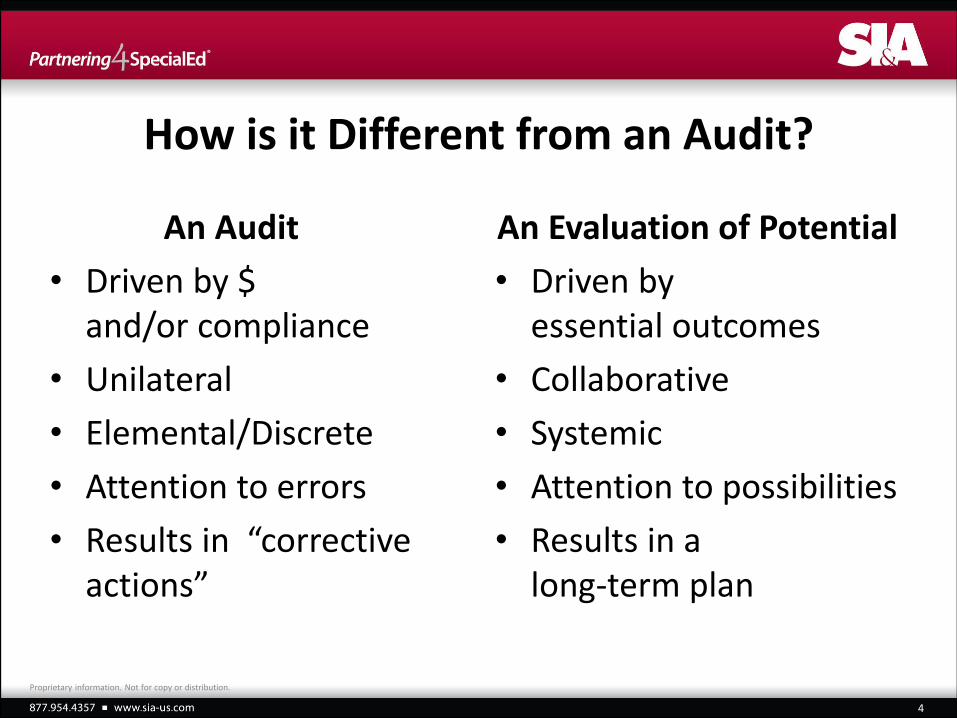
How is it Different from an Audit?
An Audit
• Driven by $ and/or compliance
• Unilateral
• Elemental/Discrete
• Attention to errors
• Results in “corrective actions”
4
An Evaluation of Potential
• Driven by essential outcomes
• Collaborative
• Systemic
• Attention to possibilities
• Results in a long-term plan
Proprietary information. Not for copy or distribution.
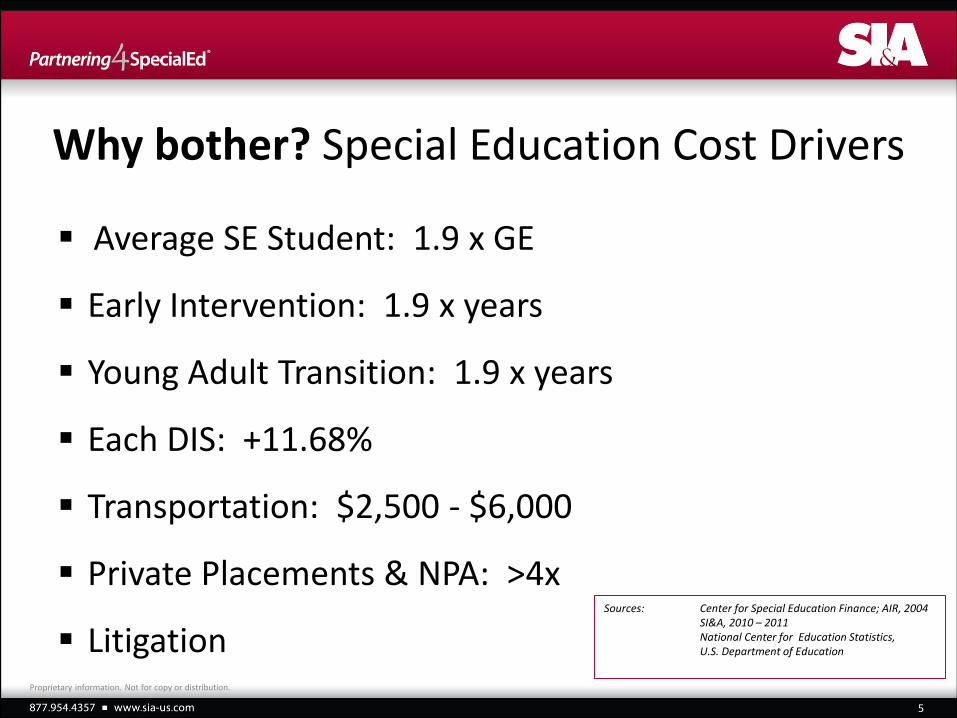
Why bother? Special Education Cost Drivers
5
Average SE Student: 1.9 x GE
Early Intervention: 1.9 x years
Young Adult Transition: 1.9 x years
Each DIS: +11.68%
Transportation: $2,500 - $6,000
Private Placements & NPA: >4x
Litigation Sources: Center for Special Education Finance; AIR, 2004 SI&A, 2010 – 2011 National Center for Education Statistics, U.S. Department of Education
Proprietary information. Not for copy or distribution.
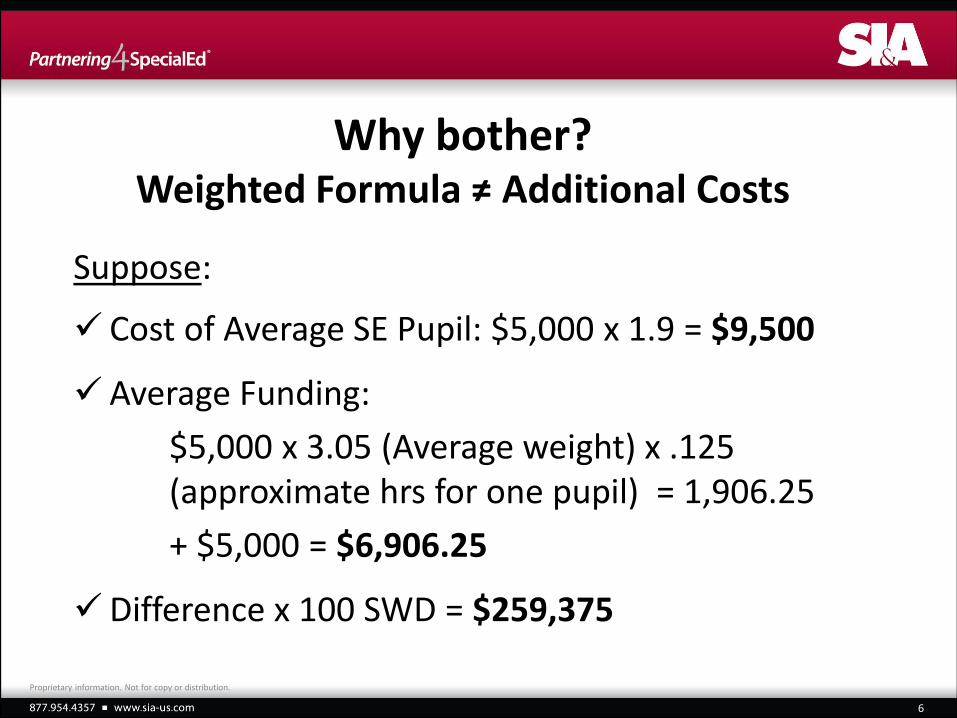
Why bother? Weighted Formula ≠ Additional Costs
Suppose:
Cost of Average SE Pupil: $5,000 x 1.9 = $9,500
Average Funding:
$5,000 x 3.05 (Average weight) x .125 (approximate hrs for one pupil) = 1,906.25
+ $5,000 = $6,906.25
Difference x 100 SWD = $259,375
6
Proprietary information. Not for copy or distribution.
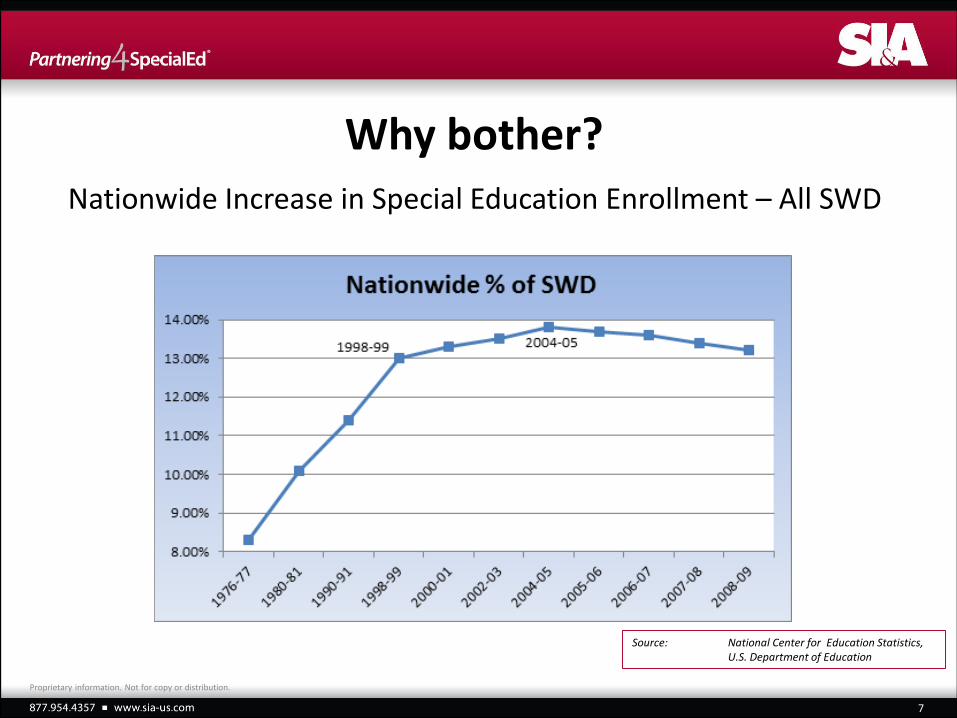
Nationwide Increase in Special Education Enrollment – All SWD
7
Why bother?
Source: National Center for Education Statistics, U.S. Department of Education
Proprietary information. Not for copy or distribution.
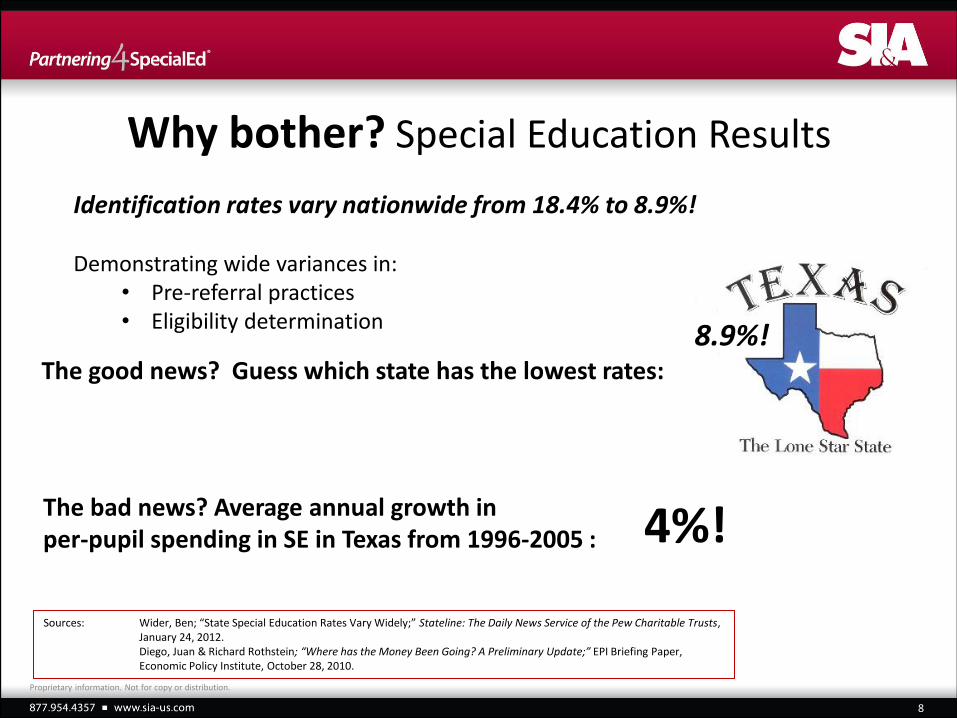
Why bother? Special Education Results
8
The good news? Guess which state has the lowest rates:
Identification rates vary nationwide from 18.4% to 8.9%! Demonstrating wide variances in:
• Pre-referral practices • Eligibility determination
8.9%!
The bad news? Average annual growth in per-pupil spending in SE in Texas from 1996-2005 : 4%!
Sources: Wider, Ben; “State Special Education Rates Vary Widely;” Stateline: The Daily News Service of the Pew Charitable Trusts, January 24, 2012. Diego, Juan & Richard Rothstein; “Where has the Money Been Going? A Preliminary Update;” EPI Briefing Paper, Economic Policy Institute, October 28, 2010.
Proprietary information. Not for copy or distribution.
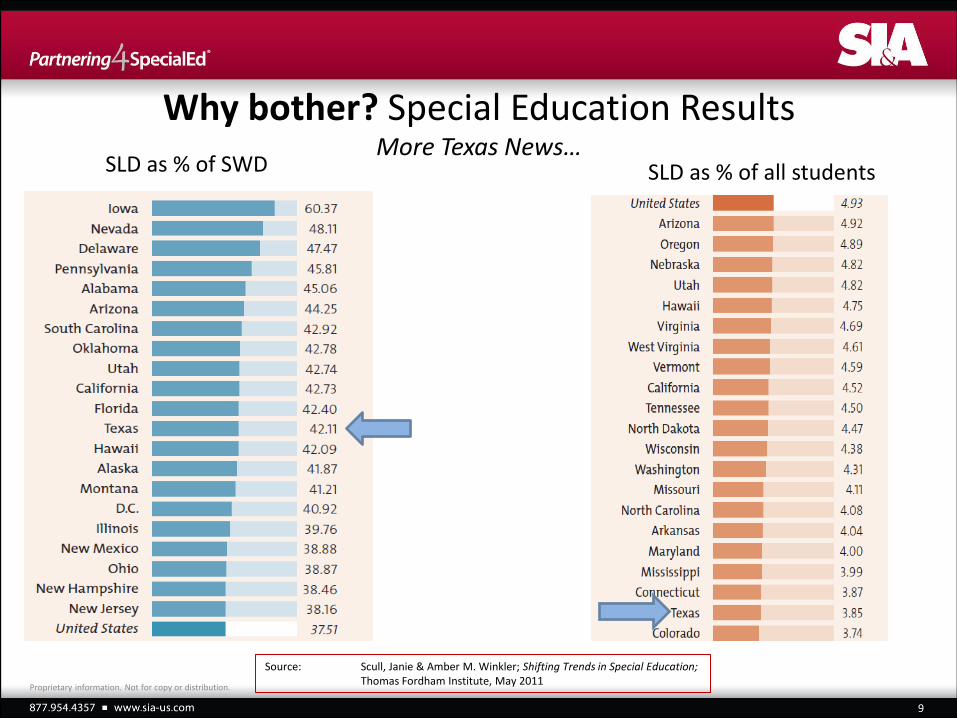
Why bother? Special Education Results More Texas News…
9
SLD as % of SWD SLD as % of all students
Source: Scull, Janie & Amber M. Winkler; Shifting Trends in Special Education; Thomas Fordham Institute, May 2011
Proprietary information. Not for copy or distribution.
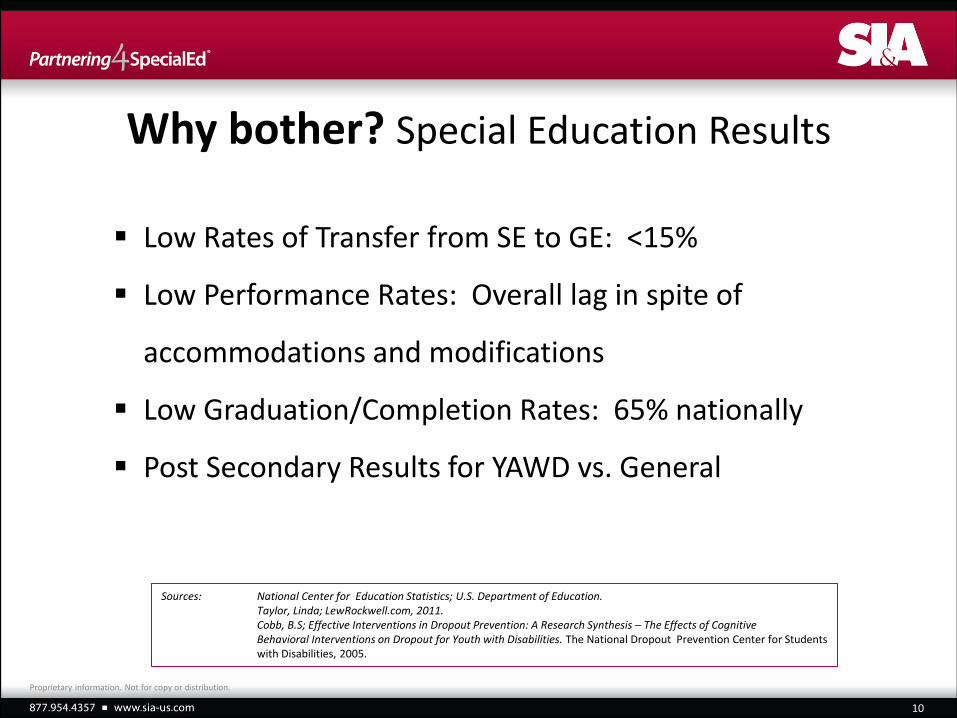
Why bother? Special Education Results
10
Low Rates of Transfer from SE to GE: <15%
Low Performance Rates: Overall lag in spite of
accommodations and modifications
Low Graduation/Completion Rates: 65% nationally
Post Secondary Results for YAWD vs. General
Sources: National Center for Education Statistics; U.S. Department of Education. Taylor, Linda; LewRockwell.com, 2011. Cobb, B.S; Effective Interventions in Dropout Prevention: A Research Synthesis – The Effects of Cognitive Behavioral Interventions on Dropout for Youth with Disabilities. The National Dropout Prevention Center for Students with Disabilities, 2005.
Proprietary information. Not for copy or distribution.
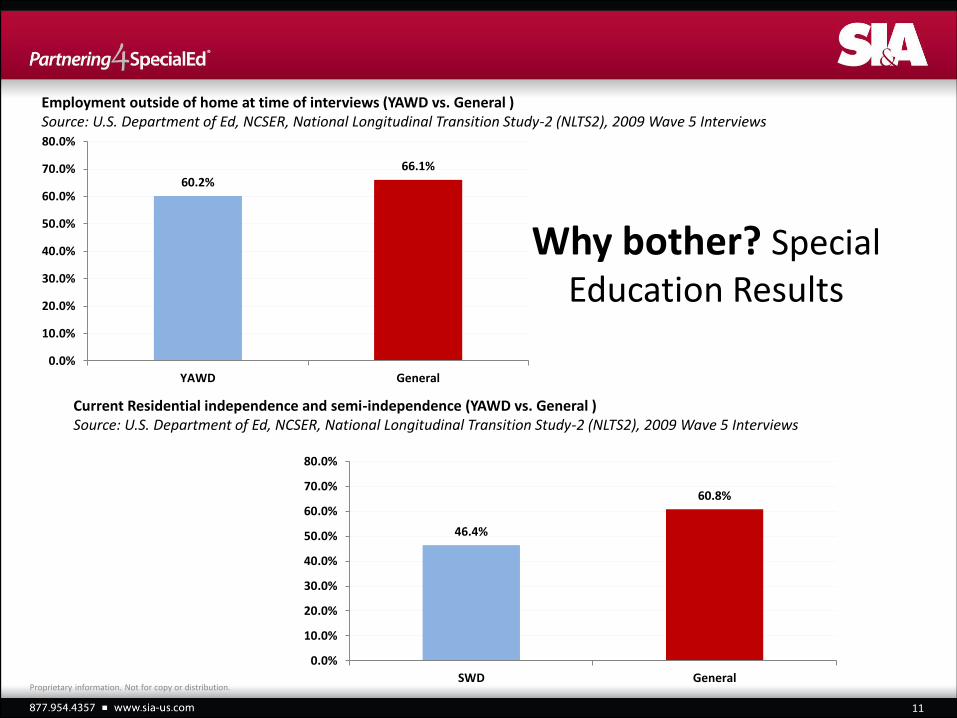
Why bother? Special Education Results
11
Employment outside of home at time of interviews (YAWD vs. General ) Source: U.S. Department of Ed, NCSER, National Longitudinal Transition Study-2 (NLTS2), 2009 Wave 5 Interviews
60.2% 66.1%
0.0%
10.0%
20.0%
30.0%
40.0%
50.0%
60.0%
70.0%
80.0%
YAWD General
Current Residential independence and semi-independence (YAWD vs. General ) Source: U.S. Department of Ed, NCSER, National Longitudinal Transition Study-2 (NLTS2), 2009 Wave 5 Interviews
46.4%
60.8%
0.0%
10.0%
20.0%
30.0%
40.0%
50.0%
60.0%
70.0%
80.0%
SWD GeneralProprietary information. Not for copy or distribution.
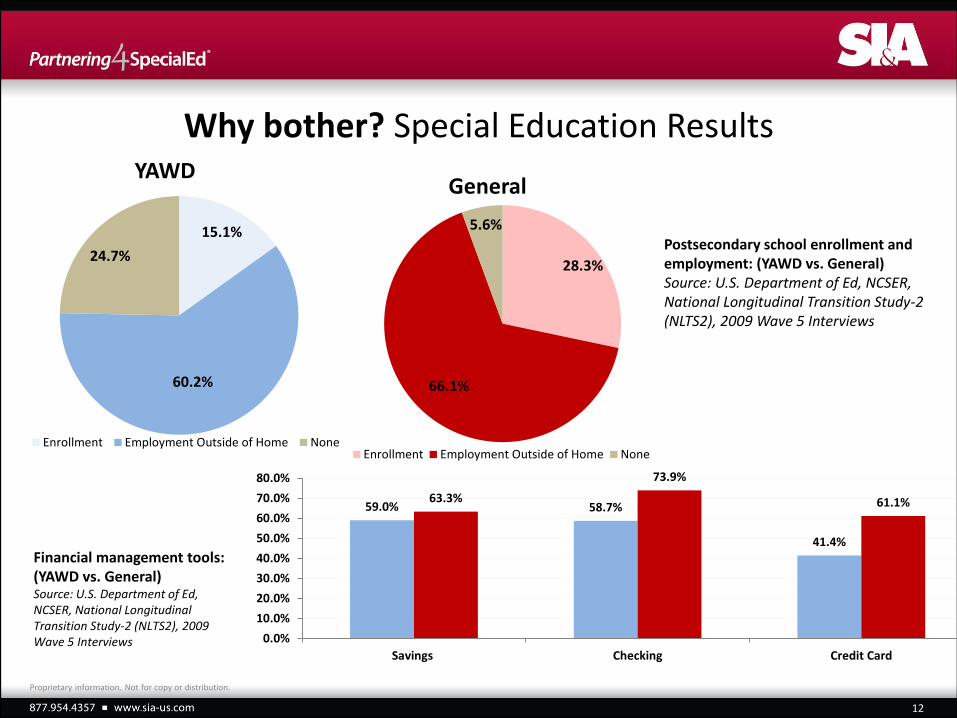
Why bother? Special Education Results
12
Financial management tools: (YAWD vs. General) Source: U.S. Department of Ed, NCSER, National Longitudinal Transition Study-2 (NLTS2), 2009 Wave 5 Interviews
59.0% 58.7%
41.4%
63.3%
73.9%
61.1%
0.0%
10.0%
20.0%
30.0%
40.0%
50.0%
60.0%
70.0%
80.0%
Savings Checking Credit Card
Postsecondary school enrollment and employment: (YAWD vs. General) Source: U.S. Department of Ed, NCSER, National Longitudinal Transition Study-2 (NLTS2), 2009 Wave 5 Interviews
28.3%
66.1%
5.6%
Enrollment Employment Outside of Home None
General
15.1%
60.2%
24.7%
Enrollment Employment Outside of Home None
YAWD
Proprietary information. Not for copy or distribution.
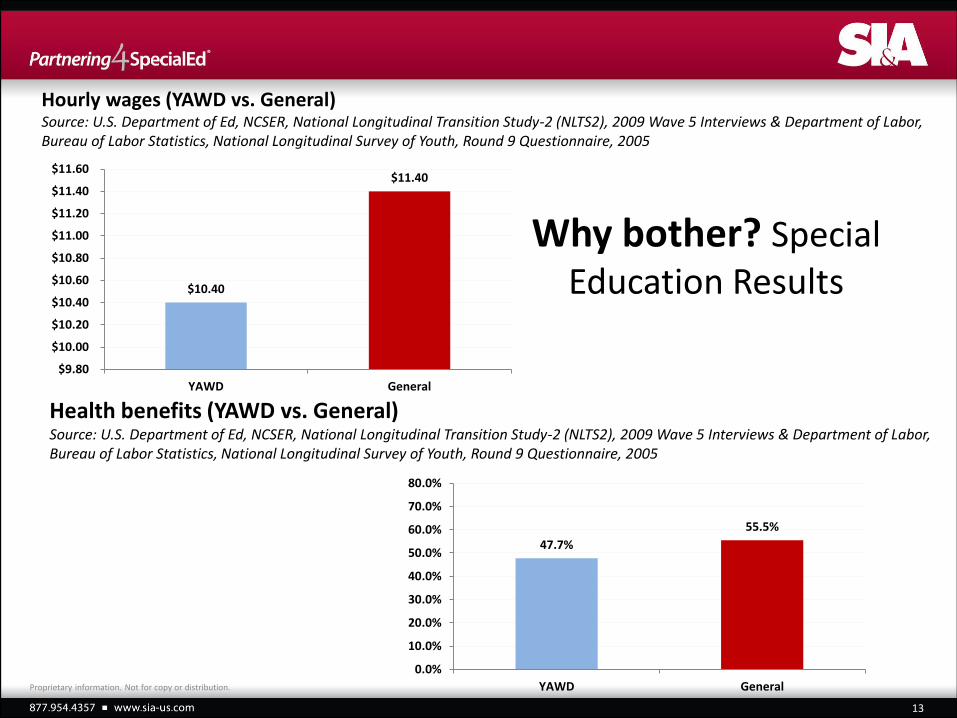
Why bother? Special Education Results
13
Hourly wages (YAWD vs. General) Source: U.S. Department of Ed, NCSER, National Longitudinal Transition Study-2 (NLTS2), 2009 Wave 5 Interviews & Department of Labor, Bureau of Labor Statistics, National Longitudinal Survey of Youth, Round 9 Questionnaire, 2005
Health benefits (YAWD vs. General) Source: U.S. Department of Ed, NCSER, National Longitudinal Transition Study-2 (NLTS2), 2009 Wave 5 Interviews & Department of Labor, Bureau of Labor Statistics, National Longitudinal Survey of Youth, Round 9 Questionnaire, 2005
$10.40
$11.40
$9.80
$10.00
$10.20
$10.40
$10.60
$10.80
$11.00
$11.20
$11.40
$11.60
YAWD General
47.7%
55.5%
0.0%
10.0%
20.0%
30.0%
40.0%
50.0%
60.0%
70.0%
80.0%
YAWD GeneralProprietary information. Not for copy or distribution.
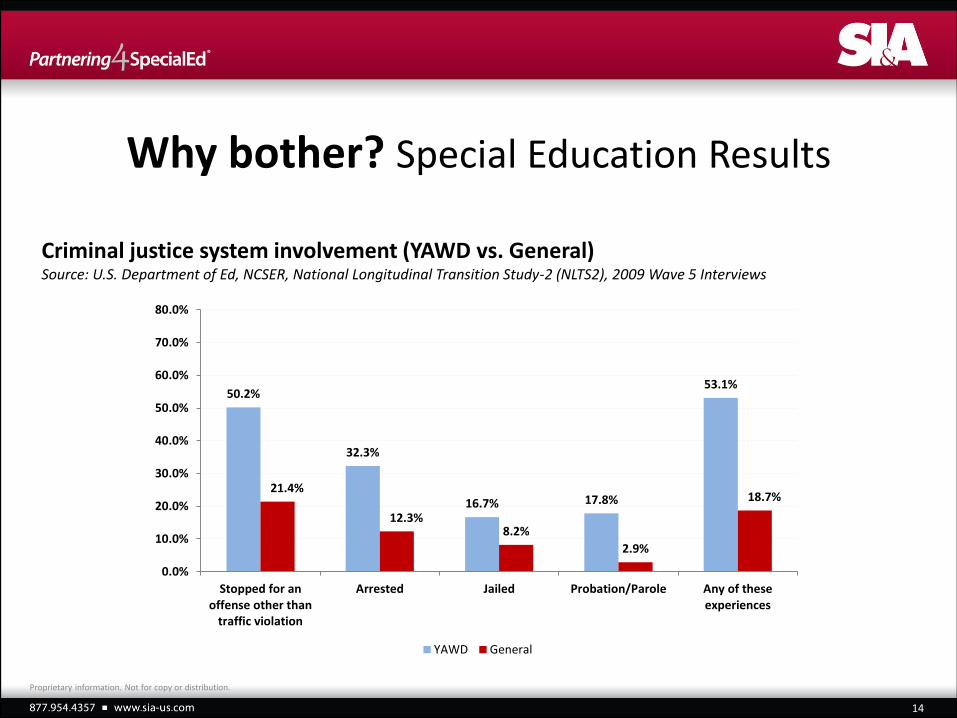
Why bother? Special Education Results
14
Criminal justice system involvement (YAWD vs. General) Source: U.S. Department of Ed, NCSER, National Longitudinal Transition Study-2 (NLTS2), 2009 Wave 5 Interviews
50.2%
32.3%
16.7% 17.8%
53.1%
21.4%
12.3% 8.2%
2.9%
18.7%
0.0%
10.0%
20.0%
30.0%
40.0%
50.0%
60.0%
70.0%
80.0%
Stopped for anoffense other than
traffic violation
Arrested Jailed Probation/Parole Any of theseexperiences
YAWD General
Proprietary information. Not for copy or distribution.
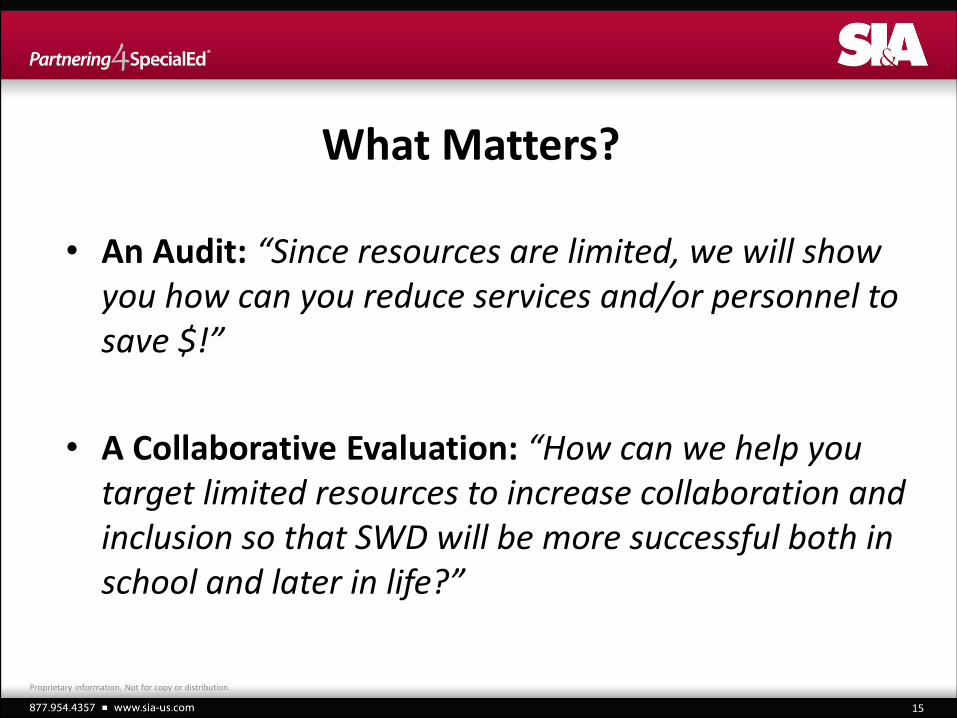
What Matters?
• An Audit: “Since resources are limited, we will show you how can you reduce services and/or personnel to save $!”
• A Collaborative Evaluation: “How can we help you target limited resources to increase collaboration and inclusion so that SWD will be more successful both in school and later in life?”
15
Proprietary information. Not for copy or distribution.
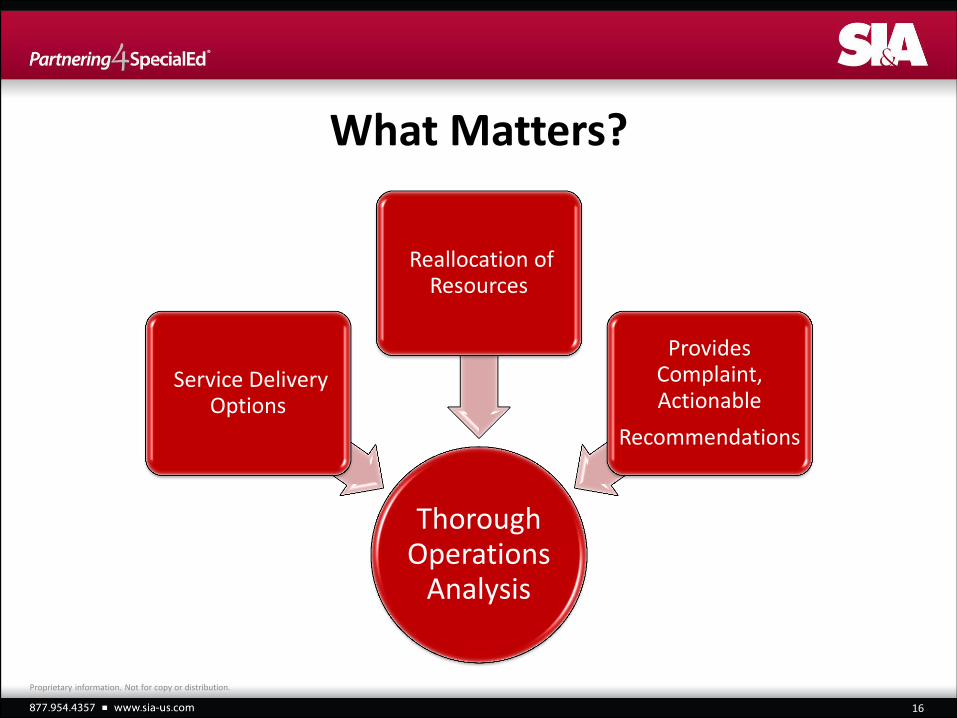
What Matters?
Thorough Operations
Analysis
Service Delivery Options
Reallocation of Resources
Provides Complaint, Actionable
Recommendations
Proprietary information. Not for copy or distribution.
16
17
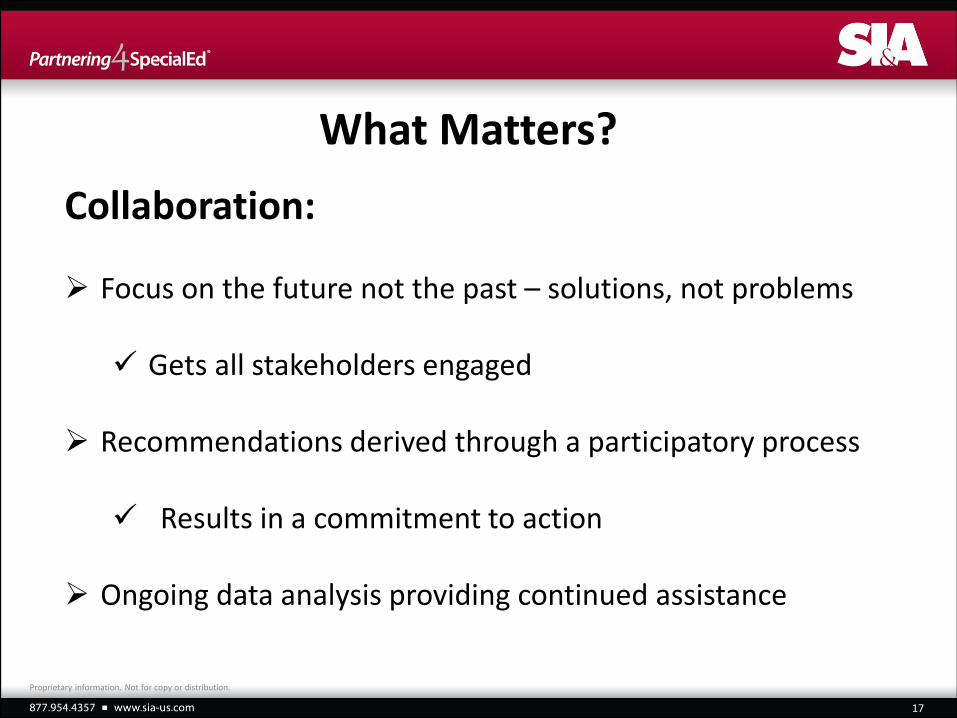
What Matters?
Collaboration:
Focus on the future not the past – solutions, not problems
Gets all stakeholders engaged
Recommendations derived through a participatory process Results in a commitment to action
Ongoing data analysis providing continued assistance
Proprietary information. Not for copy or distribution.
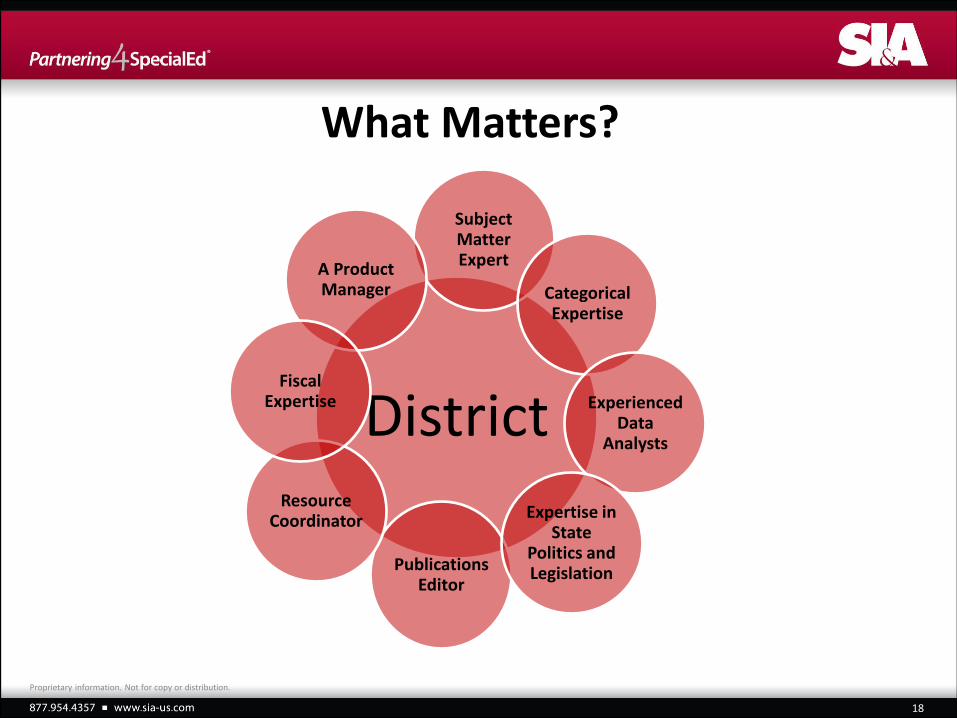
District
Subject Matter Expert
Categorical Expertise
Experienced Data
Analysts
A Product Manager
Publications Editor
Resource Coordinator Expertise in
State Politics and Legislation
Fiscal Expertise
18
What Matters?
Proprietary information. Not for copy or distribution.
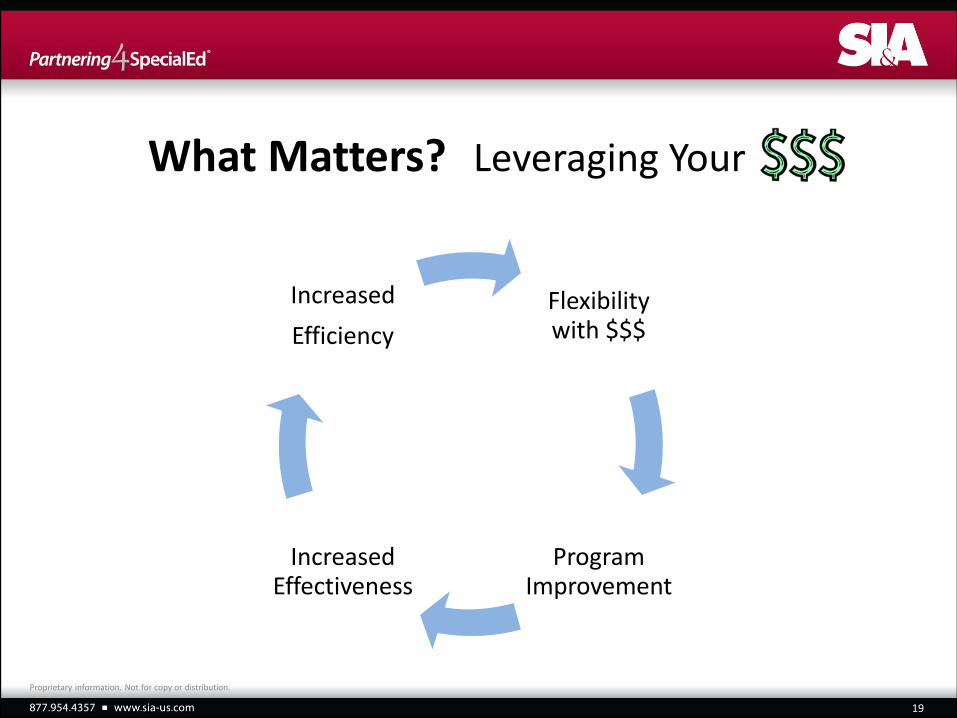
What Matters? Leveraging Your
19
Flexibility with $$$
Program Improvement
Increased Effectiveness
Increased
Efficiency
Proprietary information. Not for copy or distribution.
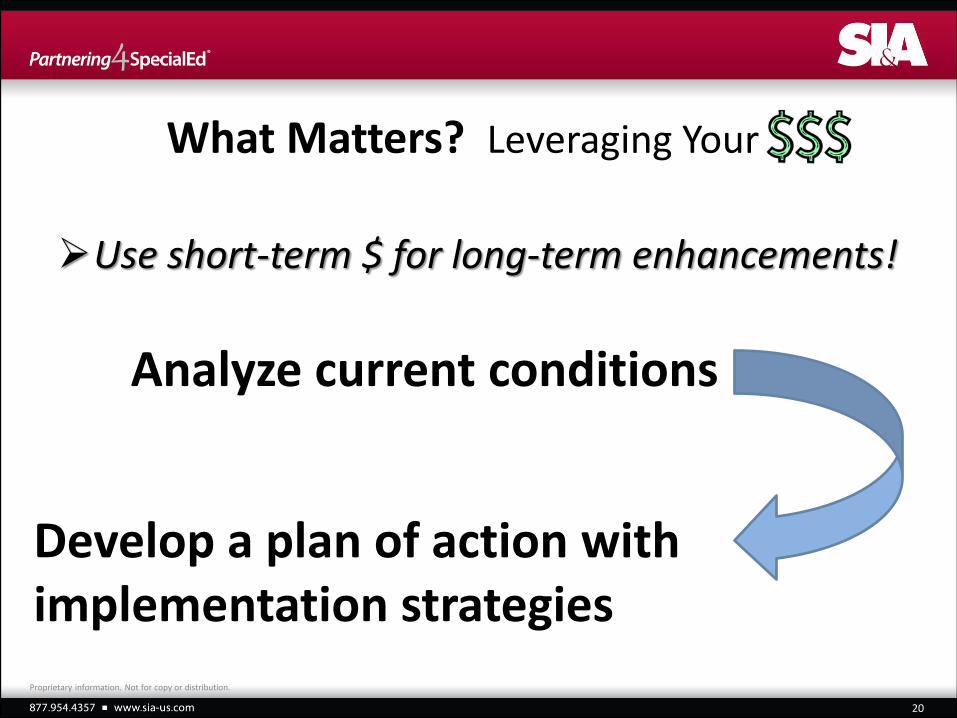
What Matters? Leveraging Your
Use short-term $ for long-term enhancements!
20
Analyze current conditions
Develop a plan of action with implementation strategies
Proprietary information. Not for copy or distribution.
21
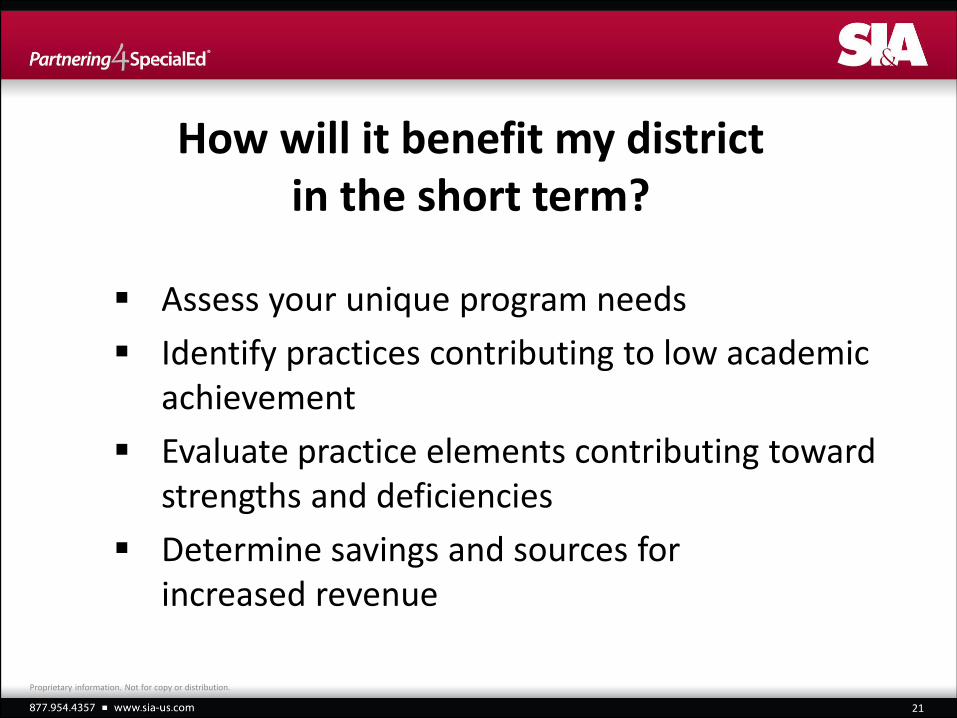
Assess your unique program needs
Identify practices contributing to low academic achievement
Evaluate practice elements contributing toward strengths and deficiencies
Determine savings and sources for increased revenue
How will it benefit my district in the short term?
Proprietary information. Not for copy or distribution.
22
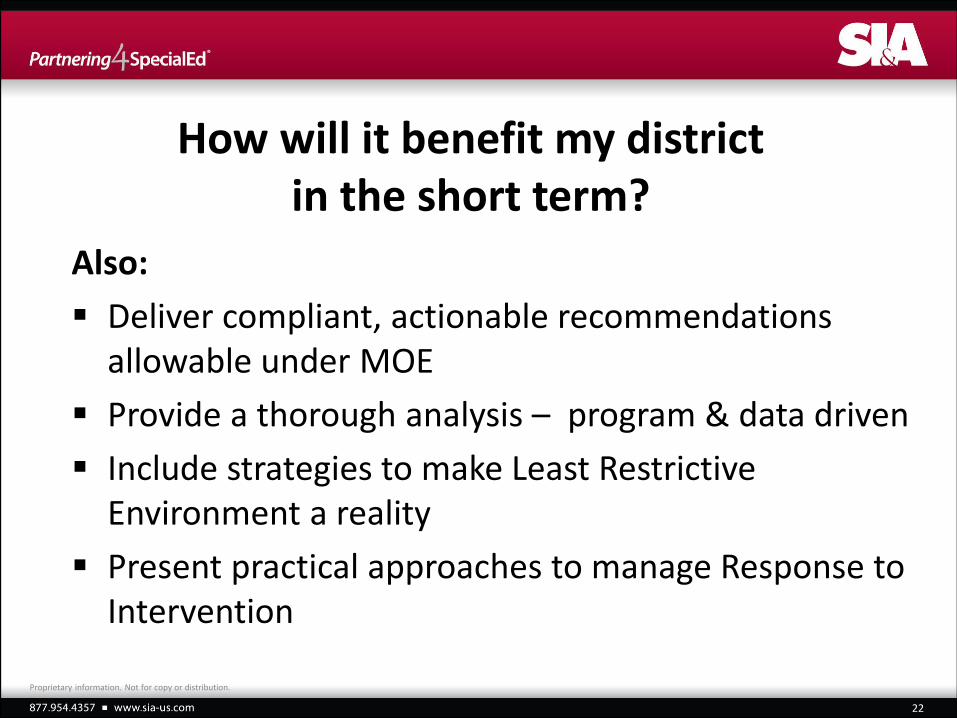
Also:
Deliver compliant, actionable recommendations allowable under MOE
Provide a thorough analysis – program & data driven
Include strategies to make Least Restrictive Environment a reality
Present practical approaches to manage Response to Intervention
Proprietary information. Not for copy or distribution.
How will it benefit my district in the short term?
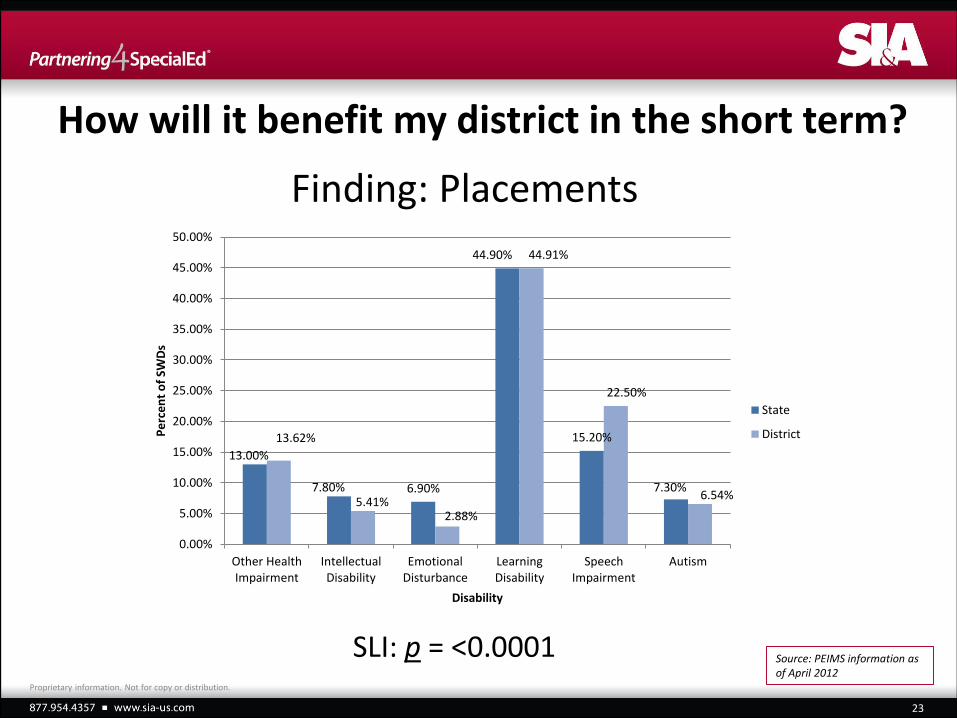
Finding: Placements
How will it benefit my district in the short term?
Source: PEIMS information as of April 2012
SLI: p = <0.0001
13.00%
7.80% 6.90%
44.90%
15.20%
7.30%
13.62%
5.41% 2.88%
44.91%
22.50%
6.54%
0.00%
5.00%
10.00%
15.00%
20.00%
25.00%
30.00%
35.00%
40.00%
45.00%
50.00%
Other HealthImpairment
IntellectualDisability
EmotionalDisturbance
LearningDisability
SpeechImpairment
Autism
Pe
rce
nt
of
SWD
s
Disability
State
District
Proprietary information. Not for copy or distribution.
23
24
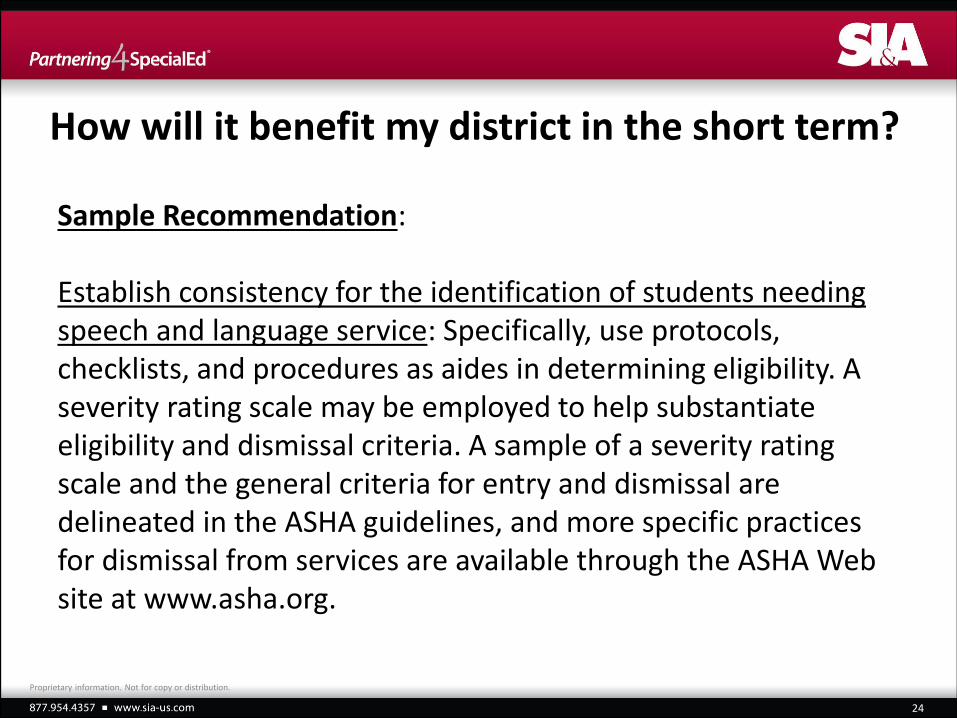
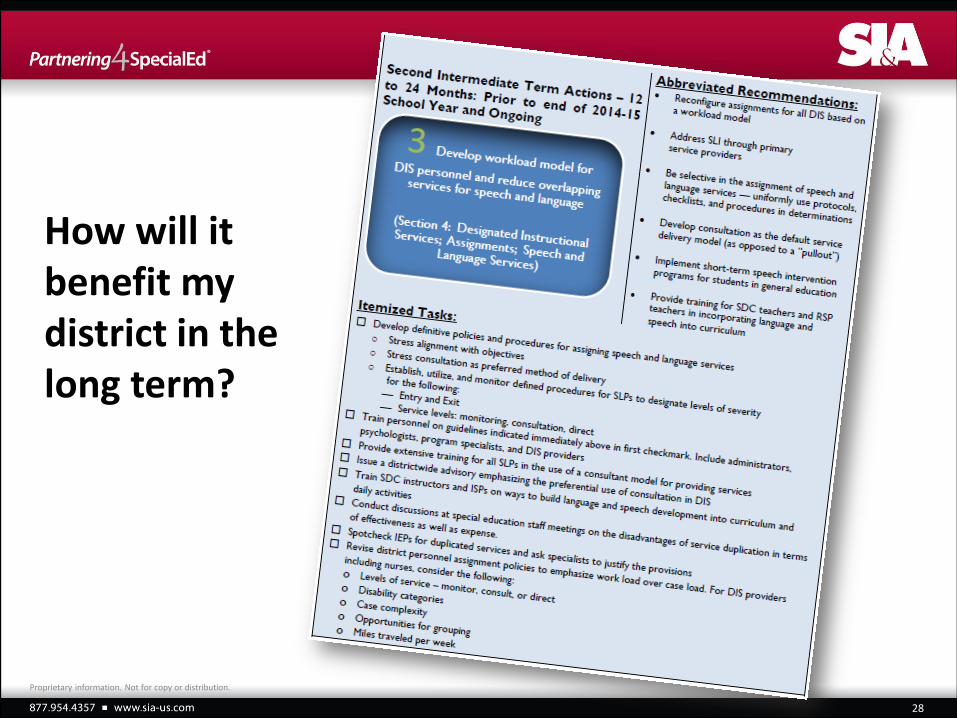
Sample Recommendation: Establish consistency for the identification of students needing speech and language service: Specifically, use protocols, checklists, and procedures as aides in determining eligibility. A severity rating scale may be employed to help substantiate eligibility and dismissal criteria. A sample of a severity rating scale and the general criteria for entry and dismissal are delineated in the ASHA guidelines, and more specific practices for dismissal from services are available through the ASHA Web site at www.asha.org.
How will it benefit my district in the short term?
Proprietary information. Not for copy or distribution.
25
How will it benefit my district in the long term?
26%
-4%
25%
-10%
35%
44%
11%
34%
15%
40%
-20%
-10%
0%
10%
20%
30%
40%
50%
Feeder A Feeder B Feeder C Feeder D Feeder E
Ch
ange
in P
erc
en
t M
et
Stan
dar
d
fro
m 2
00
6 -
20
11
Feeder Pattern
Special Education Reading/ELA
Special Education Math
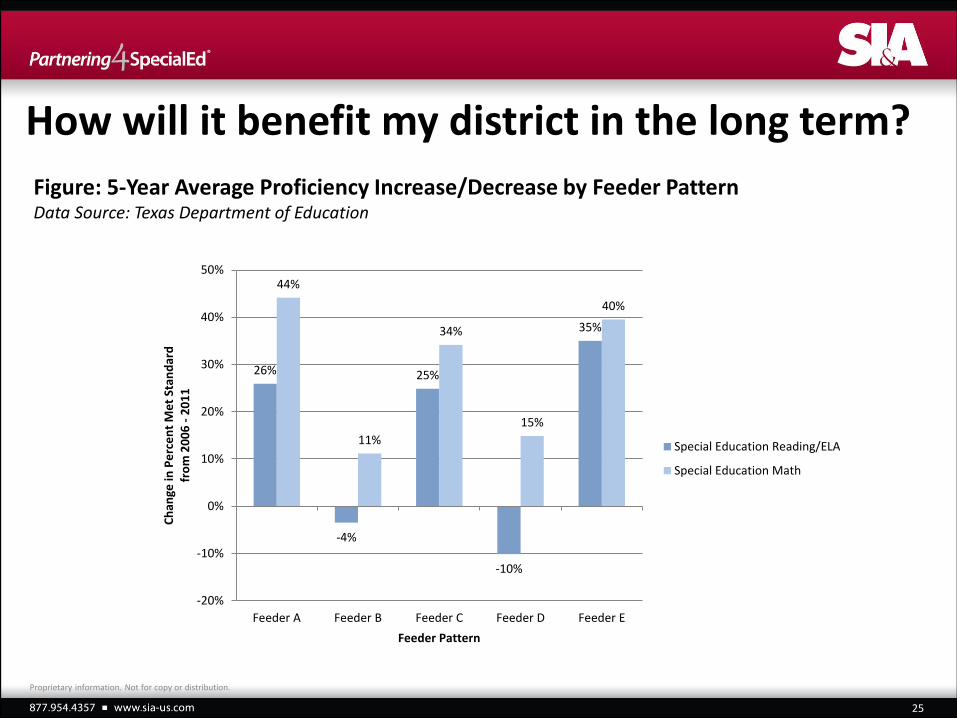
Figure: 5-Year Average Proficiency Increase/Decrease by Feeder Pattern Data Source: Texas Department of Education
Proprietary information. Not for copy or distribution.
26
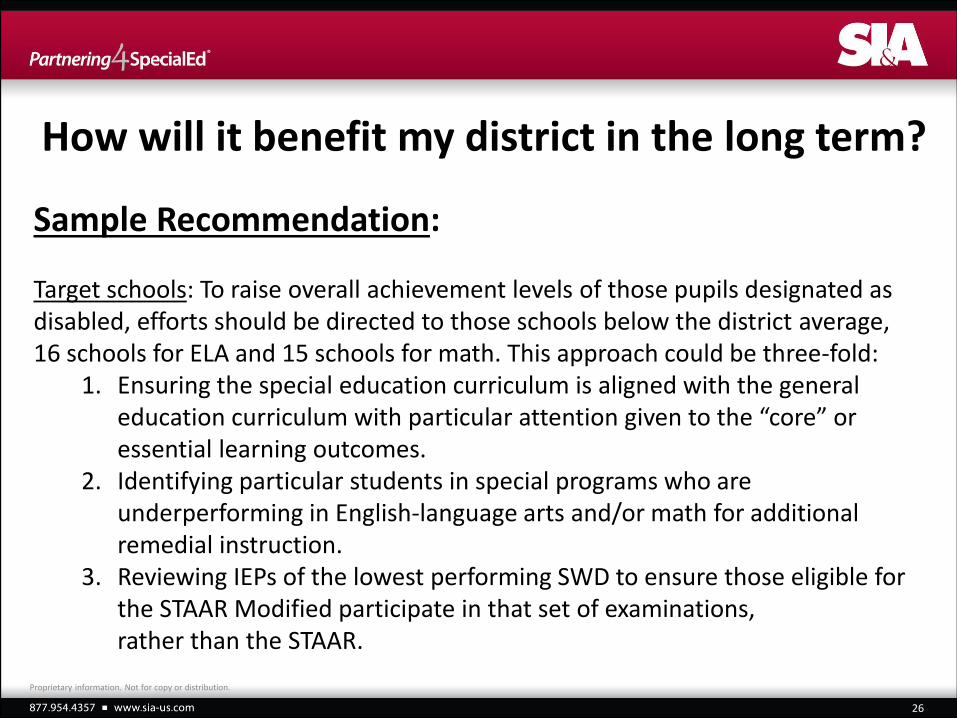
Sample Recommendation: Target schools: To raise overall achievement levels of those pupils designated as disabled, efforts should be directed to those schools below the district average, 16 schools for ELA and 15 schools for math. This approach could be three-fold:
1. Ensuring the special education curriculum is aligned with the general education curriculum with particular attention given to the “core” or essential learning outcomes.
2. Identifying particular students in special programs who are underperforming in English-language arts and/or math for additional remedial instruction.
3. Reviewing IEPs of the lowest performing SWD to ensure those eligible for the STAAR Modified participate in that set of examinations, rather than the STAAR.
How will it benefit my district in the long term?
Proprietary information. Not for copy or distribution.
27
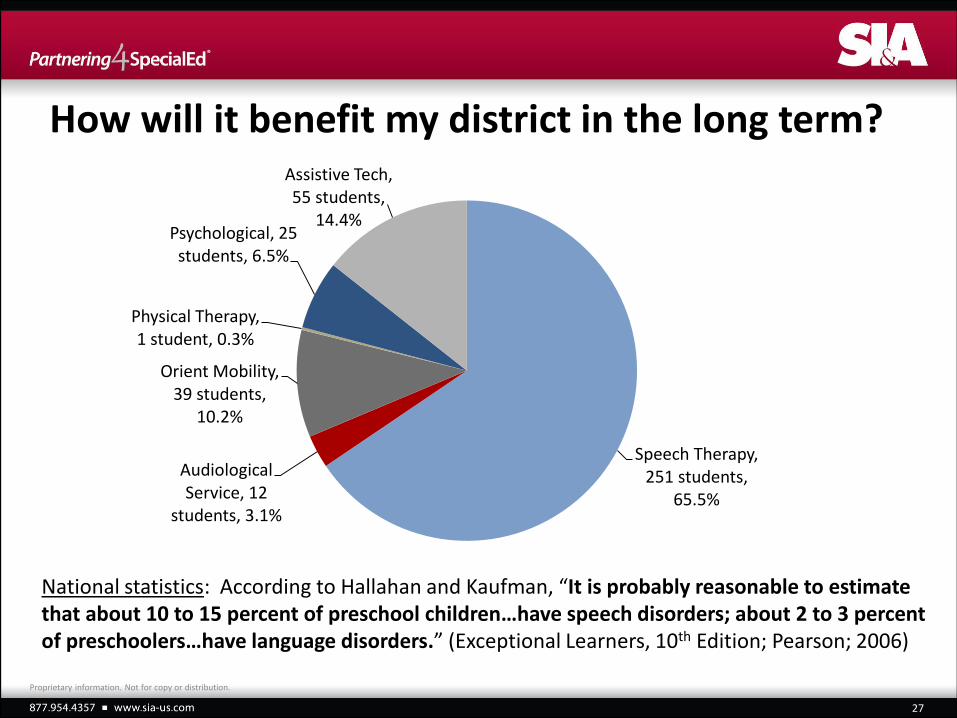
Speech Therapy, 251 students,
65.5%
Audiological Service, 12
students, 3.1%
Orient Mobility, 39 students,
10.2%
Physical Therapy, 1 student, 0.3%
Psychological, 25 students, 6.5%
Assistive Tech, 55 students,
14.4%
How will it benefit my district in the long term?
National statistics: According to Hallahan and Kaufman, “It is probably reasonable to estimate that about 10 to 15 percent of preschool children…have speech disorders; about 2 to 3 percent of preschoolers…have language disorders.” (Exceptional Learners, 10th Edition; Pearson; 2006)
Proprietary information. Not for copy or distribution.
How will it benefit my district in the long term?
Proprietary information. Not for copy or distribution.
28
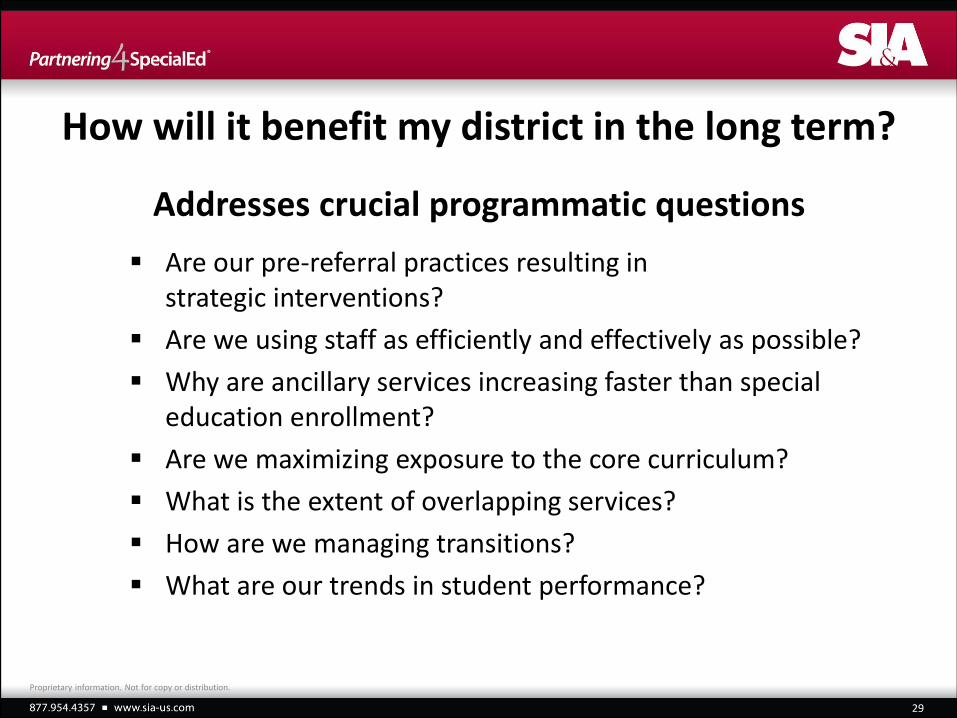
Addresses crucial programmatic questions
Are our pre-referral practices resulting in strategic interventions?
Are we using staff as efficiently and effectively as possible?
Why are ancillary services increasing faster than special education enrollment?
Are we maximizing exposure to the core curriculum?
What is the extent of overlapping services?
How are we managing transitions?
What are our trends in student performance?
29
How will it benefit my district in the long term?
Proprietary information. Not for copy or distribution.
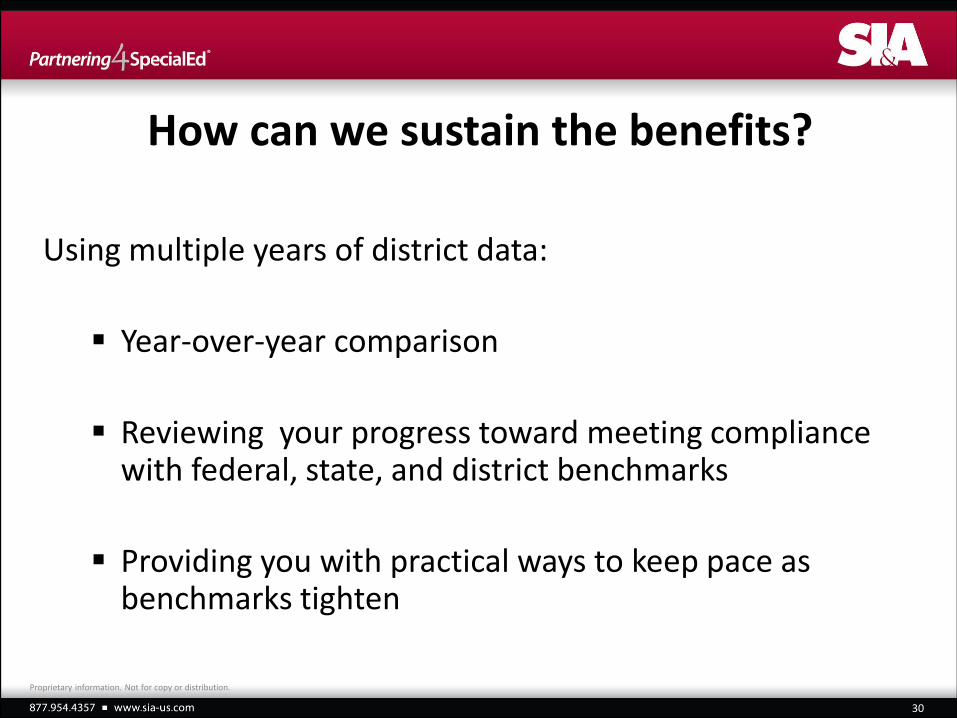
Using multiple years of district data:
Year-over-year comparison
Reviewing your progress toward meeting compliance with federal, state, and district benchmarks
Providing you with practical ways to keep pace as benchmarks tighten
30
How can we sustain the benefits?
Proprietary information. Not for copy or distribution.
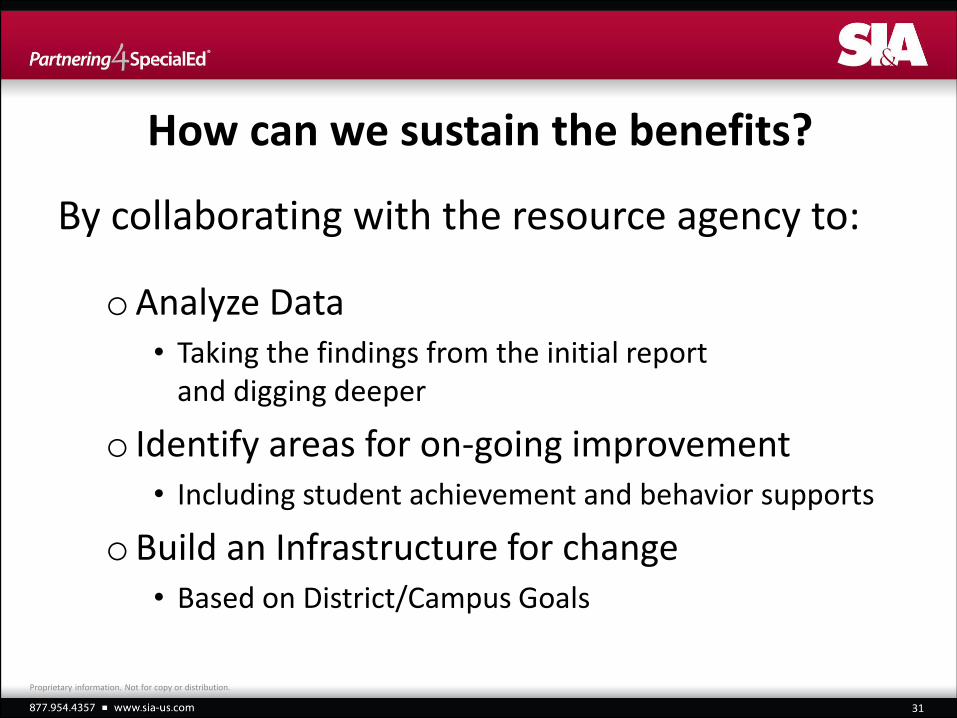
By collaborating with the resource agency to:
oAnalyze Data • Taking the findings from the initial report
and digging deeper
o Identify areas for on-going improvement • Including student achievement and behavior supports
oBuild an Infrastructure for change • Based on District/Campus Goals
31
Proprietary information. Not for copy or distribution.
How can we sustain the benefits?
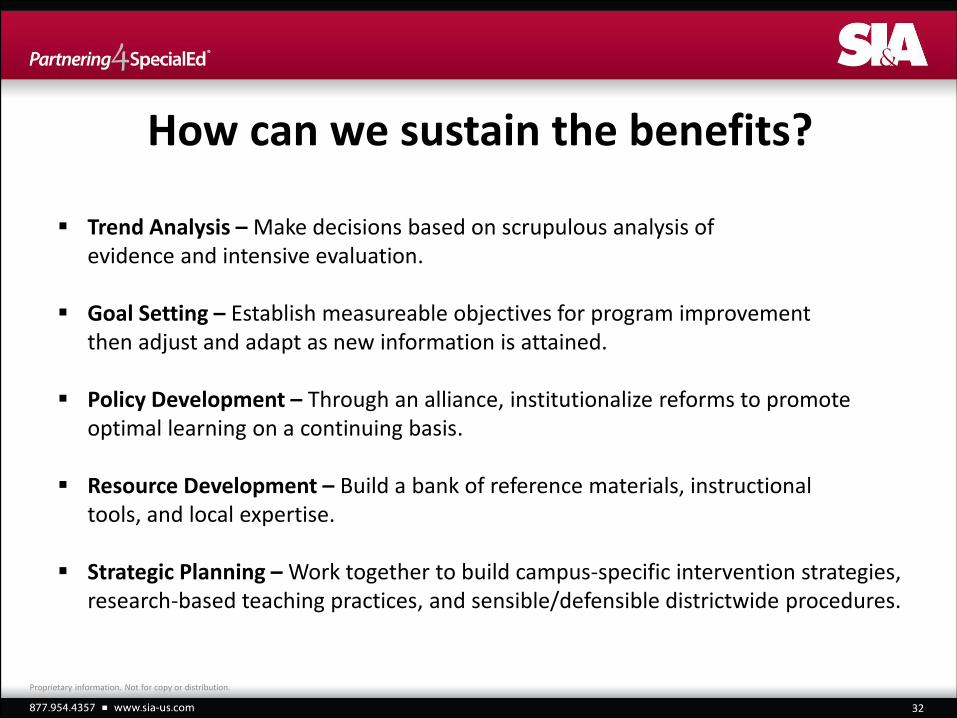
32
Trend Analysis – Make decisions based on scrupulous analysis of evidence and intensive evaluation.
Goal Setting – Establish measureable objectives for program improvement then adjust and adapt as new information is attained.
Policy Development – Through an alliance, institutionalize reforms to promote optimal learning on a continuing basis.
Resource Development – Build a bank of reference materials, instructional tools, and local expertise.
Strategic Planning – Work together to build campus-specific intervention strategies, research-based teaching practices, and sensible/defensible districtwide procedures.
Proprietary information. Not for copy or distribution.
How can we sustain the benefits?
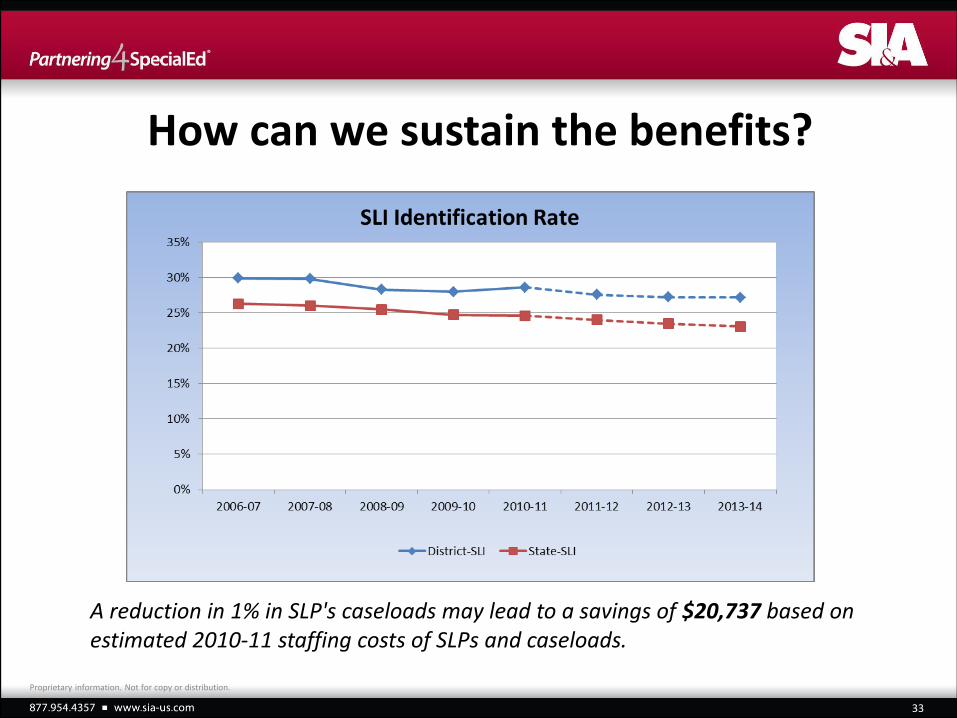
33
A reduction in 1% in SLP's caseloads may lead to a savings of $20,737 based on estimated 2010-11 staffing costs of SLPs and caseloads.
Proprietary information. Not for copy or distribution.
How can we sustain the benefits?
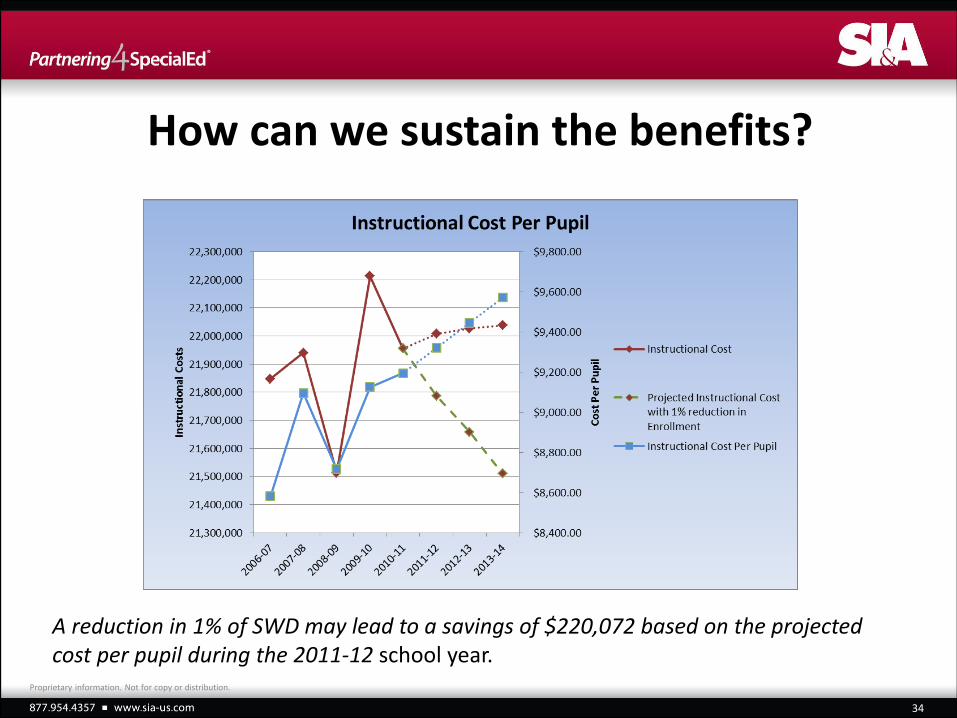
34
A reduction in 1% of SWD may lead to a savings of $220,072 based on the projected cost per pupil during the 2011-12 school year.
Proprietary information. Not for copy or distribution.
How can we sustain the benefits?
Signals - What to look for
Avoid purely fiscal audits
Arrange for more than a compliance review
Essential elements:
Program driven
Every aspect of Special Education
An agency with multiple resources
Data analysis
Special Education expertise
Integrative expertise
35
Proprietary information. Not for copy or distribution.
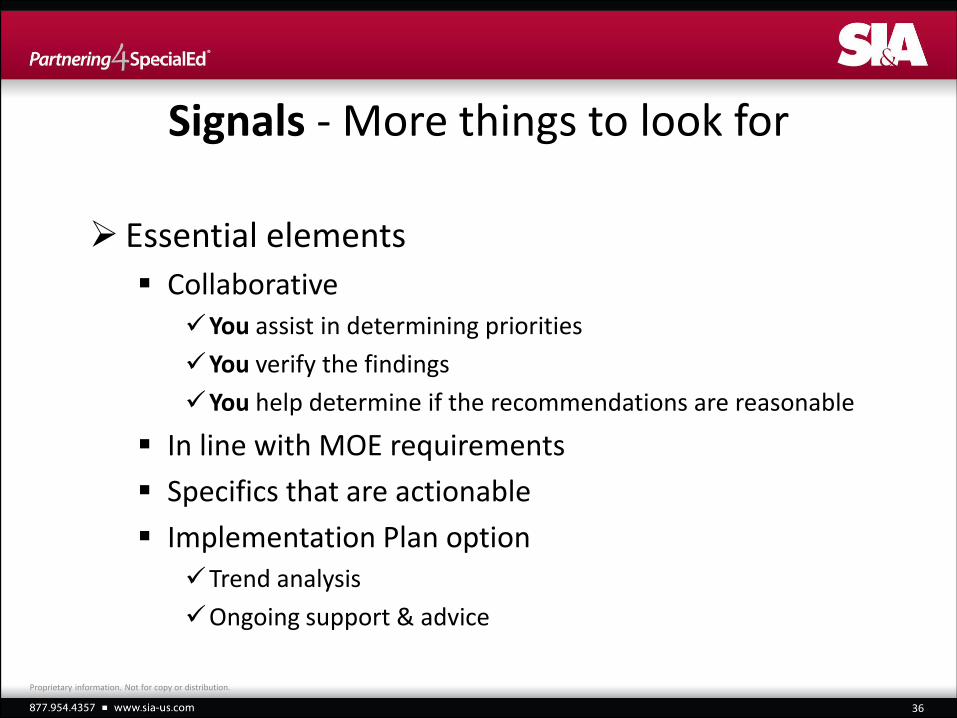
Signals - More things to look for
Essential elements
Collaborative You assist in determining priorities
You verify the findings
You help determine if the recommendations are reasonable
In line with MOE requirements
Specifics that are actionable
Implementation Plan option Trend analysis
Ongoing support & advice
36
Proprietary information. Not for copy or distribution.
Thank You!
Dr. Lee Funk, Director of Special Education School Innovations & Achievement
916.669.5439 [email protected]
Susan Kelch
915.241.3150 [email protected]
37
Proprietary information. Not for copy or distribution.