Embed Size (px)
Citation preview

European EconomicA d v i s o r y G r o u p
@
Beyond the Coronavirus Crisis: Investing for a Viable FutureMacroeconomic Conditions and Outlook
Distributional Conflicts and Social Capital
Lifecycles and Education: The Coronavirus Crisis Across Generations
Business Investment
2021Vol. 20
Embargoed until
9 February 2021, 10:00 CET

EEAG Report on the European EconomyISSN 1865-4568 (print version)
A yearly journal on European economic issuesPublisher and distributor: CESifo GmbH, Poschingerstr. 5, 81679 Munich, GermanyTelephone +49 89 9224-0, Telefax +49 89 9224-1409, Email [email protected] permitted only if source is stated and copy is sent to the publisher.
Suggested citationEEAG (2021), “The EEAG Report on the European Economy - Beyond the Coronavirus Crisis: Investing for a Viable Future,” CESifo, Munich.
www.cesifo.org
The European Economic Advisory Group (EEAG) analyzes key economic policy issues of common European concern. It aims to offer the public and policymakers research-based insights. Taking into account the variety of perspectives within Europe, the group fosters bridge-building between research and policy as well as across European countries.

1EEAG Report 2021
FOREWORD
Foreword
The coronavirus crisis has led to a severe economic downturn and threatened the health and the economic existence of many people and has thus led to unprecedented challenges for policy makers and governments at national and international levels.
The crisis is fraught with uncertainty and no clear conclusions can be drawn about how long it will last and how the virus will evolve and continue to spread. For some, the corona-virus has a worse impact on some segments of the population than on others. Women, for example, are more likely to stay at home to take care of their children, and professionals in certain sectors have been unable to work since March. The European Union has launched the Next Generation EU (NGEU) support program to address some of these challenges and strengthen solidarity between member states.
This year's EEAG report on the European economy explores how to prevent the erosion of capital caused by the crisis. In particular, Chapter 2 investigates the importance of in-vesting in public and social capital for future prosperity and inclusion. This chapter takes up a number of issues discussed in previous EEAG reports that have been significantly exacerbated by the crisis, such as taxes on consumption and land to share the burden of coronavirus debt, or youth welfare in the social function through climate-friendly policies. This chapter also examines the sustainability of the large debts taken on during the crisis, which depends on growth and adequate investment.
Chapter 3 turns to human capital and education in particular. Income losses have occurred at all levels of education, but again have been particularly detrimental to some groups of the population, such as those at the lower end of the skills distribution. The chapter examines how the coronavirus crisis has affected education and lifelong learning and what should and should not be done. It makes recommendations regarding how policy can help offset the negative impact of the coronavirus crisis on human capital in the European Union.
Chapter 4 examines the central importance of business investment for the economic re-covery as well as long-term growth and productivity. Recessions are usually accompanied by constrained investment, and there is widespread concern that private investment in inno-vation will remain low after the crisis. This chapter therefore looks at business investment before and during the coronavirus crisis and identifies key aspects for increasing future investment in the medium and long term.
As in previous years' reports, Chapter 1 provides an in-depth analysis of the economic sit-uation of the European Union and the world, as well as forecasts where possible—the latter is particularly difficult during the coronavirus crisis, since time horizons are short and uncer-tain, and measures change as the virus evolves. In the first half of 2020, global gross domestic product (GDP) fell by almost 10 percent, but economic production picked up sharply during summer 2020. However, the GDP was still more than 2 percent below pre-crisis levels in advanced economies in the third quarter and then the second wave hit. This chapter specif-ically looks at regional differences, which were fairly pronounced in the different countries.
The European Economic Advisory Group at CESifo, which is collectively responsible for all parts of the report, consists of seven economists from seven countries. This year the Group is chaired by Harold James (Princeton University). The other members are Torben M. Andersen (Aarhus University), Giuseppe Bertola (University of Turin), Cecilia García-Peñalosa (Aix-Marseille University), Jan-Egbert Sturm (KOF Swiss Economic Institute, ETH Zurich), Branko Urošević (School of Computing, Union University) and me (ifo Institute and Lud-wig-Maximilians-University Munich). I would like to express my gratitude for the valuable assistance provided by the scholars and staff at CES and ifo who helped to prepare this report. This year’s participants were Clara Albrecht and Tanja Stitteneder (assistants to the group), Christian Grimme (economic forecast), Christiane Nowack, Christoph Zeiner, Jasmin La Marca (graphics), Katharina Pichler and Elisabeth Will (typesetting), and Ines Gross (cover).
Clemens Fuest President ifo Institute and CESifo Group Professor of Economics and Public Finance Ludwig-Maximilians-University Munich Munich, February 2021

2 EEAG Report 2021
CONTENTS
RECOMMENDATIONS FOR EUROPE 5
EXECUTIVE SUMMARY 7
CHAPTER 1: MACROECONOMIC CONDITIONS AND OUTLOOK 10
During the first wave of the coronavirus crisis, countries imposed strict lockdowns to reduce Covid-19 infections. This led to the sharpest reduction in GDP (almost 10 percent) since the Second World War, but the economy recovered quickly during the summer months. When the second wave hit in autumn, harsh lockdown meas-ures were postponed in order to prevent another sharp downturn in value added. However, Covid-19 death rates reached higher levels than during the first wave. Yet, overall economic production remained 2 percent under the pre-crisis level in the third quarter. The situation is expected to improve slowly until spring and economic forecasts are therefore associated with great uncertainty.
CHAPTER 2: DISTRIBUTIONAL CONFLICTS AND SOCIAL CAPITAL 31
The ongoing coronavirus crisis and the resulting containment measures have different consequences for dif-ferent groups of society and across countries and thus affect social capital and cohesion. Costs and benefits of lockdown restrictions and economic policy interventions are not equally shared and consequently might lead to the erosion of social capital within the European Union. In this chapter, we present policy actions suitable to counteract intergenerational conflicts and to promote a more equal burden sharing, including reforms of tax and pension systems as well as the formation of more resilient institutions.
CHAPTER 3: LIFECYCLES AND EDUCATION: THE CORONAVIRUS CRISIS ACROSS GENERATIONS 41
Education is a key investment in the future since it strongly contributes to securing intergenerational and social equity. In the wake of the coronavirus crisis, schools have been closed, which will consequently lead to future income losses for those affected, especially already underprivileged students. Thus, school closures bear the risk of further exacerbating education inequalities. To counteract this effect, rethinking the provision of education is crucial. Hence, new ways of teaching and learning should be adopted.
CHAPTER 4: BUSINESS INVESTMENT 50
Business investment is key for long-term economic growth and productivity. In this chapter, we discuss possi-ble threats to a successful economic recovery. Due to limited access to financing and limited reserves, small- and medium-sized companies may struggle to survive after the crisis. Public support to companies bears the risk of keeping “zombie firms” alive that would otherwise not be viable. European coordination of investment programs is needed since not all EU member states have the financial resources to support desirable private investment and harmful subsidy races of individual national champions need to be circumvented.
AUTHORS: THE MEMBERS OF THE EUROPEAN ECONOMIC ADVISORY GROUP AT CESIFO 60
The views expressed in this report are those of the authors and do not necessarily reflect those of the insti-tutions with which they are affiliated.

3EEAG Report 2021
CONTENTS
RECOMMENDATIONS FOR EUROPE 5
EXECUTIVE SUMMARY 7
1. MACROECONOMIC CONDITIONS AND OUTLOOK 101.1 Current Situation 10
1.1.1 Global Economy 101.1.2 European Economy 13
1.2 Fiscal and Monetary Policy 151.2.1 Fiscal Policy 151.2.2 Monetary Conditions and Financial Markets 20
1.3 Macroeconomic Outlook 241.3.1 Assumptions, Risks, and Uncertainties 241.3.2 Global Economy 251.3.3 European Economy 27
Appendix 1.A 29
2. DISTRIBUTIONAL CONFLICTS AND SOCIAL CAPITAL 312.1 Social Capital 31 2.2 Intergenerational Conflict 322.3 Sharing Risks and Damages 33
2.3.1 Sharing Across the European Union 33 2.3.2 Tensions Across Income Groups 352.3.3 Insiders and Outsiders 36
2.4 What kind of Recession? 372.4.1 A Pink Recession 372.4.2 A Green Recovery 37
2.5 Policies for Preventing the Erosion of Social Capital 38
3. LIFECYCLES AND EDUCATION: THE CORONAVIRUS CRISIS ACROSS GENERATIONS 413.1 Life and Death 413.2 Economic Costs of Remote Learning and School Closures 423.3 Current and Future Income and Welfare Losses Across Generations 443.4 What Needs to (But May Not) Be Done? 44
3.4.1 Learning, Why Now? 453.4.2 Funding Education 453.4.3 What to Learn 45
3.5 How Policy can Help Education During and After the Coronavirus Crisis 463.5.1 Short-term Emergency Policy 463.5.2 Toward a New and Different Normal 46
3.5.2.1 Basic Education 473.5.2.2 What to Learn in High School 473.5.2.3 Beyond School 473.5.2.4 Universities 483.5.2.5 Funding Education Policies 48
TABLE OF CONTENTS

4 EEAG Report 2021
CONTENTS
4. BUSINESS INVESTMENT 504.1 The Role of Business Investment 504.2 How has Investment Evolved Before and During the Coronavirus Crisis? 504.3 Public Policies and Business Investment During the Crisis 524.4 Business Investment in the Medium and Long Term 554.5 Conclusions 56
LIST OF FIGURES, TABLES AND BOXES 58
THE MEMBERS OF THE EUROPEAN ECONOMIC ADVISORY GROUP AT CESIFO 60
PREVIOUS REPORTS 64

5EEAG Report 2021
RECOMMENDATIONS
RECOMMENDATIONS FOR EUROPE
CHAPTER 2: DISTRIBUTIONAL CONFLICTS AND SOCIAL CAPITAL
Short Term:• Burden-sharing policy measures should aim to re-
duce tensions across income groups. In particular, social insurance should be provided without jeop-ardizing incentives for job search and reallocation.
• Welfare systems should be redesigned so as to pro-vide security and reduce existing rigidities and bar-riers to both entry to and exit from jobs. Income support should clearly focus on encouraging people to accept new jobs. To provide support to those prevented from working due to health-related re-strictions without jeopardizing work incentives, the social safety net should include income-contingent loan facilities.
Long Term:• The NGEU program’s quantitative targets for spend-
ing on climate and digital transformation are prob-lematic in that the restrictions are hard to monitor and enforce, and do not ensure that the money is well spent. Should they turn out to be counterpro-ductive, they would add to distrust in EU initiatives. A more appropriate design should include countries setting specific targets, leaving discretion on how to achieve these targets to the individual coun-tries, and holding them accountable for meeting the targets.
• The funds should be allocated to activities over-coming market failures and addressing cross-coun-try spillovers, e.g., multi-country infrastructure to support a digital transition or an efficient public sector to strengthen social capital. Expenditures should prioritize visible investments and exploit policy interdependencies rather than duplicate sin-gle-country initiatives.
• The coronavirus crisis is an opportunity to rethink child care and gender roles. Resilience in care re-quires several elements, including longer hours of child care and school attendance, the possibility of access to care for sick children, and more flexibility to adapt to parental circumstances.
CHAPTER 3: LIFECYCLES AND EDUCATION: THE CORONAVIRUS CRISIS ACROSS GENERATIONS
Short Term:• The Covid-19 disease threatens lives at all ages. Be-
cause the economic value of time spent learning is about the same as that of time spent working and is automatically invested in the human capital needed to service accumulated debt, education should be given at least the same priority as work when de-signing contagion-prevention measures.
• Policy should ensure equitable access to digital equipment and physical study spaces, both of which more than usually hamper the home-learning op-portunities of underprivileged students.
Long Term:• In the aftermath of the pandemic, there will be
a need to make up for lost learning with shorter school vacations or longer hours of attendance, increased spending, and innovative techniques for delivering new types of basic broad-based competencies.
• Flexibility and ability to learn will be more impor-tant in the coming times of drastic and unpredicta-ble structural change. Practical vocational training remains useful but should not be excessively nar-row, and should be enhanced with cognitive skills, training in problem-solving, and logical preparation for learning new skills.
• Lifelong education is particularly important, espe-cially for workers with vocational schooling. Access to education should be flexible, allowing individu-als to choose which new skills to learn. In optional higher education, individual choices should also follow market signals, in a very different environ-ment where public policy should keep fulfilling its quality certification and funding roles.

6 EEAG Report 2021
RECOMMENDATIONS
CHAPTER 4: BUSINESS INVESTMENT
Short Term:• Financial support should be given to firms, in par-
ticular small and medium-sized companies, to im-prove investment levels, both to kickstart recovery and to enhance productivity and to provide the abil-ity to innovate in the medium and long term; but it is important to avoid subsidizing zombie firms.
• The policy instruments that support investments by firms should give room to market signals to deter-mine which investment projects are likely to be vi-able. Governments should primarily provide partial funding of loan guarantees, so that the private in-vestors bearing the rest of the risk are appropriately incentivized to assess the quality of investment.
• Countries should introduce or extend tax loss car-ryback provisions. The extension of tax loss carry-back also reduces the risk of supporting non-viable firms because it only helps firms that were profit-able before the crisis. In addition, extended loss carryback helps only those firms that paid taxes in the country, not those that shifted profits to low-tax countries.
Long Term:• From the perspective of European cohesion and
solidarity, it is important that all member states, including those constrained by high debt levels, are able to use instruments to support investment. The European Commission should encourage member states to make solvency support measures part of the recovery plans they submit when they apply for funding from NGEU.
• NGEU’s strong focus on supporting green invest-ment is problematic. Climate change should pri-marily be addressed through CO2 prices and com-plementary regulation, not by subsidizing the reduc-tion of greenhouse gas emissions. Since uncertainty about future CO2 prices and environmental regula-tions reduces private green investment, emphasis should be placed on establishing reliable and pre-dictable CO2 price paths and regulations.
• Relaxing state aid rules during the crisis is justified, but there is a risk that countries might engage in harmful subsidy races in industries with excess ca-pacities. While companies will need to reconsider the tradeoffs between production costs and vul-nerability of value chains, reducing vulnerability may require more, not fewer, international value chains. Hence, policy measures meant to wind down border-crossing value chains would also be highly counterproductive. Deepening the European inter-nal market, for instance by moving quickly to cap-ital market union, should be a key priority for the coming years.
• To foster economic growth after the crisis, the EU should turn its attention toward improving condi-tions for medium- and long-term private invest-ment. This requires reducing uncertainty regarding future tax and regulatory policies that allow market processes to develop their full potential in terms of generating efficiency and innovation.

7EEAG Report 2021
EXECUTIVE SUMMARY
EXECUTIVE SUMMARY
BEYOND THE CORONAVIRUS CRISIS: INVESTING FOR A VIABLE FUTURE
The coronavirus crisis has led to the sharpest eco-nomic downturn in modern times (since the Indus-trial Revolution), has challenged the viability of large sectors of economic activity, has expanded the role of fiscal and monetary policy—including unconventional policy—in providing immediate answers to the down-turn, and has raised acute equity and distributional issues, between generations, between genders, and between countries (Chapter 1). It thus poses unparal-leled challenges to policy both on a national and an EU level, as well as globally.
The European Union has launched the ground-breaking Next Generation EU (NGEU) pro-gram, which involves common burden-sharing and explicitly aims to strengthen social cohesion within the European Union. The labeling of the initiative also signals a forward-looking perspective in which inter-generational aspects are central: the project seeks to compensate the young, who are widely seen as losers both in terms of the coronavirus crisis and due to many previously instituted policies. The pro-gram also needs to tackle the coronavirus crisis as a “pink crisis,” which has unequally affected women and threatens reversal of the gains in gender equal-ity made over the past decades, which could mean a return to traditional gender roles. Finally, distributing funds between national authorities inevitably raises questions of whether the resources are equitably dis-tributed among member states.
The NGEU initiative is a high-risk gamble for the European Union. If it succeeds, it will strengthen both the role of the European Union and cohesion within the European Union. If it fails, it will be yet another example of a promising project that remains on paper, and only serves to erode social capital in the European Union. The new resources will need to be well invested with an overall aim of overcoming market failures. The orientation should encompass new technologies, such as the digital transition, as well as strengthen key aspects of social capital, in-cluding an efficient public sector. The investments should also be visible and supplementary: they should not finance activities that would be under-taken anyway.
CHAPTER 1Macroeconomic Conditions and Outlook
Chapter 1 presents some macroeconomic develop-ments during the coronavirus crisis. The first wave triggered both rapid and sharp changes in social be-havior and the swift introduction of policies to curb
the virus. This went hand in hand with the sharpest post-war reduction in GDP.
When the second wave hit Europe, society and politics reacted differently. The population might have already become accustomed to the virus to some degree and perhaps a kind of pandemic fatigue had set in. At the same time, many viewed that harsh lockdowns instituted during the first wave should be prevented or postponed as long as possible during the second wave in order to reduce economic hard-ship. This different attitude, together with greater knowledge about how to keep the economy going during a pandemic, circumvented another sharp decline in value added. At the same time, however, the number of deaths in Europe rose by 230,000 during the months of October, November and De-cember, making the second wave from this perspec-tive worse than the first, before being brought under control.
In the first half of 2020, global Gross Domestic Product (GDP) fell by almost 10 percent compared to the last quarter of 2019. Covid-19 infections were re-duced, and infection control measures were in place. Consequently, overall economic production picked up sharply in the summer of 2020. This allowed compa-nies to revive production and households to signifi-cantly increase their spending. Nevertheless, overall economic production in the advanced economies was still more than 2 percent below the pre-crisis level in the third quarter.
Overall, the downturn last year was much more pronounced than during the financial crisis of 2008/2009, and the recovery was stronger and pro-ceeded much faster. During the financial crisis, it took three quarters to reach the level we have now reached within one quarter.
CHAPTER 2Distributional Conflicts and Social Capital
Chapter 2 investigates how investment in public and social capital are of key importance for future prosperity and inclusion. In order for policy to be perceived as placing an even burden across gener-ations, fair taxation is essential. The chapter takes up some topics that are based on previous EEAG re-ports and that have become much more urgent as a result of the crisis. Taxes on consumption and land are a better way to share the burden of the covid debt than income taxes. Intergenerational tensions may also be reduced through pension reform. Cli-mate-friendly policies can also help by signaling an increased weight of the welfare of the young in the social welfare function. But above all, the sustaina-bility of the large amount of public (as well as pri-
8 EEAG Report 2021
EXECUTIVE SUMMARY
vate) debt incurred in the crisis hinges on growth, and hence on an appropriate framework for producing higher levels of investment.
The social safety net needs to protect people rather than jobs, and coverage could be extended by including income-contingent loan facilities as an alternative to a generalized increase in benefit lev-els. Many countries have introduced such schemes for small business owners either in the form of post-ponement of tax payments or outright loan facilities.
Governments need to take measures to counter the “pink crisis” created by the pandemic and foster female labor market participation. A critical vulner-ability has been the issue of child care, which needs to become resilient, safe and flexible. The pandemic has identified non-resilient institutions, and it is im-portant both in a short- and long-run perspective to build resilient institutions. This crisis is an oppor-tunity to rethink child care and gender roles. Resil-ience requires several elements, including longer child-care facility hours and school attendance, ac-cess to care for sick children, and more flexibility to adapt to parental circumstances. Inspiration can be drawn from France, which has shown how to recon-cile a high fertility rate with high female labor market participation.
The crisis has very different health and economic consequences across EU countries. Burden sharing across EU countries through the NGEU provides a much-needed signal of EU cohesion and solidarity, which can enhance social capital and keep the sin-gle market and supply chains operative (which saves lives). The program is a high-risk venture for the Eu-ropean Union. Good design is crucial.
The current framework is problematic, in particu-lar in terms of the quantitative restrictions regard-ing the use of funds, including targets for spending on climate and digital transformation. These lim-its serve to signal priorities but also reflect lack of trust in how the money is spent. Such restrictions are hard to monitor and enforce, they do not ensure that money is well spent, and they may turn out to be counterproductive, adding to distrust in EU initiatives. A more appropriate design would have countries set-ting specific targets and exercising discretion on how to achieve these targets. The members states would then be held accountable for meeting them. The funds should be allocated primarily to activities focused on overcoming market failures, e.g., multi-country infrastructure to support a digital transition or an efficient public sector to strengthen social capital. Expenditures should prioritize visible investments and exploit policy interdependencies rather than duplicate single-country initiatives.
There is widespread debate on how to make the recovery from the pandemic consistent with the cli-mate agenda needed to lower CO2 emissions. Negative externalities are generally most efficiently addressed via price signals, and climate objectives should be
achieved by extending the ETS system to the whole of Europe and all sectors. Top-down investment activi-ties on the other hand are unlikely to be effective. This also applies to the NGEU, and it should be changed to target areas—such as networks and infrastructure—where both the market and individual countries may underinvest.
CHAPTER 3Lifecycles and Education: The Coronavirus Crisis Across Generations
Chapter 3 turns specifically to education, broadly conceived: a key investment in the future, and in the securing of intergenerational as well as social equity. Every month of a child’s missed schooling implies fu-ture income losses that are (roughly, and on average) equivalent in present value to about a month of their family’s per capita income. Although income losses have occurred at all levels of education, they have been particularly important for those at the bottom of the skill distribution. Children of low-wage service workers have often been shut out not only of school buildings but also of online instruction because of inadequate Internet access and lack of expertise. The resulting education inequalities exacerbate those al-ready present across central, suburban and periph-eral geographical school locations in many countries.
Just spending more money on teachers or facil-ities or requiring longer attendance at school may not suffice to generate the growth needed to repay that debt. The crisis may provide an opportunity for rethinking the provision of education. New opportu-nities exist for making up lost ground at all education levels by adopting new ways of teaching and learn-ing. In times of anxiety and possible despair, students need motivation.
Regarding mandatory education, it will be better to make up lost time by extending school attendance days over the next several years. Digitized learning should be employed more widely in combination with periods of in-class interaction for universities/high schools. More online continuing education would also let school teachers improve their curriculum and com-munication skills.
Lifelong education is particularly important for workers with vocational schooling, and it also faces issues that are familiar but more serious in times of structural change. During a lockdown, leisure service workers must be idle, but office and factory workers can still produce using socially distanced technology. If, in the aftermath of the pandemic, many office and factory jobs disappear more quickly, while there are new demands for new types of activity, workers will need to retrain, both within their firm or when they are between jobs. If, for instance, leisure-support or office jobs disappear permanently, suitable retraining should be a condition of wage support or unemploy-ment benefits.

9EEAG Report 2021
EXECUTIVE SUMMARY
The coronavirus crisis has dramatically reduced international mobility but has also led to introduction of policy instruments that in the future might let this mobility resume and will perhaps not be hampered by concerns about such funding spillovers: if the com-mon debt issued in the NGEU framework is used to fund education and is repaid in proportion to future income, it automatically implies transfers from coun-tries that have high income and attract migrants to countries where low income induces outmigration.
CHAPTER 4Business Investment
Chapter 4 turns to the examination of how business investment can be enhanced to contribute to future growth. Business investment will be the key for long term economic growth and productivity, but there is a long-standing problem that predated the coro-navirus crisis. During the years of the financial crisis of 2008/2009 investment in Europe declined and re-mained weak. After corona, there is widespread con-cern that small and medium sized companies (SMEs) will find it especially difficult to survive because their financial reserves as well as their access to financing is often more restricted than that of large companies. This applies in particular to SMEs operating in the sectors most affected by the crisis.
One major drawback of public support for com-panies is that it may keep firms alive that are not via-ble in the long term, giving rise to “zombie firms.” To reduce the risk of supporting zombie firms, govern-ments should prefer loan guarantees where part of the risk is borne by private investors such as banks.
One further way of providing financing through the tax system is to introduce accelerated depreci-ation or even immediate write-offs for investment spending. This can facilitate investment, but mainly helps through improved incentives to invest for prof-itable firms.
European coordination is required for many rea-sons. From a European perspective, it is important to avoid harmful subsidy races in which individual national champions are pitted against each other. In addition, not all EU member states may be able to support private investment where it is desirable. Mem-ber states with higher debt levels may be reluctant to do so. Given this, it would have been helpful to make solvency support measures an important part of the NGEU. Creating the right climate for investment is also key. Uncertainty about future regulation and taxation related to climate change is the most important ob-stacle to investment.
There is a risk of national solutions in particular areas, with health having been given a special promi-nence in the wake of the coronavirus crisis, amid con-cern about the availability of medical equipment and pharmaceuticals. Calling for a general winding down of border crossing value chains would be highly coun-terproductive. First, as a consequence of the crisis, companies will of themselves reconsider the tradeoffs between production costs and the vulnerability of value chains. Second, reducing vulnerability may require more, not fewer, international value chains. Deepening the European internal market, for instance, by moving quickly to capital market union should be a key priority for the coming years.

10 EEAG Report 2021
CHAPTER 1
Since early 2020, the coronavirus pandemic has been the dominant topic for the European and the world economy at large. Until we reach herd immunity through large-scale vaccination of the population, this is likely to remain the case. Like the pandemic, the economic developments in recent times can best be described as occurring in waves. The first wave shocked us all. It triggered both rapid and sharp changes in social behavior and the swift introduction of policies to curb the virus. This initial “shock wave” went hand in hand with the sharpest post-war reduc-tion in GDP. Nevertheless, it did not prevent 160,000 and 200,000 Covid-19-related fatalities in, respec-tively, Europe (EU and UK) and the rest of the world during the months of March, April and May 2020 (see Figure 1.1). At least in Europe, the impression existed that, as in Asia, the virus was under control during the summer months. While the death toll continued to rise in the rest of the world (490,000 Covid-19 re-lated registered deaths during July-September 2020), it fell to low levels on the European continent (16,000 persons during that same period). To a large extent, economies recovered in a V-shaped form. Despite be-ing forecasted by many, the second wave in Europe came as a surprise. Both the society at large and pol-itics reacted differently this time. In some sense, the population had already become accustomed to the virus and a kind of pandemic fatigue had set in. At the same time, many viewed that harsh lockdowns imposed during the first wave should be prevented or postponed in this second wave as long as possible in order to reduce economic hardship. This different attitude, together with more knowledge about how
to keep the economy going during a pandemic, cir-cumvented another sharp decline in value added. At the same time, however, the number of deaths in Eu-rope rose by 230,000 during the months of October, November and December 2020, making the second wave from this perspective already worse than the first one before being brought under control.
From a bird’s eye perspective, during the first wave, Europe seems to have been somewhat closer to the Asian model, where swift and radical coercive measures were taken to combat the pandemic, than to the American model, where the laissez-faire econ-omy was paramount. During the second wave, how-ever, Europe’s position seems to have moved toward the latter.
Fortunately, there is light at the end of this tun-nel. The arrival of several highly effective vaccines has increased the likelihood that, later this year, large parts of the world will achieve herd immunity, allowing a slow return to a more social way of life and thereby a further recovery of the economy. Until then, however, social distancing is still warranted.
1.1 CURRENT SITUATION
1.1.1 Global Economy
During the first half of 2020, global Gross Domestic Product (GDP) fell by almost 10 percent as compared to value added levels achieved in the last quarter of 2019 (see Figure 1.2). Then, in the summer of 2020, overall economic production picked up strongly again. This was a consequence of the reduction in Covid-19 infections and the associated withdrawal of infec-tion control measures to combat the virus during the first half of the year. This allowed companies to revive production again and households to significantly in-crease their spending. Nevertheless, overall economic production in the advanced economies was still more than 2 percent below the pre-crisis level in the third quarter.
Not only was the downturn last year much more pronounced than during the financial crisis of 2008/2009, the recovery was also stronger. Moreo-ver, the recovery this time went much faster. During the financial crisis, it took us three quarters to reach the level we have now reached within one quarter. Accordingly, the first wave of the coronavirus crisis can largely be described as having been V-shaped.
The regional differences are, however, quite pro-nounced. The production slump in the emerging mar-kets during the first half of the year was overall much
Macroeconomic Conditions and Outlook
0
2000
4000
6000
8000
10000
12000
1 2 3 4 5 6 7 8 9 10 11 12
Euro area Remaining EUUnited Kingdom United StatesRest of the world
Note: 14-days moving average of the daily number of deaths registered to be related to Covid-19.Source: Reuters; last accessed on 10 January 2021.
Worldwide Covid -19 Related Daily Deaths in 2020
Deaths
© CESifo
Months
Figure 1.1

11EEAG Report 2021
CHAPTER 1
more moderate than in the advanced economies. This was not only due to China, whose production recov-ered rapidly after the shutdown at the beginning of the year and which had already reached pre-crisis levels by June. During the summer, many other Asian countries also exceeded pre-crisis levels again. Most of these countries were much more successful in fighting and controlling the pandemic. First, these governments acted more quickly and thoroughly (see e.g., Nebehay and Shields 2020). Second, citizens in many Asian countries were already experienced in dealing with epidemics in the past and were therefore much more aware of the dangers they pose. Third, their cultural attitude toward collective action and responsibility toward others differ. Furthermore, and for similar reasons, these countries did not lift any re-strictions before being quite certain that they would be able to control any new outbreaks. Even if it did not appear that Asian policymakers and society were initially focused on the pandemic’s economic conse-quences, the result is that today, Asian markets are less affected by the pandemic than the European and American economies.
Not only were consumer-related services and thereby international travel and the associated hos-pitality sectors hit by the crisis, which therefore led to the severe drop in GDP, but also the production of and cross-border trade in goods suffered significant losses in spring. Especially in the advanced econo-mies, industrial production and international trade slumped by respectively almost 18 percent or close to 20 percent, as compared to pre-crisis levels. Both bounced back relatively quickly during the summer and autumn, and almost reached pre-crisis levels. International travel and tourism, on the other hand, have so far failed to recover.
The pandemic created an unprecedented level of uncertainty that is also affecting economic policy and in particular, business investment (see Figure 1.3). In times of uncertainty, companies tend to postpone their investments or abandon their investment plans altogether. Whereas those consumers who kept their job and income have been forced to save, many firms have seen their profits plummet since the beginning of the crisis. Especially small- and medium-sized enter-prises finance their investments to a large extent from retained profits. The uncertain outlook, combined with changes in liquidity holdings, make it unlikely that business investment will be able to bounce back as quickly as private consumption.
The rollercoaster that the global economy has been on is also reflected in economic tendency sur-veys from around the world. While the end of 2019 saw the lowest values of these surveys since the start of the financial crisis of 2008/2009, the beginning of 2020 looked promising: sentiment indicators around the globe recovered. With the arrival of the pandemic and the associated lockdown measures, these survey values fell in an unprecedented manner. By the end
Source: CPB Netherlands Bureau for Economic Policy Analysis; last accessed on 10 January 2021; EEAG calculations. © CESifo
Regional Contributions to GDP, Industrial Production and World Trade
~2008 2009 2010 2019 2020-15
-10
-5
0
5
10
80
85
90
95
100
105
Emerging and developing countriesAdvanced economies
Index (2008Q2 = 2019Q4 = 100) Monthly growth in %
World trade
~2008 2009 2010 2019 2020-10-8-6-4-20246
86889092949698
100102
Emerging and developing countriesAdvanced economies
World industrial production
Index (2008Q2 = 2019Q4 = 100) Monthly growth in %
~2008 2009 2010 2019 2020-8-6-4-20246810
86889092949698
100102104
Emerging and developing countriesAdvanced economies
Index (2008Q2 = 2019Q4 = 100) Quarterly growth in %
World GDP
Figure 1.2
2017 2018 2019 2020
5075100125150175200225250275-12
-10-8-6-4-20246
Global EPU Indexᵃ
Source: Baker et al. (2016), www.policyuncertainty.com; OECD; last accessed on 10 January 2021.
Change over previous year's quarter in %
© CESifo
Global Economic Policy Uncertainty Index and Investment Growth in the OECD
Index (2017 = 100)
Real Gross Fixed Capital Formation in the OECD
First wave coronavirus crisis
Trade war,Brexit
ᵃ Global Economic Policy Uncertainty (EPU) is calculated as the GDP-weighted average of monthly EPU index values for the United States, Canada, Brazil, Chile, the United Kingdom, Germany, Italy, Spain, France, Netherlands, Russia, India, China, South Korea, Japan, Ireland and Australia using GDP data in current prices from the IMF World Economic Outlook Database.
Figure 1.3

12 EEAG Report 2021
CHAPTER 1
of last year, and despite the renewed sharp rise in Covid-19 infections around the world, overall senti-ment indicators had not returned to a significant de-
cline. Instead, the recovery in the coincident Global Economic Barometers has basically stalled, and this holds true for all major regions of the world (see Fig-ure 1.4).1 This is in sharp contrast to the slower but sustained and therefore stronger recovery pattern that these indicators showed during the 2008/2009 financial crisis.
The improved sentiment and the associated in-crease in economic output in the third quarter also caused the price of crude oil to rise sharply after bot-toming out in April. The measures adopted by the oil-exporting countries in May to cut oil production probably also contributed to this. Since the price of oil, however, is still below 2019 levels, this is not yet reflected in inflation rates (see Figure 1.5). Since Au-gust, general inflation has been much more subdued, dampened by the trend decline in core inflation rates in Europe, China and Japan (see Figure 1.6). Concerns about renewed increases in infections, rises in un-employment and the increased propensity to save not only put downward pressure on economic activ-ity, but also prices. That said, actual inflation in the current year might be underestimated (see Cavallo 2020, Reinsdorf 2020), since the calculation of price indices is based on last year’s basket of goods and services and consumers have moved toward those goods that have become relatively more expensive. On top of that, price data for the months affected by major shutdowns should be interpreted with caution, since many price indices are based on a significantly smaller amount of collected price data or have to be derived entirely from other indices (see Bureau of La-bor Statistics 2020, Eurostat 2020).
As for the world economy, the drop in US GDP was swift and strong. Within two quarters, quarterly production levels dropped by more than 10 percent as compared to the pre-crisis level. In the third quar-ter, a swift recovery still left the US economy about 3.4 percent below the GDP level it had reached by the end of 2019. In the financial crisis of 2008/2009, it took more than 5 quarters to reach this level again, despite the trough being not even 4 percent below pre-crisis levels (see Figure 1.7).
The degree of synchronization among the differ-ent spending components has been extraordinary. Whereas during the financial crisis, private consump-tion functioned as a clear stabilizer, this time around its fall was completely in line with the overall drop in production. At this level of aggregation, the only spending component that could buffer the fall a little bit was public consumption, which managed to in-crease by 0.8 percent relative to the fourth quarter of 2019. In contrast to the financial crisis that went hand in hand with a real-estate crisis in the United States,
1 This indicator is based upon hundreds of economic tendency sur-vey results conducted in countries worldwide. The index for each region is constructed as such that it has a high correlation with con-temporaneous world GDP growth. The index is constructed to have an in-sample average of 100 and a standard deviation of 10. See Abberger et al. (2020) for further information.
405060708090
100110120130140
~2008 2009 2010 2019 2020 2021
Asia and Pacific Europe Western Hemisphere
Note: Indicators with an in-sample average of 100 and a standard deviation of 10.Source: KOF/FGV; last accessed on 10 January 2021.
Global Economic BarometersCoincident composite indicators
© CESifo
Index
Figure 1.4
-67
-33
0
33
67
100
-1
0
1
2
3
4
2011 2012 2013 2014 2015 2016 2017 2018 2019 2020 2021
Inflation in the worldInflation in the euro area
Note: Forecast based on the assumption that oil prices remain steady from January 2021 onwards.Source: Eurostat; National Statistics; Energy Information Administration; last accessed on 13 June 2020; EEAG calculations.
%
© CESifo
Worldwide Inflation and Oil Price MovementsChange overprevious year's month in %
Forecastperiod
%
Oil price changes in US dollars
Figure 1.5
-2
-1
0
1
2
3
4
2011 2012 2013 2014 2015 2016 2017 2018 2019 2020
United States China Japan United Kingdom Euro area
Source: US Bureau of Labor Statistics; Statistics Bureau of Japan; National Bureau of Statistics of China; Eurostat; last accessed on 10 January 2021.
Core Inflation RatesChange over previous year's month
%
© CESifo
Figure 1.6

13EEAG Report 2021
CHAPTER 1
gross fixed capital formation this time did not fall as much as international trade or private consumption did. This time around, residential investment stabi-lized the development of overall investment. Whereas non-residential investment plummeted by nearly 10 percent relative to the end of 2019 in the second quarter and was still 4 percent below pre-crisis level in the third quarter, residential investment only fell by 6 percent in the second quarter and managed to surpass fourth-quarter 2019 levels by close to 6 per-cent in the third quarter.
Flexible labor market contracts, together with a lack of job retention measures such as short-time work and wage subsidies, have led to a remarkable increase in the unemployment rate and a strong re-duction in the participation rate in the United States (see Figure 1.8). Within two months, the unemploy-ment rate rose from 3.5 percent to 14.7 percent. De-spite its rapid decline during the subsequent months, it still stood at a, for the US, very high 6.7 percent in November. The participation rate probably fell by 1.5 percentage points last year. All in all, the num-ber of employed persons is still more than 9 million lower than it was before the onset of the crisis, im-plying a decline of more than 6 percent as compared to pre-crisis employment. Hence, in contrast to many other countries, employment in the United States has clearly declined more than real GDP has. This also reflects that it is mainly low-wage jobs that have dis-appeared, and that the crisis is above all a crisis of the non-financial service sector.
1.1.2 European Economy
Europe also went through a V-shaped crisis related to the first wave of the pandemic. Unlike the United States, however, the decline in the domestic demand components and overall GDP was more pronounced. Due to the drastic measures to contain the corona-virus epidemic this past spring, GDP in the euro area
fell 15 percent below pre-crisis levels during the sec-ond quarter of this year. With the gradual easing of government restrictions from May onward, economic activity picked up noticeably.
Overall, economic output in the third quarter grew by 12.5 percent, the strongest increase since the establishment of the euro area. This made up for a good part of the economic slump. However, GDP in the
75
80
85
90
95
100
105
110
~2008 2009 2010 2019 2020
Index (2008Q2 = 100) Index (2019Q4 = 100)
Source: OECD; Eurostat; last accessed 10 January 2021.
Euro area
© CESifo
75
80
85
90
95
100
105
110
~2008 2009 2010 2019 2020
GDP Gross fixed capital formation Private consumption Public consumption Exports Imports
Index (2008Q2 = 100) Index (2019Q4 = 100)
Spending Developments
United States
Figure 1.7
0
2
4
6
8
10
12
14
16
2008 2010 2012 2014 2016 2018 2020
United States Japan United Kingdom Euro area
Source: OECD Main Economic Indicators; OECD Economic Outlook; last accessed on 10 January 2021.
Unemployment Rates and Labor Force Participation Rates
% of labor force
© CESifo
Unemployment rates Labor force participation rates
62
64
66
68
70
72
74
76
2008 2010 2012 2014 2016 2018 2020
% of working-age population
Figure 1.8

14 EEAG Report 2021
CHAPTER 1
third quarter was still 4.4 percent below its pre-crisis level (2019Q4). The decisive factor for this rapid recov-ery was the strong increase in private consumption, which expanded by 14 percent as compared to the previous quarter, thus compensating for a large part of the slump. Gross fixed capital formation also made an important contribution to the recovery. Despite an increase of 13.4 percent compared to the previous quarter, investment activity was still about 10 percent lower than before the outbreak of the crisis.
With the easing of infection control measures in summer, household consumption expenditure in-creased. In May, retail sales rose by a strong 20 per-cent and industrial production by 12.5 percent com-pared to the previous month. Retail sales increased so strongly that there was an overshooting of the pre-crisis level in many European countries. Since the outbreak of the pandemic, sales via the internet have increased markedly. Although the importance of online trade compared to stationary trade had al-ready increased in previous years (see Bank of Eng-
land 2020), the latest increases indicate a noticeable acceleration. Nevertheless, the pandemic has left per-sistently negative traces on private consumption. For the euro area, total consumer spending, for example, was still 4.6 percent below the pre-crisis level in the third quarter of 2020. Demand for contact-intensive services remains subdued. Catering establishments, accommodation facilities and all other tourist busi-nesses were only opened under strict conditions, which included restrictions on occupancy rates. Fur-thermore, there were also behavioral changes on the part of households, which led to a partial renunciation of such services. In many places, these behavioral changes, as well as the increased uncertainty of many households about their future income, led to a signif-icant increase in the consumer savings rate.
The financial crisis in 2008/2009 turned out to be an industrial crisis that over time also substantially af-fected construction activity at the euro area level. In contrast, the pandemic and the associated behavioral changes, together with lockdown measures, strongly affected retail and wholesale trade, the transportation sector and gastronomy (see Figure 1.9). While the first two sectors, and especially retail trade, experienced a significant rebound, this was true to a much lesser extent for the hospitality sector. Many service sectors recovered only moderately, since their business activity remained limited due to the hygiene regulations still in force. While retail trade had already reached the pre-cri-sis level in June, sales levels of the remaining service providers in September were still off by 9 percent.
As a result of the economic slump, the unem-ployment rate in the euro area also climbed from 7.2 percent in April to 8.7 percent in July. While the increase in Germany was below average, unemploy-ment in France, Italy and Spain increased more than in the euro area as a whole during this period (see Figure 1.10). Nevertheless, this increase was still mod-erate given the strong decline in economic output (see Figure 1.11). Economic policy measures implemented
-14
-12
-10
-8
-6
-4
-2
0
2
Industry(incl. Agr.)
Construction Trade, Transport& Gastronomy
Business-orientedservices
Consumer-oriented services
Great financial crisis (2008Q4–2009Q2)Coronavirus crisis (2020Q1–Q3)
Note: During the first three quarters of the crisis (relative to the quarter before).Source: Eurostat; last accessed on 10 January 2021.
Cumulative Loss in Sector-Specific Value Added in the Euro Area
© CESifo
%
Figure 1.9
0
5
10
15
20
25
30
2008 2010 2012 2014 2016 2018 2020
Germany France Italy Spain Greece Portugal Ireland Cyprus
Source: Eurostat; OECD Economic Outlook; last accessed on 10 January 2021.
Unemployment Rates and Participation Rates in Selected Euro Area Countries
% of labor force
© CESifo
Unemployment rates Participation rates
54
56
58
60
62
64
66
68
70
72
2008 2010 2012 2014 2016 2018 2020
% of working-age population
Figure 1.10
15EEAG Report 2021
CHAPTER 1
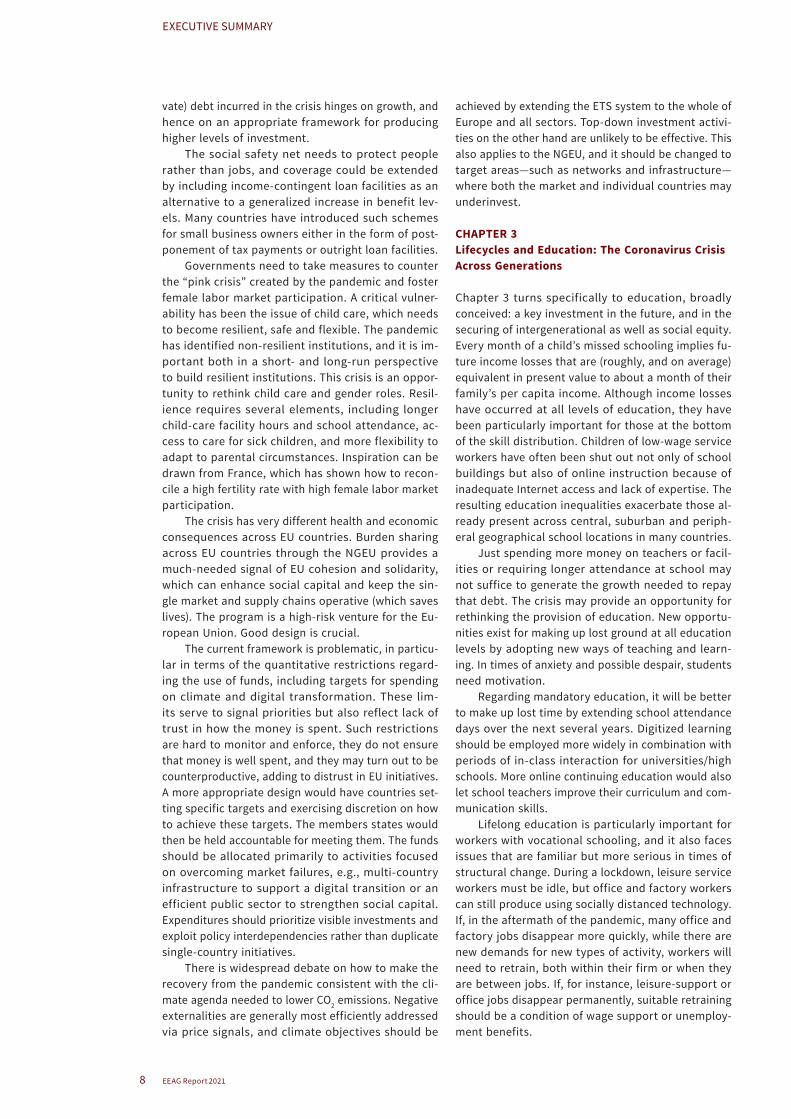
in many euro area countries to temporarily stem job loss have so far prevented greater job losses. The in-strument of short-term work, for example, has con-tributed substantially to the fact that the economic slump has been reflected above all in a significant de-cline in the number of hours worked instead of actual employment. Since the summer, the unemployment rate has declined slightly thanks to the strong recov-ery and stood at 8.3 percent in November.
Often the change in the unemployment rate does not fully reflect what is happening to the number of persons employed. In some countries, many have left the labor market or are in the process of doing so, leaving not only employment but also the labor force and therefore are not counted as being unemployed. In Finland, this effect is so strong that the number of unemployed persons actually fell between January and November last year: the reduction in the labor force was stronger than the reduction in jobs (see Figure 1.12). In the United States, the number of those employed fell by about 5.4 percent between January and November of last year. The rise in unemployment accounted for about 55 percent of this – roughly 45 percent reflects a reduction in the labor force.
Price increases have lost considerable momentum since the summer; most recently, inflation rates were even negative (in November, –0.3 percent compared to the previous year). This was due not only to the decline in energy prices compared to the previous year, but also to the weak core inflation rate, which stood at 0.25 percent in November. Core inflation is likely to have come under pressure in the wake of the economic slump and the VAT cut in Germany.
1.2 FISCAL AND MONETARY POLICY
1.2.1 Fiscal Policy
As a reaction to the crisis, fiscal policy took a very expansionary course. In the advanced economies, ad-ditional spending on discretionary measures, such as one-off payments to households or tax deferrals, amounts to about 9 percent of GDP (see International Monetary Fund 2020). Liquidity support measures, such as equity enhancements and credit guarantees, amount to about 11 percent of GDP. Many emerging markets also saw additional discretionary measures amounting to 3.5 percent of GDP as well as liquidity support of more than 2 percent. Whereas government revenues have also fallen on both sides of the Atlantic, government expenditures have in particular skyrock-eted, causing historically extreme increases in public deficits last year (see Figure 1.14). Although this year expenditures will be lowered again substantially and revenue will slowly start to normalize, government deficits will remain at historically high levels. Accord-ing to IMF estimates, the United States realized a gov-ernment deficit of 18.7 percent last year that will fall to 8.7 percent this year.
In early April, the European Union finance minis-ters agreed on a 540 billion euros package of meas-ures to combat the economic impact of the global pandemic. The plan includes a 100 billion euros joint
-8
-6
-4
-2
0
2
Industry (incl. Agr.) Construction Trade, Transport& Gastronomy
Business-orientedservices
Consumer-oriented services
Great financial crisis (2008Q4–2009Q2)Coronavirus crisis (2020Q1–Q3)
Note: Relative to pre-crisis levels.Source: OECD Quarterly National Accounts; last accessed on 10 January 2021.
Change in Employment in the Euro Area During the First Three Quarters of the Crisis
© CESifo
%
Figure 1.11
-6 -5 -4 -3 -2 -1 0 1 2
United StatesGermany
CanadaAustria
PortugalNetherlands
FinlandJapan
SwedenItaly
Luxemburg
Labor force Unemployed Employed
Source: different national sources; last accessed on 10 January 2021; EEAG calculations.
Decomposing the Decline in Employment between January and November 2020
© CESifo
%-change
Figure 1.12
-1.0
-0.5
0.0
0.5
1.0
1.5
2.0
2.5
3.0
3.5
2011 2012 2013 2014 2015 2016 2017 2018 2019 2020
HICPᵃ Core inflation rateᵇ GDP deflator
ᵃ Harmonized Index of Consumer Prices (HICP). ᵇ HICP excluding energy, food, alcohol and tobacco. Source: Eurostat; last accessed on 10 January 2021.
Price Developments in the Euro AreaChange overprevious year's month
%
© CESifo
Figure 1.13

16 EEAG Report 2021
CHAPTER 1
employment insurance fund, a European Investment Bank instrument to provide companies with 200 bil-lion euros in liquidity, and credit lines of up to 240 bil-
lion euros from the European Stability Mechanism —the euro area’s bailout fund—to prop up states as they help to get the economy back on its feet.
At the EU summit in early December, the mem-ber states not only agreed on the regular Multiannual Financial Framework for 2021 to 2027 amounting to about 1.1 trillion euros, but also on the construction of the “Next Generation EU” (NGEU) program to cope with the economic consequences of the coronavirus pandemic. This package comprises 750 billion euros, of which 390 billion euros are direct transfers and 360 billion euros are loans to be repaid, and it will be funded through direct borrowing by the EU in capital markets. As we discuss in the next chapter, this is an unprecedented program with potentially far-reaching implications.
In order to finance the reconstruction fund, the EU Commission itself is taking on debt on the capital market for the first time in history in the amount of 750 billion euros, which is to be repaid by 2058 at the latest. The member states are the guar-
Table 1.1
Labor Costsᵃ
Compensation per employeeᵇ
Real compensationᶜ
Labor productivity
Unit labor costs
Relative unit labor costsᵈ
Export performanceᵉ
1999–2013
2014–2019 2020
1999–2013
2014–2019 2020
1999–2013
2014–2019 2020
1999–2013
2014–2019 2020
1999–2013
2014–2019 2020
1999–2013
2014–2019 2020
Germany 1.5 2.7 0.2 0.5 1.0 1.3 0.6 0.6 – 4.6 0.9 2.4 5.2 – 1.3 1.1 2.1 0.4 – 0.2 0.0
France 2.6 1.2 – 2.6 1.1 0.3 – 1.4 0.8 0.7 – 7.6 1.8 0.4 5.3 – 0.1 – 1.1 1.7 – 1.5 – 0.1 – 8.3
Italy 2.0 0.8 – 3.9 – 0.1 – 0.1 – 0.4 – 0.3 0.1 – 7.2 2.4 1.2 3.6 0.3 0.1 0.6 – 3.1 – 0.4 – 7.5
Spain 2.5 0.9 – 1.3 0.1 0.1 0.0 0.6 0.4 – 7.5 2.0 0.8 6.7 0.1 – 0.5 3.8 – 0.8 0.2 – 9.0
Netherlands 2.7 1.5 3.4 0.8 0.1 – 0.9 0.8 0.5 – 3.6 1.9 0.9 6.7 – 0.3 – 0.2 5.2 – 0.3 0.4 8.6
Belgium 2.7 1.2 – 4.1 1.0 – 0.3 0.6 0.9 0.5 – 6.5 1.9 0.7 2.3 0.3 – 0.6 – 0.6 – 1.4 – 0.1 3.7
Austria 2.2 2.3 0.5 0.6 0.5 1.6 0.8 0.5 – 5.4 1.4 2.0 7.1 – 0.3 0.1 3.0 – 0.5 0.0 – 2.9
Finland 2.9 0.8 – 0.2 1.2 – 0.5 – 1.6 0.9 0.6 – 2.5 2.1 0.3 1.6 – 0.7 – 0.2 – 0.8 – 1.4 0.0 – 1.4
Greece 2.7 – 0.4 – 2.2 0.7 0.0 0.0 0.7 – 0.5 – 7.8 2.9 0.7 5.9 0.4 – 0.4 4.1 – 0.9 2.0 – 14.1
Ireland 3.5 2.4 – 4.2 1.3 0.3 0.1 1.8 6.4 1.1 1.9 – 3.3 – 5.1 0.7 – 4.8 – 10.8 2.3 9.0 15.3
Portugal 2.7 1.5 0.8 0.4 0.0 – 1.4 1.1 0.4 – 5.8 1.9 1.7 6.8 – 0.1 0.5 2.8 – 0.3 1.2 – 9.6
Slovakia 6.4 4.4 0.4 3.2 3.5 2.4 3.5 1.3 – 4.0 2.4 3.5 5.2 1.5 1.6 2.2 4.8 – 0.1 2.8
Slovenia 5.7 2.9 0.8 2.0 1.6 0.7 1.9 1.4 – 6.0 3.6 1.8 7.2 – 0.2 0.1 4.8 0.9 2.2 – 2.5
Estonia 6.8 – 1.1 – 5.3 4.0 8.1 3.8 2.2 – 2.3 5.1 4.2 – 0.7 1.9 3.2 – 2.8 1.5 0.1 – 0.8
Sweden 3.6 2.8 2.4 2.1 0.7 1.3 1.5 0.9 – 1.3 2.3 2.1 3.6 0.3 – 2.6 1.0 – 0.8 0.5 4.8
Denmark 3.1 1.6 1.0 1.0 0.9 0.4 1.0 1.1 – 2.8 2.2 0.5 3.7 0.1 – 0.7 0.6 – 0.6 0.1 – 1.0
Poland 5.2 5.0 3.6 2.0 3.7 1.2 3.4 3.3 – 3.0 2.3 2.1 6.2 – 0.7 0.3 – 0.8 2.3 3.1 4.6
Czech Republic 4.9 5.2 – 0.6 3.0 3.1 1.5 2.4 2.3 – 5.5 2.2 3.1 4.9 2.5 1.5 – 2.3 3.6 0.9 – 2.2
Hungary 6.8 4.0 7.1 1.7 0.4 1.1 2.0 1.4 – 2.1 5.1 2.4 7.6 1.5 – 1.1 – 4.1 3.8 1.6 – 3.0
United Kingdom 3.7 2.4 1.7 1.6 0.6 – 3.5 1.1 0.4 – 10.6 2.5 1.8 15.0 – 1.2 0.0 11.6 – 2.2 – 1.7 – 3.4
Switzerland 1.5 0.3 – 4.7 0.7 0.6 0.5 0.8 0.7 – 4.3 1.0 – 0.2 – 0.9 0.8 0.0 – 0.4 – 1.2 – 2.0 8.3
Norway 4.9 2.7 1.2 0.0 1.7 6.3 0.7 0.5 – 0.2 4.4 2.3 1.5 2.8 – 2.6 – 10.2 – 3.8 – 2.2 12.6
Iceland 6.6 7.0 2.2 1.0 3.8 3.3 1.3 1.6 – 6.1 5.6 4.6 11.5 – 1.2 6.5 – 4.8 0.8 0.3 – 20.3
United States 3.3 2.6 6.4 1.2 1.0 1.5 1.7 0.8 1.7 1.6 1.9 4.0 – 1.9 3.5 2.1 – 1.3 – 0.9 – 2.3
China 4.2 1.1 0.0 9.6 0.5 7.7
Japan – 0.7 0.8 – 0.7 0.4 0.0 – 0.2 1.0 – 0.2 – 4.6 – 1.3 1.2 4.2 – 2.7 – 0.1 4.2 – 2.9 0.3 – 5.3
ᵃ Growth rates for the total economy. ᵇ Compensation per employee in the private sector. ᶜ Compensation per employee in the private sector deflated by the GDP deflator. ᵈ Competitiveness: weighted relative unit labor costs. ᵉ Ratio between export volumes and export markets for total goods and services. A positive number indicates gains in market shares and a negative number indicates a loss in market shares.
Source: OECD Economic Outlook No. 108, November 2020.
0
5
10
15
20
25
30
35
07 08 09 10 11 12 13 14 15 16 17 18 19 20 2125
30
35
40
45
50
55
60
United States – deficit Euro area – deficitUnited States – revenues Euro area – revenuesUnited States – expenditures Euro area – expenditures
3%-line
Government Budgets in the United States and the Euro Area
Source: IMF World Economic Outlook, October 2020; last accessed on 10 January 2021. © CESifo
% of GDP (revenues/expenditures) % of GDP (deficit)
Figure 1.14

17EEAG Report 2021
CHAPTER 1
antors and are liable up to a maximum of their share of the EU budget. In order to repay the debt, EU-wide taxes will be levied for the first time. For example, a tax on non-recyclable plastic is to be introduced in all member states this year. A digital tax and a CO2 border tax are to follow by 2023 at the latest. Furthermore, a financial transaction tax is planned by 2026.
The bulk of the direct aid will probably not flow until mid-2021. Therefore, the reconstruction fund is not primarily intended as a cyclical support to cushion the coronavirus crisis. Rather, the economies in the member countries are to be structurally strengthened and prepared for future developments. In order to be able to draw on the funds, national governments must submit development and resilience plans to the EU Commission, which must ultimately be approved by the EU Council. This is to ensure that a large part of the reconstruction fund is invested in line with EU policy guidelines, especially regarding climate change and the digital transformation of the economy. A large part of the aid is to go to Italy and Spain, which were particularly affected by the pandemic but which al-ready had ongoing structural problems.
The experience from the 540-billion-euro-rescue package adopted in April indicates that there may not be too much demand for credit assistance from the re-construction fund for the time being. Low-interest rate loans from the ESM of over 240 billion euros as part of the rescue package have so far remained untouched. This suggests that the member states have so far been able to finance themselves independently thanks to the extensive interventions by the ECB through which good capital market conditions were created. National borrowing also offers the member states the advan-
tage that they do not have to expose themselves to the reform conditions of the EU Commission. Should bond interest rates remain low as expected, national governments will probably only resort to the repay-able 360 billion euros from the reconstruction fund in an emergency. The guarantee fund for corporate loans has also hardly been touched as of yet, with only one billion euros of the available 200 billion euros approved so far. In contrast, there has been strong demand for the European Short-Time Workers’ Com-pensation from the April aid package. Of the 100 bil-lion euros, the EU Commission had already approved applications from member states for 90 billion euros by mid-December.
-14
-12
-10
-8
-6
-4
-2
0
2
2008 2009 2010 2011 2012 2013 2014 2015 2016 2017 2018 2019 2020 2021
Japan United Kingdom United StatesEuro area China Switzerland
Source: IMF World Economic Outlook, October 2020; last accessed on 10 January 2021.
Government Structural Primary Budget Balances
% of trend GDP
© CESifo
Forecastperiod
Figure 1.15
-5 -4 -3 -2 -1 0 1 2 3 4 5 6
RomaniaCyprus
HungarySpain
SloveniaItaly
EstoniaAustria
BelgiumFinland
LithuaniaGreecePoland
Euro areaFrance
SlovakiaLatvia
GermanyPortugal
CroatiaCzechiaSweden
MaltaNetherlands
LuxemburgIreland
BulgariaDenmark
© CESifo
ᵃ Defined as changes in structural primary fiscal balances. A positive value implies a deterioration of the structural primary fiscal balance position and thereby a positive fiscal impulse for the economy. Source: European Commission; last accessed on 10 January 2021; EEAG calculations.
Fiscal Impulses in EU Member Countriesᵃ
% of GDP
Aggregate impulses, 2016–2019
-5 -4 -3 -2 -1 0 1 2 3
GreeceRomania
FrancePortugal
SpainBulgariaEstonia
DenmarkSweden
Euro areaSlovakia
IrelandNetherlands
ItalySlovenia
GermanyCzechia
AustriaFinlandCroatia
BelgiumHungary
CyprusLithuania
LatviaLuxemburg
MaltaPoland
Fiscal impulses, 2021
% of GDP 0 1 2 3 4 5 6 7
LithuaniaAustria
MaltaPolandIreland
NetherlandsSloveniaSlovakia
CyprusLuxemburg
GermanyDenmark
FinlandItaly
LatviaEuro area
BelgiumCzechia
RomaniaBulgaria
GreeceCroatia
HungaryEstonia
PortugalFrance
SpainSweden
Fiscal impulses, 2020
% of GDP
Figure 1.16

18 EEAG Report 2021
CHAPTER 1
In 2020, all euro area countries are expected to have provided strong expansionary fiscal stimulus. Measures such as short-time allowances aimed at preserving jobs contributed to this. There was also additional spending on health care systems and sup-port for the private sector through liquidity support and reimbursement of lost sales. The strength of the expansionary impulses in the countries can be meas-ured by the changes in the structural primary fiscal balances. Declines in these balances correspond to expansionary fiscal impulses.
According to IMF estimates, the governments of the United States, Japan and the United Kingdom have seen sharp increases in their structural primary
deficits of 8.3, 9.7 and 12.2 percent, respectively (see Figure 1.15). Albeit historically still high, these esti-mated fiscal impulses have only been 4.2 and 4.7 per-cent for China and the euro area.
According to estimates by the European Commis-sion, among the five largest members, the strongest stimuli are expected in the Netherlands, Germany and Italy, while the stimuli in Spain and France are likely to be significantly lower (see Figure 1.16). This year in the euro area, the fiscal stimulus is on average likely to become more restrictive than what has been observed for 2016-2019, i.e., the four years before the corona-virus pandemic hit. In Germany, the Netherlands and Italy, they are likely to be slightly restrictive this year.
Table 1.2
Public Finances
Gross debtᵃ Fiscal balanceᵃ Primary fiscal balanceᵃ Cyclically-adjusted primary fiscal balanceᵃ
2011–2013
2014–2019 2020 2021
2011–2013
2014–2019 2020 2021
2011–2013
2014–2019 2020 2021
2011–2013
2014–2019 2020 2021
Germany 79.9 67.3 71.2 70.1 – 0.3 1.2 – 6.0 – 4.0 1.9 2.4 – 5.3 – 3.4 1.9 2.1 – 2.7 – 2.1
France 90.6 97.2 115.9 117.8 – 4.7 – 3.2 – 10.5 – 8.3 – 2.2 – 1.4 – 9.1 – 7.1 – 1.7 – 1.3 – 3.8 – 4.5
Italy 126.2 134.8 159.6 159.5 – 3.1 – 2.4 – 10.8 – 7.8 1.7 1.5 – 7.2 – 4.4 3.0 2.4 – 2.2 – 1.7
Spain 84.0 98.4 120.3 122.0 – 9.2 – 4.0 – 12.2 – 9.6 – 6.2 – 1.2 – 9.9 – 7.4 – 0.3 0.1 – 3.6 – 3.8
Netherlands 65.2 58.7 60.0 63.5 – 3.8 0.0 – 7.2 – 5.7 – 2.1 1.1 – 6.5 – 5.3 – 0.9 1.0 – 3.9 – 3.5
Belgium 104.6 102.8 117.7 117.8 – 3.9 – 1.9 – 11.2 – 7.1 – 0.5 0.7 – 9.2 – 5.2 – 0.1 0.0 – 4.8 – 2.8
Austria 81.9 79.1 84.2 85.2 – 2.2 – 0.9 – 9.6 – 6.4 0.5 1.1 – 8.2 – 5.2 1.0 1.2 – 5.2 – 3.9
Ireland 116.9 73.7 63.1 66.0 – 9.0 – 1.0 – 6.8 – 5.8 – 5.1 1.3 – 5.7 – 4.9 – 2.8 0.1 – 4.3 – 3.9
Finland 52.7 61.1 69.8 71.8 – 1.9 – 1.6 – 7.6 – 4.8 – 0.5 – 0.6 – 6.9 – 4.2 0.4 – 0.1 – 4.6 – 2.9
Portugal 125.0 126.7 135.1 130.3 – 6.3 – 2.8 – 7.3 – 4.5 – 1.6 1.1 – 4.4 – 1.8 0.0 2.2 – 0.3 – 0.6
Greece 171.9 180.7 207.1 200.7 – 10.9 – 0.9 – 6.9 – 6.3 – 5.2 2.5 – 3.8 – 3.6 6.1 7.7 3.0 0.1
Slovakia 49.9 51.3 63.4 65.7 – 3.9 – 1.9 – 9.6 – 7.9 – 2.1 – 0.4 – 8.3 – 6.7 – 1.3 – 0.7 – 6.5 – 6.2
Luxemburg 21.6 21.7 25.4 27.3 0.7 1.9 – 5.1 – 1.3 1.2 2.2 – 4.8 – 1.0 2.8 2.4 – 1.9 1.1
Slovenia 56.7 75.2 82.2 80.2 – 8.4 – 1.5 – 8.7 – 6.4 – 6.3 1.1 – 7.0 – 4.8 – 3.9 1.5 – 5.2 – 4.6
Lithuania 38.5 38.6 47.2 50.7 – 4.9 0.1 – 8.4 – 6.0 – 3.0 1.3 – 7.8 – 5.5 – 0.5 0.3 – 7.1 – 4.5
Latvia 42.0 38.7 47.5 45.9 – 2.3 – 0.8 – 7.4 – 3.5 – 0.6 0.1 – 6.7 – 2.8 0.5 – 0.6 – 5.0 – 2.1
Estonia 8.7 9.4 17.2 22.5 0.3 – 0.1 – 5.9 – 5.9 0.4 – 0.1 – 5.8 – 5.8 0.2 – 1.2 – 4.0 – 4.1
Cyprus 83.4 101.0 112.6 108.2 – 5.7 – 1.6 – 6.1 – 2.3 – 2.8 1.1 – 3.7 – 0.2 – 0.4 4.5 – 2.4 0.2
Malta 67.0 51.4 55.2 60.0 – 2.7 0.7 – 9.4 – 6.3 0.3 2.6 – 8.4 – 5.1 0.7 0.7 – 5.8 – 2.5
Euro area 92.0 90.6 101.7 102.3 – 3.7 – 1.3 – 8.8 – 6.4 – 0.7 0.8 – 7.2 – 5.0 0.7 1.0 – 3.2 – 2.9
Sweden 38.3 41.0 39.9 40.5 – 0.9 0.4 – 3.9 – 2.5 0.1 0.9 – 3.5 – 2.6 0.9 0.7 – 1.0 – 1.0
Poland 55.1 50.3 56.6 57.3 – 4.3 – 1.8 – 8.8 – 4.2 – 1.7 – 0.2 – 7.4 – 2.8 – 1.6 – 0.6 – 6.8 – 2.4
Denmark 45.0 37.4 45.0 41.1 – 2.3 1.0 – 4.2 – 2.5 – 0.4 2.1 – 3.5 – 1.8 1.4 2.0 0.3 0.3
Czech Republic 42.7 35.8 37.9 40.6 – 2.6 0.1 – 6.2 – 4.7 – 1.3 1.0 – 5.4 – 4.0 0.0 0.7 – 3.4 – 2.5
Romania 36.2 36.6 46.7 54.6 – 3.7 – 2.4 – 10.3 – 11.3 – 2.0 – 1.0 – 8.6 – 9.4 – 0.8 – 1.0 – 6.9 – 8.0
Hungary 78.7 72.4 78.0 77.9 – 3.4 – 2.2 – 8.4 – 5.4 1.0 0.8 – 5.9 – 3.0 2.5 – 0.1 – 4.2 – 1.8
Bulgaria 16.3 25.0 25.7 26.4 – 0.9 – 0.3 – 3.0 – 3.0 – 0.2 0.4 – 2.4 – 2.3 0.0 0.8 – 1.5 – 1.7
Croatia 71.7 79.1 86.6 82.3 – 6.3 – 1.4 – 6.5 – 2.8 – 3.4 1.4 – 4.2 – 0.7 – 2.0 1.1 – 1.7 0.1
United States 102.7 106.2 131.2 133.6 – 7.4 – 4.8 – 18.7 – 8.7 – 5.3 – 2.8 – 16.7 – 6.9 – 2.7 – 2.3 – 12.9 – 5.8
China 35.1 45.6 61.7 66.5 – 0.4 – 3.7 – 11.9 – 11.8 0.1 – 3.0 – 10.9 – 10.9 – 0.1 – 2.8 – 9.2 – 10.0
Japan 227.6 235.4 266.2 264.0 – 8.7 – 3.7 – 14.2 – 6.4 – 7.6 – 3.1 – 13.9 – 6.2 – 6.6 – 3.3 – 12.5 – 5.4
United Kingdom 82.5 86.2 104.4 111.0 – 7.0 – 3.4 – 13.3 – 8.9 – 4.1 – 1.0 – 11.4 – 7.1 – 2.7 – 1.6 – 6.7 – 4.0
Switzerland 43.2 42.3 48.7 48.5 0.2 0.7 – 4.2 – 1.4 0.5 0.9 – 4.0 – 1.2 0.6 0.9 – 2.2 – 0.3
ᵃ As a percentage of (potential) gross domestic product (in case of cyclically adjusted (primary) fiscal balances). For countries of the European Union and the United Kingdom, definitions are according to the Excessive Deficit Procedure. For the United States, China, Japan and Switzerland, definitions are according to the IMF.
Source: European Commission, Autumn 2020; IMF World Economic Outlook, October 2020.

19EEAG Report 2021
CHAPTER 1
The coronavirus pandemic does not appear to have affected all member countries of the European Union equally. Looking at overall economic growth during 2020, potential key drivers have been the severity of the pandemic and the policy responses to these. Ob-viously, these are all interconnected: countries with more cases and more fatalities are probably also the ones that have introduced both more public health and economic support measures to cope with these. Using cross-section data for all EU member countries, except Malta (for which no Oxford Stringency Index is available) and simple regression techniques, this box explores the relationship between these three key drivers and eco-nomic growth.1 To capture more structural differences in growth, all regressions shown will include GDP growth as realized in 2019; those countries that experienced high growth in 2019 are more likely to perform better in 2020. As indicated by the R-squared at the bottom of the first column in Table 1.3, almost 18 percent of the variation in GDP growth rates across these countries can already be explained this way. A one percentage point higher growth rate in 2019 is associated with an almost ¾ percentage point higher growth rate in 2020.
The next three columns individually add proxies for each of the main drivers. Countries that registered more pandemic-related deaths during the year relative to their population sizes are those that also experienced lower growth (column (2)). Countries with on average more stringent public health measures (as proxied by the Oxford Stringency Index) witnessed low-er economic growth last year (Column (3)). Finally, those countries where the economic stimulus measures undertaken by
1 The growth rates for (2019 and) 2020 as used in this analysis are shown in Figure 1.39 and Table 1.A.2.
the government were more pronounced were able to alleviate some of the downfall in production. To meas-ure the so-called fiscal impulse, we use the change in the structural primary balance as published by Eurostat (see Figure 1.16). A deterioration in this balance receives a positive sign and reflects the short-term positive stim-ulus to the economy set by the authorities. An increase in the structural deficit of one percentage point is asso-ciated with a 0.67 percentage points higher growth rate. All three variables are individually significantly different from zero and help explain a substantial portion of the observed variation in economic growth. However, all three drivers are interrelated and looking at only one at a time might overestimate the importance of each.
For that reason, column (5) includes all in one spec-ification. By combining the information, we are now able to explain almost 50 percent of the variation in growth rates. As to be expected, the coefficient estimates of all variables are reduced (in an absolute sense). How-ever, both the Oxford Stringency Index and our Fiscal Impulse measure remain statistically significant. Regard-ing the latter, the coefficient estimate implies that of those countries with the same growth performance in 2019, the same number of (relative) fatalities and the same level of stringency measures in place, those that increased their structural deficit by one percentage point were on average able to reduce the drop in GDP by al-most 0.6 percentage points.
What is perhaps even more interesting is that the coefficient in front of the number of deaths becomes insignificant, albeit still with a negative sign. When con-trolling for preventive health measures, countries with
ILLUSTRATIVE ANALYSIS REGARDING GROWTH DIFFERENTIALS WITHIN THE EUROPEAN UNION IN 2020
Table 1.3
Illustrative Analysis Regarding Growth Differentials within the European Union in 2020
(1) (2) (3) (4) (5) (6)
VARIABLES GDP growth in 2020
GDP growth in 2020
GDP growth in 2020
GDP growth in 2020
GDP growth in 2020
GDP growth in 2020
GDP growth in 2019 0.744** 0.654** 0.552* 0.658** 0.468 0.620**
(2.288) (2.115) (1.763) (2.159) (1.624) (2.616)
Deaths per 100 thousand persons in 2020
– 0.0219* – 0.0122 – 0.0125
(– 2.036) (– 1.185) (– 1.496)
Oxford Stringency in 2020 – 0.153** – 0.123* – 0.110*
(– 2.241) (– 1.875) (– 2.084)
Fiscal Impulse in 2020 0.671** 0.559* 0.773***
(2.198) (1.964) (3.245)
Constant – 8.034*** – 6.215*** – 0.195 – 10.28*** – 2.627 – 4.606
(– 8.316) (– 4.876) (– 0.0541) (– 7.562) (– 0.752) (– 1.598)
Observations 26 26 26 26 26 25
R– squared 0.179 0.304 0.326 0.321 0.485 0.657
Notes: t– statistics in parentheses, *** p<0.01, ** p<0.05, * p<0.1. No Stringency data for Malta available and therefore not in the sample. In Column (6), Sweden (SD) is removed from the sample.
Sources: Blavatnik School of Government, Eurostat, Reuters, EEAG; last accessed on 10 January 2021.

20 EEAG Report 2021
CHAPTER 1
Of the larger countries this year, the stimulus will be only slightly expansionary in Spain and France.
The expansive fiscal policy will result in an in-crease in the debt ratio as a percentage of the re-spective gross domestic product in all euro area coun-
tries. For the euro area, this ratio probably rose over 100 percent last year (see Table 1.2). Among the five largest economies, the picture remains very heteroge-neous, and the differences are likely to widen further. The Netherlands and Germany, for example, were able to reduce their debt-to-GDP ratios to 49 percent and 60 percent, respectively, in the years before the coro-navirus crisis. This year, these two countries will prob-ably only see an increase to 64 percent and 70 percent respectively. In contrast, the debt-to-GDP ratios in Italy, France and Spain were already well above the Maastricht reference value in 2019, at 135 percent, 98 percent and 96 percent of their respective GDPs. This year, these ratios are expected to increase to 160 percent, 118 percent and 122 percent. However, it is still uncertain when the fiscal rules from the Maas-tricht Treaty and the Fiscal Compact, which are cur-rently suspended due to the coronavirus crisis, will be reinstated or whether the rules will be relaxed.
1.2.2 Monetary Conditions and Financial Markets
Like fiscal policy, monetary policy reacted expan-sionary to the coronavirus crisis in spring last year.
more fatalities did not achieve higher growth.2 Not only was there no trade-off between health and wealth in an absolute sense (Column (2)), but also when controlling for stringency measures, countries with high growth did not pay a price by experiencing a higher number of deaths. 2 The highest (absolute) correlation between the variables on the right is between the number of deaths and the stringency measure and is 0.31. Multicollinearity is not as severe a problem as some might expect.
Or, both unconditional and conditional on the stringency level, a coun-try with more fatalities did not experience higher economic growth. This can be interpreted such that the public health measures did not over-shoot their target. If an-ything, the negative sign still in front of the varia-ble measuring the rela-tive number of fatalities indicates the opposite to have been the case.
Figure 1.17 visualizes these results. It shows so-called leverage plots for the regression shown in Column (5) of Table 1.3. These indicate that Swe-den (SE) is not represent-
ative for this analysis along any dimension. It witnessed exceptionally high growth rates according to the drivers we distinguish. Indeed, as shown by Column (6) in Table 1.3, when removing Sweden from the sample, the overall fit improves substantially, allowing us to explain nearly two-thirds of the variation in cross-country growth, and increasing the significance of all variables in our admit-tedly simple model.
Figure 1.17
2008 2009 ~ 2019 2020-1
0
1
2
3
4
5
6
Federal target rate (Fed, United States) Target policy rate (BoJ, Japan)Deposit rate (ECB, euro area) Bank rate (BoE, United Kingdom)
Source: European Central Bank; Federal Reserve Bank of St. Louis; Bank of England; Bank of Japan; last accessed on 10 January 2021.
Central Bank Interest Rates
%
© CESifo
Figure 1.18
Leverage Plots Reflecting Column (5) of Table 1.3
GDP growth conditional on other factors
Note: The abbreviations used are the ISO 3166 Alpha-2 abbreviations, https://en.wikipedia.org/wiki/ISO_3166-1_alpha-2 (accessed January 27, 2021):
Deaths per 100 thousand persons conditional on other factors
Oxford stringency conditional on other factors Fiscal impuls conditional on other factors
GDP growth in 2020 GDP growth in 2020
GDP growth in 2019 Deaths per 100 thousand persons
GDP growth in 2020 GDP growth in 2020
Oxford stringency Fiscal impuls
DEFR
ITES
NLBE
AT
IE
FI PT
ELSK
LU
SI
LTLV
EECY
SE
PLDK
CZ
ROHUBG
HR
y = 0,4681x
-4
-2
0
2
4
6
-3 -2 -1 0 1 2 3 4
DE
FR ITES
NL
BE
AT
IEFIPT
ELSK
LU
SI
LTLV
EECY
SE
PLDK
CZ
ROHU
BG
HRy = -0,0122x
-4
-2
0
2
4
6
-80 -60 -40 -20 0 20 40 60 80 100
DE
FR
IT
ES
NLBE
AT
IE
FI
PT
EL
SK
LU
SI
LTLV
EE
CY
SE
PLDK
CZ ROHU
BG
HR y = -0,1226x
-6-4-20246
-15 -10 -5 0 5 10 15
DE
FRIT
ES
NLBE
AT
IE
FI
PTEL
SK
LU
SI
LTLV
EECY
SE
PLDK
CZ
ROHU
BG
HR
y = 0,5594x
-6-4-20246
-3 -2 -1 0 1 2 3
Source: Blavatnik School of Government; Eurostat; Reuters; EEAG calculations; last accessed on 10 January 2021. © CESifo

21EEAG Report 2021
CHAPTER 1
Central banks in advanced economies have signifi-cantly increased their purchases of securities as well as lending programs to commercial banks, resulting in a strong expansion of central bank balance sheets (see Figure 1.18). In contrast to the situation during the financial crisis of 2008/2009, however, this time the central banks started from a situation in which monetary policy was already considered extremely expansionary, leaving less leeway. Moreover, at least so far, the coronavirus crisis has not turned into a banking crisis that would have required the central banks to act as lenders of last resort on a similar scale as back then.
The European Central Bank (ECB) has increased the size of its balance sheet in response to the coro-navirus crisis to a similar extent just as it did during the financial crisis. After the pandemic emergency purchase program for the purchase of bonds of pub-lic and private debtors, which was decided in March, was already increased during the summer, the ECB readjusted it again at its December meeting last year. It has been increased by a further 500 billion euros to a total of 1,850 billion euros and will run until at least March 2022. Funds released by maturing bonds will be reinvested until at least the end of 2023. In addition, further longer-term refinancing operations for banks were decided, and the conditions for long-term loans already underway were eased and extended. All of this allowed fiscal policy to become more expansionary while circumventing a sovereign debt crisis.
In contrast to the situation during the financial crisis, this time around, interest rates were already at all-time lows. Throughout the year, the interest rate for the main refinancing operations remained at 0.0 percent, the marginal lending rate at 0.25 percent and the deposit rate at – 0.5 percent (see Figure 1.19).
The US Federal Reserve had set itself a differ-ent starting point before the pandemic hit. Besides a stronger increase in its balance sheet, it allowed for two interest rate cuts totaling 150 basis points in March last year. Furthermore, the Federal Reserve adjusted its monetary policy strategy at the end of August and now has somewhat more leeway in tar-geting inflation. The inflation rate may remain above 2 percent for longer if it had previously been below this level for some time. This means that the US Fed-eral Reserve is likely to keep interest rates low for longer than previously expected. Although the review of the ECB’s monetary policy strategy was expected to be completed by the end of 2020, it remains to be seen whether similar adjustments will be made in the euro area.
Nevertheless, monetary policy is likely to remain very expansionary in the forecast period in Europe as well. In its December decisions, the ECB’s Governing Council reaffirmed its intention to leave key inter-est rates at their current level or to lower them until the inflation outlook moves significantly closer to the price stability target. In addition, the European Cen-
tral Bank has reaffirmed its willingness to expand its monetary policy instruments once again, should this be necessary as a result of the ongoing pandemic. For those companies, households and government that do
50
100
150
200
250
300
350
400
~2008 2009 2019 2020
Federal Reserve Bank of Japan ECB Bank of England
Source: Federal Reserve; Bank of Japan; European Central Bank; Bank of England; last accessed on 10 January 2021; EEAG calculations.
Balance Sheet Sizes of Major Central Banks
Index (2008Q2 = 100)
© CESifo
Index (2019Q4 = 100)
Figure 1.19
-1
0
1
2
3
4
5
2011 2012 2013 2014 2015 2016 2017 2018 2019 2020
United Kingdom United States Euro areaᵃJapan China
ᵃ The synthetic euro area benchmark bond refers to the weighted average yield of the benchmark bond series from each Economic and Monetary Union member.Source: Datastream; last accessed on 10 January 2021.
10-Year Government Bond Yields
%
© CESifo
Figure 1.20
-2
0
2
4
6
8
10
2008 2009 2010 2011 2012 2013 2014 2015 2016 2017 2018 2019 2020
Greece Portugal Ireland Italy Spain Belgium France Austria Finland Netherlands Germany
Source: Datastream; last accessed on 10 January 2021.
Regional Disparties in Government Bond Yields in the Euro AreaDifferences between 10-year national and synthetic euro area benchmark bond yields
%
© CESifo
Figure 1.21

22 EEAG Report 2021
CHAPTER 1
not face other constraints, financing conditions will therefore remain very favorable.
In the euro area, yields for 10-year government bonds with the highest credit rating (AAA) have on average been slowly falling during 2020 (see Fig-ure 1.20). The synthetic euro area benchmark inter-est rate for 10-year government bonds has been in negative territory since August, after first having seen an increase in spring last year. This behavior has con-trasted with that of long-term government bond yields in the United States, China and the United Kingdom. In these three countries, yields on these safe assets fell significantly during the first wave of the pandemic, only to rise again somewhat afterward. This difference can be fully explained by the temporary increase in risk premiums on government bonds in Greece, It-aly, Portugal and Spain, which exceeded the increase in the safe-haven premium on government bonds of triple-A countries like Germany and the Netherlands (see Figure 1.21).
Interest rates for three-month money (EURIBOR) have fallen to an even more negative level after a slight increase in April (see Figure 1.22). Average in-terest rates on new corporate credits rose slightly to 1.8 percent from their temporary low of 1.4 percent in May last year. The same pattern, albeit more pro-nounced, applies to consumer credit rates, which rose to about 5 percent at the end of autumn last year af-ter having witnessed a short trough at 3.6 percent in April. In comparison, the cost of real-estate financing for private households remained relatively stable at 1.4 percent. As usual, the differences across euro area countries remained large.
The outstanding volumes of corporate and con-sumer loans followed opposing trends this year: while corporate loans rose strongly into the summer due to the crisis-related liquidity needs of companies, de-mand for consumer loans slumped during the same period (see Figure 1.23). Since summer, the level of corporate loans has stagnated just as it has for con-sumer loans. In comparison, real estate loan portfo-
-1
0
1
2
3
4
5
6
7
8
9
2008 2010 2012 2014 2016 2018 2020
Consumer credit rateMortgage rateCorporate credit rateEuribor
ᵃ New loans to households and non-financial corporates up to one million euros using floating rates or up to 1 year initial rate fixation. The Euribor rate is based on secured interbank loans with a maturity of one year.Source: European Central Bank; last accessed on 10 January 2021.
Interest Rates on Loans in the Euro Areaᵃ
%
Consumer and business rates
© CESifo
-1
0
1
2
3
4
5
6
7
8
9
2008 2010 2012 2014 2016 2018 2020
France Germany Greece Ireland Italy Portugal Spain Euribor
Business rates in selected countries
%
Figure 1.22
-2
0
2
4
6
8
95
100
105
110
115
120
2008 2009 2010 2011 2012 2013 2014 2015 2016 2017 2018 2019 2020
Total credit growth Consumer creditMortages Corporate credit
ᵃ These indexes of adjusted outstanding amounts are calculated according to It = It-1(1+Ft/Lt-1), where L stands for theoutstanding nominal amount of credit and F the amount of transactions (credit granted). The transactions F arecalculated from differences in outstanding amounts adjusted for reclassifications, other revaluations, exchange ratevariations and other changes which do not arise from transactions (see European Central Bank, 2010, for details).A specific securitisation operation in France has led to a downward level shift in mortgages in May 2014.Source: European Central Bank; last accessed on 10 January 2021.
Credit Developments in the Euro Areaª
Index (2010 = 100)
© CESifo
Change over previous year's month in %
Figure 1.23
50
60
70
80
90
100
110
120
~2008 2009 2010 2019 2020
DJ Industrial Average FTSE 100 Shanghai SE Composite Euro STOXX 50 Nikkei 225
Source: Datastream; last accessed on 10 January 2021.
Developments in International Stock Markets from a Euro Area Perspectiveᵃ
Index (2008Q2 = 100)
© CESifo ᵃ Stock market indices outside the euro area are first converted into euros.
Index (2019Q4 = 100)
Figure 1.24

23EEAG Report 2021
CHAPTER 1
lios have remained on a relatively steady growth path throughout last year.
The extensive monetary and fiscal policy meas-ures have led to a strong improvement in financing conditions in advanced economies and many emerg-ing markets since last spring. As a result, equity mar-kets have regained much of the ground they lost be-tween March and April, when stock markets around the world crashed (see Figure 1.24). Key equity indi-ces, particularly for Asian markets, are now well above their pre-crisis levels. For example, the Nikkei 225 and the Shanghai Stock Exchange Composite were up about 13 and 12 percent, respectively, in euro terms in December last year. In contrast, from a euro area perspective, the FTSE 100 and the Euro STOXX 50 lost around 20 and 5 percent respectively in 2020. Given the relatively stable development of the euro in the past year, despite the extent of the crisis, the stock market returns calculated in local currency are also quite similar to those calculated in euros. The biggest exception was the United States, where the return of the Dow Jones Industrial Average in local currency was around 7 percent, while in euros, it declined by 1 percent. This reflects the depreciation of the dol-lar by about 8 percent. In the case of the FTSE 100, the more than 5 percent depreciation of the British pound made its return look worse from a euro area perspective than from a UK perspective.
Although nowhere near as heterogeneous as dur-ing the financial crisis, stock market returns among euro area member states were still quite divergent last year. While the German FAZ index essentially stag-nated in a year-end comparison, the year-end rallies failed to bring the leading indices in Spain, France and Italy back to their pre-crisis levels. Spain’s IBEX 35 was by the end of 2020 still more than 15 percent below its level at the beginning of the year. In sharp contrast, neighboring Portugal saw its PSI rise by 9 percent in such a year-end comparison.
As compared to other crises situations, the cur-rencies of the major economies remained largely sta-ble in 2020. The one with the overall largest, albeit historically still small, movement was the euro. In real effective terms, it appreciated by less than 4 percent over the course of the year (see Figure 1.26). This general appreciation has also been reflected in the euro-dollar exchange rate. After being undervalued against the US dollar for five years in a row, at the end of 2020 the euro is approaching a more neutral range from a purchasing power parity perspective. Of these major currencies, the British pound, on the other hand, depreciated in real effective terms by somewhat more than 2 percent throughout 2020. The United Kingdom is both more affected by the Covid-19 virus and from having to face the economic conse-quences of Brexit.
30
40
50
60
70
80
90
100
110
120
~2008 2009 2010 2019 2020
CAC 40 (France) FAZ (Germany) MIB (Italy) IBEX 35 (Spain) Athex (Greece) PSI (Portugal) ISEQ (Ireland)
Source: Datastream; last accessed on 10 January 2021.
Developments of Selected Stock Markets within the Euro Area
Index (2008Q2 = 100)
© CESifo
Index (2019Q4 = 100)
Figure 1.25
80
90
100
110
120
130
~2008 2009 2010 2019 2020
Euro area United States United KingdomJapan China
Source: Bank for International Settlements; last accessed on 10 January 2021.
Real Effective Exchange Rates around the World
© CESifo
Index (2008Q2 = 100) Index (2019Q4 = 100)
Figure 1.26
0.80
1.00
1.20
1.40
1.60
1.80
99 00 01 02 03 04 05 06 07 08 09 10 11 12 13 14 15 16 17 18 19 20 21
Upper bound PPP Purchasing Power ParityLower bound PPP Exchange rate
ᵃ The nominal exchange rate is based on monthly data, while the exchange rate based on purchasing power parity (PPP) is given ata quarterly frequency. The US dollar-euro PPP rate is calculated as the GDP-weighted average of the euro country-specific PPP estimates vis-à-vis the US dollar. The PPP upper bound represents the 90th percentile of the euro country-specific PPP estimatesvis-à-vis the US dollar; the lower bound the 10th percentile. In calculating these bounds the 11 euro area member countries withthe largest GDP weights are used.Source: OECD, OECD Economic Outlook; European Central Bank; last accessed on 10 January 2021.
Exchange Rate of the Euro against the US Dollar and PPPª
US dollars per euro
© CESifo
Figure 1.27

24 EEAG Report 2021
CHAPTER 1
1.3 MACROECONOMIC OUTLOOK2
1.3.1 Assumptions, Risks and Uncertainties
This forecast assumes that the price of a barrel of Brent crude oil will average around USD 50 this year (after on average USD 41.5 last year). It also assumes that the euro will trade around USD 1.20 this year.
The pandemic situation is expected to improve only slowly as we approach spring. Although the cur-rent wave will level off in the coming months, restric-tions will continue to be necessary—at least locally and will be strict in some cases. For instance, in the United States, increased containment measures are likely to be implemented during the first quarter. After that, the effects of mass vaccination, together with warmer weather conditions in the northern hemi-sphere, will allow a more rapid normalization. By sum-mer, it is assumed that a large part of the measures in Europe and the United States will be eased and that social behavior will also have partially normalized. The further course of the pandemic and the associ-ated infection control measures are currently the most critical assumptions for economic forecasts, since it is associated with great uncertainty.
The downside risk to the forecast presented is that new infections, in part due to the spreading of new faster-moving variations of the virus, cannot be sufficiently controlled and might even further increase the intensity of the pandemic in many countries. This would lead to even more widespread lockdowns of economies. There may also be unexpected (further) supply shortages and distribution problems of the new Covid-19 vaccines reducing the pace by which herd immunity is reached. In addition, it is possible that the population’s willingness to be vaccinated is too low to achieve herd immunity. However, there are also arguments in favor of upside risks to our forecast. For example, new infections could decline more rap-idly than assumed, or vaccination campaigns could be more successful and be rolled out faster, so that infection control measures can be scaled back more quickly than assumed.
The further course of trade relations—especially between the United States and China, but also be-tween the United States and Europe—is still uncertain. It is true that the change of presidency in the United States probably means a de-escalation of the trade conflicts and thus tends to be an upside risk. How-ever, statements by the new US president show that a quick and complete lifting of all trade restrictions is not to be expected.
China’s financial stability is subject to signif-icant risks, and not only since the outbreak of the pandemic. The non-financial sector, which was al-ready highly indebted before the crisis, has become even more indebted in the wake of the pandemic (see 2 The forecasts presented are updates of Wollmershäuser et al. (2019) and Abberger et al. (2019).
Organization for Economic Co-operation and Devel-opment 2020). If the number of insolvencies in China were to increase, this would make a reassessment of risks more likely and could lead to sudden sales of certain financial assets on a larger scale.
In recent years, the debt of non-financial corpo-rations has also increased significantly in many ad-vanced economies, primarily through the issuance of bonds (see Organization for Economic Co-operation and Development 2019). An ever-increasing propor-tion of these bonds are just rated investment grade (see Çelik and Isaksson 2019). The longer the corona pandemic weighs on economic activity, the more likely it will be that these bonds are downgraded to non-investment grade. Institutional investors would have to dump them due to regulatory requirements, which could lead to price declines in bond markets and possibly revaluations of other asset classes.
In addition to the above, the significant increase in government debt poses a risk for some euro coun-tries. Due to the fiscal stabilization measures, all countries had to massively increase their new debt. Countries that already had high debt ratios before the coronavirus crisis run the risk of losing the confidence of financial markets. If risk premiums on government debt increase, this could again endanger the stability of government finances and the banking system, as it did during the euro area crisis in 2011/2012. Currently, however, the ECB is actively countering this with its bond-buying programs.
Overall, the downside risks to the projected global and European economic development clearly dominate the upside risks.
Finally, what has to be realized is that there is not only uncertainty in society and economy regard-ing both the current situation and the outlook, but that this also holds regarding the data as we meas-ure it in the System of National Account or regarding price statistics. During the lockdown many data un-derlying the statistics we use at least temporarily lost quality. When over time more and more information about the crisis is revealed, it is also quite likely that current statistics we have regarding the year 2020 will be revised accordingly. Furthermore, the lock-down placed statistical agencies for difficult choices. How do we treat prices of airplane tickets when they are no longer sold, but nevertheless part of the bas-ket underlying consumer price indices? How do we treat the value added of schoolteachers, or university professors who are still paid even when schools and universities are closed? Given the uniqueness of this crisis, how to deal with these and other questions has not been ex ante specified in the manuals underly-ing macroeconomic statistics. It is therefore quite likely that not all statistical agencies in Europe, let alone the world, have made similar decisions. While we must always be careful when comparing statistics across countries (and over time), this general warning is likely to be even more relevant for data collected

25EEAG Report 2021
CHAPTER 1
and constructed during crisis times as witnessed in the recent past.
1.3.2 Global Economy
Economic development is likely to be very subdued in many countries in the winter of 2020/21 and of-ten even decline again. A second wave of corona-virus infections started up again in the summer in several countries, such as Spain, France, the United States and Brazil. This wave then spread to other countries such as Italy, Germany, the United King-dom and Eastern Europe at the end of autumn. Eu-ropean governments initially resorted to targeted local restrictions on certain regions or activities. However, these measures were not enough to slow the pandemic. The continued rise in intensive care bed occupancy forced many governments to impose nationwide and more stringent measures such as closing catering establishments and places of ac-commodation. Movements of people in the retail and leisure sectors identified from mobile phone data in-dicate a decline in economic activity in the affected countries, especially in Europe, since September, albeit less than during the spring.
Of the larger advanced economies, the United States is one of the countries with the highest in-fection rates. Although infection control measures vary quite a bit from state to state, overall, they are less stringent than in Europe. This has so far only slightly restricted mobility there, so real activity is likely to be less affected than in Europe. However, the relatively high unemployment and the long absence of further fiscal measures are likely to slow overall economic production in the United States during the second half of the year. Also, because many restric-tions remained in place in Asian countries, most of them were spared another severe outbreak of coro-navirus in the autumn.
Overall, the pandemic is likely to have had a much smaller negative impact on economic activity in the second half 2020 than in spring 2020. At that time, large-scale plants were temporarily shuttered in many manufacturing sectors. The assessments of companies and households in the manufacturing sec-tor have, as the Global Barometers show, only dete-riorated slightly in recent months compared to the contractions in April (see Figure 1.28).
As mentioned in Section 1.4.1, this forecast as-sumes that infection control measures and the cur-rent limited mobility will broadly remain in place until the end of the first quarter. Thereafter, the in-creasing number of vaccinations against Covid-19 will contribute to normalization. As a result, economic activity in Europe and the United States should in-crease quite sharply during the second quarter of 2021, after which, growth will somewhat weaken again. Asia has a better overall grip on stemming the spread of the virus. Therefore, developing real
activity in this region should be less affected, so that economic growth is spread more evenly over the entire year. While last year the strongest negative
40
50
60
70
80
90
100
110
120
130
140
150
2007 2008 2009 2010 ~ 2018 2019 2020 2021-5
-4
-3
-2
-1
0
1
2
3
4
5
6
Real GDP growthᵇ
Balances
ᵃ Both barometers have an in-sample average of 100 and a standard deviation of 10.ᵇ Countries are weighted according to previous year's nominal GDP in US dollars and market exchange rates.Source: National statistical offices; KOF/FGV; EEAG calculations; last accessed on 10 January 2021; GDP 2020 and 2021: EEAG forecast.
World Economic Growth and the Global Economic Barometers
Coincident global economic barometerᵃLeading global economic barometerᵃ
%
Forecastperiod
© CESifo
Figure 1.28
-6
-4
-2
0
2
4
6
2008 2009 2010 2011 2012 2013 2014 2015 2016 2017 2018 2019 2020 2021
Latin America and Russia Asia North America Western and Central Europe World GDP growth
Forecastperiod
Regional Contributions to World GDP Growtha
ᵃ Based on market weights.Source: National statistical offices; EEAG calculations and forecast.
%
© CESifo
Figure 1.29
88
90
92
94
96
98
100
102
104
2008Q22019Q4
+1 +2 +3 +4 +5 +6 +7 +8
Industrialised countries – great financial crisisIndustrialised countries – coronavirus crisisOverall world – great financial crisisOverall world – coronavirus crisis
Source: IMF; EEAG calculations.
Comparing GDP Developments for the Advanced Economies and the WorldFrom quarter before the crisis to 8 quarters after the crisis
© CESifo
Quarters
Index
Figure 1.30
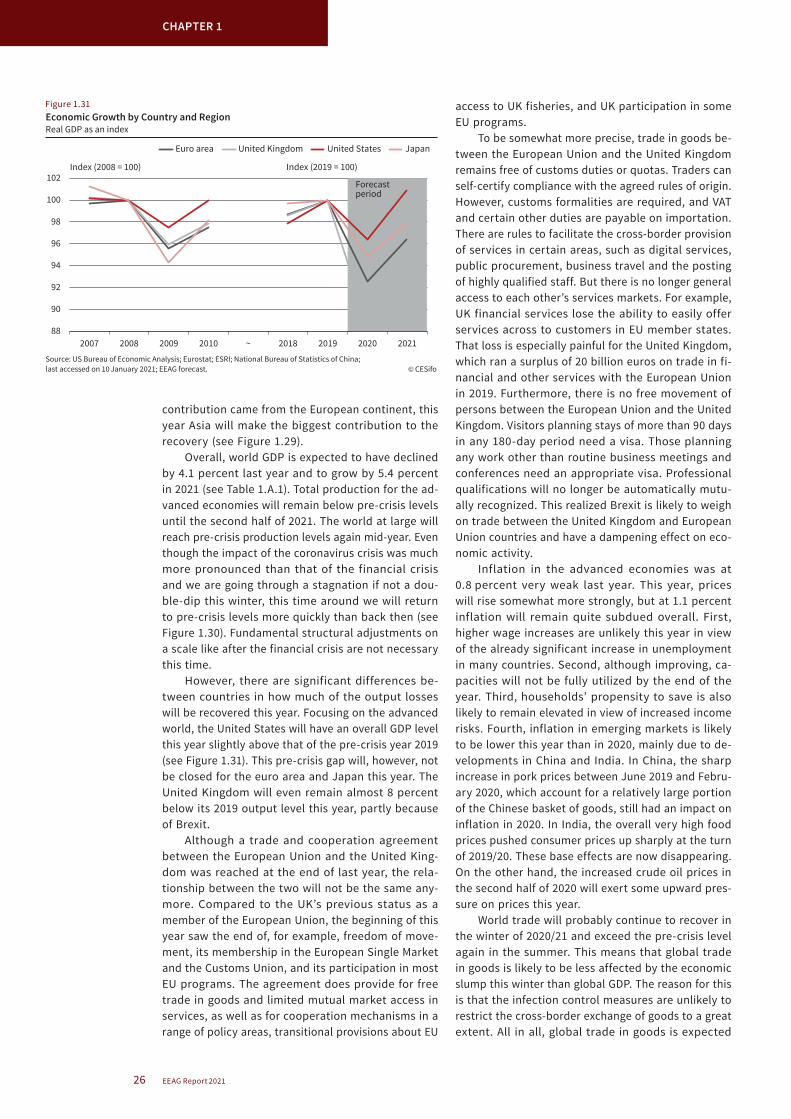
26 EEAG Report 2021
CHAPTER 1
contribution came from the European continent, this year Asia will make the biggest contribution to the recovery (see Figure 1.29).
Overall, world GDP is expected to have declined by 4.1 percent last year and to grow by 5.4 percent in 2021 (see Table 1.A.1). Total production for the ad-vanced economies will remain below pre-crisis levels until the second half of 2021. The world at large will reach pre-crisis production levels again mid-year. Even though the impact of the coronavirus crisis was much more pronounced than that of the financial crisis and we are going through a stagnation if not a dou-ble-dip this winter, this time around we will return to pre-crisis levels more quickly than back then (see Figure 1.30). Fundamental structural adjustments on a scale like after the financial crisis are not necessary this time.
However, there are significant differences be-tween countries in how much of the output losses will be recovered this year. Focusing on the advanced world, the United States will have an overall GDP level this year slightly above that of the pre-crisis year 2019 (see Figure 1.31). This pre-crisis gap will, however, not be closed for the euro area and Japan this year. The United Kingdom will even remain almost 8 percent below its 2019 output level this year, partly because of Brexit.
Although a trade and cooperation agreement between the European Union and the United King-dom was reached at the end of last year, the rela-tionship between the two will not be the same any- more. Compared to the UK’s previous status as a member of the European Union, the beginning of this year saw the end of, for example, freedom of move-ment, its membership in the European Single Market and the Customs Union, and its participation in most EU programs. The agreement does provide for free trade in goods and limited mutual market access in services, as well as for cooperation mechanisms in a range of policy areas, transitional provisions about EU
access to UK fisheries, and UK participation in some EU programs.
To be somewhat more precise, trade in goods be-tween the European Union and the United Kingdom remains free of customs duties or quotas. Traders can self-certify compliance with the agreed rules of origin. However, customs formalities are required, and VAT and certain other duties are payable on importation. There are rules to facilitate the cross-border provision of services in certain areas, such as digital services, public procurement, business travel and the posting of highly qualified staff. But there is no longer general access to each other’s services markets. For example, UK financial services lose the ability to easily offer services across to customers in EU member states. That loss is especially painful for the United Kingdom, which ran a surplus of 20 billion euros on trade in fi-nancial and other services with the European Union in 2019. Furthermore, there is no free movement of persons between the European Union and the United Kingdom. Visitors planning stays of more than 90 days in any 180-day period need a visa. Those planning any work other than routine business meetings and conferences need an appropriate visa. Professional qualifications will no longer be automatically mutu-ally recognized. This realized Brexit is likely to weigh on trade between the United Kingdom and European Union countries and have a dampening effect on eco-nomic activity.
Inflation in the advanced economies was at 0.8 percent very weak last year. This year, prices will rise somewhat more strongly, but at 1.1 percent inflation will remain quite subdued overall. First, higher wage increases are unlikely this year in view of the already significant increase in unemployment in many countries. Second, although improving, ca-pacities will not be fully utilized by the end of the year. Third, households’ propensity to save is also likely to remain elevated in view of increased income risks. Fourth, inflation in emerging markets is likely to be lower this year than in 2020, mainly due to de-velopments in China and India. In China, the sharp increase in pork prices between June 2019 and Febru-ary 2020, which account for a relatively large portion of the Chinese basket of goods, still had an impact on inflation in 2020. In India, the overall very high food prices pushed consumer prices up sharply at the turn of 2019/20. These base effects are now disappearing. On the other hand, the increased crude oil prices in the second half of 2020 will exert some upward pres-sure on prices this year.
World trade will probably continue to recover in the winter of 2020/21 and exceed the pre-crisis level again in the summer. This means that global trade in goods is likely to be less affected by the economic slump this winter than global GDP. The reason for this is that the infection control measures are unlikely to restrict the cross-border exchange of goods to a great extent. All in all, global trade in goods is expected
88
90
92
94
96
98
100
102
2007 2008 2009 2010 ~ 2018 2019 2020 2021
Euro area United Kingdom United States Japan
Source: US Bureau of Economic Analysis; Eurostat; ESRI; National Bureau of Statistics of China; last accessed on 10 January 2021; EEAG forecast.
Economic Growth by Country and RegionReal GDP as an index
Index (2008 = 100)
© CESifo
Index (2019 = 100)
Forecast period
Figure 1.31
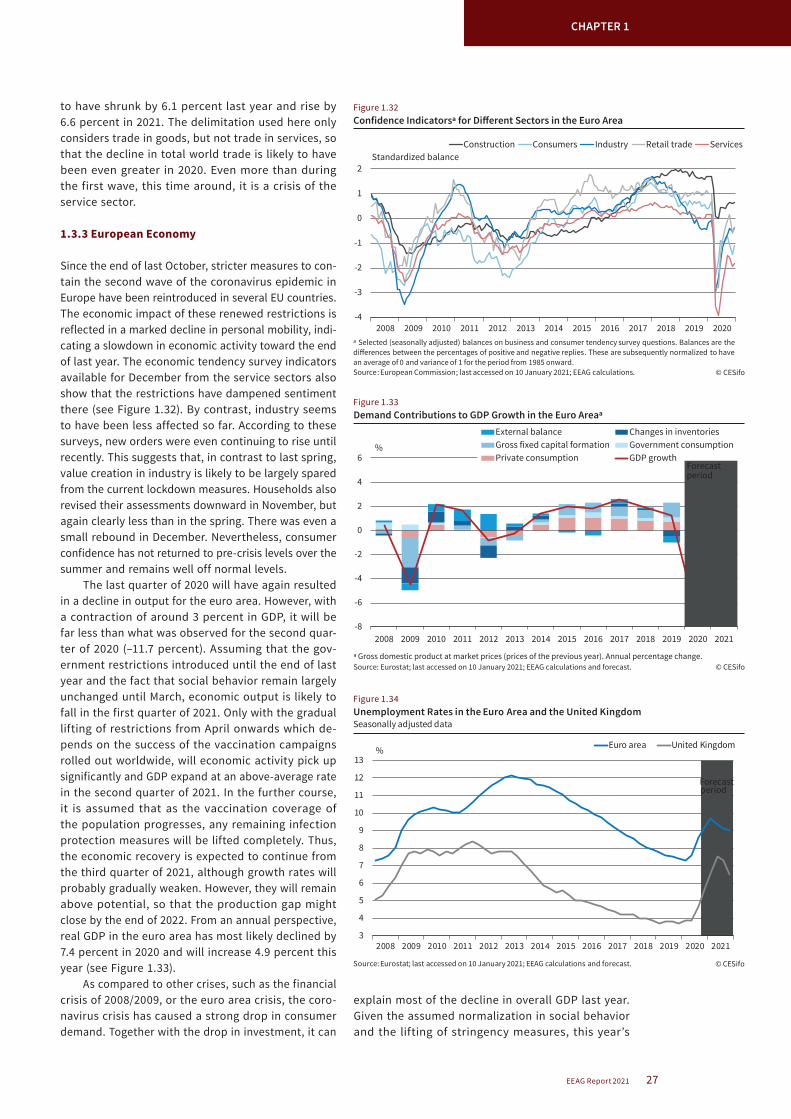
27EEAG Report 2021
CHAPTER 1
to have shrunk by 6.1 percent last year and rise by 6.6 percent in 2021. The delimitation used here only considers trade in goods, but not trade in services, so that the decline in total world trade is likely to have been even greater in 2020. Even more than during the first wave, this time around, it is a crisis of the service sector.
1.3.3 European Economy
Since the end of last October, stricter measures to con-tain the second wave of the coronavirus epidemic in Europe have been reintroduced in several EU countries. The economic impact of these renewed restrictions is reflected in a marked decline in personal mobility, indi-cating a slowdown in economic activity toward the end of last year. The economic tendency survey indicators available for December from the service sectors also show that the restrictions have dampened sentiment there (see Figure 1.32). By contrast, industry seems to have been less affected so far. According to these surveys, new orders were even continuing to rise until recently. This suggests that, in contrast to last spring, value creation in industry is likely to be largely spared from the current lockdown measures. Households also revised their assessments downward in November, but again clearly less than in the spring. There was even a small rebound in December. Nevertheless, consumer confidence has not returned to pre-crisis levels over the summer and remains well off normal levels.
The last quarter of 2020 will have again resulted in a decline in output for the euro area. However, with a contraction of around 3 percent in GDP, it will be far less than what was observed for the second quar-ter of 2020 (–11.7 percent). Assuming that the gov-ernment restrictions introduced until the end of last year and the fact that social behavior remain largely unchanged until March, economic output is likely to fall in the first quarter of 2021. Only with the gradual lifting of restrictions from April onwards which de-pends on the success of the vaccination campaigns rolled out worldwide, will economic activity pick up significantly and GDP expand at an above-average rate in the second quarter of 2021. In the further course, it is assumed that as the vaccination coverage of the population progresses, any remaining infection protection measures will be lifted completely. Thus, the economic recovery is expected to continue from the third quarter of 2021, although growth rates will probably gradually weaken. However, they will remain above potential, so that the production gap might close by the end of 2022. From an annual perspective, real GDP in the euro area has most likely declined by 7.4 percent in 2020 and will increase 4.9 percent this year (see Figure 1.33).
As compared to other crises, such as the financial crisis of 2008/2009, or the euro area crisis, the coro-navirus crisis has caused a strong drop in consumer demand. Together with the drop in investment, it can
explain most of the decline in overall GDP last year. Given the assumed normalization in social behavior and the lifting of stringency measures, this year’s
-4
-3
-2
-1
0
1
2
2008 2009 2010 2011 2012 2013 2014 2015 2016 2017 2018 2019 2020
Construction Consumers Industry Retail trade Services
ᵃ Selected (seasonally adjusted) balances on business and consumer tendency survey questions. Balances are thedifferences between the percentages of positive and negative replies. These are subsequently normalized to havean average of 0 and variance of 1 for the period from 1985 onward.Source: European Commission; last accessed on 10 January 2021; EEAG calculations.
Confidence Indicatorsª for Different Sectors in the Euro Area
Standardized balance
© CESifo
Figure 1.32
2008 2009 2010 2011 2012 2013 2014 2015 2016 2017 2018 2019 2020 2021-8
-6
-4
-2
0
2
4
6
External balance Changes in inventoriesGross fixed capital formation Government consumptionPrivate consumption GDP growth
Forecastperiod
Demand Contributions to GDP Growth in the Euro Areaᵃ
Source: Eurostat; last accessed on 10 January 2021; EEAG calculations and forecast.
%
ᵃ Gross domestic product at market prices (prices of the previous year). Annual percentage change.© CESifo
Figure 1.33
3
4
5
6
7
8
9
10
11
12
13
2008 2009 2010 2011 2012 2013 2014 2015 2016 2017 2018 2019 2020 2021
Euro area United Kingdom
Source: Eurostat; last accessed on 10 January 2021; EEAG calculations and forecast.
Unemployment Rates in the Euro Area and the United Kingdom Seasonally adjusted data
%
© CESifo
Forecast period
Figure 1.34

28 EEAG Report 2021
CHAPTER 1
rebound in consumption will also be the main driver of overall growth. The stimulus measures that are already in place and that are planned for the future, including the Next Generation EU (NGEU) program, will also provide an unprecedented fiscal boost to the European economy, just based on their sheer size alone.
The unemployment rate is likely to have averaged 8.0 percent last year, only slightly higher than in 2019 (7.6 percent). This overlooks the strong dynamics in both 2019 and last year. The sustained decline in 2019 was abruptly reversed into a steep increase in 2020 caused by the pandemic (see Figure 1.34). This upward trend will not be broken until GDP picks up sustain-ably. Spare capacities, as also reflected in the high number of short-time workers, will slow the recovery
of the labor market. For this reason, unemployment is expected to rise to an average of 9.3 percent in the euro area this year.
Looking at the euro area labor market from the employment side, nearly 2 percent of all jobs were lost last year (see Figure 1.35). Some of these will reappear next year when restrictions are lifted. However, this will not be the case for all of them. Structural changes that received a boost during the crisis will most likely imply that structural unemployment will also remain higher for a while.
Although all countries were affected by the coronavirus pandemic, the intensity of the collapse in economic activity across Europe varied quite sig-nificantly. While Spain and the United Kingdom were the hardest hit, according to official statistics and forecasts for the last quarter of 2020, losing more than 11 percent of GDP over 2020 as a whole com-pared to 2019, Poland, Ireland, Sweden and Lithuania recorded declines of around 3, or even only 2 per-cent (see Figure 1.36). The decline in 2020 largely ex-plains the recovery in 2021. Of all countries, the GDP growth rate this year will be highest in Spain, and the United Kingdom will also record a high growth rate, although both will remain well below pre-crisis output levels. About 50 percent of the variation in projected growth rates for 2021 can be explained solely by the growth collapse in 2020. Another important deter-minant is the degree to which countries are affected by the second wave of the coronavirus pandemic.
-12
-10
-8
-6
-4
-2
0
2
4
6
98
99
100
101
102
103
104
105
106
107
2008 2009 2010 2011 2012 2013 2014 2015 2016 2017 2018 2019 2020 2021
Annualized quarterly growth
Source: Eurostat; last accessed on 10 January 2021; EEAG calculations and forecast.
Employment in the Euro AreaSeasonally and work-day adjusted data
%Index (2015 = 100)
1.4
-0.4-0.5
0.70.9
1.6 -1.9
1.6
1.2
Forecast period
LevelAnnual growth
0.2
© CESifo
-0.6
-0.5
-1.9
0.9
Figure 1.35
-2 0 2 4 6
GreeceItaly
PortugalFinland
SpainCyprusCroatia
Euro areaFrance
NetherlandsBelgium
AustriaGermany
United KingdomSlovenia
DenmarkSwedenCzechiaBulgariaSlovakia
LuxemburgHungary
LatviaPoland
LithuaniaEstonia
RomaniaMalta
Ireland
© CESifoSource: Eurostat; European Commission; last accessed on 10 January 2021. The United Kingdom is shown in lighter blue.
Economic Growth in EU Member Countries and the United Kingdom
%
Average real GDP growth, 2011–2019
0 2 4 6 8
NetherlandsIrelandFinlandSweden
LithuaniaBulgaria
AustriaGreece
DenmarkLuxemburg
EstoniaPoland
RomaniaMalta
LatviaGermany
CyprusCzechiaPortugalBelgium
United KingdomSlovakiaSlovenia
Euro areaItaly
CroatiaHungary
FranceSpain
Real GDP growth, 2021
-12 -10 -8 -6 -4 -2 0
SpainUnited Kingdom
GreeceCroatia
ItalyFrance
PortugalAustria
MaltaSloveniaBelgium
Euro areaCzechia
CyprusSlovakiaHungary
GermanyRomania
EstoniaBulgaria
NetherlandsLuxemburg
LatviaDenmark
FinlandPolandIreland
SwedenLithuania
Real GDP growth, 2020
Figure 1.36

29EEAG Report 2021
CHAPTER 1
REFERENCES
Abberger, K., Y. Abrahamsen, M. Anderes, F. Eckert, A. K. Funk, M. l. Graff, F. Hälg, P. Kronenberg, H. Mikosch, N. Mühlebach, S. Neuwirth, A. Rathke, S. Sarferaz, P. Seiler, M. Siegenthaler, S. Streicher, A. Stücker and J.-E. Sturm (2020), “Konjunkturanalyse: Prognose 2021/2022. Zweite Welle lastet auf dem Arbeitsmarkt”, KOF Analysen, 2019:4, 1–28, Zurich: KOF Swiss Economic Institute, ETH Zu-rich, https://doi.org/10.3929/ethz-b-000458775.
Abberger, K., R. Marotta Bastos Vieira, A. Campelo Jr., M. Graff, A. C. Lemos Gouveia, O. Müller and J.-E. Sturm (2020), “The Global Economic Barometers: Composite Indicators for the World Economy”, KOF Working Papers 471, February 2020, https://doi.org/10.3929/ethz-b-000401651.
Baker, S. R., N. Bloom, S. J. Davis (2016), “Measuring Economic Policy Uncertainty”, The Quarterly Journal of Economics, 131(4), 1593–1636, https://doi.org/10.1093/qje/qjw024.
Bank of England (2020), Monetary Policy Report, November 5, 2020.
Bureau of Labor Statistics (2020), “Effects of COVID-19 Pandemic and Response on the Consumer Price Index”, BLS Information, June 10, https://www.bls.gov/covid19/effects-of-covid-19-pandemic-on-consumer-price-index.htm (accessed December 29, 2020).
Cavallo, A (2020), “Inflation with Covid Consumption Baskets”, NBER Working Paper Nr. 27352.
Çelik, S. and M. Isaksson (2019), “Corporate Bond Markets in a Time of Unconventional Monetary Policy”, OECD Capital Market Series, OECD Publishing, Paris.
European Central Bank (2010), “Euro Area Statistics, Technical Notes,” Monthly Bulletin, December.
Eurostat (2020), “Guidance on the Compilation of the HICP in the Con-text of the COVID-19 Crisis”, Methodological Note, Directorate C, Unit C4, April 3, 2020.
APPENDIX 1.A
Table 1.A1
GDP Growth, Inflation and Unemployment in Various Countries
Share oftotal GDPin %
GDP growth CPI inflation Unemployment rateᵉ
in % in %
2019 2020 2021 2019 2020 2021 2019 2020 2021
Industrialized countries:
United States 28.1 2.2 – 3.6 4.7 1.8 1.2 1.4 3.7 8.1 6.8
EU27 20.5 1.6 – 7.0 4.0 1.4 0.6 1.1 6.5 7.3 8.3
Euro area 17.5 1.3 – 7.4 4.1 1.2 0.3 0.9 7.6 8.2 9.3
Japan 6.7 0.3 – 5.2 3.2 2.0 0.1 0.3 2.4 2.8 2.9
United Kingdom 3.7 1.3 – 11.3 4.0 1.8 0.9 1.4 3.8 4.5 7.0
Canada 2.3 1.9 – 5.7 4.0 2.0 0.7 0.9 5.7 9.6 8.3
Switzerland 0.9 1.1 – 3.5 2.5 0.4 – 0.7 0.1 4.4 4.9 5.3
Norway 0.5 0.9 – 1.5 3.0 2.2 1.4 2.0 3.7 4.5 5.0
Industrialized countries (total) 62.6 1.6 – 4.7 4.0 1.6 0.8 1.1 4.8 6.8 6.9
Newly industrialized countries:
China 18.9 6.1 1.9 9.7 2.9 2.7 2.2 . . .
East Asiaᵃ 7.1 2.9 – 3.5 4.1 1.3 0.6 1.5 . . .
Latin Americaᵇ 5.4 0.5 – 7.8 2.9 8.9 7.6 6.8 . . .
India 3.8 4.2 – 8.2 10.7 3.7 6.7 4.4 . . .
Russia 2.2 1.3 – 3.1 1.8 3.0 3.5 4.0 . . .
Newly industrialized countries (total) 37.4 4.2 – 1.8 7.3 3.6 3.5 3.1 . . .
Totalᶜ 100.0 2.6 – 4.1 5.4 2.4 1.8 1.9 . . .
World trade growth in %ᵈ – 0.5 – 6.1 6.0 . . .
ᵃ Weighted average of Indonesia, Korea, Malaysia, Tawain, Thailand, Philippines, Singapore, and Hong Kong. Weighted with the 2018 levels of GDP in US dollars. ᵇ Weighted average of Brazil, Mexico, Argentina, Colombia, and Chile. Weighted with the 2018 level of GDP in US dollars; ᶜ Weighted average of the listed groups of countries. ᵈ Trade of goods. ᵉ Standardized unemployment rate.
Source: EU; OECD; IMF; ILO; National Statistical Offices; CPB; 2020 and 2021: EEAG forecast.
International Monetary Fund (2020), World Economic Outlook: A Long and Difficult Ascent, Washington, D.C., October.
Nebehay, S. und M. Shields (2020), “Europe, North American should learn from Asia on COVID-19 – WHO expert”, press release 20 October, available under https://www.reuters.com/article/us-health-corona-virus-who/europe-north-america-should-learn-from-asia-on-covid-19-who-ex-pert-idUSKBN27425E (accessed December 29, 2020).
Organisation for Economic Co-operation and Development (2019), “OECD Economic Outlook”, 105, 2019/1, May.
Organisation for Economic Co-operation and Development (2020), “OECD Economic Outlook”, 108, 2020/2, December.
Reinsdorf, M. (2020), “COVID-19 and the CPI: Is Inflation Underesti-mated?”, IMF Working Paper WP/20/224.
Wollmershäuser, T., M. Göttert, C. Grimme, S. Lautenbacher, R. Lehmann, S. Link, M. Menkhoff, S. Möhrle, A.-C. Rathje, M. Reif, P. Sandqvist, R. Šauer, M. Stöckli and A. Wolf (2020), “ifo Konjunktur-prognose Winter 2020: Das Coronavirus schlägt zurück – erneuter Shut-down bremst Konjunktur ein zweites Mal aus”, ifo Schnelldienst, ifo Institute – Leibniz Institute for Economic Research at the University of Munich, 73, Sonderausgabe, December 2020.

30 EEAG Report 2021
CHAPTER 1
Table 1.A2
GDP Growth, Inflation and Unemployment in the EU CountriesShare of
total GDPin %
GDP growthᵃ Inflationᵇ Unemployment rateᶜ
in %
2019 2020 2021 2019 2020 2021 2019 2020 2021
Germany 24.7 0.6 – 5.4 3.4 1.4 0.5 1.9 3.2 3.9 3.9
France 17.4 1.5 – 9.0 5.8 1.3 0.6 0.6 8.5 8.4 10.4
Italy 12.8 0.3 – 9.0 4.3 0.6 – 0.1 0.3 9.9 9.5 11.1
Spain 8.9 2.0 – 11.4 6.5 0.8 – 0.4 0.3 14.1 15.8 17.7
Netherlands 5.8 1.6 – 4.6 1.6 2.7 1.0 0.9 3.4 4.2 6.2
Belgium 3.4 1.7 – 7.5 4.0 1.2 0.5 0.7 5.4 5.8 8.0
Austria 2.8 1.4 – 8.0 2.7 1.5 1.2 1.3 4.5 5.7 5.7
Ireland 2.5 5.9 – 3.2 1.9 0.9 – 0.4 0.5 5.0 5.4 8.0
Finland 1.7 1.1 – 4.0 1.9 1.1 0.5 1.1 6.7 8.1 8.4
Portugal 1.5 2.3 – 8.4 3.8 0.3 – 0.2 0.0 6.5 7.4 9.6
Greece 1.3 1.6 – 10.1 2.7 0.5 – 1.2 – 0.1 17.3 17.0 17.9
Slovakia 0.7 2.3 – 6.3 4.1 2.8 1.9 1.0 5.8 6.9 7.5
Luxemburg 0.5 2.3 – 4.4 2.9 1.6 0.1 0.9 5.6 6.6 7.1
Lithuania 0.3 4.3 – 2.0 2.4 2.2 1.2 1.5 6.3 8.9 8.2
Slovenia 0.3 3.2 – 7.5 4.1 1.7 0.1 1.6 4.5 5.6 5.7
Latvia 0.2 2.1 – 4.3 3.4 2.7 0.1 0.5 6.3 8.5 8.9
Estonia 0.2 4.7 – 4.7 3.0 2.3 – 0.7 1.2 4.5 7.0 7.7
Cyprus 0.2 3.1 – 6.3 3.5 0.5 – 0.8 1.0 7.1 8.2 7.5
Malta 0.1 5.4 – 7.6 3.3 1.5 0.8 1.1 3.4 4.8 4.5
Euro areaᵈ 85.5 1.3 – 7.4 4.1 1.2 0.3 0.9 7.6 8.2 9.3
Poland 3.8 4.6 – 3.4 3.0 2.1 3.6 2.0 3.3 3.9 5.4
Sweden 3.4 1.4 – 3.0 2.4 1.7 0.4 0.8 6.8 8.7 9.2
Denmark 2.2 2.9 – 4.0 2.8 0.7 0.5 0.9 5.0 5.8 6.1
Czech Rpublic 1.6 2.3 – 6.7 3.7 2.6 3.4 2.3 2.0 2.8 3.5
Romania 1.6 4.2 – 5.0 3.1 3.9 2.7 2.4 3.9 7.0 6.2
Hungary 1.0 4.6 – 5.8 5.2 3.4 3.4 3.3 3.4 5.2 5.3
Bulgaria 0.4 3.6 – 4.6 2.5 2.5 1.2 1.4 4.2 5.8 5.1
Croatia 0.4 2.9 – 9.3 5.1 0.8 0.2 0.9 6.7 8.6 9.0
Non-euro area EUᵈ 14.5 3.2 – 4.3 3.1 2.1 2.1 1.7 3.9 5.4 5.9
EU 27ᵈ 100.0 1.6 – 7.0 4.0 1.4 0.6 1.1 6.5 7.3 8.3
ᵃ GDP growth rates are based on the calender adjusted series except for Ireland, Slovakia and Romania for which EUROSTAT does not provide working-day adjusted GDP series. ᵇ Harmonized consumer price index (HICP). ᶜ Standardized unemployment rate. ᵈ Weighted average of the listed countries.
Source: Eurostat; 2020 and 2021: EEAG forecast.
Table 1.A3
Key Forecast Figures for the European Union (EU27)2019 2020 2021
Percentage change over previous year
Real GDP 1.6 – 7.0 4.0
Private consumption 1.6 – 7.5 4.0
Government consumption 2.0 0.8 3.0
Gross fixed capital formation 5.6 – 8.8 1.3
Exports of goods and services 2.8 – 10.6 2.5
Imports of goods and services 3.8 – 9.8 2.3
Net exportsᵃ – 0.4 – 0.8 0.1
Consumer pricesᵇ 1.4 0.6 1.1
Percentage of nominal GDP
Government fiscal balanceᶜ – 0.5 – 8.4 – 6.5
Percentage of labor force
Unemployment rateᵈ 6.5 7.3 8.3
ᵃ Contributions to changes in real GDP (percentage of real GDP in previous year). ᵇ Harmonized consumer price index (HCPI). ᶜ 2020 and 2021: forecast of the European Commission. ᵈ Standardized unemployment rate.
Source: Eurostat; 2020 and 2021: EEAG forecast.
Table 1.A4
Key Forecast Figures for the Euro Area2019 2020 2021
Percentage change over previous year
Real GDP 1.3 – 7.4 4.1
Private consumption 1.4 – 8.0 4.2
Government consumption 1.9 0.9 3.3
Gross fixed capital formation 5.7 – 9.7 1.5
Exports of goods and services 2.5 – 11.2 2.4
Imports of goods and services 3.9 – 10.4 2.0
Net exportsᵃ – 0.5 – 0.8 0.3
Consumer pricesᵇ 1.2 0.3 0.9
Percentage of nominal GDP
Government fiscal balanceᶜ – 0.6 – 8.8 – 6.8
Percentage of labor force
Unemployment rateᵈ 7.6 8.2 9.3
ᵃ Contributions to changes in real GDP (percentage of real GDP in previous year). ᵇ Harmonized consumer price index (HCPI). ᶜ 2019 and 2020: forecast of the European Commission. ᵈ Standardized unemployment rate.
Source: Eurostat; 2020 and 2021: EEAG forecast.

31EEAG Report 2021
CHAPTER 2
The coronavirus pandemic is still unfolding, and most countries are in a serious second wave with an in-creasing number of infections and Covid-19 related deaths. The economic consequences are dire as re-flected in a deep recession, increasing unemployment, and deteriorating public finances (see Chapter 1).
While the coronavirus pandemic is a common or aggregate shock, there are large differences in both the health and economic consequences across and within countries. Some countries have been particu-larly hard hit in terms of the number of people in-fected and mortality, and often this cannot be readily explained by differences in containment strategies. The economic consequences also differ, and they are not related one-to-one to the magnitude of the health shock. Economic structures, dependence on inter national trade, and the initial situation, among others, play a role. Within countries, the health fallout severely affects the elderly,1 while the direct eco-nomic consequences are largely borne by particular sectors (services) and workers, while families have also been affected by school closure and working from home.
The present situation is thus very problematic in all European countries. However, significant pro-gress in developing effective vaccines makes it a re-alistic scenario that vaccines can be produced and distributed during 2021. Although this is obviously an important and critical first step, the economic consequences will not disappear once an effective vaccine is rolled out. It takes time to recover from a deep recession, and the crisis is also associated with structural changes. The post-coronavirus world will in many ways be different from the pre-coronavirus world.
As a first economic policy response, emergency packages were launched to mitigate the consequences of lockdown restrictions for both firms and workers. These are temporary measures to cope with the im-mediate effects, and while still relevant, they suffer from a status-quo bias. We are now in a second phase where a more forward-looking perspective should be taken in economic policies.
The economic possibilities at any point in time depend on the available capital stocks, including not only business investment but also social and human capital. These are crucial conditioning variables that determine a country’s or regions’ level of prosperity, and economic opportunities depend critically on how
1 As we explain in the next chapter, although Covid-19 is particular-ly hard on the elderly, the proportional increase in death rates is roughly evenly distributed across age groups for those over 30.
these different capital stocks are affected by the coro-navirus crisis. From an economic policy perspective, the challenge is to prevent further erosion of capital stocks, seeking to re-build them in order to recover from the crisis while also adapting them to cope with structural problems and challenges, including aging and the climate.
The following chapters deal with the three capital stocks in order, starting in this chapter with social capital.
2.1 SOCIAL CAPITAL
The pandemic, its economic consequences, and the policy responses have wide ranging ramifications across different groups in society, affecting social cohesion and capital. Social capital denotes the net-works of relationships among people who live and work in a particular society, enabling that society to function effectively.2 Social capital allows a group of people to work together effectively to achieve a common purpose or goal. It allows a society (or or-ganization) to function together as a whole through trust and shared identity, norms and values. Concepts such as social cohesion, social capital, trust, or social inclusion/exclusion are related and are often used in-terchangeably. The notion of social capital explicitly builds on the recognition that individuals are interde-pendent in a way that goes beyond the (non-personal) interaction in economic markets. The core of the con-cept is thus a two-way interaction: social capital af-fects individuals and policies, and individual behavior and policies influence social capital. Social capital is thus of direct importance for economic performance (e.g., trust reduces transactions costs) as well as of political importance in the sense that low levels of social capital reduce the scope for mutually benefi-cial cooperation.
Social capital consequently determines how to cope with societal changes and shocks. This revolves around notions of “equal and fair burden sharing” and “winners compensating losers”. The ability to navigate societal changes in a way considered fair is thus closely related to the notion of social cohesion. A society with little cohesion is likely to be more seg-regated and conflict-ridden, whereas more cohesion is conducive to a more consensus-driven approach. Eroding social capital fuels fragmentation, populist tendencies and impairs political decision-making and thus reform capacity.
2 See https://www.lexico.com/definition/social_capital.
Distributional Conflicts and Social Capital

32 EEAG Report 2021
CHAPTER 2
Social capital is, as indicated by the term, a stock that can be accumulated and depreciated, yet it is characterized by a strong asymmetry in the sense that it takes a long time to build up, but it can dimin-ish quickly. A crisis can thus have persistent effects if social capital and cohesion depreciate.
Historically, pandemics have often been associ-ated with loss of social cohesion. The available evi-dence has identified several factors that increase the likelihood that pandemics lead to social conflict, nota-bly high lethality, high child mortality, having an “in-termediary” level of knowledge of the mechanisms by which the disease transmits,3 and pre-existing inter-group tensions; see Jedwab et al. (2020) for a review. The coronavirus pandemic exhibits several of these features. Moreover, the health and economic conse-quences have very different effects both across and within countries. While lockdowns and containment restrictions as well as economic policy interventions aim at addressing the common goal of reducing the negative externalities from contagious behavior, the costs and benefits are not equally shared. But can these societal goals be achieved without the costs falling on specific groups, particularly when several of the above correlates with social conflict are present in the current crisis? Who is affected by the pandemic? Who is affected by the lockdown and containment restrictions? How is all of this financed?
This chapter identifies how tensions that may erode social capital in the European Union are likely to appear. These tensions can occur not only across countries but also within. They have both inter- and intragenerational dimensions, as costs affect in a dif-ferent way those with different income or education levels, migrants and nationals, men and women.
2.2 INTERGENERATIONAL CONFLICT
Intergenerational linkages are an important element of social capital. A very tangible sign of social capital and cohesion is the intergenerational contract em-bedded in tax-financed welfare arrangements. Pro-vision of education, health, child- and old-age care financed by taxation implies a clear age gradient. The young and the old tend to be net beneficiaries, whereas those of working age are net contributors. This implicit contract relies on the net contributors being willing to support the arrangement.4 This con-tract embeds both a conflict between generations (should more be allocated to the young than the old?) and also a mutual dependence. The current net con-tributors have an interest in the scheme since they will be net beneficiaries when they become old. In-3 By an “intermediary” level of knowledge, the literature means that the disease is neither attributed to supernatural causes nor yet fully understood by the medical community, authorities or popula-tions.4 For a discussion see EEAG (2016). There is a large amount of liter-ature on both the economic implications of the intergenerational contracts and its political support, see e.g., Andersen and Bhat-tacharya (2017) and de Walque (2005).
vesting in education for the current young is not only to the benefit of the young but also older cohorts, since it increases future incomes and thus future tax bases.
The intergenerational contract depends funda-mentally on social capital and trust across genera-tions. This can be challenged if there is unequal bur-den sharing across generations. The coronavirus crisis has important intergenerational implications. While the health risk can be argued to be equivalent across generations (see next chapter for details of why this is so), the costs of the policies put in place to fight the pandemic are not evenly distributed. The costs of social distancing, which fall across all generations, are probably largest for younger cohorts. Business and employment interruption losses (a market closure shock) fall primarily on the working-age population, while adapting to working from home and reduced possibilities for child-care also fall on the younger generations. Interruptions in education and lower ed-ucational quality due to virtual teaching—see Chapter 3 on human capital—have costs for the very young. As a consequence, inequality of opportunity occurs across generations.
Simultaneously, the income of pensioners is not affected by the economic crisis.5 The pension chal-lenge is primarily related to the pensions the current workforce can expect: many public pension schemes are not financially viable, and a low real rate of return environment reduces the value of defined contribu-tion schemes. Hence, the pension risk falls mainly on the shoulders of future pensioners, that is, younger cohorts.
The economic costs of the lockdown restric-tions are being collectively shared via various types of emergency packages, and the intragenerational implications are discussed in the next section. While public debt increases are entirely appropriate in a crisis situation, there is a need to ensure that their repayment does not break intergenerational social co-hesion. Is increasing debt a burden on future cohorts?
Some debt may be repaid within the lifetime of individuals currently alive, and the use of appropri-ate tax instruments can ensure that revenue is raised efficiently and equitably, that is, from those individu-als who benefited from spending and tax reductions during the crisis. Most public debt, however, will un-doubtedly be passed on to the yet unborn, raising frustrating issues concerning equity considerations. Parents may adjust bequests, which will in many cases consist of public-debt assets. And productiv-ity growth at moderate and realistic rates imply that future generations will in any case be better off than generations currently alive, and better able to service debt as long as interest rates are not too high (for
5 This is clearly the case in defined benefit schemes. Funded de-fined contribution schemes incurred large losses at the onset of the crisis, but later developments in financial markets have implied a strong rebound.

33EEAG Report 2021
CHAPTER 2
a discussion of dynamic efficiency concerns about public debt, see Blanchard 2019).
Current government bond rates are low, lower than plausible economic growth rates, indeed ne-gative at 10ys maturity in most countries (though not in some of the countries most affected by the coronavirus crisis). A downward trend in rates of re-turns is also reflected in government bond yields.6 Yet using current low rates of returns as an argu-ment for dismissing the role of debt is tantamount to saying that the current situation is permanent. If not, then building up large debt levels can become a burden when returns normalize. This is a huge risk. Moreover, high debt levels reduce fiscal space and the ability to cope with negative economic events, and during the coronavirus crisis, countries with lower debt levels have been able to pursue more aggressive fiscal policies, see Alerbarola et al. (2020). Moreover, the increase in debt due to the coronavirus crisis comes on top of looming fiscal sustainability problems and insufficient reforms in the past. The countries facing the largest increases in debt in most cases had initially high debt levels and sustainability problems.
In these circumstances, the perception that the costs of the policies implemented for dealing with the pandemic fall disproportionately on younger co-horts can affect adherence to the social contract. This can take many forms, from social unrest and support for populist politics to migration of young workers to countries with weaker welfare states. Avoiding such erosion of social capital calls for policies that imply a more even burden across generations.
2.3 SHARING RISKS AND DAMAGES
While the health challenge has the same origin, both the health and the economic consequences of the coronavirus pandemic vary significantly across coun-tries, and there is no strong correlation between measures of the economic impact like the decline in 6 Changing demographics is one of the explanations of this trend, and it is not expected to change in the foreseeable future.
economic activity and health consequences in terms of e.g., Covid-19-related mortality, see Figure 2.1. As discussed in Chapter 1, the economic consequences depend, among other things, on the health shock, containment restrictions, and the economic policy responses. Moreover, the initial position of countries also differs, and for some countries, the coronavi-rus crisis comes on top of other problems. Notably, there is a tendency for countries entering the crisis with high public debt levels to have experienced the largest public finance consequence during the crisis, see Figure 2.1.
Social capital is often understood as the norms of trust and reciprocity that arise among individuals or groups. Consequently, sharing risks is a fundamental way of investing in social capital, since it requires both an ex ante commitment to reciprocity and sufficient trust in the fact that such reciprocity will materialize ex post. Providing insurance and redistributing in-comes are both ways of sharing the economic risks associated with a crisis. As these figures and the evi-dence presented in Chapter 1 indicate, the economic implications of the health shock vary considerably across countries, testing the strength of European cohesion. The next subsection examines how to share the resulting costs across EU countries. The coronavi-rus crisis has also had different effects across groups of individuals, both across income groups that have different possibilities for smoothing consumption, or across categories of workers whose capacity to work or entitlement to receive welfare support varies. Sections 2.3.2 and 2.3.3 consider how these sources of heterogeneity may affect social capital during the crisis.
2.3.1 Sharing Across the European Union
Economic crises affect social capital. After the finan-cial crisis, trust in the European Union declined, and although it has since recovered, it has not reached the level that was present before the onset of the crisis; see European Commission (2020a). In the cur-rent context, the same may occur. In fact, trust in the
ᵃ As of January 4, 2021.Source: OECD Economic Outlook, September 2020 (single hit scenario); Statista.
The Corona Crisis: Mortality, Economic Activity and Public Finances, European Countries
Projected decline in economic activity and Covid-19 mortality
© CESifo
Public finances: initial debt and projected debt increase
Economic growth in % Projected increase in debt 2019–2021 in %
Deaths per million inhabitantsᵃ Public debt in %, 2019
AT BE
CZ
DK
EEFI
FRDE
EL
HU
IEIT
LV
LTLU
NLPL
PTSK
SIES
SE
UK
0
5
10
15
20
25
0 50 100 150 200
AT
BECZ
DK
EE
FI
FR
DE
EL HUIE
IT
LVLT
NL
NO
PL
PTSK
SI
ES
SE
UK-14
-12
-10
-8
-6
-4
-2
0
0 200 400 600 800 1000 1200 1400 1600 1800
Figure 2.1

34 EEAG Report 2021
CHAPTER 2
European Union in April 2020 remained low, averag-ing just over 5 points on a scale of 1 to 10, accord-ing to a survey conducted by Eurofound (2020); see Figure 2.2. Interestingly, trust in the European Union has increased during the Covid-19 crisis, and Figure 2.2 indicates that between April and July, this level of trust has generally increased across member states, with the exception of Northern European countries.
These different patterns are likely due to national perceptions of recent EU initiatives that were wel-comed by many member countries but opposed by the Northern European economies. In a hypothetical ex ante situation, there would be an incentive to en-ter risk-sharing arrangements across EU countries to face health shocks like the coronavirus pandemic, see discussion in EEAG (2020a). In reality, there is no such arrangement, since the European Union was not set up to offer automatic responses for such purposes. The question has been whether ex post, there is suf-ficient solidarity among member states to establish such arrangements.
The European Union has launched the ground- breaking Next Generation EU (NGEU) program, which involves common burden sharing and explicitly aims to strengthen social cohesion within the European Un-ion. Labeling the initiative also signals a forward-look-ing perspective where intergenerational aspects are key. The initiative seeks to show that the European Union takes responsibility and can be part of the solu-tion, rather than a part of the problem, as under the financial crisis. But will the program be successful in
strengthening social capital and cohesion within the European Union?
The key element is the Recovery and Resilience Facility, which includes both a grants and a loan fa-cility (grants: EUR 313 billion; loans: EUR 360 billion) financed by EU borrowing and is intended to be oper-ative in early 2021. This is an unusual initiative to sup-port recovery and resilience of member states, creat-ing jobs and repairing the immediate consequences of the pandemic, while promoting the green and digital transitions. The grants are allocated based both on the economic situation prior to the coronavirus crisis and the economic effects of the crisis. The allocation of the grant portion of the initiative is shown in Fig-ure 2.3. Support under the scheme is conditional on reform initiatives, and funding depends on meeting explicit milestones and targets. The scheme has been vividly discussed and modified in the process, and approval was uncertain until the very end.
The initiative is a high-risk stake for the Euro-pean Union. If it succeeds, it can strengthen the role of the European Union and cohesion within the Eu-ropean Union, if it fails, it will be another example of a promising project on paper without much actual effect, thus eroding social capital in the European Union. The ultimate test is whether the funds are used for the intended purposes and a critical aspect is the reform contingency. Making support contingent on
0 2 4 6 8
Greece**Croatia
Czechia**Belgium
Netherlands**Bulgaria**
France**Slovakia**Sweden**
Slovenia**Cyprus*Austria
Denmark**Latvia*
Spain**Estonia
Italy**Romania**
Malta*Hungary**
Germany**Portugal
Finland**Luxemburg*Lithuania**
Poland*Ireland
Total (EU27)
July 2020
April 2020
Notes: The data show the mean for respondents in the EU27 when asked: Please tell me how much you personally trust each of the following institutions? The European Union. Trust is measured on a scale of 1 to 10, where 1 means that you do not trust at all, and 10 means that you trust completely.* Low reliability in July in Cyprus, Latvia, Luxemburg, Malta and Poland. **Statistically significant change (p=0.05.)Source: Eurofound (2020).
Trust in the European UnionMean scores by country
© CESifo
Figure 2.2
Note: The grant allocation depends on two keys: (I) 70% depends on the populati-on size, the inverse of its GDP per capita, and its average unemployment rate over the past 5 years (2015–2019), all measured relative to the EU average. (II) 30% are allocated based on population size, the inverse of GDP per capita, the observed loss in real GDP over 2020 and the observed cumulative loss in real GDP over the period 2020–2021, also relative to EU averages.Source: European Commission (2020b).
0 10 20 30 40 50 60 70
ItalySpain
FrancePoland
GermanyGreece
RomaniaPortugalCzechia
BulgariaCroatia
SlovakiaNetherlands
BelgiumSwedenAustria
LithuaniaHungary
FinlandLatvia
SloveniaDenmark
IrelandEstoniaCyprus
MaltaLuxemburg
70% allotment 30% allotment
Allocation of the Grant-Part of the Recovery and Resilience Facility
© CESifo
EUR billion
Figure 2.3

35EEAG Report 2021
CHAPTER 2
reform plans and implementation is an appropriate mechanism designed to deal with moral hazard. But enforcing this in practice is far from simple, start-ing with the difficulty of defining what is meant by a structural reform. Moreover, the track record for enforcement in the European Union is not strong as seen from e.g., the Stability and Growth Pact, rule of law and human rights issues.
Two aspects are essential in terms of the effec-tiveness of the initiative. On the one hand, the funds need to be well invested with an overall aim of over-coming market failures. This can encompass new technologies, for example, the digital transition, as well as key aspects of social capital, such as an effi-cient public sector. On the other, it is important that the investments are visible and that they do not end up financing activities that would be undertaken in any case. The NGEU relies on membership initiatives, which strengthens country-ownership to the specific initiatives but does not ensure that policy interde-pendencies are taken sufficiently into account.7 Fo-cusing on cross-national high-profile projects would highlight the role played by the Union. Last, monitor-ing should be strengthened to ensure that both the designs and the effects of the projects can be properly assessed, hence, avoiding wasteful use of resources. Not only would waste be economically costly, but it would also jeopardize social capital and cohesion.
2.3.2 Tensions Across Income Groups
A shock of the magnitude of the current one will have distributional consequences and existing evidence on other pandemics indicates that such consequences tend to persist.8 Moreover, growing income inequality over the past few decades has been associated with declining social capital, and it is likely that the former affects the latter.9 Identifying the distributional con-flicts that have emerged in the wake of the coronavi-rus crisis is hence essential for designing policies that prevent further erosion of social cohesion.
Data on income changes during the pandemic is not yet available, but the information that exists points toward important distributional effects. First, while the crisis has affected the labor market gener-ally, there is a clear social gradient, as indicated by Figure 2.4, since low-income groups face the largest 7 As discussed in the EEAG 2020 Policy Brief (EEAG 2020b), to en-hance the efficiency of the investment part of NGEU, it is important that it focuses on investments that are productive, but which are not, or not sufficiently, undertaken by member states. Examples of such investments are cross-border transport, energy and communi-cation networks, data networks or power lines, cyber security, and research and innovation programs. The challenges are that they are not specifically targeted at the countries, regions or sectors that have been particularly hard hit by the coronavirus crisis.8 For example, data for Italian municipalities on the effects of the 1918 influenza indicate that, after 5 years, income inequality was higher in municipalities more affected by the influenza and that these differences persisted for a century; see Galletta and Giommoni (2020).9 See Gould and Hijzen (2016) and the references therein. It is also likely that causality goes both ways, with weakened social capital resulting in higher inequality.
risk of both temporary lay-off/shorter working hours and job loss.
Second, bank data has allowed the analysis of changes in savings and consumption for French house-holds during the pandemic (Bounie et al. 2020). Aver-age consumption dropped during the spring and re-bounded over the summer, a pattern that was accom-panied by a substantial increase in household savings. But the data show vast heterogeneity across income groups (measured by total expenditure in 2019), as seen in Figure 2.5. Compared to the previous year, households at the top of the distribution reduced their consumption and increased their savings, with half of the “excess” increase in wealth being in the hands of the top decile. In contrast, households in the bottom deciles decreased both their consumption and their savings, while increasing their debt, observations that can only be explained by a drop in revenue.
Before the pandemic, much of Europe witnessed surges of populist sentiment as a response to in-creased polarization in earnings and access to jobs, and the differential way in which the health, employ-ment and earnings shocks have affected different in-come groups risks further eroding social capital. In this context, policy should target both pre-tax and post-tax inequality. The former is largely determined by the distribution of human capital, which we dis-cuss in detail in the next chapter. In the short term, redistribution plays an important role, and the con-cept of fair taxation is an essential policy element if the fiscal costs of supporting the recovery are to be widely accepted and not engender further social fracture (see EEAG 2020a).
Two elements are key. The first concerns how to support jobs when individuals are forced to stop working because of government-imposed restrictions. Emergency packages were an essential part of social insurance at the start of the health crisis. Yet, after generous benefits in (most) EU countries during the first wave, governments need to think about the de-sign of such packages during the second (or any fu-ture) wave since the perception of overly generous
0
0.05
0.10
0.15
0.20
0.25
Low income earners Middle income earners High income earners
Temporary lay-off/reduced hours Job loss
Source: Eurostat (2020).
Risk of Temporary Lay-off/Reduced Hours and Job Loss EU 2020, Q2
© CESifo
Probability
Figure 2.4

36 EEAG Report 2021
CHAPTER 2
subsidies could reduce support for the policy and in-cite calls for a reduction in the extent of redistribution (as well as dampen incentive to return to work, as we discuss in the next chapter). A second important as-pect for ensuring support for welfare policies for those temporarily out of work is to prevent individuals from exploiting the system. Incidental evidence (Le Monde, 10 and 13 July 2020; The New York Times, Septem-ber 10, 2020) seems to indicate that there has been a large increase in welfare fraud in several countries, which may make support for welfare and emergency packages wane. It is thus essential that governments implement sufficient monitoring to prevent fraud.10
2.3.3 Insiders and Outsiders
Fractured labor markets reduce trust and incite so-cial exclusion; consequently, the markedly different fortunes of insiders and outsiders during the pan-demic risk eroding the social tissue of European econ-omies. The contrast between insiders and outsiders can appear along multiple dimensions—whether the individual has or does not have a job, the quality of employment (formal versus informal), or the charac-teristics of the individual, notably domestic versus foreign workers. By making these differences more salient, the pandemic risks making social networks less connected and increasing the feeling of entitle-ment of certain groups, thus reducing trust across the various communities and hence the willingness to share the costs of the shock.
An important feature of many emergency sup-port packages in Europe (and elsewhere) has been protecting existing jobs. Income support packages for those temporarily unable to work have implied that there has been little incentive for workers to search 10 Fraud can occur at the individual level and at the corporate level. In some countries the emergency relief packages are contingent on a certain amount of revenue loss, and this can lead to fraudulent ac-counting in order for the firm to benefit from wage support. Hence, similar concerns arise for firms. In the case of firms, the question concerns whether firm support should be related to attitudes toward taxes in the past, in particular for firms that were in “gray zones” in terms of tax compliance. We return to this question in Chapter 4.
for employment in other sectors or for firms to create new positions. As a result, emergency policies have had a different impact on insiders and outsiders in the labor market, with both those that were unemployed before the health crisis and those about to enter the labor force having been particularly badly hit. Such a situation implies both inefficiency and unfairness. Inefficiency stems from the fact that jobs that existed before the pandemic are being protected irrespec-tive of their viability in the medium term, a viability that may be in jeopardy due to the health crisis or to pre-existing structural shocks. Unfairness is particu-larly salient when we compare two successive cohorts finishing their studies/training in the summer of 2019 and the summer of 2020, and thus facing very differ-ent labor-market entry conditions.
A second group of workers that has been badly hit by the pandemic are informal workers. These in-dividuals pay a double penalty in terms of health and financial costs. There has been a high willingness to work among the informal workforce during and af-ter the lockdowns as many of these individuals fail to qualify for any government schemes to support their incomes. Moreover, these workers are likely to be particularly unlikely to be able to maintain social distancing, at work because employers willing to hire informally are probably also cavalier about respecting distancing/safety norms, and at home because many such workers live in intergenerational housing or in crowded employer-provided accommodation. As a result, areas with a prevalence of informal work have often been hotspots of Covid-19 transmission.
Migrants are often employed in the informal sec-tor and as a result, they are a particularly vulnerable population.11 Yet, as it is often the case in a climate of economic insecurity, an anti-migrant backlash is possible since when people feel they are competing for scarce resources—whether jobs or hospital beds—
11 Work for the United States indicates that county-level measures of the ability to work at home are negatively correlated with the em-ployment share of low-skilled immigrants, many of whom are per-forming essential jobs (Rahman 2020).
0
0.2
0.4
0.6
0.8
1
1.2
1.4
February April June August
Consumption Expenditures Ratio 2020/2019 (1 = February)
Ratio 2020/2019 (1 = February)
Source: Bounie et al. (2020).
0.940.950.960.970.980.99
11.011.021.031.04
February April June August
1st decile 2nd decile 5th decile 9th decile 10th decile
Total Gross Savings
© CESifo
Consumption Expenditures and Total Gross Savings across the Income Distribution, France 2020
0.93
Figure 2.5

37EEAG Report 2021
CHAPTER 2
they tend to turn against those supposedly taking away those resources. The contribution of migrants to the economic performance of high-income econ-omies over the past few decades has been notable,12
hence, closing down borders in response to populist pressures could slow down the recovery by depriving certain sectors, notably agriculture and the business services sector, of categories of workers for which national supply is lacking. Moreover, migrant workers help lower dependency ratios and hence share the burden of public debt. Acknowledging the contribu-tion made by these individuals during the pandemic, since notably they are often key workers, could help increase tolerance toward this population.13
To avoid an increase in social fracture, policies should seek to be encompassing. Status quo biases–whether toward those already employed or domestic workers–can lead to inefficiencies and hamper social cohesion if certain groups, such as young entrants into the labor market or migrants, feel that they are being unfairly treated. The first wave of the pandemic required immediate action, now more thought needs to be devoted to how to let the labor market adjust while protecting all individuals and not only those already in formal employment when the pandemic hit.
2.4 WHAT KIND OF RECESSION?
2.4.1 A Pink Recession
Social capital is increased by building and strengthen-ing the norms that underpin reciprocity, co-operation and trust, and the most basic sphere in which these norms operate is the household. Just as an uneven sharing of the costs of the coronavirus crisis across age or income groups risks reducing cohesion, the feeling that gains in terms of gender equality are be-ing reversed by the pandemic can diminish social cap-ital. And the data so far indicates that the coronavirus crisis is affecting women more than men.
Traditionally, recessions have tended to have the largest impact on male employment, with, for exam-ple, the 2008-09 crisis being termed as a “mances-sion.” In contrast, a number of indicators point toward the current crisis as having hit women particularly hard. There are two reasons for this. First, women are more likely than men to work in sectors with a high level of social interaction14 and while in some cases this implies that they are essential workers (e.g., nursing), most of these jobs are in sectors that have been badly hit by the lockdown measures. Second, 12 Existing evidence indicates that a higher presence of migrant la-bor has resulted in higher employment and wages for national work-ers as well as in increased productivity (Dustmann et al. 2013; D’Amuri and Peri 2014; Peri 2012).13 Data for the UK shows that migrants are overrepresented in many essential sectors, accounting for 22 percent of employment in both health and social care and in food and necessary goods, whereas they represent only 14 percent of the population (ONS 2020).14 For example, in the US, nearly 74 percent of women work in social sectors, compared to 48 percent of men (in 2019); see Fabrizio et al. (2020).
the closure of schools, the need to provide support for isolating older relatives, and the medical conse-quences of either Covid-19 itself or delayed treatment, have vastly increased the need for home-production, raising the question of who bears this burden.
The evidence indicates that generally—but not universally—women have been particularly badly hit. Larger employment losses for women than for men have been documented for the United States as well as for United Kingdom households with dependent children, but when all UK households are consid-ered, there seems to be no difference between men and women in the extent of job loss and reduction in hours. Within households, the increased childcare needs have been mainly met by women, although, at least in the UK, the share of childcare performed by men has risen (see Hupkau and Petrongolo 2020 for a discussion and sources). In the United States, women are dropping out of both employment and the labor force, and local decisions on school closures predict well where this is occurring; see Heggeness (2020).
These patterns raise concerns about a potential reversal of the gains in gender equality made over the past decades since they seem to imply a return to traditional gender roles. Moreover, as the health shock prolongs, changing attitudes toward work at home and in the market can have important consequences. On the one hand, current generations of working-age women can be hurt as women who “choose” to exit the labor force for a prolonged period of time are likely to incur costs for their future careers due to a loss of skills and experience. On the other, a return to traditional gender roles at home can affect the per-ception of roles and identity, resulting in increased biases in the workplace, diminished aspirations for girls and greater gender gaps for future generations.
2.4.2 A Green Recovery
The climate crisis is high on the political agenda and has become a major source of social conflict. Conflict has emerged because of widespread climate skepti-cism, and is also due to tensions across generations with different time horizons and across income groups that disagree on who should bear the costs of climate policies. This lack of consensus has created a major split both within and across European countries, and the coronavirus crisis has brought this issue to the forefront both because of its short-term impact and because of questions regarding whether the recovery following the coronavirus crisis can be made “green” by implementing appropriate policy designs.
The NGEU has included green investments as a crucial element, and a minimum of 37 percent of the spending under NGEU should be related to climate change. This is a strong signal that the climate chal-lenge is taken seriously and is responding to an in-creasing political demand to take action, thus helping social and intergenerational cohesion. However, the

38 EEAG Report 2021
CHAPTER 2
investment target is problematic for several reasons: setting an investment target is a top-down approach with a dubious track record; green investments are not in general targeted at the types of activity most directly affected by the crisis (e.g., services), and NGEU may finance projects that would have been undertaken anyway or that use broad definitions of green investments (green washing). All these aspects leave the net effect an open question. Targets for ex-penditures on climate may be more effective if focus-ing on network facilities and cross-border activities, as argued above, while improving perceptions about the role of the European Union in the green transition would benefit from focusing investment on highly vis-ible projects of transnational character.
More fundamentally, subsidizing green technol-ogies is not the best way to reach the climate target and address the associated negative externalities. A more efficient approach is to focus on price signals, such as a CO2 price or tax. Such measures, however, raise two concerns. First, they require adjustments that would arrive at a time when economies are facing major demand shocks, yet existing predictions indi-cate no negative impact on growth and employment (Metcalf and Stock 2020). Moreover, Fuest and Pisani-Ferry (2020) show that the ETS could finance the en-tire recovery plan, freeing funds to other productiv-ity-enhancing expenditures, notably human capital.
Second, as always, price changes have distribu-tional implications, and these would need to be ad-dressed so as to prevent social tensions. As recent ex-periences, for example in France, have shown, carbon taxes are deeply unpopular. Yet there is no good rea-son why a carbon tax would hurt the poor. First, while it is a burden on consumption, it also affects factor prices, with a particularly strong incidence on factors that are complements to energy, i.e., capital; second, the progressivity of a carbon price can be adjusted by indexation of tax schedules and social benefits (Met-calf 2019). The decision to pursue this avenue will test the strength of the social contract. Solidarity across groups with different incomes or lifestyles is required to ensure that the resulting distribution of consump-tion is acceptable, while sufficient trust in institutions is a must when households experience the increase in consumption prices daily but the reduction in their tax bill only once a year. This requires reciprocity and confidence in institutions, in which case, we would emerge from this pandemic with strong social capital across and within European nations.
2.5 POLICIES FOR PREVENTING THE EROSION OF SOCIAL CAPITAL
In the short run, halting the erosion of social capi-tal triggered by the coronavirus crisis calls for poli-cies that are encompassing across age, employment or income groups. Intergenerational conflict is par-ticularly salient. In order for policy to be perceived
as placing an even burden across generations, fair taxation is essential (see EEAG 2020a); for example, taxes on consumption and land are a better way to share the burden of the coronavirus crisis debt than income taxes. Another candidate policy to ease in-tergenerational tensions is pension reform,15 while climate-friendly policies can also help by signaling an increased weight of the welfare of the young in the so-cial welfare function. But above all, debt sustainability hinges on growth. Measures that enhance current and future productive capacity in European economies, such as labor market reforms, increased human cap-ital, and innovation will generally have large effects on public budgets via increased tax revenue and re-duced social spending, favoring social cohesion. We will return in more detail to these aspects in the next two chapters
A major concern are status quo biases–whether toward those already employed or domestic workers–which can lead to inefficiencies but also hamper social cohesion if certain groups, such as young entrants into the labor market or migrants, feel that they are being unfairly treated. The first wave of the pandemic required immediate action, now more thought needs to be devoted to how to let the labor market adjust while protecting all individuals and not only those already employed when the pandemic hit.
Countries should look for the proper balance between preserving and creating jobs so as to avoid a status quo bias. To do so, the priority should be to support individuals rather than protect jobs, as exemplified by the Danish flexicurity approach. This will require re-thinking some aspects of the welfare system, but also returning to pre-pandemic policy analyses to assess pre-crisis structural weaknesses in order to identify in which areas job preservation should not be a priority. The process of job creation and job destruction should also be smoothed by re-ducing existing rigidities. Indeed, firm creation and destruction is a key part of the labor reallocation pro-cess, and many EU countries suffer from barriers to both entry and exit. These barriers should be removed with urgency, yet several countries are introducing policies that head in the opposite direction.16
The recovery requires that the welfare system does not jeopardize incentives for job search and re-allocation, hence income support should focus on encouraging people to accept new jobs. One possi-bility is to change benefit entitlement in such a way
15 Whether such reforms would be contractionary in the short run is far from clear. The current situation with non-financially viable pen-sion systems creates uncertainty, which may lead to precautionary savings. In contrast, increases in retirement ages will generally in-crease lifetime incomes and thus consumption.16 For example, the 2019 OECD report on Germany already suggests that the country should “[e]ase the conditions for bankrupt entre-preneurs to be discharged of debt after three years, while maintain-ing adequate safeguards for creditors [and c]reate a one-stop shop to process all procedures for starting up a company online” (OECD 2019, p. 148). Yet Germany, as well as, for example, Italy, are con-straining dismissals.

39EEAG Report 2021
CHAPTER 2
that acceptance of a new job—possibly in a different sector—does not reduce benefit entitlement.
At the same time, given the vast increase in cov-erage, it is important for the welfare system to be regarded as fair since the perception of overly gen-erous subsidies could reduce support for the policy and incite calls for a reduction in the extent of redis-tribution. As a way to ensure fairness, the coverage of the social safety net could be extended by including income-contingent loan facilities as an alternative to general changes in generosity. Many countries have introduced such schemes for small firms and busi-ness owners either in the form of postponement of tax payments or outright loan facilities. For families with income loss due to the crisis and large fixed costs, a similar need exists. Income-contingent loans could be made available conditional on a sufficient drop in taxable income. The repayment would be triggered only when and if the household’s income reaches a certain level, in a similar way to income-contingent loans used for financing higher education in Australia, New Zealand and the United Kingdom.
Three important considerations should be the focus of medium- and long-term policy: the imple-mentation of the Next Generation EU plan, gender imbalances, and environmental concerns. We discuss each of these in turn.
The crisis has very different health and economic consequences across EU countries, and the Next Gen-eration EU recovery plan aims at sharing the burden across member countries. The recovery plan and the issuance of common debt provide a much-needed sig-nal of EU cohesion and solidarity. In the long run, they can enhance social capital, while in the short term they will keep the single market and supply chains operative, both of which are crucial for saving lives. Yet the implementation of the program is hindered by a lack of trust across countries, which is to a large extent the reason behind the conditionalities imposed in terms of how the funds can be spent. Conditional-ities are, however, not an appropriate solution, both because it is not clear what an appropriate use of the funds would be—even from the perspective of coun-tries skeptical of the scheme—and also since quanti-tative conditionalities are hard to monitor and enforce (notably since they can easily be met by a reclassifi-cation of expenditures and investments). As a result, the program is a high-risk venture, since poorly spent resources may turn out to be counterproductive, add-ing to distrust in EU initiatives. The ultimate test is the effectiveness of the initiative, making its design cru-cial if the program is to help build rather than erode social capital among member countries.
A more suitable approach would be to ask coun-tries to set specific targets, leaving them discretion on how to achieve the various objectives prioritized by the Union, such as the green and digital transfor-mations. The expenditure plans could be presented to the relevant EU authorities, which would monitor
whether targets are eventually met. The result is likely to be a choice of policies that are more suited to a country’s specific problems and a greater degree of accountability of the recipient that should increase the efforts made to reach targets. Specific EU-guided initiatives could nevertheless be undertaken when they focus on common infrastructure or network needs across countries.
The patterns of household division of labor ob-served since the start of the coronavirus crisis raise concerns both about female labor force attachment and the impact of gender roles on workplace biases and on young women’s aspirations. Gender-responsive fiscal policies can and should help prevent negative outcomes by fostering female labor market partici-pation. The decision by most European countries to avoid closing schools during the second wave is head-ing in the right direction and should be supported both through fiscal and health measures, as we will discuss in more detail in the next chapter, but more effort is needed.
In particular, the pandemic has identified non-re-silient institutions, with child-care and primary schooling displaying critical vulnerabilities. From both a short-term and a long-term perspective, it is important to build care institutions that do not col-lapse in the face of a shock. Resilience requires sev-eral elements. In many EU countries, daycare centers, preschool and primary schools are characterized by short and inflexible hours as well as the impossibility for (mildly) sick children to attend. During the exit from the spring lockdowns, it would have been easier to allow for part-time attendance that allowed par-ents some working time if care systems had already been providing longer hours. Overall, child-care and early-school institutions should reorganize to provide more flexibility in order to adapt to parental circum-stances. The example of France is noteworthy. Pub-lic daycare centers, preschool and primary schools are typically open for 11 hours per day, and although children do not spend all that time in care, it pro-vides flexibility for parents to adapt care to their work schedules. Not surprisingly, France combines high fe-male labor force participation with high fertility.
There is widespread debate on how to make the recovery from the pandemic consistent with a cli-mate agenda to reduce CO2 emissions. Quantitative investments targets, as those proposed in NGEU, are generally not an efficient way of achieving climate objectives. Cosmetic effects can distort where the funds are invested and the targets do not address aspects such as network facilities and infrastructure, where both the market and single countries may un-derinvest. As a result, in the short term, quantitative investment targets serve as a political signal, but its political credibility may eventually erode when it be-comes clear that this approach is ineffective.
Negative externalities are most efficiently ad-dressed via price signals, and climate objectives

40 EEAG Report 2021
CHAPTER 2
should be achieved via a CO2 price or tax. This can be accomplished by either reforming the European emissions trading system (ETS) or national CO2 taxes respecting an EU-set minimum. As long as the meas-ures apply generally across sectors, this ensures clear economic incentives to reduce emissions where it is most cost effective. Clear and credible price sig-nals will also give the right up-front incentives for investments.
REFERENCES Alerbarola, E., Y. Arslan, G. Cheng, and R. Moessner (2020), “The Fiscal Response to the Covid-19 Crisis in Advanced and Emerging Economies”, BIS Bulletin, no 23, Basel.
Andersen, T.M., and J. Bhattacharya (2017), “The Intergenerational Wel-fare State and the Rise and Fall of Pay-as-you-go Pensions”, Economic Journal, 127, 896–923.
Blanchard, O. (2019), “Public Debt and Low Interest Rates”, American Economic Review, 109(4):1197-1229.
Bounie, D., Y. Camara, E. Fize, J. Galbraith, C. Landais, C. Lavest, T. Pazem, and B. Savatier (2020), “Consumption Dynamics in the COVID Crisis: Real Time Insights from French Transaction & Bank Data”, CEPR DP15474.
Caliendoa, M., S. Künne, and A. Uhlendorff (2016), “Earnings Exemptions for Unemployed Workers: The Relationship Between Marginal Employ-ment, Unemployment Duration and Job Quality”, Labour Economics, Volume 42, p. 177–193.
D’Amuri, F. and G. Peri (2014), “Immigration, Jobs, And Employment Protection: Evidence From Europe Before And During The Great Reces-sion”, Journal of the European Economic Association, European Economic Association, Vol. 12(2), p. 432–464, 04.
De Walque, G. (2005), “Voting on Pensions: A Survey”, Journal of Eco-nomic Surveys, 19(2), 181–209.
Dustmann, C., T. Frattini, and I. P. Preston (2013), “The Effect of Immi-gration Along the Distribution of Wages”, Review of Economic Studies 80(1), 145–173.
EEAG (2016), “The EEAG Report on the European Economy 2016: What Next?”, by T. M. Andersen, G. Bertola, J. Driffill, H. James, H.-W. Sinn, J.-E. Sturm and B. Uroševic, CESifo, Munich, p.70–84.
EEAG (2020a), “The EEAG Report on the European Economy 2020: Fair Taxation in a Mobile World”, by Andersen, T. M., G. Bertola, C. García-Peñalosa, C. Fuest, H. James, J.-E. Sturm, and B. Uroševic, CESifo, Munich.
EEAG (2020b), “EEAG Policy Brief: Europe’s Pandemic Politics”, by T. M Andersen, G. Bertola, C. García-Peñalosa, C. Fuest, H. James, J.-E. Sturm, and B. Uroševic, CESifo, Munich.
Eurofound (2020), Living, Working and COVID-19-Dataset, Dublin, http://eurofound,link/covid19data (accessed December 30, 2020).
European Commission (2020a), Public Opinion – Eurobarometer 2019, https://ec.europa.eu/commfrontoffice/publicopinion/index.cfm/Survey/getSurveyDetail/instruments/STANDARD/surveyKy/2255 (accessed De-cember 30, 2020).
European Commission (2020b), Recovery Plan for Europe, https://ec.europa.eu/info/live-work-travel-eu/health/coronavirus-re-sponse/recovery-plan-europe/pillars-next-generation-eu_en (accessed December 30, 2020).
Eurostat (2020), Covid-19 Labour Market Effects across Income Distribu-tion, https://ec.europa.eu/eurostat/en/web/products-eurostat-news/-/ddn-20201027-2 (accessed December 30, 2020.
Faini, R. and A. Venturini (1993), “Trade, Aid and Migration: Some Basic Policy Issues”, European Economic Review 37, 435–442.
Fuest, C. and J. Pisani-Ferry (2020), “Financing the European Union: New Context, New Responses”, Policy Contribution 2020/16, Bruegel Policy Contribution Issue nr. 16.
Gianmarco, D., A. F.M. Martinangeli, F. Passarelli, W. Sas, and L. Wind-steiger, Covid-19 and Socio-political Attitudes in Europe: In Competence We Trust, in VoxEU, October 1, 2020. https://voxeu.org/article/cov-id-19-and-socio-political-attitudes-europe (accessed December 30, 2020).
Gould, E. D., and A. Hijzen (2016), “Growing Apart, Losing Trust? The Im-pact of Inequality on Social Capital”, International Monetary Fund.
Heggeness, M. L. (2020), “Estimating the Immediate Impact of the COVID-19 Shock on Parental Attachment to the Labor Market and the Double Bind of Mothers”, Review of Economics of the Household, Vol 18, 1053–1078.
Hepburn, C., B. O’Callaghan, B., N. Stern, J. Stiglitz, and D. Zenghelis (2020), “Will COVID-19 Fiscal Recovery Packages Accelerate or Retard Progress on Climate Change?”, Oxford Review of Economic Policy, 36.
Hupkau, C. and B. Petrongolo (2020), “Work, Care and Gender During the Covid-19 Crisis”, Mimeo.
Jedwab, R., A. M. Khan, R. Damania, J. Russ, and E. D. Zaveri (2020), “Epidemics, Poverty, and Social Cohesion: Lessons from the Past and Possible Scenarios for COVID-19”, Mimeo.
Metcalf, G. E. (2019), “The Distributional Impacts of U.S. Energy Policy”, Energy Policy, Volume 129, p. 926–929.
Metcalf, G.E. and J. H. Stock (2020), “Stock Measuring the Macroeco-nomic Impact of Carbon Taxes”, American Economic Review, Papers and Proceedings.
ONS (2020), Coronavirus and Key Workers in the UK, https://www.ons.gov.uk/employmentandlabourmarket/peopleinwork/earningsandwork-inghours/articles/coronavirusvirusandkeyworkersintheuk/2020-05-15 (accessed December 30, 2020).
Peri, G. (2012), “The Effect of Immigration on Productivity: Evidence from U.S. States”, The Review of Economics and Statistics, MIT Press, vol. 94(1), p. 348–358.
Putnam, R. D. (2001), “Bowling Alone: The Collapse and Revival of Amer-ican Community”, Simon and Schuster.
Rahman, A. S. (2020), “Why Can’t Everybody Work Remotely? Blame the Robots“, CEPR Covid Economics, issue 36.
Schiff, M. (2002), “Love thy Neighbor: Trade, Migration, and Social Capi-tal”, European Journal of Political Economy, Volume 18, Issue 1, 87–107.
Wee, S. L. (2013), “Born Under a Bad Sign: The Cost of Entering the Job Market During a Recession”, Mimeo.
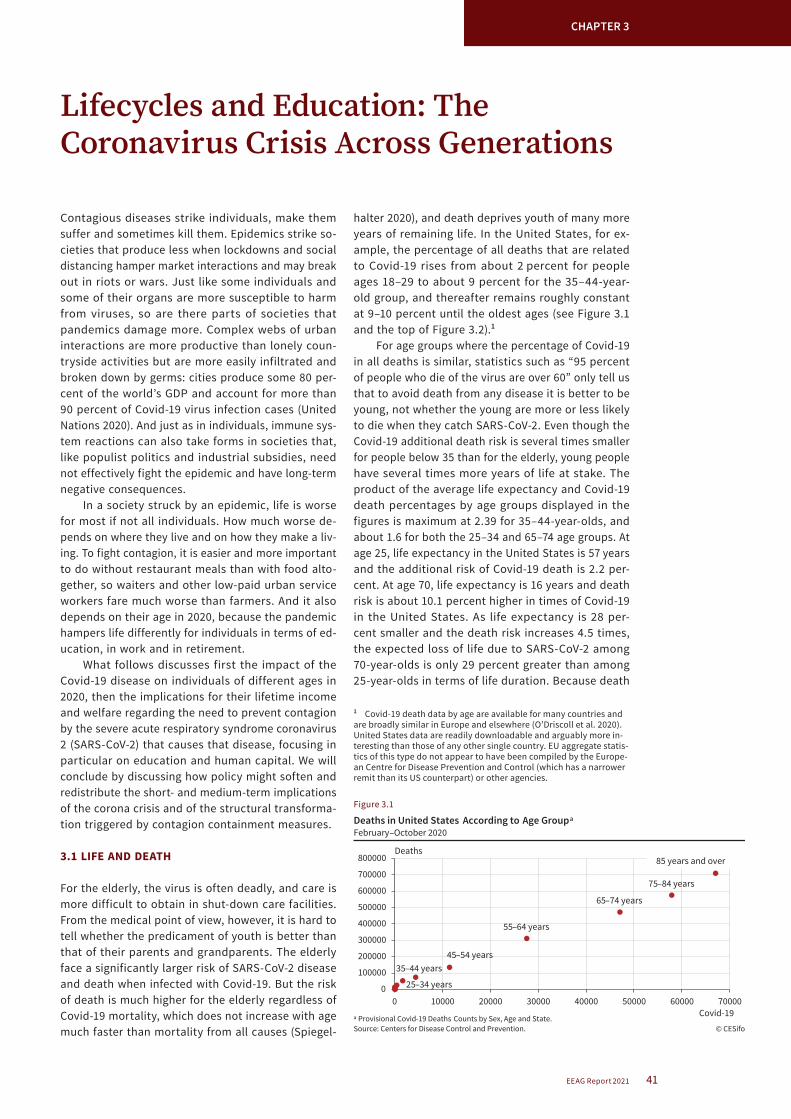
41EEAG Report 2021
CHAPTER 3
halter 2020), and death deprives youth of many more years of remaining life. In the United States, for ex-ample, the percentage of all deaths that are related to Covid-19 rises from about 2 percent for people ages 18–29 to about 9 percent for the 35–44-year-old group, and thereafter remains roughly constant at 9–10 percent until the oldest ages (see Figure 3.1 and the top of Figure 3.2).1
For age groups where the percentage of Covid-19 in all deaths is similar, statistics such as “95 percent of people who die of the virus are over 60” only tell us that to avoid death from any disease it is better to be young, not whether the young are more or less likely to die when they catch SARS-CoV-2. Even though the Covid-19 additional death risk is several times smaller for people below 35 than for the elderly, young people have several times more years of life at stake. The product of the average life expectancy and Covid-19 death percentages by age groups displayed in the figures is maximum at 2.39 for 35–44-year-olds, and about 1.6 for both the 25–34 and 65–74 age groups. At age 25, life expectancy in the United States is 57 years and the additional risk of Covid-19 death is 2.2 per-cent. At age 70, life expectancy is 16 years and death risk is about 10.1 percent higher in times of Covid-19 in the United States. As life expectancy is 28 per-cent smaller and the death risk increases 4.5 times, the expected loss of life due to SARS-CoV-2 among 70-year-olds is only 29 percent greater than among 25-year-olds in terms of life duration. Because death
1 Covid-19 death data by age are available for many countries and are broadly similar in Europe and elsewhere (O’Driscoll et al. 2020). United States data are readily downloadable and arguably more in-teresting than those of any other single country. EU aggregate statis-tics of this type do not appear to have been compiled by the Europe-an Centre for Disease Prevention and Control (which has a narrower remit than its US counterpart) or other agencies.
Contagious diseases strike individuals, make them suffer and sometimes kill them. Epidemics strike so-cieties that produce less when lockdowns and social distancing hamper market interactions and may break out in riots or wars. Just like some individuals and some of their organs are more susceptible to harm from viruses, so are there parts of societies that pandemics damage more. Complex webs of urban interactions are more productive than lonely coun-tryside activities but are more easily infiltrated and broken down by germs: cities produce some 80 per-cent of the world’s GDP and account for more than 90 percent of Covid-19 virus infection cases (United Nations 2020). And just as in individuals, immune sys-tem reactions can also take forms in societies that, like populist politics and industrial subsidies, need not effectively fight the epidemic and have long-term negative consequences.
In a society struck by an epidemic, life is worse for most if not all individuals. How much worse de-pends on where they live and on how they make a liv-ing. To fight contagion, it is easier and more important to do without restaurant meals than with food alto-gether, so waiters and other low-paid urban service workers fare much worse than farmers. And it also depends on their age in 2020, because the pandemic hampers life differently for individuals in terms of ed-ucation, in work and in retirement.
What follows discusses first the impact of the Covid-19 disease on individuals of different ages in 2020, then the implications for their lifetime income and welfare regarding the need to prevent contagion by the severe acute respiratory syndrome coronavirus 2 (SARS-CoV-2) that causes that disease, focusing in particular on education and human capital. We will conclude by discussing how policy might soften and redistribute the short- and medium-term implications of the corona crisis and of the structural transforma-tion triggered by contagion containment measures.
3.1 LIFE AND DEATH
For the elderly, the virus is often deadly, and care is more difficult to obtain in shut-down care facilities. From the medical point of view, however, it is hard to tell whether the predicament of youth is better than that of their parents and grandparents. The elderly face a significantly larger risk of SARS-CoV-2 disease and death when infected with Covid-19. But the risk of death is much higher for the elderly regardless of Covid-19 mortality, which does not increase with age much faster than mortality from all causes (Spiegel-
Lifecycles and Education: The Coronavirus Crisis Across Generations
25–34 years
35–44 years45–54 years
55–64 years
65–74 years
75–84 years
85 years and over
0
100000
200000
300000
400000
500000
600000
700000
800000
0 10000 20000 30000 40000 50000 60000 70000
Deaths
Covid-19ᵃ Provisional Covid-19 Deaths Counts by Sex, Age and State.Source: Centers for Disease Control and Prevention. © CESifo
Deaths in United States According to Age GroupᵃFebruary–October 2020
Figure 3.1

42 EEAG Report 2021
CHAPTER 3
less carefully than older people and makes it hard to discuss the interaction of economics and death in many historical situations besides the current pan-demic. The nineteenth-century industrial revolution increased income tremendously, but life expectancy declined as factories and urbanization made it eas-ier for diseases to infect people. In twentieth-cen-tury Russia, not only wars but also Stalinist indus-trialization exerted a massive effect on death rates (Rosefielde 1983), and so did the eventual demise of the Soviet Union. Chen et al. (1996) report a 45 per-cent increase in total death rates in Russia between 1989 (10.7 per thousand population) and 1994 (15.5 per thousand population), which is more than the excess deaths observed during Covid-19 epidemic episodes. Increasing health inequality and social seg-mentation is having similarly significant implications in the twenty-first-century United States. Case and Deaton (2020) estimate that 157,000 deaths, about half as many as those related to Covid-19 in 2020, were caused by suicide, drugs, and alcohol abuse in 2017 among poor uneducated victims of a globali-zation that, unlike Covid-19, was not considered a national tragedy.
3.2 ECONOMIC COSTS OF REMOTE LEARNING AND SCHOOL CLOSURES
While loss of life is sadly difficult to evaluate, it is easier and useful to assess the economic damage inflicted by the corona pandemic crisis to individuals who survive the disease, or do not even catch it. For workers and firms, income losses are obvious. For young people, the quality and quantity of education decrease under social distancing and during lock-downs. This has obviously negative implications for their income when they are working, because workers with more and better education earn higher wages.
Returns on investments in education, measuring their cost as foregone earnings while studying, are typically around 9 percent per year of education in developed countries. As Figure 3.3 shows, there is some variation across countries, which is not easily interpretable as the estimates turn out to be simi-lar across disparate countries (Psacharopoulos and Patrinos 2018).
Better educated workers are also more likely to be employed. It is easy to see why. Less-skilled indi-viduals are less productive, hence, earn lower wages when employed and it is harder for them to find em-ployment at any given wage. Skills may be innate or be learned, not only at work and in the family, but also in formal education, and it would be odd to find that more education resulted in fewer and worse skills.
The contribution of education to skills and wages need not be well measured by the statistics displayed in Figure 3.3 for two reasons. The first is that just sitting in a classroom does not produce as much
deprives the latter of the best years of their life, the quantity and quality of life lost appears quite com-parable across age groups in the United States. Life expectancies and death risks by age do vary across countries, as well as across genders and socio-eco-nomic groups within countries with different popu-lation structures.2 But these types of computations make it far from obvious that the loss-of-life conse-quences of SARS-CoV-2 differ much by age.
Trading off the cost of exposure versus the many economic and social benefits of being alive is diffi-cult.3 This may explain why youth avoid contagion
2 Among individuals who catch Covid-19 at each age, those who die certainly have worse preexisting health conditions or more limited access to medical facilities, and hence, shorter life expectancy re-gardless of Covid-19. The calculation can disregard this because it is not obvious whether health conditions matter more or less for Cov-id-19 and other deaths at different ages.3 Difficult, but not impossible, using the “statistical death” methods introduced by Schelling (1968). Rosen (1988) shows that the value of eliminating a risk to a life, which depends on willingness-to-pay for one additional year and residual life expectancy, declines rapidly with the working age at which it is assessed. The riskiness of infection de-pends on how death rates vary by age among infected people. Even though many infections go undetected, estimates from seropreva-lence surveys confirm that age-specific relative death risks of Cov-id-19 infection to death risk from all causes are roughly proportional (O’Driscoll et al. 2020).
0
20
40
60
80
Years100
<1 1–4 5–14 15–24 25–34 35–44 45–54 55–64 65–74 75–84 ≥85
Average Life Expectancy
0
2
4
%
6
8
10
12
<1 1–4 5–14 15–24 25–34 35–44 45–54 55–64 65–74 75–84 ≥85
Covid Deaths as Percentages of Total Deaths
0
0.5
1
1.5
2
2.5
3
<1 1–4 5–14 15–24 25–34 35–44 45–54 55–64 65–74 75–84 ≥85
Expected per Capita Loss of Life
© CESifo
Source: Authors' calculations based on US Social Security Area, life expectancy data from Actuarial Life Table, Social Security Administration, interpolated and aggregated by age group using 2017 estimated population sizes from National Vital Statistics Report, Centers for Disease Control and Prevention.
Additional Covid Deaths, Life Expectancy, and Expected per Capita Loss of Life by Age Group in the United States
Figure 3.2

43EEAG Report 2021
CHAPTER 3
current and future GDP more than they appear to do in standard national income accounts. The size of these level and change effects can be roughly gauged from the data displayed in Figure 3.4. In most countries, 45–50 percent of the population is in paid employment, and 15–20 percent is 5–19 years old.4 If the former are in education and their future incomes are well approximated by those of currently working individuals, accounting for the economic value of education would increase GDP by about a third. Of course, much depends on the age structure of the population, as well as on unemployment, and on features of the retirement system. The computa-
4 Students/population ratios would provide more accurate infor-mation but are not as readily available as enrollment ratios by age groups, which would need to be combined with detailed population age-structure data.
future income as paying attention to teachers who teach competently: not just the duration, but also the quality of education matters, and it is difficult to measure. The second is that the quality of students also matters: smarter students spend more time in better schools, and their income while working will be higher not only because of schooling but also because (whether because of their own innate ability or of their family background) they are smarter. At the national level, the quantity and quality of schooling contribute to increasing cognitive skills, which Hanushek and Wößmann (2008) find to be associated with income growth, just as they should be in theory. As for in-dividuals, so for countries correlation need not be causation. Productivity and growth are also strongly correlated with changes of indicators of governance quality, corruption, and other country characteristics determined in turn by politics and policies as well as by historical shocks to social capital.
Accounting for these factors in empirical work is possible but difficult, so estimates of the productiv-ity contribution of time spent at school vary widely (Belzil 2007). It is also difficult to assess the extent to which online learning can substitute classroom work. However, experts agree that the kind of learn-ing losses experienced during the spring 2020 lock-downs will reduce by about 3 percent all future labor incomes, as each month of missed education typically reduces all future monthly incomes by about 1 per-cent (Hanushek and Wößmann 2020; Psachoropoulos et al. 2020). On an undiscounted yearly basis, 40 years of 3 percent losses amount to 1.2 annual incomes. Even though the real interest rate hovers around zero for the foreseeable future, discounting this loss is appropriate because labor income is risky, and at the very least accounts for the possibility that an in-dividual may die or become unable to work. Hence, the expected discounted income loss from missed education plausibly amounts to about one year of lifetime income. Also, at the aggregate level, the dis-counted future productivity and GDP consequences of missing an entire school year have the same order of magnitude as current per capita GDP (Hanushek and Wößmann 2020).
Every month of a child’s missed schooling im-plies future income losses that are (roughly, and on average) equivalent in present value to about one month of their family’s per capita income. This is a large loss, perhaps surprisingly large until one re-alizes that production of education uses not only teachers and classrooms, but also the time and ef-fort of students. Because the cost and value of ed-ucational investments includes teacher wages and use of school facilities, which are in GDP, and the opportunity costs of students, which are not, ac-counting for education would increase the measured production and investment of an economy. This un-measured production is invisible both when it takes place and when it does not, so lockdowns decrease
Nigeria
Pakistan
India
BelizeMalawi
TurkeyThailand
Colombia
Iraq
EgyptUganda
PakistanGeorgiaGermany
United Arab EmiratesIranGhanaNetherlandsVietnamGhana
BangladeshChina
Timor-LesteGhana
Cambodia
Venezuela
Cambodia
IndonesiaTanzania
Colombia
Thailand
Sudan
Palestine
PakistanVenezuela
Austria
Nepal
Sri LankaVietnam
ChinaIndia
TurkeyUgandaColombia
Thailand
Sudan
Pakistan
ChinaPanamaRomania
Colombia
Thailand
Kuwait
Vietnam
Australia
MalawiColombiaThailand
Egypt
PalestineNigeria
Tunisia
NigerColombia
Ethiopia
Vietnam
LatviaAlbania
Malawi
Colombia
Serbia
Colombia
Vietnam
Colombia
0
2
4
6
8
10
12
14
2005 2006 2007 2008 2009 2010 2011 2012 2013 2014
© CESifoSource: Psacharopoulos and Patrinos (2018) database, available estimates of Mincerian private overall returns after 2005, all shown except South Africa, 2008 (18.7).
Additional Earnings Associated with an Additional Year of EducationAs a percentage of earnings foregone by not working at the initial education level
Figure 3.3
Share of population aged 5–19
Australia
Austria
BelgiumCanada
Chile
Czech Republic
Denmark
Estonia
Finland
France
GermanyHungary
Ireland
Italy
Japan
LatviaLithuania
Luxemburg
Netherlands
New Zealand
Norway
Poland Portugal
RussiaSlovak RepublicSpain
Sweden
Switzerland
United Kingdom
United States
12
14
16
18
20
22%
38 40 42 44 46 48 50 52 54%Share of population in paid employment © CESifo
Percentage of Age Group Most Likely to be in Education and Share of Employment in Total Population, 2017
Source: OECD.
Figure 3.4

44 EEAG Report 2021
CHAPTER 3
longer rather than just consume their lower income, and workers whose job was not just temporarily shut down but disappeared permanently may later go back to school and learn new skills. These choices, if un-constrained, tend to have similar implications at the margin for individuals who optimally choose to do a bit of each. To the extent that schooling choices later in life are optimal from the individual point of view, discounted future income gains from additional schooling should indeed be similar (as they are in the data reviewed above discussing lockdown education losses) to current opportunity costs in terms of earned income.
3.4 WHAT NEEDS TO (BUT MAY NOT) BE DONE
For societies facing the coronavirus crisis, it is point-less to wish the virus had not occurred, instead it is possible and useful to try and deal efficiently with the shock and to apportion or share its fallout ap-propriately. We argued above that loss of life and of economic welfare are both heavy and broadly similar for the generations affected by Covid-19, and that in-dividual reactions to some extent can buffer shocks. But this does not imply that their distribution is the best possible because, as usual, interacting individual choices may fail to achieve society’s efficiency and equity objectives.
An hour of videoconferencing is less productive and more tiring than an hour of in-person interac-tions, especially when sharing and discussing crea-tive ideas. For this reason, it is useful to people to be together when working and earning income, and also when learning and accumulating human capital. People also very much enjoy being together during their leisure hours. There are no payments among friends who drink or play soccer together, but in a pandemic, togetherness allows a free exchange of viruses as well as good vibes. Leisure, like working and learning, becomes less productive, and so does the service that helps people get together. Jobs dis-appear for restaurant and cafeteria cooks and waiters, for cinema operators and office cleaners, and many other relatively low-wage service workers. Because it is more fun to go out when others go out, and no fun if nobody else does, individual decisions generate network externalities and support both high and low togetherness equilibria. The high one is preferable if the only externality is through fun. If instead exter-nal contagion effects dominate fun effects, the low togetherness equilibrium is better but, just because no market payments are envisioned, interacting indi-vidual choices need not choose it.
Education, which is never left completely to mar-ket payments and family budgets, always confronts society with problems that during a pandemic are more dramatic and no easier to solve. Education dif-fers from market work and income in two respects. The first is that schooling not only improves individ-
tion, however, is not obviously biased by patterns along the per capita income dimension, probably the strongest determinant of schooling and work. In poorer countries, fewer young people are in school, but there are more of them and their income will in-crease more strongly than in richer countries, where more of the older ones are in higher education.
3.3 CURRENT AND FUTURE INCOME AND WELFARE LOSSES ACROSS GENERATIONS
The economic effects of Covid-19 are negative for all generations and most individuals, and obviously not to the same extent across and within genera-tions but they need not be particularly bad for the youngest population cohorts in 2020. If they are still in education, they are hit hard, because not learn-ing much during lockdowns has dramatic future in-come implications. Current income implications are equally dramatic, however, for adult owners of firms who cannot operate their production facilities and for adult workers who are partly or completely shut out of employment, such as waiters, trial lawyers, and (perhaps surprisingly) many medical doctors and nurses.5
Within generations of those of working age in 2020, the timing of the pandemic can be very con-sequential for people who lose a particularly large portion of their lifetime income if 2020 happens to be particularly important in their career. Athletes who were at their best this year may well be just a little bit too old for a gold medal in the postponed Olympics, for example. And just as during and after the Great Recession of 2008–09 (Rothstein 2020), so too will those entering the labor force during and after the 2020 pandemic fare worse than older and younger generations. Entering the job market during a crisis not only initially implies longer unemployment and lower initial wages, but also permanently worsens career prospects, not least by making it difficult to explore with job switches in the first few years of employment.
While the consequences of the current crisis are unavoidably bad, the economic welfare implications of lockdowns and social distancing are arguably smaller than it appears from current and expected future income loss calculations. Like furloughed work-ers, homebound students do not much enjoy their locked-down leisure time. Being at home is not a com-plete waste of time, however, and behavioral adjust-ments offset some welfare losses. Young individuals who miss schooling during the pandemics may later study or work harder, retire later, or stay in school
5 In the United States, the third quarter 2020 consumer expenditure on goods was only 2 percent lower than in the third quarter of 2019. Most of the – 14 percent decline of Services was accounted for by transportation services (– 39 percent), Recreation services (– 51 per-cent), and food services and accommodations (– 39 percent), but health care (– 20 percent) also declined very significantly. Data source: Bureau of Economic Analysis (2020).

45EEAG Report 2021
CHAPTER 3
cial assets. They may not only be biased by the role of individual ability in determining both education and wages, but also indicate that education of poor children cannot be financed at market rates by poor families, who cannot borrow at reasonable rates. Scholarships and subsidized borrowing are a possi-ble remedy, but public policies cannot always address the asymmetric information issues that hamper pri-vate financial markets: unfortunately, not only wealth but also ability to exploit educational opportunities are low for students from financially and culturally disadvantaged families.
3.4.3 What to Learn
Another eternal issue is highly relevant in the post-pandemic future and has been discussed by this report in recent years (EEAG 2013, section 3.4; EEAG 2016). Should post-primary education provide young people with generally useful human capital, as it typically does in English-speaking countries, or should it sort them into vocational tracks providing specific skills, as it tends to do in German-speaking countries?
There are pros and cons to both systems. Keep-ing all students together in “comprehensive” second-ary schools fosters social cohesion and can equip all workers with advanced general skills required by complex and fluid labor markets. Of course, family background is a key determinant of achievement even in very comprehensive educational systems: forcing students to test their academic skills need not ben-efit those hailing from culturally poor families, who may try and fail academic exams only to seek employ-ment without any certified skills. Tracked schooling ensures more immediate employability of individuals assigned to vocational tracks but tends to perpetu-ate and deepen socio-economic inequality (see Ozer and Perc 2020, for a recent review of issues and evi-dence). A broad-based education provides skills that are useful in a large variety of situations, and there is evidence that it is more useful in adult life than vocational education (Brunello and Rocco 2017). In labor markets faced with structural change, highly specific vocational training easily finds you the first job but leaves you more vulnerable than “learn-to-learn” general education.
The advantages and disadvantages of educational approaches depend on circumstances. Vocational ed-ucation has been popular among policymakers since the Great Recession, when it was partly accounted for by a focus on youth employability. And advan-tages and disadvantages affect different people differ-ently, so there is intense and legitimate disagreement on these issues. The elite strata of society generally favors vocational education for the masses and ac-ademic education for themselves, preferably in ex-clusive institutions that foster personal ties among future leaders.
ual production skills, but also equips them with cru-cial social skills and society with social capital. For every member of society, it is important that all oth-ers know how to behave in social and market interac-tions: well-educated societies are more productive too because of such external effects which are strongest at elementary level, making it efficient for primary schooling to be mandatory and free, and making it particularly damaging for it to be missed during lock-downs. The second is that while the income resulting from production of market goods and services may be consumed rather than invested in physical or knowl-edge capital, learning activities are automatically in-vested in human capital (i.e., future discounted labor income), an investment is particularly appropriate at times when much debt is being accumulated.
3.4.1 Learning, Why Now?
Students and their families may not respond appro-priately to lockdowns and social distancing, both be-cause they disregard the external effects of primary education and because rewards to study, while simi-lar in size to those of work, are timed very differently. The reward of work arrives in monthly paychecks and can be consumed immediately; the reward of learning arrives in the distant future and can be consumed sooner only by borrowing. When social distancing makes education more difficult, students should but might not exert more study effort. If exams are ran-dom or disappear altogether, and adulthood is lived out in unpredictably difficult circumstances, young people may well refrain from studying as hard as they should for their own good. Delayed gratification is always less desirable than immediate gratification, but more so during times of crisis when the future is heavily discounted, to an extent that depends on individual psychological attitudes which in turn de-pend on life histories and circumstances. Parental background is important, and all the more so when encouragement and adaptability are needed to face a once-in-a-century crisis. The children who prefer to eat a marshmallow immediately than wait 15 minutes and eat two are often those who come from fam-ily and social situations that lead them to mistrust promises and grab opportunities as they arise and become divorced high-school dropouts or develop drug habits, while their more patient classmates live less disappointing adult lives.6
3.4.2 Funding Education
It is harder for children from poorer families to afford the financial cost of their education in the pandemic, and it always is. The 8-9 percent estimates of private rates of return on education are in fact suspiciously higher, on a risk-adjusted basis, than those of finan-6 Mischel (2015) provides an interesting and accessible review of this evidence.

46 EEAG Report 2021
CHAPTER 3
professions, notably in primary schools, temporary support to school staff could target male recruits. This would let children witness an increased masculine presence in care professions, and give men experience in jobs they may not have considered before.
Financial difficulties need not hamper education in rich countries where monetary and fiscal policies tend to ease funding of all investments but might in poor countries and in poor segments of rich-country societies. Family income and learning inequalities are even more strongly related than usual during lock-downs, when high-skill individuals work from home, as business owners run companies on Teams and psychologists consult on WhatsApp, while low-skill workers such as supermarket cleaners or delivery staff had to choose between their health and their income. Although income losses have occurred at all levels of education, they have been particularly important for those at the bottom of the skill distribution. And chil-dren of low-wage service workers can be shut out not only of school buildings but also of online instruction because of inadequate Internet access and lack of expertise (UNICEF 2020).
Policy should ensure equitable access to digital equipment and physical study spaces, both of which hamper the home-learning opportunities of underpriv-ileged students. The corona crisis has made evident that many students do not have access to adequate learning environments outside the school. This af-fects their capacity to learn even in normal times. The resulting education inequalities exacerbate those already present across central, suburban and periph-eral geographical school locations in many countries. Schools or other educational institutions (libraries) should reconsider their potential for offering learn-ing spaces outside standard hours. Governments should grant children from low-income families ac-cess to schools and computer rooms and provide both equipment and training to ensure that disadvantaged students can benefit from remote learning activities.
3.5.2 Toward a New and Different Normal
Previous issues and trends will be amplified and has-tened by the crisis and post-crisis trajectory. Any cri-sis shortens and narrows the horizon of political in-teractions and tends to make previous populist and authoritarian political tendencies more extreme. In the aftermath of the coronavirus crisis, polarization of political attitudes will likely be reinforced by em-ployment and wage polarization trends, driven in past decades by technological and trade developments, which can only be strengthened by lower consump-tion of leisure and office services and widespread adoption of remote electronic work, which implies relative income losses for unskilled workers substi-tuted by machines that boost the productivity of skilled workers. To ensure an efficient transition to permanently more computerized industrial produc-
3.5 HOW POLICY CAN HELP EDUCATION DURING AND AFTER THE CORONAVIRUS CRISIS
During lockdowns, welfare is lower because work, study and leisure all decline. As discussed in Chap-ter 2, policy should make unavoidable and permanent welfare losses as small as possible in the aggregate, and even out individual welfare losses.
3.5.1 Short-term Emergency Policy
Because the life-loss risk is similar for younger and older people, there is no reason to enforce different rules across age groups. But different activities are differently hampered by distancing. The externali-ties generated by leisure together make it advisable to restrict in-person interactions and force individu-als to spend leisure time alone or in a small family. This makes leisure less enjoyable, as is appropriate to support efficient time-allocation of unavoidable wel-fare losses when work and study are also conducted on small screens, and less productive. Both working and learning should instead be allowed and encour-aged and be supported by suitable regulation and communication infrastructures to reduce in-person interactions and slow down the spread of contagion.
Special attention to schooling is warranted be-cause investment in human capital fosters growth and eases the burden of accumulated debt, and because it usually brings many people together in indoor spaces likely to spread contagion. Different restrictions are warranted in different situations. Old-age retirement facilities deserve particular attention not because their residents are elderly but because they, like prison inmates or sailors on warships, live together in large groups, where contagion spreads easily. Customers of schools are younger, but in order to prevent virus transmission and contagion at home who they also need to be distanced from each other, protected and disinfected when together.
Keeping schools open is highly desirable, how-ever, particularly at the primary level: not only be-cause teaching young children remotely can be im-possible, and even when children can use computers, remote learning contributes little to their socializa-tion, but also because keeping schools open for young children who cannot be left home alone makes it pos-sible for their parents to work. To ensure social and economic resilience during pandemic emergencies, primary schools should be kept open throughout the workday. This requires appropriate fiscal and health security policy measures. New temporary workers should be hired to help teachers and other perma-nent workers manage entry and exit, breaks and meal-times, and school personnel should have the same priority for testing and vaccination as medical person-nel in order to ensure that they are able (and willing) to continue working and reassure parents who fear contagion. To prevent further feminization of teaching

47EEAG Report 2021
CHAPTER 3
traditional fashion, because it is even harder to pay attention to a screen than to a live teacher if both recite a boring list of notions, but it offers innova-tive instruments for interactive delivery of new types of basic broad-based competencies. After the crisis, schools should experiment with new techniques, in-cluding those implemented during the emergency, and online facilities can let schoolteachers improve their curricular and communication skills.
3.5.2.2 What to Learn in High School
In the new normal, better online education facilities can lower the cost and increase the accessibility of high-quality education. Learning would improve if classroom work supplemented a well-prepared online course, to be combined with periods of in-class inter-action that can be shorter in middle and high schools than at the elementary level, and as they were before the coronavirus crisis.
Not only how, but also what to learn requires ad-justment. To face the challenging times ahead, edu-cation should teach young people to think, adapt, learn new skills, solve new problems. This is relevant beyond primary education. Mechanically learning how to operate or fix a machine makes young people em-ployable when that specific machine is used in avail-able jobs, but flexibility is more important when the future is particularly hard to predict. A new normal will come, but it is doubtful whether it will demand diesel mechanics, or designers of electric planes, or capable warehouse operators for online shopping websites, or (in a worst-case scenario of social and economic collapse) competent stonecutters in support of primitive agriculture.
Practical vocational training remains important, but in times of accelerating, unpredictable structural change and moribund firms, it should be enhanced by cognitive skills, training in problem-solving, and logi-cal preparation for learning. All young people should be motivated to learn general skills, applicable be-yond a certain firm or sector, and equipped to learn new skills and face future challenges. It does help to have practical experience in a working environment, and well-structured vocational training programs al-ready exist in Germany and some other countries. To prepare for a future where flexibility and ability to learn can only be of increasing importance, however, practical training should not be too narrow.
3.5.2.3 Beyond School
Education takes place also later in life, and lifelong education is particularly important for workers with vocational schooling. The relevant issues are again familiar but more challenging in times of structural change. During a lockdown, leisure service workers must be idle, but office and factory workers can still produce using socially distanced technology. In the
tion and commerce and learning, policy should in the future not just support consumption, but help markets face and implement the necessary struc-tural adjustment.
3.5.2.1 Basic Education
The most convincing evidence that education in-creases productivity is that generated by variation of compulsory schooling mandates (see Hampf 2019, and references therein). Education, especially at the elementary level, fosters networking and builds social capital. The implications of compulsory non-school-ing or remote learning during lockdowns are plau-sibly symmetric. Prolonged social distancing may have severe negative psychological impact on many people who crave such interaction, and on society as a whole. This is a particularly important issue for people in their formative years. Just as cumula-tive changes in the new economic normal are hard to predict, so are these other less tangible costs to society. Once people get used to not interacting in person or work or educate themselves remotely, the way we live changes permanently, and differently for different people.
One important issue is that of recovering the ed-ucation missed by younger people during the pan-demic. Kenya adopted the radical solution of just erasing a full school year and accepting a permanent loss of 2020 in all young people’s lives.7 For manda-tory education, repeating a year may be better than low-quality education during lockdowns followed by difficult learning by ill-prepared students in the fol-lowing years of the educational program. If it were possible to stop aging by decree, skipping 2020 would just delay work and retirement as well as education. But aging goes on relentlessly: lives will not last longer, and brains gradually lose ability to learn. It would be better to make up lost time by extending mandatory school time, with shorter vacations and/or longer school days and weeks, depending on each country’s current organization.
A crisis is bad luck, but luckily comes with oppor-tunities to change. At all education levels, adopting new ways of teaching and learning can help make up lost ground. In times of anxiety and possible despair students need motivation, and time spent at school-ing is wasted if students are not interested in what they learn. One solution is problem-based learning where students need to recognize a problem in real life and work out a solution in competing groups, pre-senting their findings and being gently challenged by the teacher. This requires much more thinking on the part of both students and teachers but can be done remotely as well as in person. Remote learn-ing is not new but is now being taken up much more broadly than before. It is not motivational if done in
7 See the New York Times (2020).
48 EEAG Report 2021
CHAPTER 3
students can only interact online with teachers and are less likely to move internationally.
The future will likely see more remotely sup-plied education and more concentrated enrollment in fewer institutions, but much remains to be seen. It is hard at this time to formulate policy implications for a higher education environment characterized by a new mix of qualities, stronger economies of scale, and a smaller role for networking and social con-nections. Public policy will plausibly continue to fulfil its two main roles, that of assessing and certifying the quality of higher education, and that of financ- ing its provision (and fundamental research, a com-plementary public good). The first may be more dif-ficult as exams become less reliable, and personnel and facilities become less important and more dif-ficult to assess. The second may not be as relevant, as remote learning is less expensive and oppor- tunity costs are low: there is little else for youth to do in 2020, so enrollment has increased in many public universities in Continental Europe as well as in the United Kingdom, also as a result of re- duced enrollment in the United States and revised entrance exam scores in light of less reliable assess- ments.
3.5.2.5 Funding Education Policies
During the emergency, public debt subsidizes con-sumption and investment, but it will soon be time for fiscal policy to steer a suitable path to a new nor-mal. If students have shorter summer vacations or work more hours to make up the shortfall in human capital resulting from the crisis, so should teachers, who need to be paid accordingly because they are working harder. Because this increases the future income of currently young generations, it is appro-priate to pay for this and other education-boosting measures with public debt to be repaid by the rev-enue of income taxes when current students enter the workforce.
Other funding sources, such as retirement cuts, would redistribute welfare across generations. As dis-cussed in Chapter 2, a suitable source of funding for educational investments might be found if taxes are used to address global warming and not subsidies. Just as hiring teachers as a solution to school prob-lems appears an attractive concept, so is throwing money at global warming politically appealing. But while the green orientation and the name itself of the Next Generation EU recovery plan is advertised as a gift to currently young generations, subsidies might mostly keep aircraft engineers well fed while toying with electric plane models, and if so, the currently young will one day be ignorant, jobless and heavily indebted (albeit in a balmy green environment).
It will also be important to address the issue, discussed in detail by García-Peñalosa and Wass-mer (2016), that public education funding may ben-
aftermath of the pandemic, office and factory jobs will disappear more quickly than along previous techno-logical trends, however, workers will need to retrain, either within the firm or between jobs. If leisure-sup-port and other jobs disappear permanently, suitable retraining should be a condition of wage support or unemployment benefits.
Adapting human capital to labor demand is essential to make the labor market more fluid. Non-conventional learning can be useful in deliver-ing this type of lifelong education. Training programs and targeted policies can help but need to focus on sectors where firms are seeking to hire (such as some health and IT service providers; not flight attendants and pop-concert technicians). Access to retraining should be flexible, allowing individuals and employ-ers to respond to country- and sector-specific market signals about which new skills should be learned. To integrate new labor market entrants, the standard and much-discussed policy interventions meant to encourage job creation for the young are arguably more appropriate after the pandemic, when uncer-tainty may lead firms to prefer poaching experienced workers from each other rather than training inex-perienced workers. Governments should ensure that the price of labor reflects the costs faced by firms, as well as external effects not accounted for by hiring decisions. To this end, it can be advisable to reduce net labor costs for firms that hire labor-market en-trants, in the form of reduced social security contri-butions, minimum wage exemptions or, in countries where contributions are low and minimum wages not binding, wage subsidies. Facilitating marginal employment is also desirable, as such experiences can be a first step into the labor market with positive medium-term effects for individuals.8 However, all such measures are fiscally wasteful if subsidies and exceptions go to jobs that would have been created anyway or prevent creation of jobs for non-subsi-dized workers or sectors.
3.5.2.4 Universities
Formal higher education, imparted to young adults who choose not to enter the labor market after fin-ishing high school, is optional and should generally be left up to the individual. The coronavirus crisis, however, implies that these choices are made in a very different environment. Existing educational mod-els are heavily challenged by distancing rules. It is hard for elite institutions to justify expensive tuition, justified by pleasant campus facilities and valuable personal interactions among young people who will in the future be political and industry leaders, when
8 For example, allowing marginal employment for those receiving unemployment benefit in Germany has not surprisingly been found to result in an increased job-finding probability for long-term unem-ployed individuals and to lead to more stable post-unemployment jobs (Caliendo et al. 2016).

49EEAG Report 2021
CHAPTER 3
EEAG (2016), “The EEAG Report on the European Economy 2016: What Next?”, by T. M. Andersen, G. Bertola, J. Driffill, H. James, H.-W. Sinn, J.-E. Sturm and B. Uroševic, CESifo Munich, Munich, 70–84.
García-Peñalosa, C. and É. Wasmer (2016), “Preparing France for the Increasing International Mobility of Talents”, Les notes du conseil d’ana-lyse économique, no 31 CAE031_MobilitéTalents (UK).indd.
Hampf, F. (2019), “The Effect of Compulsory Schooling on Skills: Evi-dence from a Reform in Germany”, CESifo working paper No 313.
Hanushek, E. A. and L. Wößmann (2008), “The Role of Cognitive Skills in Economic Development”, Journal of Economic Literature, 46(3), 607–668.
Hanushek, E. A. and L. Wößmann (2020), “The Economic Impacts of Learning Losses”, OECD Education Working Papers No. 225.
Mischel, W. (2015), The Marshmallow Test: Why Self-Control Is the En-gine of Success, New York: Little, Brown Spark.
O’Driscoll, M., G. Ribeiro Dos Santos, L. Wang et al. (2020), “Age-specific Mortality and Immunity Patterns of SARS-CoV-2”, Nature, https://doi.org/10.1038/s41586-020-2918-0.
Ozer, M and M. Perc (2020), “Dreams and Realities of School Tracking and Vocational Education”, Palgrave Communications 6, 34.
Psacharopoulos, G., V. Collis, H. A. Patrinos, and E. Vegas (2020), “Lost Wages: The COVID-19 Cost of School Closures”, GLO Discussion Paper 548.
Psacharopoulos, G. and H. A. Patrinos (2018), “Returns to Investment in Education: A Decennial Review of the Global Literature”, World Bank Policy Research WP S8402.
Rosefielde, S. (1983), “Excess Mortality in the Soviet Union: A Reconsid-eration of the Demographic Consequences of Forced Industrialization 1929–1949”, Soviet Studies, Vol. 35, No. 3 pp. 385–409.
Rosen, S. (1988), “The Value of Changes in Life Expectancy”, Journal of Risk and Uncertainty Vo.1, No. 3 pp. 285–304.
Rothstein, J. (2020), “The Lost Generation? Labor Market Outcomes for Post Great Recession Entrants”, NBER Working Paper No. w27516.
Schelling, T. C. (1968), “The Life You Save May Be Your Own”, in: Prob-lems in Public Expenditure Analysis, edited by Samuel B. Chase, Jr., 127–62, Washington, DC: Brookings Institution.
Spiegelhalter, D. (2020), “Use of “Normal” Risk to Improve Under-standing of Dangers of COVID-19”, BMJ 2020;370:m3259, http://dx.doi.org/10.1136/bmj.m3259.
The New York Times (2020), Kenya’s Unusual Solution to the School Problem: Cancel the Year and Start Over, https://www.nytimes.com/2020/08/05/world/africa/Kenya-cancels-school-year-coronavirus.html (accessed January 4, 2021).
UNICEF (2020), Unequal Access to Remote Schooling Amid COVID-19 Threatens to Deepen Global Learning Crisis, https://www.unicef.org/press-releases/unequal-access-remote-schooling-amid-covid-19-threat-ens-deepen-global-learning (accessed January 4, 2021).
United Nations (2020), Policy Brief: Covid-19 in an Urban World, July.
efit other countries when skilled workers migrate. In theory, the problem could be addressed by requiring skilled migrants or the receiving country to refund education costs, like East Germany used to do. In practice, the free-movement-of-persons principle allows skilled labor to move within the EU, which in this and other ways combines integrated markets and national policies in a way that can trigger dam-aging race-to-the-bottom tensions as well as bene-ficial competition (Sinn 2003). The coronavirus crisis has dramatically reduced international mobility for students and graduates. But it has also introduced policy instruments that can support mobility and prevent concerns about such funding spillovers: if the common debt issued in the Next Generation EU framework is used to fund education and is repaid in proportion to future income, it automatically implies transfers from countries that offer high incomes and that attract migrants to countries where low incomes induces outmigration. This gives stronger incentives for each country to fund domestic higher education, whether or not such financing is mandated by spend-ing rules.
Financing educational investment with public debt is appropriate if that investment does pay for itself. Public debt, however, may appear to be a cos-tless solution even when it is actually expensive and not a solution. Money is necessary, but insufficient for solving problems that may just “eat” the money and continue to exist. Improving schools requires re-sources in the pandemic as much as ever but spend-ing more on teachers or facilities or longer education may not suffice to generate the growth needed to repay the additional debt. Low-quality education can be expensive yet fail to produce much of the growth in skills needed to sustain economic growth. As outlined above, teaching methods and techniques, curricular content, inclusiveness, and resilience of educational systems need to be revised to preserve and improve their quality in the challenging times ahead.
REFERENCES Belzil, C. (2007), “The Return to Schooling in Structural Dynamic Models: A Survey”, European Economic Review, 1059–105.
Brunello, G. and L. Rocco (2017), “The Effects of Vocational Education on Adult Skills, Employment and Wages: What Can We Learn From PIAAC?”, SERIEs 8,315–343.
Bureau of Economic Analysis (2020), National Income and Product Accounts, https://apps.bea.gov/iTable/iTable.cfm?reqid=19&step=2#re-qid=19&step=2&isuri=1&1921=underlying (accessed January 4, 2021).
Caliendo, M., S. Künne, and A. Uhlendorff (2016), “Earnings Exemptions for Unemployed Workers: The Relationship Between Marginal Employ-ment, Unemployment Duration and Job Quality”, Labour Economics, vol. 42, issue C, 177–193.
Case, A. and A. Deaton (2020), “Deaths of Despair and the Future of Cap-italism”, Princeton University Press.
Chen, L. C., F. Wittgenstein, and E. McKeon (1996), “The Upsurge of Mor-tality in Russia: Causes and Policy Implications”, Population and Devel-opment Review Vol. 22, No. 3 pp. 517–530.
EEAG (2013), “The EEAG Report on the European Economy 2013: Re-balancing Europe”, by G. Bertola, J. Driffill, H. James, H.-W. Sinn, J.-E. Sturm, and Á. Valentinyi, CESifo Munich, Munich, 73–93.

50 EEAG Report 2021
CHAPTER 4
crisis and the European debt crisis was held back by insufficient investment:
“… not only are we faced with a serious invest-ment gap; we are caught in an investment trap. When I talk to investors, they all agree that Eu-rope is an attractive place to invest in. But then I look at the figures, they tell a different story: investment levels in the EU are down to EUR 370 billion below the historical pre-crisis norms. While investment is taking off in the US, Europe is lag-ging behind. Why? Because investors lack confi-dence, credibility and trust” (Juncker 2014).
As a consequence, Jean Claude Juncker made sup-porting investment in Europe a central part of the po-litical agenda of the European Commission, leading to the Juncker Plan, which aimed at mobilizing EUR 315 billion for additional public and private investment in Europe. Whether the Juncker plan was a success or a failure is disputed,1 and measuring its impact is not easy because estimating how investment would have evolved without the plan is challenging. But as will be discussed below, it is a fact that overall private investment has recovered between 2014 and 2019.
In coming years, Europe may easily find itself in a similar situation. The recession caused by the coronavirus pandemic differs in many ways from the financial crisis; at the same time, it cannot be taken for granted that investment will recover quickly, given the fallout of the crisis. A recovery of investment is required to generate economic growth, and without substantial growth it will be difficult to overcome the current crisis, in particular to deal with the high levels of public debt accumulated during the recession. This raises the question of whether economic and fiscal policy can and should support investment and if so, which instruments should be used.
This chapter is structured as follows. The next section describes how business investment in Europe evolved before and during the coronavirus crisis. Sec-tion 3 discusses policies aimed at supporting invest-ment during the crisis. Section 4 turns to medium- and long-term perspectives for business investment. Section 5 concludes.
4.2 HOW HAS INVESTMENT EVOLVED BEFORE AND DURING THE CORONAVIRUS CRISIS?
1 While the European Commission concluded, perhaps unsurpris-ingly, that the plan was a success, claiming it created 1.1 million jobs and increased EU GDP by 0.9 percent in 2019 (European Commission 2020), the European Court of Auditors (2019) argued that these claims were overstated and concluded changes had to be made to ensure the success of the plan.
4.1 THE ROLE OF BUSINESS INVESTMENT
As the preceding chapters have shown, investment in education and different types of public and social capital are of key importance for future prosperity and inclusion. This chapter turns to private investment, in particular business investment. In recessions, private investment usually declines sharply. The economic recovery and the medium- to long-term prospects of companies and the economy as a whole depend strongly on the ability and the willingness of firms to invest. For many firms, recessions are periods where production capacities are not fully used. While this is a disadvantage, it may also offer an opportunity to innovate. For instance, if more time is available in a recession because current business is slow, firm own-ers and employees may use that time productively to think about the sustainability of their business model, invest in research and development as well as training for acquiring new skills, and prepare for the economic recovery. Once recovery is in sight, companies may need to increase their investment spending to im-plement the new plans developed during the down-turn. However, all of this is only possible if companies have the resources to make investments despite the recession.
In addition to its importance for achieving an eco-nomic recovery in the short term, business invest-ment is also key for long-term economic growth and productivity. During the years of the financial crisis, investment in Europe declined and remained weak for a long time. Therefore, the view is widespread that Europe needs to do more to attract and encourage investment.
The insight that a sustained recovery from an eco-nomic crisis requires investment is not new. In 2014, European Commission President Jean Claude Juncker argued that the economic recovery from the financial
Business Investment
02468
1012141618
2000 2002 2004 2006 2008 2010 2012 2014 2016 2018
Eurozone Germany France Italy Spain
Source: Eurostat (2020).
Business Investment
% of GDP
© CESifo
Figure 4.1

51EEAG Report 2021
CHAPTER 4
slowly. Figure 4.1 illustrates the development of busi-ness investment as a percentage of GDP over the last two decades for the Eurozone as a whole and selected member states. The most striking decline in invest-ment during the financial crisis took place in Spain, where business investment fell from 15 percent of GDP before the financial crisis to 11 percent in the years 2009-2011. Investment declined much faster than GDP. However, until 2019, investment recovered and reached a level just under 15 percent of GDP, ap-proximately the level before the financial crisis. In France and Germany, investment also recovered. This is also true for Italy, albeit to a lesser extent. In the Eurozone as a whole, business investment reached almost 14 percent of GDP in 2019, more than in any year since 2002.
Of course, the steady increase in business invest-ment in the Eurozone came to an end in 2020. The recession caused by the coronavirus pandemic has in-duced firms to spend less. How drastic is the decline? Figure 4.2 illustrates the development of quarterly investment spending for several European countries in the second half of 2019 and in the first three quar-ters of 2020. While investment has dropped practically everywhere, the extent of the decline is very different across countries. The decline in investment in France and in particular Belgium was much more severe than in Germany and the Netherlands. Investment in Fin-land has remained almost unchanged. This reflects that these countries were affected differently by the pandemic and, accordingly, had different shutdown intensities. But other factors play a role as well. These include different stimulus policies aiming at stabi-lizing the economy as well as different sectoral and corporate structures.
Figure 4.2 also compares the development of investment spending in the coronavirus crisis with investment during the financial crisis 2008 and 2009. In all countries considered here, the decline in invest-ment in the financial crisis was more gradual, but it continued over many quarters. During the coronavirus crisis, the sharp decline in the first and in particular the second quarter in 2020 was followed by a notable recovery in the third quarter of that same year. This is certainly a consequence of the fact that many projects were simply interrupted during the shutdowns in the spring. However, whether the recovery of investment will continue in the fourth quarter is an open ques-tion. The second wave of the pandemic has led to a second round of shutdowns. This is likely to slow down economic activity in general, including invest-ment. At the same time, the improved prospects for a vaccine will boost confidence and probably invest-ment spending as well.
Which sectors and which types of firms contribute most to the decline in investment? It is a key charac-teristic of the coronavirus crisis that it affected dif-ferent sectors of the economy as well as companies within sectors very differently. While travel, tourism,
In Europe, the decade before the coronavirus crisis was marked by the fallout of the financial crisis and the Eurozone debt crisis. It is a widely discussed fact that investment declined throughout Europe dur-ing the financial crisis and then recovered, but only
707580859095
100105
-2 -1 0 Q1 Q2 Q3 Q4
Financial crisisCoronavirus crisisFrance
EUR million
Private Sector Investment Spending: Financial Crisis vs. Coronavirus Crisis
707580859095
100105
-2 -1 0 Q1 Q2 Q3 Q4
GermanyEUR million
707580859095
100105
-2 -1 0 Q1 Q2 Q3 Q4
NetherlandsEUR million
707580859095
100105
-2 -1 0 Q1 Q2 Q3 Q4
BelgiumEUR million
707580859095
100105
-2 -1 0 Q1 Q2 Q3 Q4
FinlandEUR million
Notes: Quarterly data, starts Q1 2008 (financial crisis) and Q3 2019 (Coronavirus crisis).Source: OECD (2020a). © CESifo
Figure 4.2

52 EEAG Report 2021
CHAPTER 4
tors mostly affected by the crisis. The IMF estimates that in some sectors up to 40 percent of all jobs in SMEs are at risk, four times as many as in a scenario without the crisis (see Figure 4.3).
What does this imply for investment? It is plausi-ble that the more limited access of SMEs to financing will imply that they find it more difficult to maintain investment during the crisis. So far, little disaggre-gate data on business investment after the outbreak of the crisis is available. The survey data from Euro-pean companies summarized in Figure 4.4 suggests that the impact of the crisis on investment of small versus large companies is rather different in different countries. The EU average suggests that the impact on small companies is slightly larger because the decline in investment small firms expect in 2020 exceeds that of large firms.
However, this pattern does not apply to all countries. In Germany for instance, the decline in investment expected by the firms in 2020 is much stronger for large companies. This is not necessarily incompatible with the view that SMEs are more of-ten credit constrained than large firms. Large firms may reduce their investment for reasons other than credit constraints.
This is confirmed by the data in Figure 4.5. It il-lustrates insights from survey data for German firms about credit negotiations with banks. During the cri-sis, a growing number of firms of both types reported to have applied for credit (not reported in Figure 4.5). The share of firms experiencing a restrictive position of their banks in these negotiations is larger for SMEs compared to large firms, both before and during the current crisis. But during the crisis the gap has be-come larger. While banks have become less restrictive in providing credit for large companies in the third quarter of 2020, SMEs have experienced an increase in restrictions.
The observation that SMEs face greater financing difficulties when credit conditions tighten is a pattern which is well known from earlier crises (see e.g., Ar-tola et al. 2011).
Overall, this data suggests that, in terms of eco-nomic policy responses, governments should worry about the impact of the crisis on all types of firms, not only the smaller ones, even if the smaller firms are widely seen to be more vulnerable to financing constraints.
4.3 PUBLIC POLICIES AND BUSINESS INVESTMENT DURING THE CRISIS
How should economic policy react to the issue of declining business investment in the current cri-sis? The appropriate policy depends on the reason for subdued investment. If companies do not invest because they are liquidity constrained or other as-pects of capital markets are not working properly, a case can be made for government intervention in
certain types of retail, hotels, restaurants and cul-tural events were hit very hard, other sectors of the economy were much less affected or even benefited, the last including in particular sectors and companies with digitized business models. Regarding types of companies, the concern is widespread that in particu-lar small- and medium-sized companies (SMEs) will find it difficult to deal with the crisis because their financial reserves as well as their access to financing is often more restricted than that of large companies. This applies in particular to SMEs operating in the sec-
0 10 20 30 40 50
Accommodation & FoodAdministration
AgricultureArts & Entertainment
ConstructionEducation
Electricity & GasHuman Health & Social Work
ITCManufacturing
MiningOther Service
Professional & ScientificReal Estate
Transport & StorageWater & Waste
Wholesale & Retail Covid-19, WEO baselineNo Covid-19
Share of Jobs at Risk in Small and Medium-Sized Enterprises in Different SectorsPolicy scenarios
Source: IMF (2020). © CESifo
Figure 4.3
-20
-10
0
10
20
30
2019 2020 2021 2019 2020 2021 2019 2020 2021 2019 2020 2021 2019 2020 2021
<250 employees ≥250 employees
Source: EU Investment Survey, Oct/Nov 2020.
Investments and Investment Expectations in Manufacturing IndustryChange in the value of investments by company size, compared to previous year
© CESifo
%
European Union Germany France Italy Sweden
Figure 4.4
0
5
10
15
20
25
01/2019 03/2019 01/2020 03/2020
Large Firms Small and medium-sized Enterprises
Source: ifo Institute Business Surveys.
Share of Firms Reporting Banks are Restrictive in Providing CreditGermany
%
© CESifo
Figure 4.5

53EEAG Report 2021
CHAPTER 4
it only applies to firms incurring losses in 2020 but which were profitable and paid taxes in 2019. Just as with accelerated depreciation, the advantage of loss carryback is that its fiscal cost is relatively small. Without loss carryback, losses incurred in 2020 would be carried forward and reduce tax payments in fu-ture years.
Many countries allow firms to set current losses against past profits only to a limited extent. Others allow losses to be carried forward only. For instance, before the crisis, loss carryback in France and Ger-many was allowed for one year only and only up to a maximum of one million euros. During the crisis, the ceiling was lifted to five million euros, which still excludes many medium- and large-sized firms. As a response to the crisis, loss carryback was also ex-tended in the Czech Republic, Norway, Poland and the United States (OECD 2020b, p.15).
One objection against providing financial help to firms states that this help should not go to firms that use international tax planning opportunities to avoid paying taxes. Poland, France, Denmark and Belgium have introduced legislation to deny crisis support to companies with a presence in certain tax havens (CNBC 2020). Companies that avoid taxes during boom times and apply for tax-financed support during the current crisis, for example, should be criticized. How-ever, denying them help seems difficult to implement in reality. As long as international tax planning takes place within the rules of the tax law, it seems prob-lematic to exclude firms from support just because they have a presence in a country classified as a tax haven, a perfectly legal activity. In this regard, the choice of support instruments may again be impor-tant. For instance, extending tax loss carryback only helps firms that have paid taxes during the previous year. Those who have shifted their profits to other countries do not benefit. In this case, no special meas-ure to exclude firms with aggressive tax planning are needed.
Another concern about measures providing li-quidity to firms during times of financial crisis is that this support may help firms who do not have a via-ble business model. This is referred to as the zombie firm problem. Keeping these firms alive may not only be a waste of tax money, and may also undermine the development of viable firms by keeping valuable resources such as capital or employees away from them. While the zombie firm problem is a drawback for policies supporting firms during economic crises, its policy implications are not straightforward. The main challenge is that, in times of crisis, which are characterized by exceptional circumstances and high uncertainty, it is difficult to determine which firms are viable and which are not. One way of trying to avoid supporting zombie firms is to make support condi-tional on private investors or banks bearing part of the risk; this is one of the reasons why loan guaran-tees typically cover less than 100 percent of the loan,
capital markets. Direct loans by state-owned banks, loan guarantees or equity injections are widely used instruments. Many countries have used these instru-ments after the outbreak of the coronavirus crisis. The IMF reports that the advanced economies in the world have made available financing support to com-panies in different forms, amounting to 11 percent of their GDP (IMF 2020, p.4). It should be noted, though, that financial support in the form of loans may not be enough. If companies are over-indebted, many need equity rather than debt to avoid bankruptcy. In this case, one would expect private creditors to restruc-ture the company’s debt through haircuts on loans or by converting debt into equity. However, in times of crisis, this may be difficult. In particular, corporate debt restructuring may create problems for banks. Therefore, private debt restructuring may be consid-ered too risky during a recession. Even if there is no threat of bankruptcy, high levels of debt may prevent firms from investing and developing properly because of the debt overhang problem.
Limited access to finance and debt overhang are not the only reasons why investment may need public policy support during a crisis. To some extent, launch-ing an economic recovery is a coordination problem. If enough companies in the economy expect the re-covery to begin and therefore start spending more to invest and build up inventory, these very actions may trigger economic recovery. In contrast, if all compa-nies expect the recession to continue, it probably will because firms spend little and do not hire workers. Given this, fiscal policy may be needed to kickstart a recovery.
Which instruments are available to governments, besides the direct provision of loans, credit guaran-tees or equity? Tax policy offers other instruments. One way of providing financing through the tax sys-tem is to introduce accelerated depreciation or even immediate write-offs for investment spending. This can facilitate investment, but mainly occurs through improved incentives to invest. Whether accelerated depreciation helps credit-constrained firms in an economic crisis is less clear because it will only lead to immediate tax savings if the firm is profitable and if the impact of accelerated depreciation on taxable profits affects current tax payments. However, in a crisis, many companies incur losses. In addition, accelerated depreciation is not very targeted and benefits all companies that invest, even those who are not affected by the crisis. As explained above, it is an important characteristic of the coronavirus crisis that it affects different firms and sectors very differently.
A more effective and targeted instrument for sup-porting firms is an extension of tax loss carryback. If firms can set losses incurred in 2020 against taxable profits made in 2019, they can be given an immedi-ate tax rebate, which provides liquidity and boosts equity. It is also a very targeted instrument because

54 EEAG Report 2021
CHAPTER 4
national importance. For instance, the German gov-ernment provided financial support through the ac-quisition of an equity share in Lufthansa of EUR 6 billion. In addition, the government provided loans amounting to EUR 3 billion. Along the same lines, the French government has provided support to Air France and Italy intends to provide financial help to Alitalia. These airlines are not necessarily typical zombie firms—although some of them have had dif-ficulties for some time. Their business model will not disappear entirely. But it is plausible that the sector will need to scale down its size because demand in particular for business travel is expected to decline after the coronavirus crisis, which implies that the airline sector will need to consolidate, raising the question of whether the consolidation process will take place under conditions of fair competition. Un-derstandably, other airlines who do not receive help from their governments do not think so and complain. For instance, with respect to Lufthansa, Ryanair CEO Michael O’Leary stated:
“This is a spectacular case of a rich EU member state ignoring the EU treaties to the benefit of its national industry and the detriment of poorer countries.”
Since the market for air travel is far from being a perfectly competitive market where firms are price takers, support provided by one country to domestic companies may have a significant and direct negative impact on firms located in other countries. If these firms do not receive support, competition is distorted. If they do, there is a risk of a subsidy race where all countries use taxpayer money to maintain capacities that are no longer needed. This is a case where, as a consequence of government support, more invest-ment takes place than is desirable, i.e., in a shrink-ing sector. It would be better to invest this capital in other sectors.
From a European perspective, it is important to avoid these harmful subsidy races. In principle, this is the task of state aid rules that are enforced by the European Commission. Of course, for the Euro-pean Commission, deciding during a deep recession whether countries are allowed to support companies involves difficult trade-offs between the correction of capital market failures in times of economic stress and a potential distortion of competition.
While generous financial support to companies may thus be harmful, especially from a European per-spective, another important issue is that not all EU member states may be able to support private invest-ment where it is desirable. Member states with higher debt levels may be reluctant to do so. Given this, it would have been helpful to make solvency support measures an important part of the Next Generation EU Fund (NGEU). At least the European Commission should encourage member states to make these meas-
so that some risk is borne by banks. Including private investors has the advantage that these investors have strong incentives to pick the right firms. In addition, they may have better information about business pro-jects of particular companies than decision makers in the public sector. But in principle, private inves-tors face the same uncertainty as the government. In addition, some types of private investors may have distorted incentives. For instance, undercapitalized banks may support firms without viable business models in order to avoid loan write-downs.
It should also be noted that different policy in-struments have different implications for the zombie firm problem. In the case of extended loss carryback, the fact that this instrument only helps firms that were profitable before the crisis also reduces the risk of supporting non-viable firms. To avoid sup-porting firms that incurred losses long before the crisis, the carryback period might be limited to one or two years.
To what extent the support of zombie firms de-prives healthy firms of important resources is an open question. Schivardi et al. (2020a, b) discuss the zombie firm problem and investigate the impact of zombie lending by undercapitalized banks during the financial crisis. They find that during the Eurozone financial crisis, undercapitalized banks were indeed less likely to cut credit to non-viable firms. In addition, credit misallocation increased the failure rate of healthy firms and reduced the failure rate of non-viable firms. These results imply that the zombie firm problem is real. However, these studies also find that the ad-verse effects of credit misallocation on the growth rate of healthier firms were negligible, suggesting that for healthy companies, the adverse consequences of lending to zombie firms may not be as important as sometimes suggested in policy debate.
Ultimately, it is unavoidable that governments that provide financial support to companies in a crisis will also support some firms that do not have viable business models. This is the price to be paid for sta-bilizing the economy as a whole.
Overall, a strong case can be made for providing financial support to firms so that they can keep up investment, which is important both for kickstarting a recovery and for maintaining productivity and the ability to innovate in the medium and long term. In this context, governments should use instruments that allow it to concentrate as much of the support as possible on high quality investment of firms with viable business models. Loans and loan guarantees where private investors bear part of the risk are such an instrument, extending tax loss carryback is another.
The potential for undesirable support of zom-bie firms is larger if governments go beyond these instruments. One example is government support in the form of equity, which is often used to support large firms, in particular, firms considered to be of

55EEAG Report 2021
CHAPTER 4
barriers to investment while the availability of staff, energy costs or infrastructures are perceived as less important. Nevertheless, the overall priorities have not changed much.
Climate protection is widely seen as a key driver of future corporate investment. Figure 4.7 illustrates results from survey questions about factors pre-venting companies from investing to tackle climate change. The data are only available for 2020.
The key result is that uncertainty about future regulation and taxation related to climate change is the most important obstacle to investment. This is plausible because, for instance, the return on invest-ment in low carbon will depend strongly on the fu-ture carbon price, which is set politically. The role of policy uncertainty suggests that the European Union and its member states could contribute significantly to more investment by agreeing on a credible medi-um-term strategy for climate protection policies and in particular the carbon price.
The emphasis on regulatory uncertainty also points to the fact that there is a tendency in Europe to extend government intervention in private invest-ment decisions, in particular in the context of efforts to transform the economy towards more sustainable and climate friendly structures. While more sustain-ability and climate protection are widely supported objectives, there is a danger that overly dirigiste and
ures part of the recovery plans they submit when they apply for funding from NGEU.
4.4 BUSINESS INVESTMENT IN THE MEDIUM AND LONG TERM
While the European Union and its member states focus on recovery from the crisis in the short term, they should not neglect the medium- to long-term perspectives for business investment. Servicing the high levels of public and private debt incurred dur-ing the crisis and creating new jobs for those who have lost the old ones will require economic growth. To achieve this, Europe needs corporate investment. What does Europe need to do to encourage invest-ment in the medium and long term? The factors de-termining investment are complex, they differ across sectors and they are not the same for firms of differ-ent sizes. In addition, not all relevant factors can be changed easily through economic policy measures. For instance, whether a country is able to attract in-vestment depends on its geographical position, the size of its internal market, on its climate, the avail-ability of workers or the stability of its institutions and its political system. But none of these factors can easily be changed, certainly not in the short term. In comparison, taxes or access to credit may be less important, but these factors can be changed quickly.
What are the factors that may prevent companies from investing in Europe? Figure 4.6 shows the results of surveys carried out by the European Investment Bank at the end of 2019 and 2020.
The three most frequently cited barriers to invest-ment are general uncertainty, the (non-) availability of skilled staff and business regulation.2 This applies to both large-, small- and medium-sized firms. Per-haps surprisingly, the differences across firm sizes are small. Other factors attracting a lot of attention in the policy debate—such as the availability of fi-nance and transport and digital infrastructures—seem to be obstacles for a smaller number of firms. However, in terms of economic policy, this does not mean that these factors are not important. If they can be changed at low costs, public policy may even see them as a priority. In fact, most of the items cited in Figure 4.6 can and should be influenced by eco-nomic policy. In some cases, this is possible only in the medium and long term, but others can be changed quickly. A policy aiming at improving conditions in Europe should tackle all of these issues.
The differences in the results of the 2019 and 2020 surveys show that the coronavirus crisis does affect the perception of barriers to long-term invest-ment. It is plausible that, as a result of the crisis, general uncertainty, the availability of finance and demand for products are more frequently seen as
2 Also see the discussions in the previous chapters, i.e., on the need to remove barriers to firm creation in Chapter 2 and the discussion on skills in Chapter 3.
0 20 40 60 80 100%
Uncertainty
Availability of skilled staff
Business Regulation
Energy Costs
Demand for Products
Availability of Finance
Digital Infrastructure
Transport InfrastructureSmall and medium-sized Enterprises 2019Small and medium-sized Enterprises 2020Large Firms 2019Large Firms 2020
Long-Term Barriers to InvestmentFirms stating, that these are major or minor investment obstacles
Source: EIB Investment Survey, EIBIS (2020). © CESifo
Figure 4.6
0 20 40 60 80%
Uncertainty about RegulatoryEnvironment and Taxation
Cost of Investment Activitities
Availability of Finance
Availability of Skilled Staff
Small and medium-sized Enterprises Large Firms
Barriers to Investing in Activities to Tackle Climate ChangeFirms stating, that these are major or minor investment obstacles
Source: EIB Investment Survey, EIBIS (2020). © CESifo
Figure 4.7

56 EEAG Report 2021
CHAPTER 4
which is the integration of the national markets for banking services and equity capital in the EU, would reduce the cost of financing and facilitate access to equity capital as well as venture capital. As mentioned above, many companies will emerge from the crisis with high levels of debt. For them as well as for newly created firms, better access to equity capital is now even more urgent than it was before the coronavirus crisis. It is also important to maintain economic inte-gration between the EU and the UK as far as possible. The fact that a hard Brexit has been avoided is a first step, but much remains to be done in this regard.
4.5 CONCLUSIONS
Recessions usually go along with a decline in business investment. This is also true for the coronavirus crisis. Private investment decisions in crises are likely to be partly suboptimal from the perspective of the econ-omy as a whole. There is a strong case for public pol-icies to support investment. The suitable instruments for providing this support include loans and govern-ment loan guarantees. However, loans may not be enough if companies are already highly indebted. In this case they may need external equity. This should normally come from private investors, either through an injection of external equity capital or through debt restructuring, but that may be difficult to achieve in the middle of a crisis.
The tax system offers other options to support firms in crisis situations. Loss carrybacks are an ef-fective and targeted instrument and should be used more widely. The effect is similar to a temporary in-jection of equity into a firm. Since extended loss car-ryback reduces losses carried forward, their fiscal cost is low. Accelerated tax depreciation allowances also encourage more investment, but without loss carry-back, they only have an impact on currently profitable firms. These firms are not those where government support is most urgent.
An important drawback of public support for companies is that it may keep firms alive which are not viable in the long term, giving rise to “zombie firms.”
To reduce the risk of supporting zombie firms, governments should prefer loan guarantees where part of the risk is borne by private investors such as banks. Loss carrybacks should be limited to one or two years to avoid supporting firms that incurred losses long before the crisis.
From a European perspective, there is a danger that national governments could possibly provide ex-cessive financial support to large firms considered to be of national importance. Given that these firms often operate in imperfectly competitive markets, there is a danger that national support policies ne-glect negative externalities on companies in other countries. Preventing harmful subsidy races is a task of EU state aid control. In times of crisis, it is justified
uncoordinated policy interventions undermine the efficiency of investment in this area. For instance, the taxonomy for sustainable finance uses complex administrative and political procedures to classify economic activities according to whether they support sustainability goals like climate protection (see EU Expert Group on Sustainable Finance 2018). The next step is to steer capital flows into activities classified as sustainable or “green.” This approach is based on a central planning philosophy incompatible with the market-oriented idea of achieving efficient climate protection through carbon pricing.
Similar concepts for state planning in corporate investment are gaining political support in industrial policy. As a result of the crisis, the idea has emerged that international value chains are vulnerable, and companies should be incentivized to reduce inter-national outsourcing. While it is justified to ask for better preparation to deal with future pandemics, which may require more domestic production of medical goods like masks or respirators, calling for a general winddown of border crossing value chains would be highly counterproductive. First, companies will themselves reconsider the trade-offs between production costs and vulnerability of value chains. Second, reducing vulnerability may require more, not fewer, international value chains. If all produc-tion of a key input is concentrated in one country, be it at home or abroad, vulnerability to shocks will be greater and more likely than in a situation where production of that input is more diversified and is available from many countries.
Warning against misguided intervention in mar-kets is not the same as asking for general deregula-tion. Rather, the challenge is to develop regulation that allows market processes to fully develop their potential in terms of generating efficiency and inno-vation. Digitization is one area where this is particu-larly important. In an increasingly data-driven econ-omy, fostering investment requires effective policies for data use and data sharing; at the same time the greater role of economics of scale and network effects in the digital economy highlights the importance of effective competition policy.
Currently, due to the impact of the economic cri-sis, much emphasis is placed on the role of the pub-lic sector in directly steering and supporting invest-ment in selected areas like digitization and climate change. This is also the focus of the recovery fund NGEU. However, to be successful in fostering invest-ment and growth in Europe, a much broader strategy is needed, and a strategy with more emphasis on mar-ket processes and competition.
Probably the most important factor for attract-ing investment to Europe is the potential of the Eu-ropean internal market, which gives access to both factors of production and customers. This implies that deepening the European internal market should be a key priority in coming years. Capital market union,

57EEAG Report 2021
CHAPTER 4
REFERENCES
Artola, C. and G. Veronique (2011), “Euro Area SMEs Under Financial Constraints: Belief or Reality?”, CESifo Working Paper No. 3650.
CNBC (2020), These European Countries are Refusing to Offer Bail-outs to Companies Linked to Offshore Tax Havens, https://www.cnbc.com/2020/05/19/coronavirusvirus-eu-countries-deny-bailouts-to-firms-linked-to-tax-havens.html (accessed December 29, 2020).
EU Expert Group on Sustainable Finance (2018), Financing a Sustainable European Economy, Final Report.
European Commission (2020), Juncker Plan has Made Major Impact on EU Jobs and Growth, Press Release on October 22, 2019, Brussels, https://ec.europa.eu/commission/presscorner/detail/en/IP_19_6119 (accessed December 29, 2020).
European Court of Auditors (2019), European Fund for Strategic Investments: Action Needed to Make EFSI a Full Success, Special Report 03/2019.
European Investment Bank (2019), EIB Investment Survey (EIBIS) 2019.
European Investment Bank (2020), EIB Investment Survey (EIBIS) 2020.
IMF (2020), World Economic Outlook, October 2020.
Juncker, J. C. (2014), Investing in Europe: Speech by President Juncker in the European Parliament plenary session on the € 315 billion In-vestment Plan, https://ec.europa.eu/commission/presscorner/detail/hr/SPEECH_14_2160 (accessed January 12, 2021).
OECD (2020a), Quarterly Gross Domestic Product and other Quarterly National Account statistics, http://www.oecd.org/sdd/na/quarterlyna-tionalaccountsoecd.htm (accessed December 29, 2020).
OECD (2020b), Tax and Fiscal Policy in Response to the Coronavirus Cri-sis: Strengthening Confidence and Resilience, May 19, 2020.
Schivardi, F., E. Sette and G. Tabellini (2020a), “Identifying the Real Ef-fects of Zombie Lending”, CEPR Discussion Paper 14758.
Schivardi, F., E. Sette and G. Tabellini (2020b), “Credit Misallocation Dur-ing the European Financial Crisis”, CESifo Working Paper No. 6406.
to allow member states to provide more support to the economy, but in the case of very large compa-nies, the European Commission should not relax the restrictions by too much or too long.
At the same time, there is a risk that some EU member states do not provide support to their firms even where it is desirable; this is an issue in particular for highly indebted countries. The European institu-tions should place emphasis on making liquidity sup-port available in particular in countries where no na-tional programs exist, and should focus on small and medium sized companies. The European Commission should encourage member states to include liquidity support programs in the national recovery plans they submit to receive funds from NGEU.
While the support of investment during the cri-sis is important, it is time for European policymakers to turn their attention to fostering investment in the medium and long term. To deal with the legacy of the crisis, in particular the high level of public and private debt and to compensate for the job losses, Europe needs dynamic economic growth. This will only be achieved if companies find it attractive to invest and create jobs in Europe. Economic policy can contribute to this, not through misguided dirigisme but by reduc-ing policy uncertainty and through regulation that enables market processes to develop their full poten-tial in terms of generating efficiency and innovation.

58 EEAG Report 2021
LISTS
LISTS
LIST OF FIGURES
Figure 1.1 Covid-19 Related Daily Deaths in the World 10
Figure 1.2 Regional Contributions to GDP, Industrial Production and World Trade 11
Figure 1.3 Global Economic Policy Uncertainty Index and Investment Growth in the OECD 11
Figure 1.4 Global Barometers – Coincident Composite Indicators 12
Figure 1.5 Inflation in the World and Oil Price Movements 12
Figure 1.6 Core Inflation Rates 12
Figure 1.7 Spending Developments in the United States and the Euro Area 13
Figure 1.8 Unemployment and Labor Force Participation Rates 13
Figure 1.9 Cumulative Loss in Sector-Specific Value Added in the Euro Area 14
Figure 1.10 Unemployment Rates and Labor Force Participation Rates in Selected Euro Area Countries 14
Figure 1.11 Change in Employment in the Euro Area During the First Three Quarters of the Crisis 15
Figure 1.12 Decomposing the Decline in Employment between January and November 2020 15
Figure 1.13 Price Developments in the Euro Area 15
Figure 1.14 Government Budgets in the United States and the Euro Area 16
Figure 1.15 Government Structural Primary Budget Balances 17
Figure 1.16 Fiscal Impulses in EU Member Countries 17
Figure 1.17 Leverage Plots Reflecting Column (5) of Table 1.3 20
Figure 1.18 Central Bank Interest Rates 20
Figure 1.19 Balance Sheet Sizes of Major Central Banks 21
Figure 1.20 10-year Government Bond Yields 21
Figure 1.21 Regional Disparities in Government Bond Yields in the Euro Area 21
Figure 1.22 Interest Rates on Loans in the Euro Area 22
Figure 1.23 Credit Developments in the Euro Area 22
Figure 1.24 Developments in International Stock Markets from a Euro Area Perspective 22
Figure 1.25 Developments in Selected Stock Markets Within the Euro Area 23
Figure 1.26 Real Effective Exchange Rates Around the World 23
Figure 1.27 Exchange Rate of the Euro Against the US Dollar and PPP 23
Figure 1.28 World Economic Growth and the Global Economic Barometers 25
Figure 1.29 Regional Contributions to World GDP Growth 25
Figure 1.30 Comparing GDP Developments for Advanced Economies and the World 25
Figure 1.31 Economic Growth by Country and Region 26
Figure 1.32 Confidence Indicators for Different Sectors in the Euro Area 27
Figure 1.33 Demand Contributions to GDP Growth in the Euro Area 27
Figure 1.34 Unemployment Rates in the Euro Area and the United Kingdom 27
Figure 1.35 Employment in the Euro Area 28
Figure 1.36 Economic Growth in EU Member Countries and the United Kingdom 28

59EEAG Report 2021
LISTS
Figure 2.1 The Coronavirus Crisis: Mortality, Economic Activity and Public Finances,
European Countries 33
Figure 2.2 Trust in the European Union 34
Figure 2.3 Allocation of the Grant-Part of the Recovery and Resilience Facility 34
Figure 2.4 Risk of Temporary Lay-off/Reduced Hours and Job Loss 35
Figure 2.5 Consumption Expenditures and Total Gross Savings across the Income Distribution,
France 2020 36
Figure 3.1 Deaths in the United States According to Age Group 41
Figure 3.2 Additional Covid Deaths, Life Expectancy, and Expected per Capita Loss of Life
by Age Group in the United States 42
Figure 3.3 Additional Earnings Associated with an Additional Year of Education 43
Figure 3.4 Percentage of Age Group Most Likely to be in Education and
Share of Employment in Total Population, 2017 43
Figure 4.1 Business Investment 50
Figure 4.2 Private Sector Investments Spending: Financial Crisis vs. Coronavirus Crisis 51
Figure 4.3 Share of Jobs at Risk in Small and Medium-Sized Enterprises in Different Sectors 52
Figure 4.4 Investments and Investment Expectations in Manufacturing Industry 52
Figure 4.5 Share of Firms Reporting Banks are Restrictive in Providing Credit 52
Figure 4.6 Long-term Barriers to Investment 55
Figure 4.7 Barriers to Investment in Activities to Tackle Climate Change 55
LIST OF TABLES
Table 1.1 Labor Costs 16
Table 1.2 Public Finances 18
Table 1.3 Illustrative Analysis Regarding Growth Differentials within the European Union in 2020 19
Table 1.A.1 GDP Growth, Inflation and Unemployment in Various Countries 29
Table 1.A.2 GDP Growth, Inflation and Unemployment in the Countries of the European Union 30
Table 1.A.3 Key Forecast Figures for the European Union 30
Table 1.A.4 Key Forecast Figures for the Euro Area 30
LIST OF BOXES
Box 1.1 Illustrative Analysis Regarding Growth Differentials within the European Union in 2020 15

60 EEAG Report 2021
AUTHORS
Torben M. Andersen holds a Ph.D. from CORE, Université Catholique, Louvain-la-Neuve, Belgium (1986). He is is Pro-fessor of Economics at Aarhus University, Denmark and a Fellow of CESifo, Centre for Economic Policy Research and IZA. He has served as department head and member of various university committees. He has had various short-term visiting positions at other universities, served as editor of the Scandinavian Journal of Economics (1991–1997), and as member of several editorial boards. He has been extensively involved in policy advice in Denmark and abroad. In Denmark among other as chairman of the Economic Council (1993–1996 and 2001–2003), the Welfare Commission (2003–2006), and the Pension Commission (2014–2015), and corona-advisory expert group, and as member of the Systemic Risk Council (2013-2018). Abroad his advisory activities include the EU Commission, member of the Fiscal Policy Council in Sweden (2007–2011), Economic Policy Council Finland (2014-2019) and Chairman of the Economic Council, Greenland (since 2012), and commission on Migration in Norway (2009–2011). Most of his research has been on macroeconomics, labor economics and the economics of the welfare state. He has published in many scholarly journals, including the Economic Journal, Journal of Public Economics, Journal of International Economics, Economic Theory, and European Economic Review. He has published several books and edited volumes, most recently Reform Capacity and Macroeconomic Performance in the Nordic Countries, edited with U. Michael Bergman and Svend E. Hougaard Jesen, Oxford University Press, 2015.
Address: Torben M. Andersen Aarhus University Department of Economics and Business Economics Fuglesangs Allé 4, building 2621, 2 8210 Aarhus V Denmark [email protected]
Torben M. Andersen
Giuseppe Bertola holds a Ph.D. from the Massachusetts Institute of Technology (1988) and is Professor of Political Economy at the University of Turin (Associato since 1993 and Ordinario since 1996). He was on leave in 2011–15 as Professor of Economics at EDHEC Business School and in 1997–2003 as full-time Professor at the European Univer-sity Institute. In 1989–93 he was Assistant Professor and Assistant Director of the International Finance Section, Princeton University. He has served as a Managing Editor of Economic Policy (2001–2008), Condirettore of Giornale degli Economisti e Annali di Economia (1996–2011), and a Program Director of CEPR’s Labour Economics programme (2009–2013). He has performed scientific advisory work for the European Commission, the European Central Bank, and other organizations. His research currently focuses on the structural and institutional aspects of labor and financial markets, from an international comparative perspective, particularly as regards their distributional impact and interaction with the European process of economic and monetary unification. He has applied similar methods to exchange rate and money-market policies, interactions between growth and distribution, households’ durable consumption and borrowing, and educational systems. He has also published widely in the Review of Economic Studies, the American Economic Review, the European Economic Review, other academic journals and books, also authoring chapters in Handbook of Labor Economics and Handbook of Income Distribution (North-Holland), co-au-thoring Models for Dynamic Macroeconomics (Oxford University Press) and Income Distribution in Macroeconomic Models (Princeton University Press), and co-editing Welfare and Employment in a United Europe and The Economics of Consumer Credit (MIT Press).
Address: Giuseppe Bertola University of Turin Department of Economics and Statistics Lungo Dora Siena 100 10153 Turin Italy [email protected]
Giuseppe Bertola
THE MEMBERS OF THE EUROPEAN ECONOMIC ADVISORY GROUP

61EEAG Report 2021
AUTHORS
Clemens Fuest holds a Ph.D. from the University of Cologne (1994). He is President of the ifo Institute, Professor of Economics and Public Finance at the Ludwig-Maximilians-University of Munich, Director of the Center for Economic Studies (CES), Executive Director of CESifo GmbH and Speaker of EconPol Europe – the European network for eco-nomic and fiscal policy research. Since 2003 Clemens Fuest is a member of the Academic Advisory Board of the German Federal Ministry of Finance (head of the board from 2007 to 2010). He is a member of the European Academy of Sciences and Arts and of the German National Academy of Science and Engineering (acatech). Furthermore, Clem-ens Fuest is Board Member of the International Institute for Public Finance (IIPF; President since August 2018) and a member of the Minimum Wage Committee of the Federal Republic of Germany and of the German-French Council of Economic Experts. In 2013 he received the Gustav Stolper Prize of the Verein für Socialpolitik (Social Policies Society - VfS), in 2019 the Hanns Martin Schleyer Prize for the year 2018. He was awarded an honorary doctorate of the Karlsruhe Institute of Technology (KIT) in 2017.His research areas are economic and fiscal policy, taxation, and European integration. Before he was appointed ifo Pres-ident in April 2016, Clemens Fuest was President of the Centre for European Economic Research (ZEW) in Mannheim and Professor of Economics at the University of Mannheim. From 2008 to 2013 he was Professor of Business Taxation and Research Director of the Centre for Business Taxation at the University of Oxford. He taught as a Visiting Professor at the Bocconi University in Milan in 2004. From 2001 to 2008 he was Professor for Public Economics at the University of Cologne. Clemens Fuest has published widely in German and international academic journals including American Economic Review, European Economic Review, Journal of Public Economics, Journal of International Economics, National Tax Journal, International Tax and Public Finance and International Economic Review. He has published a number of books and contributes to public debates on economic and fiscal policy through articles in renowned newspapers including Handelsblatt, Frankfurter Allgemeine Zeitung, Süddeutsche Zeitung, WirtschaftsWoche, Financial Times, Wall Street Journal and Le Monde.
Address: Clemens Fuest ifo Institute Poschingerstr. 5, 81679 Munich Germany [email protected]
Clemens Fuest
Cecilia García-Peñalosa holds a Ph.D. from Oxford University (1995). She is Professor of Economics at the Centre National de la Recherche Scientifique and at the Aix-Marseille School of Economics. Furthermore, since 2017 she has held the chair on Gender, Growth and Development at the École des Hautes Études en Sciences Sociales, and she is a Fellow of CESifo and the Centre for Economic Policy Research. She has held positions at the Autonomous University of Barcelona and the University of Oxford, has been a council member of the Society for the Study of Economic Inequality and associate editor of the European Economic Review, and currently is associate editor of the Journal of Economic Inequality. Her policy work includes scientific advisory work for the European Commission and the World Bank, among others, and four years as a member of the Conseil d'Analyse Economique, an independent advisory group that reports to the French Prime Minister. Her research has focused mainly on long-term growth and income inequality. To what extent is inequality neces-sary for an economy to grow? Does growth automatically lead to less inequality? Are countries where output is more volatile also more unequal? Her recent work focuses on the factors that determine gender inequality in labor markets. Cecilia García-Peñalosa has published in many scholarly journals, among them the Journal of Economic Growth, Journal of Public Economics, Economic Journal, and the European Economic Review, and co-edited the volume Institutions, Development, and Economic Growth, MIT Press CESifo Seminar Series. Her work has been featured in the press, including The Economist, and she contributes regularly to public debate in France, through interventions in the radio or newspapers such as Le Monde.
Address: Cecilia García-Peñalosa Aix-Marseille School of Economics Aix-Marseille Université 5 Bd Maurice Bourdet 13205 Marseille France [email protected]
Cecilia García-Peñalosa

62 EEAG Report 2021
AUTHORS
Harold James holds a Ph.D. from Cambridge University (1982) and is Claude and Lore Kelly Professor in European Studies and a Professor of History at Princeton University, a Professor of International Affairs at the Woodrow Wilson School, as well as an Adjunct Professor at BI Norwegian Business School, and the official historian of the International Monetary Fund. He is Director of the Program in Contemporary European Politics and Society and serves on the editorial committee of the journal World Politics and is Chairman of the Academic Council of The Eu-ropean Association for Banking and Financial History (EABH). Before coming to the United States in 1986, he was a Fellow of Peterhouse for eight years. He was awarded with the Ellen MacArthur Prize for Economic History at the University of Cambridge in 1982, the Helmut Schmidt Prize in Economic History at the German Historical Institute in Washington, D.C. in 2004 and the Ludwig Erhard Prize for writing about economics in 2005. His research focuses on European economic history, and globalization. He has published and co-authored several books analyzing Germany’s financial history in the interwar era, the changing character of national identity in Germany and detailed studies about the Deutsche Bundesbank. His latest books, Making the European Monetary Union published by the Harvard University Press in 2012, and The Euro and the Battle of Ideas, written with Markus Brunnermeier and Jean-Pierre Landau (Princeton University Press 2016) aim at a deeper understanding of the European monetary crisis by tracing the historical background of Europe-wide monetary union and common currency, and the differences in national approaches to economic policy in the EU’s member countries.
Address: Harold James Princeton University History Department 129 Dickinson Hall Princeton, NJ 08544-1017 USA [email protected]
Harold James
Jan-Egbert Sturm holds a Ph.D. from University of Groningen (1997). He is Professor of Applied Macroeconomics, Director of the KOF Swiss Economic Institute at the ETH Zurich, President of the Centre for International Research on Economic Tendency Surveys (CIRET), Editor of the European Journal of Political Economy and currently Vice-President of the Swiss Covid-19 Science Taskforce. He was a researcher at the University of Groningen, The Netherlands, until 2001, and taught as Visiting Professor at the School of Business, Bond University, Gold Coast, Australia, in 2000 and 2005. As Head of the Department for Economic Forecasting and Financial Markets at the ifo Institute for Economic Research, he was also Professor of Economics at the University of Munich (LMU) at the Center for Economic Studies (CES), 2001–2003. He held the Chair of Monetary Economics in Open Economies at the University of Konstanz, Ger-many, which was coupled with the position of Director of the Thurgau Institute of Economics (TWI) in Kreuzlingen, Switzerland, 2003–2005. In his research, Jan-Egbert Sturm relies heavily on empirical methods and statistics, con-centrating on monetary economics, macroeconomics as well as political economy. His applied studies have focused on, for example, economic growth and central bank policy. He has published several books, contributed articles to various anthologies and international journals including the American Economic Review, the European Economic Re-view, the Journal of Banking and Finance, the Journal of Business & Economic Statistics, the Journal of Development Economics, the Review of International Organizations, and the Scandinavian Journal of Economics. Since 2001 he has been member of the CESifo Research Network and since 2003 Research Professor at the ifo Institute. In 2006 he was appointed member of the User Advisory Council of the ifo Institute.
Address: Jan-Egbert Sturm ETH Zurich KOF Swiss Economic Institute LEE G 116 Leonhardstr. 21 8092 Zurich Switzerland [email protected]
Jan-Egbert Sturm

63EEAG Report 2021
AUTHORS
Branko Urošević holds a Ph.D. in Business Administration from U.C. Berkeley (2002) and in Physics from Brown Univer-sity (1995). He is a Professor at School of Computing, Union University in Belgrade, Serbia, where he is charged with building the Master in Computational Finance that combines economics and finance with methods from computer science and machine learning and AI, and a Fellow member of CESifo. Previously, he was a Professor at Faculty of Economics, University of Belgrade, and taught and directed the Master of Finance program at Universitat Pompeu Fabra, Barcelona. He is a permanent member of the Committee for Economic Sciences of the Serbian Academy of Arts and Sciences, a visiting professor at ICEF, Moscow, and a member of the International Scientific Committee of UniCredit and Universities Foundation, Milan. Branko Urošević was Vice-Chairman of the National Council for Higher Education, the regulatory body for higher education in Serbia, advisor to the Governor of the National Bank of Serbia and a member of the Advisory Board of the Diligan Research Center of the Central Bank of Armenia. His research is published in the leading international journals including Journal of Political Economy, Economic Theory, Journal of Financial Markets, European Journal for Operations Research, Proceedings of the American Academy of Sciences (PNAS), and Management Science, among many others. His interests include dynamic moral hazard problems, banking and risk management, education economics, real estate finance, and asset pricing. His research was supported by grants from EU, Spain, US, and Serbia. He worked as a consultant at McKinsey & Co and KPMG in Chicago, IL. He consulted, also, central banks of Armenia and Serbia, Ministry of Finance of Serbia and a number of commercial banks. He is one of the founders of a consultancy specializing in financial risk management and was the Chairman of the largest private pension fund in Serbia.
Address: Branko Urošević School of ComputingUnion UniversityKneza Mihaila 6/VI11000 [email protected]
Branko Urošević

64 EEAG Report 2021
REPORTS
The EEAG Policy Brief 2020: Europe's Pandemic Politics
Economic Developments around the World: Corona Crisis Leads to Worst Recession in 90 YearsFiscal and Monetary Consequences of Covid-19Risk, Insurance and Solidarity – National and EU PerspectivesMarkets, Policies, and Structural Change during and after the Covid Crisis
The EEAG Report on the European Economy 2020: Fair Taxation in a Mobile World
Macroeconomic Conditions and OutlookDigital and Technological Transformation Taxing Multinational CompaniesTaxing Mobile Jobs and PeopleTaxing Immobile Factors and Wealth
The EEAG Report on the European Economy 2019: A Fragmenting Europe in a Changing World
Macroeconomic Conditions and OutlookCoping (or not) with ChangeStruggling with ConstraintsLooking Outward: Western Disarray, China Rising
The EEAG Report on the European Economy 2018: What Now, With Whom, Where To – The Future of the EU
Macroeconomic Conditions and OutlookBuilding Trust between Suspicious MindsAll Together Now: The European Union and the Country ClubsIt's OK to Be Different: Policy Coordination and Economic Convergence
The EEAG Report on the European Economy 2017: Economics of Populism
Macroeconomic Conditions and OutlookEconomic Policy and the Rise of PopulismBritain and the EUexitImmigration and the Refugee Crisis
The EEAG Report on the European Economy 2016: What next?
Macroeconomic Conditions and OutlookIntergenerational FairnessTuning Secondary EducationDenmark: Too Good to Be True?Western Balkans: Coming Together
The EEAG Report on the European Economy 2015: Blurring the Borders
Macroeconomic OutlookThe European Energy Conundrum: Power FailureEuropean Regional Disparity: Borders Strike BackMigration in the European Union: Too Much of a Good Thing?
PREVIOUS REPORTS AND POLICY BRIEFS

65EEAG Report 2021
REPORTS
The EEAG Report on the European Economy 2014: The Road Towards Cohesion
Macroeconomic OutlookSwitzerland: Relic of the Past, Model for the Future?Austerity: Hurting but HelpingBanking Union: Who Should Take Charge?
The EEAG Report on the European Economy 2013: Rebalancing Europe
Macroeconomic Outlook European ImbalancesLabour Market Reforms and Youth UnemploymentUS Precedents for Europe
The EEAG Report on the European Economy 2012: The Euro Crisis
Macroeconomic Outlook The European Balance-of-Payments Problem Banking RegulationThe Swedish ModelThe Hungarian CrisisPricing Climate Change
The EEAG Report on the European Economy 2011: Governing Europe
Macroeconomic Outlook A New Crisis Mechanism for the Euro Area GreeceSpainTaxation and Regulation of the Financial Sector
The EEAG Report on the European Economy 2010: Exiting the Crisis
The European Economy: Macroeconomic Outlook and Policy A Trust-driven Financial Crisis. Implications for the Future of Financial MarketsFrom Fiscal Rescue to Global DebtImplications of the Crisis for US Adjustment Needs The Financial Crisis: Risks and Challenges for the Euro Area
The EEAG Report on the European Economy 2009
The European Economy: Macroeconomic Outlook and Policy Financial Crisis Private Equity Country Chapter: France
The EEAG Report on the European Economy 2008: Europe in a Globalised World
The European Economy: Macroeconomic Outlook and Policy How Much Real Dollar Depreciation is Needed to Correct Global Imbalances? The Effect of Globalisation on Western European Jobs: Curse or Blessing? Industrial Policy Global Warming: The Neglected Supply Side

66 EEAG Report 2021
REPORTS
The EEAG Report on the European Economy 2007
The European Economy: Macroeconomic Outlook and Policy Macroeonomic Adjustment in the Euro Area – the Cases of Ireland and ItalyThe New EU MembersScandinavia Today: An Economic Miracle? Tax CompetitionEconomic Nationalism
The EEAG Report on the European Economy 2006
The European Economy: Macroeconomic Outlook and Policy Global ImbalancesEconomic Growth in the European UnionProspects for Education Policy in Europe Mergers and Competition Policy in Europe
The EEAG Report on the European Economy 2005
The European Economy: Current Situation and Economic Outlook for 2005 OutsourcingLonger Working Hours – the Beginning of a new Trend? Pensions and Children House Prices in Europe
The EEAG Report on the European Economy 2004
The European Economy: Current Situation and Economic Outlook Labour Market Reform in Europe Pay-setting Systems in Europe: On-going Development and Possible Reforms The Economics of Discrimination: Equity, Equality and Diversity in the New European Constitution The 2004 EU Enlargement: Key Economic IssuesAcceding Countries: The Road to the Euro
The EEAG Report on the European Economy 2003
The European Economy: Current Situation and Economic Outlook Fiscal Policy and Macroeconomic Stabilisation in the Euro Area: Possible Reforms of the Stability and Growth Pact and National Decision-Making-Processes Rethinking Subsidiarity in the EU: Economic Principles Financial Architecture Should We Worry about the Brain Drain?
The EEAG Report on the European Economy 2002
The European Economy: Current Situation and Economic Outlook The Weakness of the Euro: Is it Really a Mystery? Fiscal and Monetary Policy Prices, Wages and Inflation after the Euro – What Europeans Should or Should not Expect Growth and Productivity Welfare to Work CAP Reform

Publishing provocative, high-quality, accessible articles in economics, with a particular focus on policy issues
Visit the website to read free content, sign-up for electronic alerting services, recommend to your library and submit your work.
cesifo.oxfordjournals.org
― SPEED: Quick online submission, speedy review time, advance access publication
― VALUE: Free editor‘s choice articles thoughout the year, free sample issue, numerous special issues
― IMPACT: Over 2,500 institutional subscribers worldwide, over 5,000 full-text downloads per month

Torben M. AndersenAarhus UniversityEEAG Vice-Chairman
Professor of Economics at the Department of Economics and Business Economics, AarhusUniversity. Former chairman of the Danish Economic Council
Clemens Fuestifo Institute and LMU Munich
Professor of Economics and Public Finance at LMU Munich, President of the ifo Institute, Director of the Center for Economic Studies, Executive Director of CESifo GmbH and Speaker of EconPol Europe – the European network for economic and fiscal policy research
Giuseppe BertolaUniversità di Torino
Professor of Political Economy
Harold JamesPrinceton UniversityEEAG Chairman
Professor of History and International Affairs, Claude and Lore Kelly Professor of EuropeanStudies, and Director of the Program in Contemporary European Studies at Princeton University
Jan-Egbert SturmKOF, ETH Zurich
Professor of Applied Macroeconomics and Director of the KOF Swiss Economic Institute, ETHZurich. President of the Centre for International Research on Economic Tendency Surveys (CIRET)and Editor of the European Journal of Political Economy
Branko UroševicSchool of Computing, Union University
Professor at School of Computing, Union University in Belgrade
Cecilia García-PeñalosaCentre National de la Recherche Scientifique and Aix-Marseille School of Economics
Professor of Economics at the Aix-Marseille School of Economics, Research Director at the Centre National de la Recherche Scientifique (CNRS) and a member of the Ecole des Hautes Etudes en Sciences Sociales (EHESS)
THE MEMBERS OF THE EUROPEAN ECONOMIC ADVISORY GROUP