Embed Size (px)
Citation preview

Beyond the Factory Gates: How Brands Improve Supply Chain Sustainability Through Shipping and Logistics
Clean Cargo Working Group Tools for Measuring and Reducing Environmental Impacts
March 2011
www.bsr.org

BSR | How Brands Improve Supply Chain Sustainability Through Shipping and Logistics 1
About This Report
The Clean Cargo Working Group (CCWG, www.bsr.org/cleancargo) is a business-to-business initiative that creates practical tools for measuring and reducing the environmental impacts of global goods transportation. The ocean carriers in the group are responsible for more than 60 percent of the market share of containers shipped worldwide. The global brands in CCWG represent an important voice for supply chain sustainability through their direct participation in partnership with the ocean carriers. CCWG fosters dialogue and collaboration between brands and transportation providers to develop tools and standards that manage environmental performance efficiently. This report is a culmination of CCWG collaboration, which includes a significant amount of vessel-by-vessel data transparency from the participating ocean carriers, as well as implementation of CCWG tools by the global brands. The tools described in this report are already in use and contributing to more sustainable transportation and logistics. Note the terminology used within CCWG and this report:
1) Carriers are transportation service providers, vessel owners, and vessel operators.
2) Shippers are global retailers, manufacturers, and cargo owners utilizing transportation services.
CCWG shares the information in this report to:
Explain how CCWG tools work - Described in this report are the tools and processes that CCWG uses as a basis for its collaboration. Included is a description of the specific metrics and the data that is shared among group members.
Contribute to industry-leading standards for measuring and reporting environmental performance - The standards and methodologies described in this report are based on CCWG’s collaborative efforts to create a reasonable way to benchmark performance and inform shipper decisions.
Foster transparency and open dialogue - CCWG shares this information in the spirit of continuous improvements through dialogue with stakeholders who are aligned with CCWG’s mission of creating efficient, sustainable supply chains.
Demonstrate the value of CCWG membership - Group members lead in the development of standards to assess environmental performance in the ocean container freight sector. This report highlights outputs that members use to benchmark performance, estimate emissions from intermodal shipping, and better understand the environmental challenges and opportunities in the sector.

BSR | How Brands Improve Supply Chain Sustainability Through Shipping and Logistics 2
DISCLAIMER BSR publishes occasional papers as a contribution to the understanding of the role of business in society and the trends related to corporate social responsibility (CSR) and responsible business practices. BSR maintains a policy of not acting as a representative of its membership, nor does it endorse specific policies or standards. The views expressed in this publication are those of its authors and do not necessarily reflect those of BSR members. ABOUT BSR A leader in corporate responsibility since 1992, BSR works with its global network of more than 250 member companies to develop sustainable business strategies and solutions through consulting, research, and cross-sector collaboration. With offices in Asia, Europe, and North America, BSR uses its expertise in the environment, human rights, economic development, and governance and accountability to guide global companies toward creating a just and sustainable world. Visit www.bsr.org for more information.

BSR | How Brands Improve Supply Chain Sustainability Through Shipping and Logistics 3
Contents
1 Introduction
2 CCWG Accomplishments
3 Average CO2 Emissions by Trade Lane
4 CCWG Tools
5 CCWG Performance Metrics Methodology
6 CO2 Calculation Methodology
7 2010 Environmental Performance Survey (EPS)
8 Conclusion
9 Appendix
CCWG Members
CO2 Formula
CCWG Trade Lane Definitions

BSR | How Brands Improve Supply Chain Sustainability Through Shipping and Logistics 4
1. Introduction
Clean Cargo Working Group (CCWG) is a business-to-business collaboration among leading shippers (retailers, manufacturers), ocean carriers, and logistics providers. The group works together through direct dialogue to create practical tools for measuring and reducing the environmental impacts of goods transportation worldwide.
Members include some of the world’s largest multinational brands across a range of industries and leading ocean carriers, representing more than 60 percent of global container shipments (see Appendix for list of current members). While participating companies control and share their own information, the group is committed to collaboration and a rigorous process for environmental data collection. CCWG drives performance improvement by:
Enabling fact-based dialogue between shippers and carriers
Sharing best practices on operations and technology investments
Developing a verification standard for environmental data to increase credibility in shipping industry data
Increasing transparency in the industry by facilitating efficient exchange of information between shippers and carriers
Aggregated CCWG CO2
emission rates across
trade lanes in 2008
showed an 8-percent
decrease on average
compared to 2007, and
a 17-percent decrease
relative to 2006.

BSR | How Brands Improve Supply Chain Sustainability Through Shipping and Logistics 5
2. CCWG Accomplishments
BSR established CCWG in 2003 in response to the growing complexity of global supply chains and increasing risks to business, such as regulation, reputation, and competitive pressure, particularly in terms of carbon emissions. Shippers (brands) needed reliable information about the environmental performance of transportation service providers, and carriers were receiving redundant, time-intensive demands for environmental data from brands. It became clear there was a need for a standardized, credible, and efficient approach for measuring and sharing environmental data with stakeholders. Over the past eight years, CCWG has been gathering emissions data (CO2, SOX, NOX) from at least 10 of the world’s largest transportation carriers. The information collected has become one of the most comprehensive environmental data sets in the shipping industry. This rigorous process established baselines and enabled the creation of measurement tools that did not exist previously. As a result, CCWG has been successful in the following accomplishments:
Developed the industry standard for assessing ocean carriers’ environmental performance
Created a carrier “Scorecard” to quantify performance and benchmark individual carriers against industry performance
Distributing annual aggregated environmental performance data to members
Realized an average 8-percent decrease in aggregated CCWG CO2 emission rates across trade lanes from 2007 to 2008, and a 17-percent decrease compared to 2006
CCWG strives to continuously improve its tools and methodologies to reflect new and emerging standards. The group considers a variety of updates and changes to tools each year in order to improve calculation accuracy while encouraging consistency and usability of environmental performance data along the value chain.
CCWG Member Profile: IKEA
IKEA is committed to reducing its emissions, and shipping
represents a key opportunity to make a positive impact on
emissions and other environmental issues. By joining CCWG,
IKEA learned from other members that simple practices, such as
slowing the speed of ships, can have big impacts on the
company’s environmental footprint. Utilizing Clean Cargo’s easy-
to-use intermodal emissions calculator, IKEA can now measure its
annual Scope 3 transportation emissions. In addition, the shared
performance metrics on transportation impacts have enabled IKEA
to make informed procurement decisions that align with its goal to
improve environmental performance throughout its supply chain.
“Clean Cargo brings
together large
multinationals that compete
with each other in the
marketplace to take on
environmental issues with
remarkable results, helping
us develop sustainable
transportation strategies.”
- Thomas Bergmark
IKEA
March 2010

BSR | How Brands Improve Supply Chain Sustainability Through Shipping and Logistics 6
3. Average CO2 Emissions by Trade Lane
The participating carriers use CCWG’s CO2 calculation methodology to submit vessel-by-vessel data, including CO2 emissions for each global trade lane. The following table presents the average CO2 emissions, by global trade lane, for both dry and refrigerated (“reefer”) cargo containers of all CCWG carriers. The averages are used to benchmark performance on specific trade lanes and to calculate emissions per unit of cargo shipped on specific trade lanes. The averages are also used in CCWG’s Intermodal Calculator Tool to estimate emissions from the ocean segment of intermodal shipments. In 2010 CCWG approved a verification protocol, based on industry leading practices, which can be used individually by carriers to verify submitted data. 2010 CCWG Process (2009 Data)
CCWG average emissions per trade lane are based on:
CUMULATIVE - weighted average gCO2/TEU-km
Dry Reefer Intra-Americas (Caribbean) 102.28 133.41
Europe (North & Med)--Oceania (via Suez / via Panama) 101.52 128.62
North America--Oceania 100.48 126.87
North America--Africa 97.37 139.65
Asia--Oceania 92.80 120.34
Europe (North & Med)--Africa 88.67 122.65
Europe (North & Med)--Latin America/South America 87.33 114.91
North Europe--North America EC (incl. Gulf) 85.41 112.46
North America--South America (EC/WC) 84.96 112.84
Asia--Africa 84.87 110.51
North America EC--Middle East/India 84.20 108.59
Asia--South America (EC/WC) 80.57 104.40
Mediterranean--North America EC (incl. Gulf) 80.03 108.83
North Europe--North America WC 79.81 104.64
Other 78.55 108.51
Asia--North America EC 78.15 97.44
South America (EC/WC)--Africa 77.81 97.79
Europe (North & Med)--Middle East/India 76.19 106.10
Intra-Asia 76.14 100.67
Asia--North America WC 74.20 97.13
Asia--Middle East/India 73.72 103.50
Intra-Europe 72.75 102.59
Asia--Mediterranean 67.52 96.71
Asia--North Europe 67.26 93.91
Mediterranean--North America WC 59.69 89.93
Clean Cargo gathered
environmental data on
1,206 container ships
in 2009.
BSR | How Brands Improve Supply Chain Sustainability Through Shipping and Logistics 7
4. CCWG Tools
CCWG developed and uses three primary tools to promote improvements in the logistics and transportation sector.
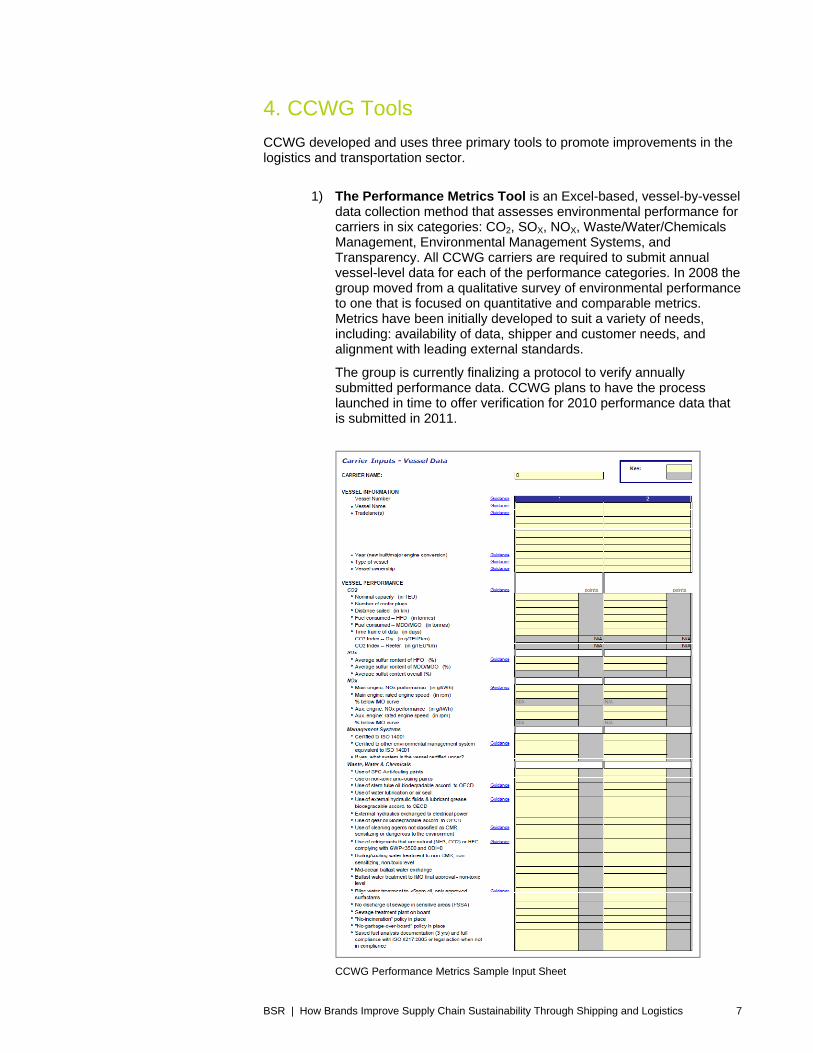
1) The Performance Metrics Tool is an Excel-based, vessel-by-vessel data collection method that assesses environmental performance for carriers in six categories: CO2, SOX, NOX, Waste/Water/Chemicals Management, Environmental Management Systems, and Transparency. All CCWG carriers are required to submit annual vessel-level data for each of the performance categories. In 2008 the group moved from a qualitative survey of environmental performance to one that is focused on quantitative and comparable metrics. Metrics have been initially developed to suit a variety of needs, including: availability of data, shipper and customer needs, and alignment with leading external standards.
The group is currently finalizing a protocol to verify annually submitted performance data. CCWG plans to have the process launched in time to offer verification for 2010 performance data that is submitted in 2011.
CCWG Performance Metrics Sample Input Sheet

BSR | How Brands Improve Supply Chain Sustainability Through Shipping and Logistics 8
CCWG Performance Metrics Sample Input Sheet
Carriers enter data into standardized spreadsheets that calculate environmental performance based on CCWG methodology. Additionally, each of the six performance categories are scored based on CCWG performance thresholds. Total scores are populated into the output scorecard. For CO2 performance, a score is provided for each trade lane and compared to performance from an indexed CCWG average.
Performance Metrics Scorecard
CCWG tools and methods are informed by:
WRI GHG Protocol
Global Reporting Initiative (GRI)
World Economic Forum (WEF)
International Maritime Organization (IMO)
World Shipping Council (WSC)
U.S. EPA SmartWay
Clean Shipping

BSR | How Brands Improve Supply Chain Sustainability Through Shipping and Logistics 9
2) Intermodal Calculator Tool is an Excel-based, CO2 calculation and footprinting tool for intermodal shipments. Annually updated ocean emissions factors are based on actual data collected through CCWG’s performance metrics process. Emissions factors for all other modes (road, rail, air, other ocean) are based on best available public data (e.g. WRI, DEFRA, EPA).
3) Environmental Performance Survey (EPS) is a qualitative survey to complement the quantitative performance metrics. The EPS collects descriptive best practices in areas where quantitative metrics are less suitable at this time (e.g. pilot projects).
CCWG Member Profile: “K” Line
Environmental responsibility is a core part of “K” Line’s
business ethic. CCWG is an opportunity to extend that ethic
to influence industry practices and learn from peers. “K”
Line values the collaborative spirit of CCWG. Hearing
shippers’ views on environmental issues has enabled the
carrier to develop stronger relationships with its customers.
“K” Line also benefits from influencing industry tools and
standards, working with peers to create a level playing field
that inspires performance improvement. The carrier is using
CCWG’s Performance Metrics Tool to communicate with its
customers about environmental impacts. “K” Line also uses
the Intermodal Emissions Calculator to report to customers
the carbon emissions associated with their shipments.
"Clean Cargo inspires
conversation and
collaboration that wouldn’t
otherwise happen. By
engaging closely with
shippers, we increase our
shared understanding of
the difficulties before us
and can work together to
tackle important issues."
- John Grenville-Goble
“K” Line March 2010

BSR | How Brands Improve Supply Chain Sustainability Through Shipping and Logistics 10
5. CCWG Performance Metrics Methodology
The performance metrics methodology is the basis for the performance metrics data collection process and analysis. Divided into six categories (see below), the metrics represent material environmental issues for the sector, as well as issues that cargo owners in the group view as important to assess their own supply chain sustainability.
Category Metric
CO2 Emissions Grams CO2/nominal TEU-km, by trade lane
SOX Emissions Sulfur content of bunker fuel
NOX Emissions Main engine performance percentage below IMO curve Auxiliary engine performance percentage below IMO curve
Environmental Management Systems (EMS)
Percentage of owned vessels with ISO 14001 certification or other comparable third-party certified EMS (other qualifying EMS to be assessed and confirmed by BSR and CCWG members)
Waste, Water, and Chemicals
Use of SPC Anti-fouling paints OR use of non-toxic anti-fouling paints
Use of stern tube oil biodegradable (according to OECD) OR use of water lubrication or air seal
Use of external hydraulic fluids and lubricant grease biodegradable (according to OECD) OR external hydraulics exchanged to electrical power
Use of gear oil biodegradable (according to OECD)
Use of cleaning agents not classified as CMR, sensitizing, or dangerous to the environment
Use of refrigerants that are natural (NH3, CO2) OR HFC complying with GWP<3500 and ODI=0
Boiling/cooling water treatment to non-CMR, non-sensitizing, non-toxic level
Mid-ocean ballast water exchange OR ballast water treatment to IMO final approval—non-toxic level
Bilge water treatment to <5ppm oil, only approved surfactants
No discharge of sewage in sensitive areas (PSSA) OR sewage treatment plant on board
"No incineration" policy in place
"No garbage overboard" policy in place
Saved fuel analysis documentation (three years) and full compliance with ISO 8217:2005, or legal action when not in compliance
Transparency For corporate-level public reporting: Meeting “Core” and “Additional” Indicators

BSR | How Brands Improve Supply Chain Sustainability Through Shipping and Logistics 11
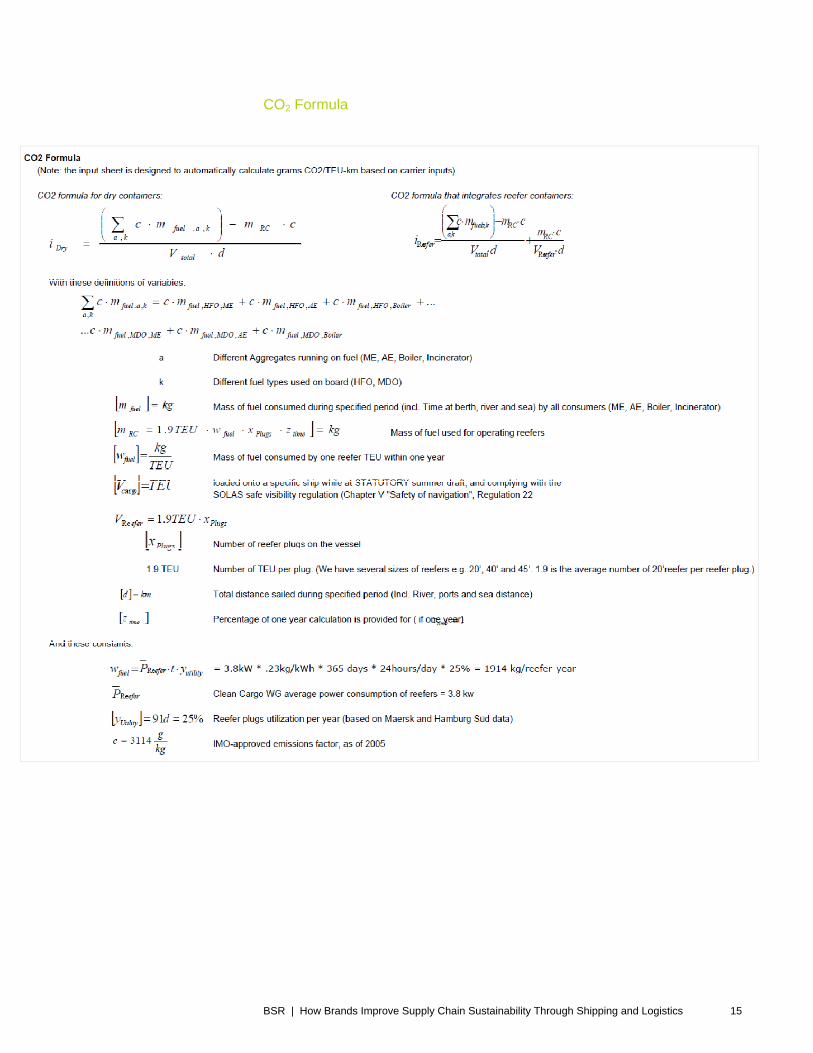
6. CO2 Calculation Methodology
CCWG has developed a standardized CO2 calculation methodology to enable CO2 benchmarking, drive improvements, and improve data quality over time. The methodology is used exclusively by CCWG member carriers to calculate vessel emissions as part of the CCWG Performance Metrics disclosure. Following is a description of how CO2 emissions factors (in gCO2/TEU-km) are calculated for the purposes of the CCWG Performance Metrics. Calculation of Vessel CO2 Emissions
CCWG carriers report on the following data for each vessel through the annual CCWG Performance Metrics data collection process:
Nominal capacity in 20-foot equivalent container units (TEUs)
Number of reefer plugs
Distance sailed
Fuel consumed (HFO and MDO/MGO reported separately)
Timeframe of data The CCWG Performance Metrics Tool uses this information to calculate vessel CO2 emissions. A general formula for this calculation is:
Total kg fuel consumed for containers, multiplied by 3114.4 gCO2/kg fuel,
divided by the product of [maximum nominal TEU capacity * total distance sailed] The calculation methodology for dry containers is based on International Maritime Organization (IMO) guidance for emissions and carbon contents of fuels. CCWG will continue to align with IMO standards as they improve over time. CCWG members receive full access to the calculation methodologies and the ability to work with the group to shape future standards. The group continuously improves the methodology to increase the accuracy of data. Improvements are based on factors such as: changes to IMO protocols, new GHG standards, availability of better emissions factors, availability of more accurate data, utilization adjustments, and stakeholder expectations.

BSR | How Brands Improve Supply Chain Sustainability Through Shipping and Logistics 12
7. 2010 Environmental Performance Survey (EPS)
The EPS is a short questionnaire for CCWG carriers to supplement the detailed Performance Metrics submission. The EPS questions seek a combination of yes/no and descriptive responses in emerging issue areas, or areas in which clear performance metrics for the group do not exist. Each CCWG carrier submits an EPS annually. CCWG has historically made the EPS questionnaire available to the public.

BSR | How Brands Improve Supply Chain Sustainability Through Shipping and Logistics 13
8. Conclusion
CCWG’s evolving tools will continue to improve as the group assesses ongoing expectations driven by regulation, stakeholders, and business needs. The group’s success in achieving significant progress in supply chain sustainability is due to its inimitable focus on business-to-business relationships and collaborative decision-making. CCWG continues to focus on data accuracy and comparability, balanced in equal measure with what is feasible and actionable. Newcomers to CCWG will find standardized data and tools that are proven to simplify measurement, increase transparency, and reduce emissions in supply chain logistics and transportation. Global brands, retailers, and manufacturers that are looking to their supply chains for increased sustainability are encouraged to participate in CCWG and adopt CCWG’s tools and methodology for the ocean transportation portion of their shipments. For more information on CCWG, please contact Raj Sapru at +1 415 984 3209 or [email protected].

BSR | How Brands Improve Supply Chain Sustainability Through Shipping and Logistics 14
9. Appendix
CCWG Members
American Eagle Outfitters, Inc.
APL
CMA CGM
The Coca-Cola Company
COSCON
CSAV
DAMCO
DHL Deutsche Post
Electrolux
Hamburg Sud
Hanjin Shipping
Hapag Lloyd
Heineken N.V.
Hyundai Merchant Marine
IKEA
Johnson & Johnson
John Wiley & Sons, Inc.
K Line
Kuehne + Nagel Inc.
Li & Fung Limited
Maersk
Nike, Inc.
Nordstrom, Inc.
NYK Line
OOCL
Phillips-Van Heusen Corporation
Polo Ralph Lauren Corporation
Starbucks Coffee Company
Wal-Mart Stores, Inc.
Yang Ming Marine Transport Corp.
BSR | How Brands Improve Supply Chain Sustainability Through Shipping and Logistics 15
CO2 Formula
BSR | How Brands Improve Supply Chain Sustainability Through Shipping and Logistics 16
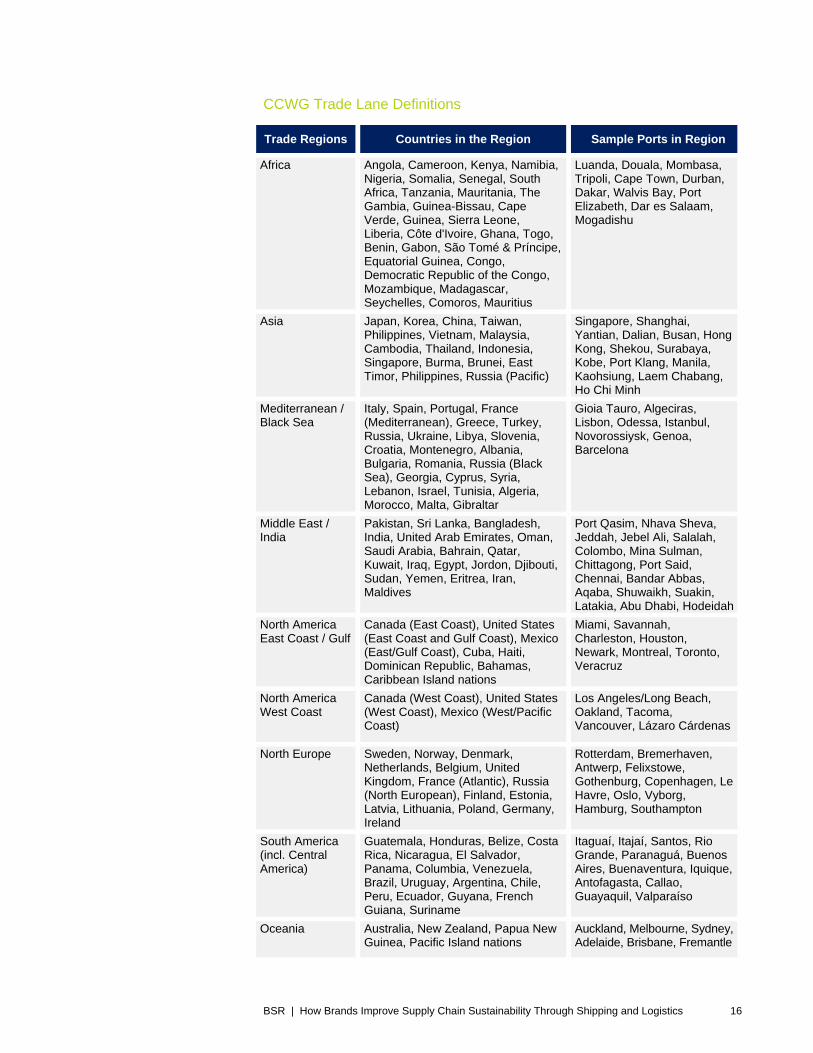
CCWG Trade Lane Definitions
Trade Regions Countries in the Region Sample Ports in Region
Africa Angola, Cameroon, Kenya, Namibia, Nigeria, Somalia, Senegal, South Africa, Tanzania, Mauritania, The Gambia, Guinea-Bissau, Cape Verde, Guinea, Sierra Leone, Liberia, Côte d'Ivoire, Ghana, Togo, Benin, Gabon, São Tomé & Príncipe, Equatorial Guinea, Congo, Democratic Republic of the Congo, Mozambique, Madagascar, Seychelles, Comoros, Mauritius
Luanda, Douala, Mombasa, Tripoli, Cape Town, Durban, Dakar, Walvis Bay, Port Elizabeth, Dar es Salaam, Mogadishu
Asia Japan, Korea, China, Taiwan, Philippines, Vietnam, Malaysia, Cambodia, Thailand, Indonesia, Singapore, Burma, Brunei, East Timor, Philippines, Russia (Pacific)
Singapore, Shanghai, Yantian, Dalian, Busan, Hong Kong, Shekou, Surabaya, Kobe, Port Klang, Manila, Kaohsiung, Laem Chabang, Ho Chi Minh
Mediterranean / Black Sea
Italy, Spain, Portugal, France (Mediterranean), Greece, Turkey, Russia, Ukraine, Libya, Slovenia, Croatia, Montenegro, Albania, Bulgaria, Romania, Russia (Black Sea), Georgia, Cyprus, Syria, Lebanon, Israel, Tunisia, Algeria, Morocco, Malta, Gibraltar
Gioia Tauro, Algeciras, Lisbon, Odessa, Istanbul, Novorossiysk, Genoa, Barcelona
Middle East / India
Pakistan, Sri Lanka, Bangladesh, India, United Arab Emirates, Oman, Saudi Arabia, Bahrain, Qatar, Kuwait, Iraq, Egypt, Jordon, Djibouti, Sudan, Yemen, Eritrea, Iran, Maldives
Port Qasim, Nhava Sheva, Jeddah, Jebel Ali, Salalah, Colombo, Mina Sulman, Chittagong, Port Said, Chennai, Bandar Abbas, Aqaba, Shuwaikh, Suakin, Latakia, Abu Dhabi, Hodeidah
North America East Coast / Gulf
Canada (East Coast), United States (East Coast and Gulf Coast), Mexico (East/Gulf Coast), Cuba, Haiti, Dominican Republic, Bahamas, Caribbean Island nations
Miami, Savannah, Charleston, Houston, Newark, Montreal, Toronto, Veracruz
North America West Coast
Canada (West Coast), United States (West Coast), Mexico (West/Pacific Coast)
Los Angeles/Long Beach, Oakland, Tacoma, Vancouver, Lázaro Cárdenas
North Europe Sweden, Norway, Denmark, Netherlands, Belgium, United Kingdom, France (Atlantic), Russia (North European), Finland, Estonia, Latvia, Lithuania, Poland, Germany, Ireland
Rotterdam, Bremerhaven, Antwerp, Felixstowe, Gothenburg, Copenhagen, Le Havre, Oslo, Vyborg, Hamburg, Southampton
South America (incl. Central America)
Guatemala, Honduras, Belize, Costa Rica, Nicaragua, El Salvador, Panama, Columbia, Venezuela, Brazil, Uruguay, Argentina, Chile, Peru, Ecuador, Guyana, French Guiana, Suriname
Itaguaí, Itajaí, Santos, Rio Grande, Paranaguá, Buenos Aires, Buenaventura, Iquique, Antofagasta, Callao, Guayaquil, Valparaíso
Oceania Australia, New Zealand, Papua New Guinea, Pacific Island nations
Auckland, Melbourne, Sydney, Adelaide, Brisbane, Fremantle