Embed Size (px)
Citation preview
Beyond the Playing Field: The Impact of Special Olympics Unified Sports
Final Report
Joanne Kersh Gary N. Siperstein Robin C. Parker
University of Massachusetts, Boston Special Olympics Global Collaborating Center
Beyond the Playing Field: Final Report
1
INTRODUCTION The movement to include children with disabilities in our schools and classrooms has been steadily supported by legislative and policy mandates for over 30 years. As such, children with intellectual disabilities today are more likely than ever to attend school and learn alongside their peers without disabilities. Special Olympics (SO) has kept pace with and often led the inclusion movement with the development of a variety of initiatives. One major initiative, Special Olympics Unified Sports™, unveiled in 1989, brings individuals with intellectual disabilities (athletes) and without intellectual disabilities (partners) together on the playing field as teammates, providing them with the opportunity to train and compete as equals. Unified Sports seeks to support the development of sports skills and a sense of teamwork and sportsmanship among athletes and partners, while also improving athletes’ sense of self and promoting the social acceptance of individuals with intellectual disabilities among their peers without disabilities. Unified Sports has expanded considerably in the past decade, now available in all seven regions of SO and includes over 150,000 athletes and partners around the world, however, it has not been without some growing pains. Early on, Unified Sports was confronted by systemic challenges, particularly at the state level. Specifically, some directors voiced concern about a new program that would potentially funnel resources away from traditional SO. In addition, not all states viewed Unified Sports as complimentary to the mission of traditional SO and in some instances, directors believed it actually detracted from the mission. In effect, the advancement of Unified Sports seemed to be dependent on the degree to which state programs emphasized inclusion. Today, after more than 20 years, the concept of Unified Sports has taken hold and its value and importance for both athletes and partners have been recognized. In an evaluation of Unified Sports programs in the US (Siperstein, Hardman, Wappett, & Clary, 2001), both athletes and partners noted improvements in their sport skills and feelings about themselves as a result of their participation. These findings were replicated in a later evaluation of the Unified Sports Football Program in Europe (Norins, Harada, Parker & Brecklinghaus, 2008). There is also evidence to suggest that Unified Sports does indeed provide partners with the opportunity to witness the competence of athletes with intellectual disabilities, a key factor in the promotion of positive attitudes toward individuals with intellectual disabilities (Siperstein, Parker, Norins, & Widaman, 2007). For example, in the US almost all partners reported that they had gained a better understanding of individuals with intellectual disabilities as a result of their experience (Siperstein, et al., 2001). Similar findings were noted in Europe where one of the outcomes for participating partners was an improved understanding and appreciation for their peers with intellectual disabilities (Norins et al., 2008). It is clear that both athletes and partners derive personal benefits as a result of their participation in Unified Sports. Less understood is how the improvements made by participating athletes and partners carry over into other areas of their lives, for example in the classroom and school. In the US, many Unified Sports programs for children are school based, quite often taking the form of after-school programs, in which teams meet to practice one afternoon a week. Recently there has

Beyond the Playing Field: Final Report
2
been much attention given to the potential value of after-school recreational programming, like Unified Sports, in building skills and developing abilities that are of benefit to children in other areas of their lives. Studies have suggested that students participating in sports and recreation programming demonstrate more desirable behaviors in the classroom (e.g. Howie, et al, 2010; Watts, Witt & King, 2008), as well as experience improvements in their social competence (e.g. Fletcher, Nickerson, Wright, 2003; Howie, et al., 2010), thus there is reason to believe that recreational sports programming may also hold great promise in helping students with intellectual disabilities meet the expectations of the classroom. As a next step the present study sought to go beyond the earlier evaluations of Unified Sports to explore its value “beyond the playing field,” in particular how participation benefits athletes and partners in the classroom and school settings. The objectives of this study were to assess how the gains athletes and partners make through participation in Unified Sports generalize to the classroom. More specifically, what is the impact of participation in Unified Sports on athletes’ and partners’ social competence (e.g., social skills and social relationships) and their academic competence (e.g., classroom behavior and motivation).
Beyond the Playing Field: Final Report
3
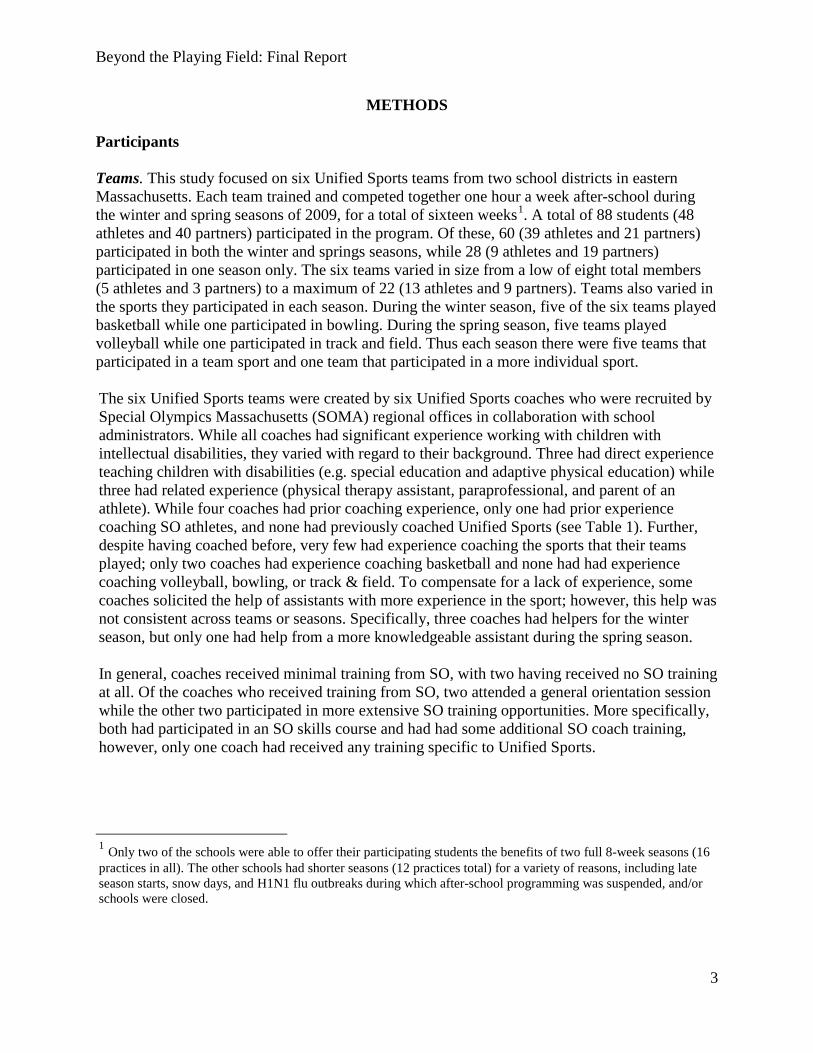
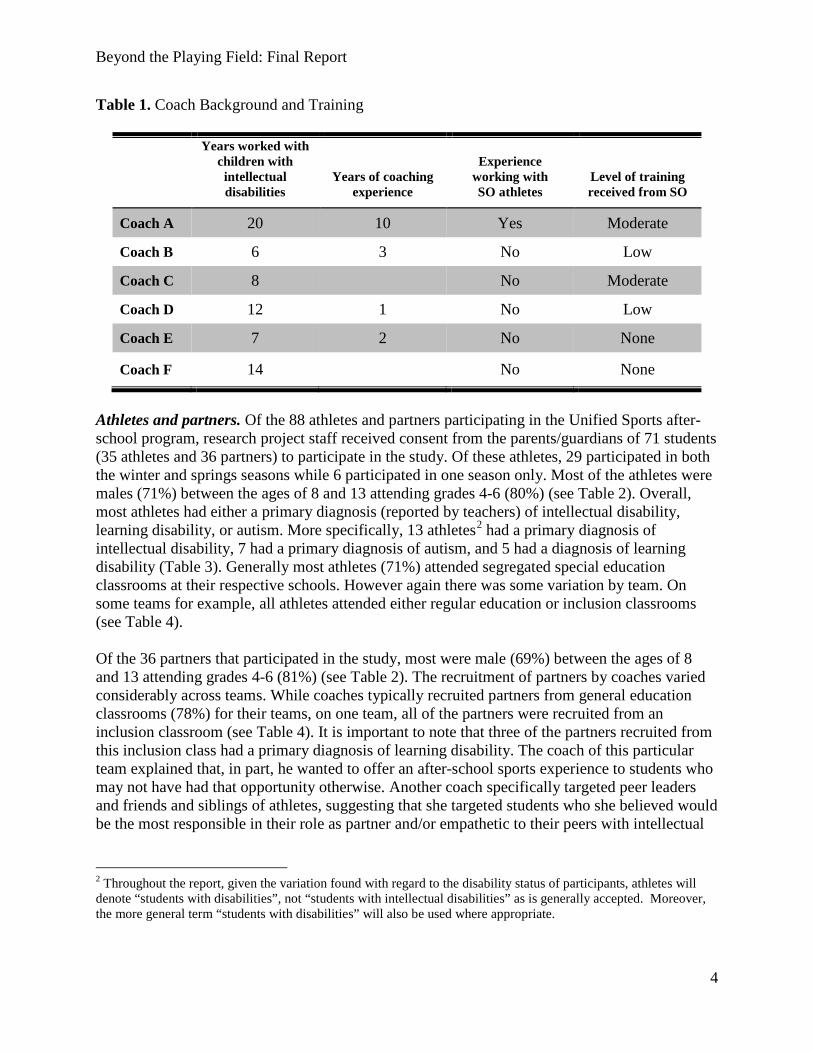
METHODS Participants Teams. This study focused on six Unified Sports teams from two school districts in eastern Massachusetts. Each team trained and competed together one hour a week after-school during the winter and spring seasons of 2009, for a total of sixteen weeks1. A total of 88 students (48 athletes and 40 partners) participated in the program. Of these, 60 (39 athletes and 21 partners) participated in both the winter and springs seasons, while 28 (9 athletes and 19 partners) participated in one season only. The six teams varied in size from a low of eight total members (5 athletes and 3 partners) to a maximum of 22 (13 athletes and 9 partners). Teams also varied in the sports they participated in each season. During the winter season, five of the six teams played basketball while one participated in bowling. During the spring season, five teams played volleyball while one participated in track and field. Thus each season there were five teams that participated in a team sport and one team that participated in a more individual sport. The six Unified Sports teams were created by six Unified Sports coaches who were recruited by Special Olympics Massachusetts (SOMA) regional offices in collaboration with school administrators. While all coaches had significant experience working with children with intellectual disabilities, they varied with regard to their background. Three had direct experience teaching children with disabilities (e.g. special education and adaptive physical education) while three had related experience (physical therapy assistant, paraprofessional, and parent of an athlete). While four coaches had prior coaching experience, only one had prior experience coaching SO athletes, and none had previously coached Unified Sports (see Table 1). Further, despite having coached before, very few had experience coaching the sports that their teams played; only two coaches had experience coaching basketball and none had had experience coaching volleyball, bowling, or track & field. To compensate for a lack of experience, some coaches solicited the help of assistants with more experience in the sport; however, this help was not consistent across teams or seasons. Specifically, three coaches had helpers for the winter season, but only one had help from a more knowledgeable assistant during the spring season. In general, coaches received minimal training from SO, with two having received no SO training at all. Of the coaches who received training from SO, two attended a general orientation session while the other two participated in more extensive SO training opportunities. More specifically, both had participated in an SO skills course and had had some additional SO coach training, however, only one coach had received any training specific to Unified Sports.
1 Only two of the schools were able to offer their participating students the benefits of two full 8-week seasons (16 practices in all). The other schools had shorter seasons (12 practices total) for a variety of reasons, including late season starts, snow days, and H1N1 flu outbreaks during which after-school programming was suspended, and/or schools were closed.
Beyond the Playing Field: Final Report
4
Table 1. Coach Background and Training
Years worked with children with intellectual disabilities
Years of coaching experience
Experience working with SO athletes
Level of training received from SO
Coach A 20 10 Yes Moderate
Coach B 6 3 No Low
Coach C 8 No Moderate
Coach D 12 1 No Low
Coach E 7 2 No None
Coach F 14 No None
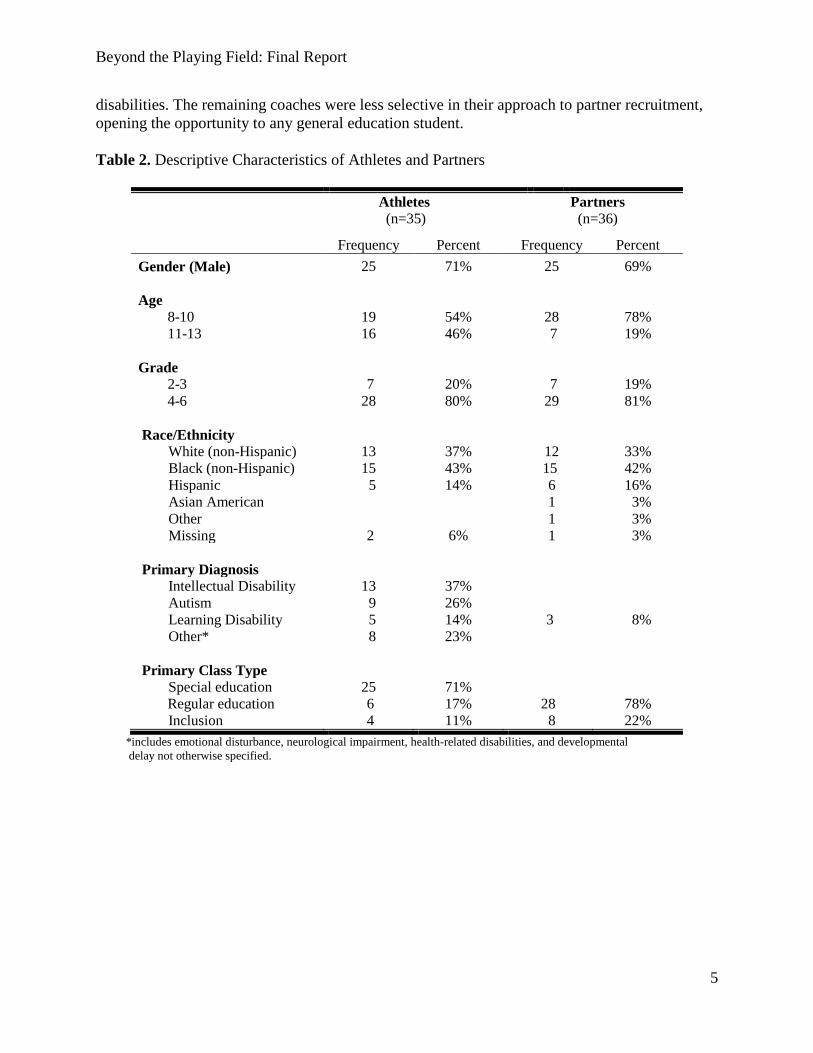
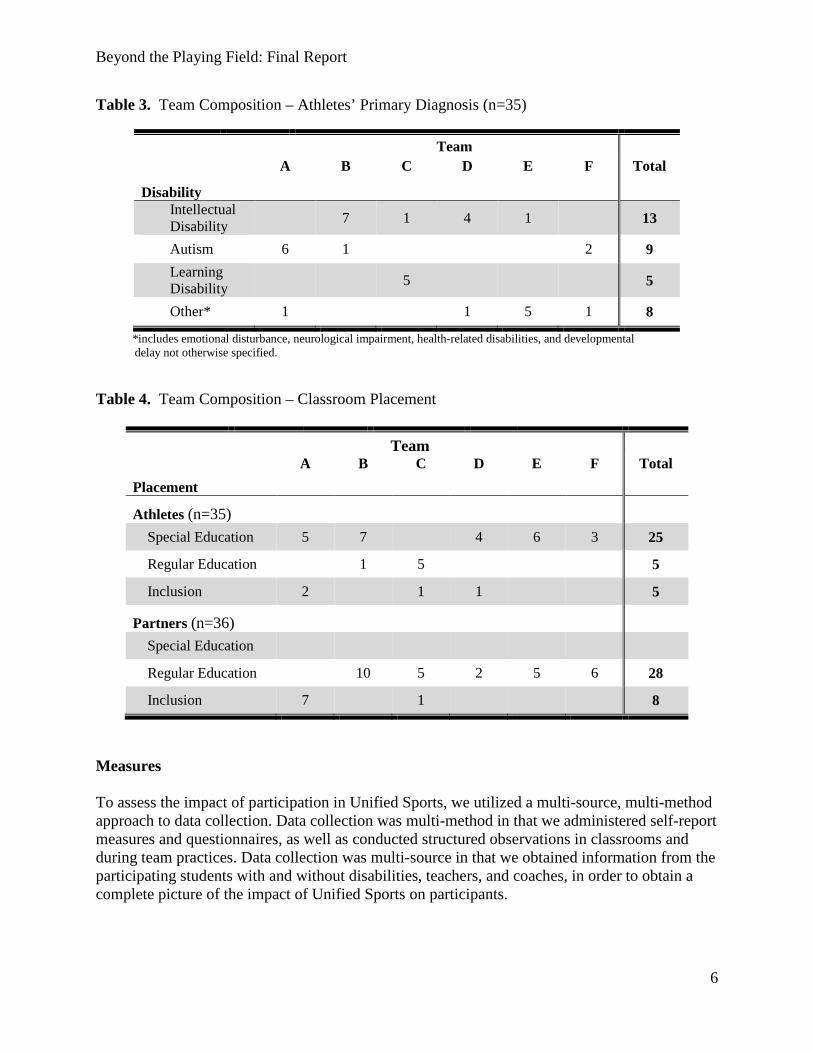
Athletes and partners. Of the 88 athletes and partners participating in the Unified Sports after-school program, research project staff received consent from the parents/guardians of 71 students (35 athletes and 36 partners) to participate in the study. Of these athletes, 29 participated in both the winter and springs seasons while 6 participated in one season only. Most of the athletes were males (71%) between the ages of 8 and 13 attending grades 4-6 (80%) (see Table 2). Overall, most athletes had either a primary diagnosis (reported by teachers) of intellectual disability, learning disability, or autism. More specifically, 13 athletes2 had a primary diagnosis of intellectual disability, 7 had a primary diagnosis of autism, and 5 had a diagnosis of learning disability (Table 3). Generally most athletes (71%) attended segregated special education classrooms at their respective schools. However again there was some variation by team. On some teams for example, all athletes attended either regular education or inclusion classrooms (see Table 4). Of the 36 partners that participated in the study, most were male (69%) between the ages of 8 and 13 attending grades 4-6 (81%) (see Table 2). The recruitment of partners by coaches varied considerably across teams. While coaches typically recruited partners from general education classrooms (78%) for their teams, on one team, all of the partners were recruited from an inclusion classroom (see Table 4). It is important to note that three of the partners recruited from this inclusion class had a primary diagnosis of learning disability. The coach of this particular team explained that, in part, he wanted to offer an after-school sports experience to students who may not have had that opportunity otherwise. Another coach specifically targeted peer leaders and friends and siblings of athletes, suggesting that she targeted students who she believed would be the most responsible in their role as partner and/or empathetic to their peers with intellectual
2 Throughout the report, given the variation found with regard to the disability status of participants, athletes will denote “students with disabilities”, not “students with intellectual disabilities” as is generally accepted. Moreover, the more general term “students with disabilities” will also be used where appropriate.
Beyond the Playing Field: Final Report
5
disabilities. The remaining coaches were less selective in their approach to partner recruitment, opening the opportunity to any general education student. Table 2. Descriptive Characteristics of Athletes and Partners
Athletes (n=35)
Partners (n=36)
Frequency Percent Frequency Percent Gender (Male) 25 71% 25 69% Age 8-10 19 54% 28 78% 11-13 16 46% 7 19% Grade 2-3 7 20% 7 19% 4-6 28 80% 29 81% Race/Ethnicity
White (non-Hispanic) 13 37% 12 33% Black (non-Hispanic) 15 43% 15 42% Hispanic 5 14% 6 16% Asian American 1 3% Other 1 3% Missing 2 6% 1 3%
Primary Diagnosis
Intellectual Disability 13 37% Autism 9 26% Learning Disability 5 14% 3 8% Other* 8 23%
Primary Class Type
Special education 25 71% Regular education 6 17% 28 78%
Inclusion 4 11% 8 22% *includes emotional disturbance, neurological impairment, health-related disabilities, and developmental delay not otherwise specified.
Beyond the Playing Field: Final Report
6
Table 3. Team Composition – Athletes’ Primary Diagnosis (n=35)
Team
Disability
A B C D E F Total
Intellectual Disability 7 1 4 1 13
Autism 6 1 2 9 Learning Disability 5 5
Other* 1 1 5 1 8
*includes emotional disturbance, neurological impairment, health-related disabilities, and developmental delay not otherwise specified. Table 4. Team Composition – Classroom Placement
Team
Placement A B C D E F Total
Athletes (n=35)
Special Education 5 7 4 6 3 25
Regular Education 1 5 5
Inclusion 2 1 1 5
Partners (n=36)
Special Education
Regular Education 10 5 2 5 6 28
Inclusion 7 1 8
Measures To assess the impact of participation in Unified Sports, we utilized a multi-source, multi-method approach to data collection. Data collection was multi-method in that we administered self-report measures and questionnaires, as well as conducted structured observations in classrooms and during team practices. Data collection was multi-source in that we obtained information from the participating students with and without disabilities, teachers, and coaches, in order to obtain a complete picture of the impact of Unified Sports on participants.
Beyond the Playing Field: Final Report
7
Several instruments were developed for use in this study while others were drawn from existing instruments that have been successfully used or modified in past research involving elementary school students with and without disabilities. Information was collected to describe and document the perceived benefits of Unified Sports on participating children with and without disabilities as well as to describe and document the variability in implementation of the after-school Unified Sports programs across the different schools. A brief description of the instruments employed in the study is provided below. Assessment of Social and Academic Adjustment Harter Self-Concept Scale. Four subscales of the Harter Self-Concept Scale (Harter, 1985) were administered to athletes and partners to assess their social, athletic, behavioral, and global self-concept. This 36-question scale has been used successfully with elementary-aged students with and without disabilities to evaluate peer acceptance and self-perception (e.g., Armstrong, 1992; Boivin & Hymel, 1997; Short, 1992; Williams & Asher, 1992). Social Skills Rating System. To assess the social skills and academic adjustment of athletes and partners, the Social Skills, Problem Behaviors, and Academic Competence subscales of the Social Skills Rating System (SSRS; Gresham & Elliott, 1990) were administered to teachers (30 items, 18 items, and 9 items respectively). The Social Skills subscale assesses cooperation, assertion, and self-control. The Problem Behavior subscale assesses externalizing, internalizing, and hyperactive behaviors among children. The Academic Competence subscale assesses children’s classroom performance, motivation, and general functioning Teacher Rating Scale of School Adjustment. To assess students’ adjustment to school, teachers completed the Teacher Rating Scale of School Adjustment (TRSSA; Birch & Ladd, 1997) for each student. This 52-item scale includes five dimensions: 1) school liking: 2) school avoidance; 3) cooperative participation; 4) self-directedness; and 5) comfort with teacher. Student Behavior Questionnaire. To assess changes in students’ classroom conduct, interactions with peers and adults, sense of self, and (for partners) attitudes towards people with intellectual disabilities as a result of participation in Unified Sports, teachers were asked a series of open-ended questions about any perceived changes over the course of students’ participation. Friendships Questionnaire. To assess the social relationships of athletes and partners, this brief questionnaire was administered to participating students. This questionnaire asked students to list up to five of their closest friends and provide brief information about each relationship (e.g., how they met, the types of activities they do together, etc.). Friendship Activities Scale. To assess partner’s commitment to befriend a peer with an intellectual disability, the Friendship Activities Scale (Siperstein & Bak, 1985) was employed. This 17-item scale asks children whether they would engage in a range of friendship activities with a peer with an intellectual disability; for example, say hello, sit next to him or her in class, share part of their lunch, or invite him or her to their house. Responses are given on a 4-point scale (0=no; 1=probably no; 2=probably yes; 3=yes).
Beyond the Playing Field: Final Report
8
Structured Observations of the Classroom. To assess social interactions and classroom behavior, research project staff observed each athlete and partner in the classroom at the beginning and end of their involvement in Unified Sports. Specifically, each athlete and partner was assessed on their 1) positive interactions with classmates; 2) compliance; 3) positive and negative academic behavior; and 4) on- and off-task behavior. Assessment of the Unified Sports Experience Structured Observations of the Team: Unified Sports practice sessions were observed using instruments developed by project staff. Observers monitored and recorded overall social interactions among teammates, interactions with the coach, and general behavior. During these observations coaching behaviors, such as constructive feedback and provision of individual instruction, were also monitored and recorded, and observers recorded their perceptions of what areas of development (i.e., specific sports skills, social relationships) coaches emphasized. Teammate Questionnaire. Athletes and partners were administered the Teammate Questionnaire to obtain information about their overall Unified Sports experience. This brief questionnaire includes items that address athletes’ and partners’ motivation for joining the after-school Unified Sports program, their enjoyment of Unified Sports, and questions about their social relationships with teammates. Coach Pre and Post Questionnaires. Coaches completed questionnaires at the beginning of the Unified Sports program and at the conclusion. Many of the items were adapted from questionnaires that have been used previously to evaluate Unified Sports (e.g. Norins et al., 2008).The pre-season questionnaire was administered to obtain information about the coaches’ preparation for coaching Unified Sports and their goals for the after-school Unified Sports experience. It includes questions about coaches’ training and prior coaching experience, how athletes and partners were selected, and their overall expectations and goals for the participating athletes and partners. The Post Questionnaire, administered at the end of the spring season, asked coaches to reflect on their coaching experiences. It includes questions about the extent to which they used specific techniques during practices (e.g., verbal reinforcement, humor, and constructive feedback), and the extent to which they attempted to address individual needs for instruction. Coaches were also asked to identify any challenges to implementing the Unified Sports program (e.g., recruitment, attendance, behavior problems, and partner dominance) as well as successes. Coach Logs. Coaches completed weekly online logs at the completion of each team practice as an ongoing record of what took place during the Unified Sports program. Specifically, after each practice coaches supplied information about the drills and activities included, their focus on team vs. individual development, and teammate interactions and behavior.
Beyond the Playing Field: Final Report
9
Procedures As stated above, coaches, with the support of regional SOMA program staff and school administrators, were responsible for the recruitment of athletes and partners to the Unified teams at each school. Once students had been identified for participation, research project staff contacted the parents of athletes and partners to obtain consent for their participation in the study. Parents were clearly informed of the activities that would be asked of their children during the course of the study, that participation in the study was voluntary (and not a requirement of the Unified Sports after-school program), and that they may withdraw from the study at any time without consequence. Similarly classroom teachers, with support from the Unified Sports coach and school administrators, were also contacted to obtain their consent to participate in the study. All were given information about the purpose of the study and expectations for their participation were outlined; twenty-six teachers agreed to participate. Participating students and teachers generally completed questionnaires as close to the beginning and end of students’ involvement in Unified Sports as possible. Coaches completed the Pre and Post Coach Questionnaires at the beginning and end of the Unified Sports program, respectively. Additionally, they completed weekly coach logs after each practice. Five of the six coaches completed the weekly logs online; one chose to complete a paper and pencil version. Teachers completed all subscales of the SSRS and the TRSA at the beginning and end of students’ involvement in Unified Sports. They also completed the Student Behavior Questionnaire at the conclusion of students’ involvement in Unified Sports. All measures completed by teachers were in pencil and paper format. Athletes’ and partners’ completed the Harter Self-Concept Scale and the Friendships Questionnaire at the beginning and end of their involvement in Unified Sports. They also completed the Teammate Questionnaire at the conclusion of the program. The Friendship Activities Scale was administered to partners only at the conclusion of their Unified Sports participation. This was done because it is possible that exposure to this instrument during the pre-assessment could substantially bias the post-assessment. That is, asking partners about their intentions to befriend a fellow student with an intellectual disability could have an influence on their actual behavior when participating in the Unified Sports program. Data were collected from participating students in a one-on-one setting during the school day at the beginning and end of their involvement in Unified Sports. Project staff worked closely with cooperating teachers and school administrators to schedule data collection sessions that would minimize classroom disruptions. Further, measurement instruments were chosen carefully to yield maximum information, while requiring a minimum of time on the part of students and teachers. At the beginning of each session, project staff followed a scripted protocol where they introduced themselves and explained the purpose of each instrument that was to be administered. Each student was told and reminded that their participation was voluntary and confidential, and that they may stop at any time without penalty. Project staff was available to assist students in
Beyond the Playing Field: Final Report
10
the completion of questionnaires (particularly students with intellectual / developmental disabilities). Classroom observations, scheduled in collaboration with cooperating teachers, took place at the beginning and end of students’ involvement in the Unified Sports programs. Project staff tried to schedule each student’s pre and post observations at the same time and on the same day of the week to ensure consistency in classroom activity for each child. Team practices at each school were observed weekly by research project staff.
Beyond the Playing Field: Final Report
11
RESULTS In the following section the results of the data analyses are presented. First we present the findings of analyses that explored the impact of participation in Unified Sports on athletes and partners. We consider impact on both social and academic adjustment, as measured by student self-report, teacher ratings, and classroom observations. Teacher responses to open-ended questioning about the value of Unified Sports are also included. We then focus on the variability between teams by contrasting two examples. We draw on data from coach reports and team practice observations to present information about differences in team composition and coaching style, and discuss how these differences impact the Unified Sports experience for students. Social and Academic Adjustment Building on the findings of previous studies (e.g., Castagno, 2001), we documented general improvement in the self-concept of participating athletes and partners, based on student self-report across all schools. Of the 71 students who participated in the Unified Sports after-school program, 55 completed the Harter Self-Concept Scale at both the beginning and end of their participation in Unified sports (27 athletes and 28 partners)3. Statistical comparisons (paired-sample t-tests) indicated that, in general, teammates experienced significant increases in self-perceptions of their social acceptance and behavioral conduct, as well as in overall self-concept (see Table 5). These group level changes seem to be largely driven by changes in self-concept experienced by athletes, particularly in perceived social acceptance. Athletes’ enhanced feelings of social acceptance were endorsed by their reported friendships within the context of their Unified Sports teams. Not only did most of the athletes (81%) report having at least one friend on their team at the beginning of the Unified Sports program, almost all of these athletes reported that they had become better friends with this person during the course of the season (see Table 6). Partners reported a similar experience. Three-quarters (75%) of partners also reported having at least one friend on their team at the beginning of the program with just over half (57%) of those reporting that they had become better friends during the course of the season. 3 Eight students were unable to complete the measure because they lacked the necessary language ability and ten were unable to complete the measure at the post due to an H1N1 flu outbreak in the school.

Beyond the Playing Field: Final Report
12
Table 5. Student Self-Concept: Comparison of Pre and Post Scores
Pre Post Mean (SD) Mean (SD) t-value WHOLE GROUP (n=55) Overall 3.16 (.433) 3.32 (.468) 3.43** Subscales
Social Acceptance 2.96 (.679) 3.21(.608) 2.84** Athletic Competence 3.00 (.571) 3.07 (.582) 0.87 Behavioral Conduct 3.25 (.680) 3.45 (.664) 2.57* Global self-worth
3.44 (.621) 3.55 (.542) 1.83
ATHLETES (n=27) Overall 3.20 (.301) 3.41 (.409) 2.78* Subscales
Social Acceptance 2.80 (.694) 3.30 (.569) 3.81** Athletic Competence 3.07 (.567) 3.14 (.610) 0.62 Behavioral Conduct 3.37 (.525) 3.56 (.449) 1.80† Global self-worth
3.58 (.394) 3.64 (.412) 0.91
PARTNERS (n=28) Overall 3.13 (.533) 3.23 (.511) 2.02† Subscales
Social Acceptance 3.11 (.641) 3.13 (.642) 0.21 Athletic Competence 2.94 (.579) 3.01 (.556) 0.60 Behavioral Conduct 3.14 (.796) 3.34 (.816) 1.81† Global self-worth 3.31 (.765) 3.45 (.636) 1.60
† p < .10; * p < .05; ** p < .01 Table 6. Teammate Friendships
Have a friend
on team “A lot” better friends with
one or more friends on team
Athletes (n=27) 81% 91%
Partners (n=28) 75% 57%
Beyond the Playing Field: Final Report
13
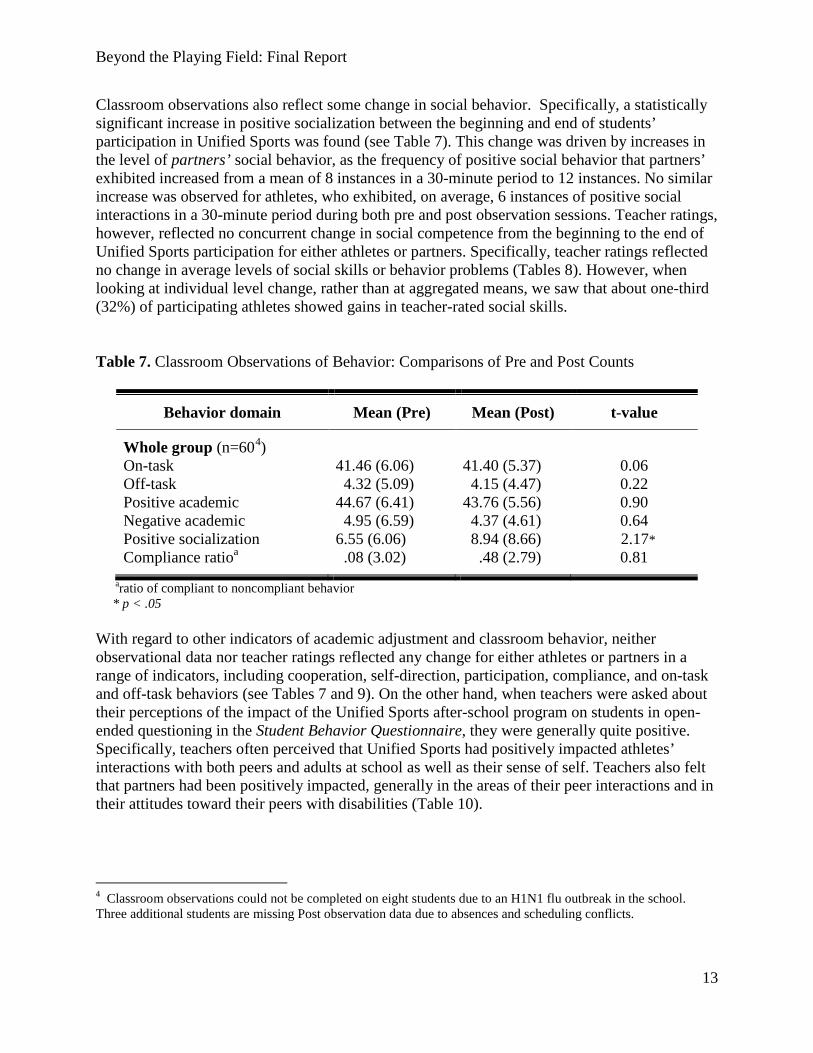
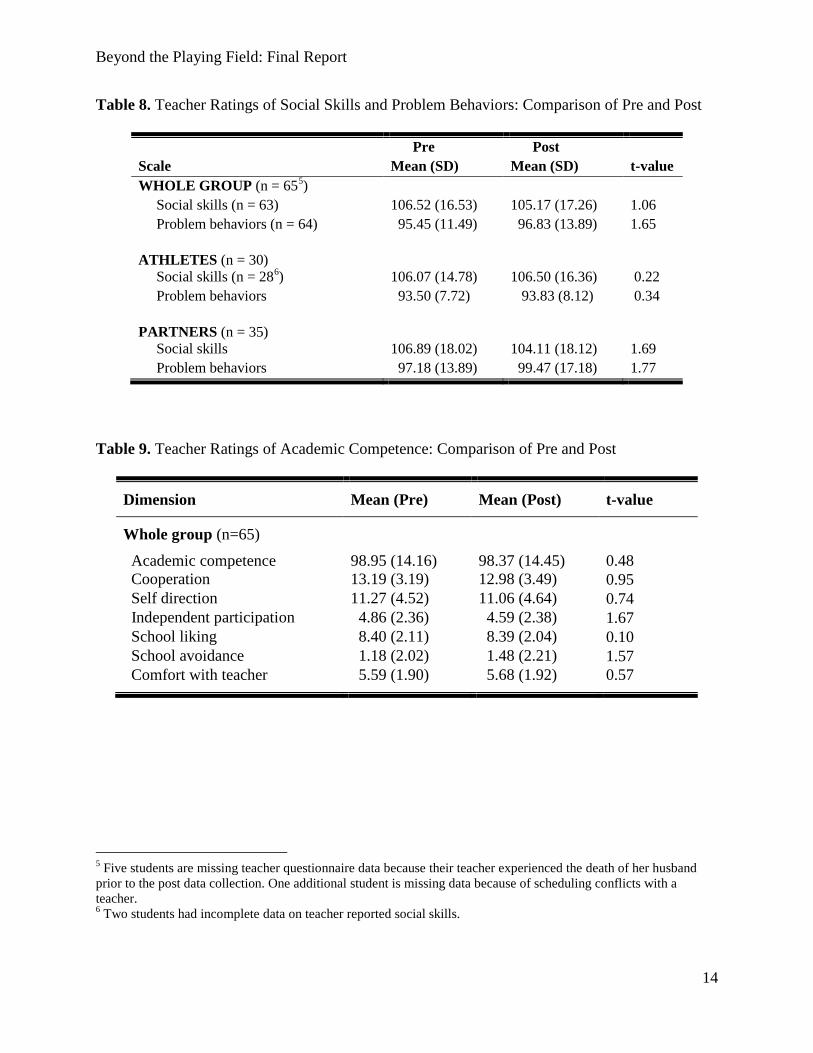
Classroom observations also reflect some change in social behavior. Specifically, a statistically significant increase in positive socialization between the beginning and end of students’ participation in Unified Sports was found (see Table 7). This change was driven by increases in the level of partners’ social behavior, as the frequency of positive social behavior that partners’ exhibited increased from a mean of 8 instances in a 30-minute period to 12 instances. No similar increase was observed for athletes, who exhibited, on average, 6 instances of positive social interactions in a 30-minute period during both pre and post observation sessions. Teacher ratings, however, reflected no concurrent change in social competence from the beginning to the end of Unified Sports participation for either athletes or partners. Specifically, teacher ratings reflected no change in average levels of social skills or behavior problems (Tables 8). However, when looking at individual level change, rather than at aggregated means, we saw that about one-third (32%) of participating athletes showed gains in teacher-rated social skills. Table 7. Classroom Observations of Behavior: Comparisons of Pre and Post Counts
Behavior domain Mean (Pre) Mean (Post) t-value
Whole group (n=604) On-task 41.46 (6.06) 41.40 (5.37) 0.06 Off-task 4.32 (5.09) 4.15 (4.47) 0.22 Positive academic 44.67 (6.41) 43.76 (5.56) 0.90 Negative academic 4.95 (6.59) 4.37 (4.61) 0.64 Positive socialization 6.55 (6.06) 8.94 (8.66) 2.17* Compliance ratioa .08 (3.02) .48 (2.79) 0.81
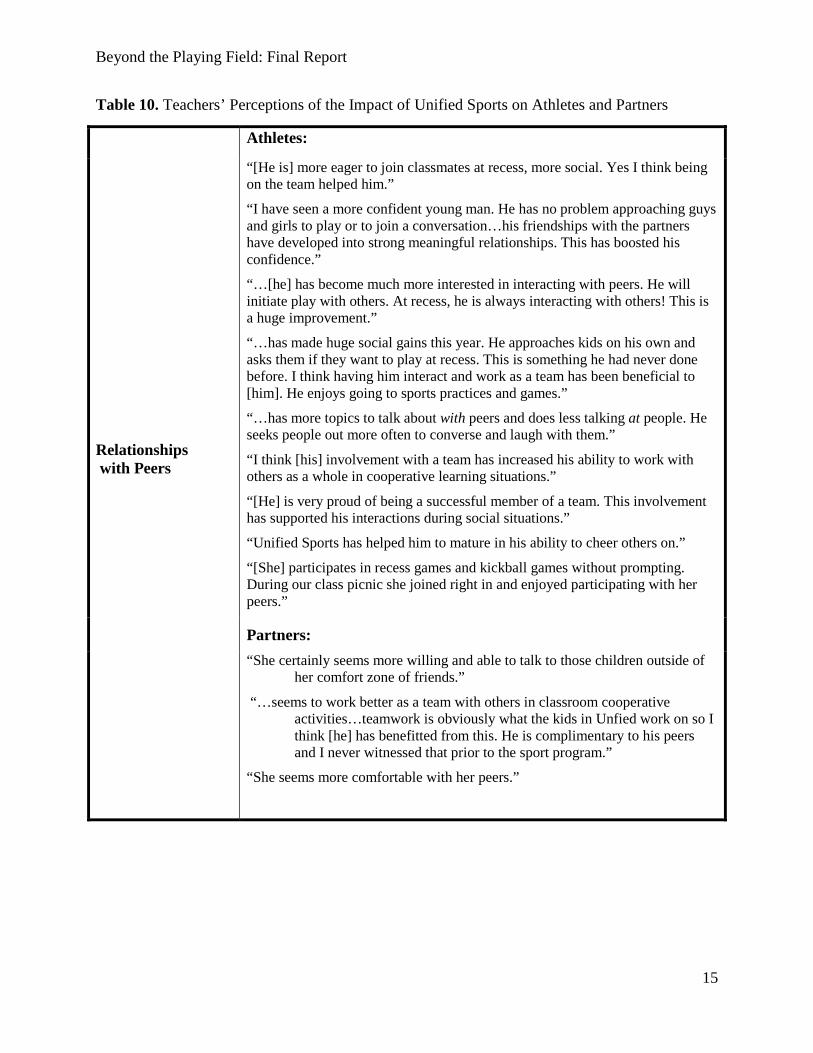
aratio of compliant to noncompliant behavior * p < .05 With regard to other indicators of academic adjustment and classroom behavior, neither observational data nor teacher ratings reflected any change for either athletes or partners in a range of indicators, including cooperation, self-direction, participation, compliance, and on-task and off-task behaviors (see Tables 7 and 9). On the other hand, when teachers were asked about their perceptions of the impact of the Unified Sports after-school program on students in open-ended questioning in the Student Behavior Questionnaire, they were generally quite positive. Specifically, teachers often perceived that Unified Sports had positively impacted athletes’ interactions with both peers and adults at school as well as their sense of self. Teachers also felt that partners had been positively impacted, generally in the areas of their peer interactions and in their attitudes toward their peers with disabilities (Table 10).
4 Classroom observations could not be completed on eight students due to an H1N1 flu outbreak in the school. Three additional students are missing Post observation data due to absences and scheduling conflicts.
Beyond the Playing Field: Final Report
14
Table 8. Teacher Ratings of Social Skills and Problem Behaviors: Comparison of Pre and Post
Pre Post Scale Mean (SD) Mean (SD) t-value WHOLE GROUP (n = 655)
Social skills (n = 63) 106.52 (16.53) 105.17 (17.26) 1.06 Problem behaviors (n = 64) 95.45 (11.49) 96.83 (13.89) 1.65
ATHLETES (n = 30)
Social skills (n = 286) 106.07 (14.78) 106.50 (16.36) 0.22 Problem behaviors 93.50 (7.72) 93.83 (8.12) 0.34
PARTNERS (n = 35)
Social skills 106.89 (18.02) 104.11 (18.12) 1.69 Problem behaviors 97.18 (13.89) 99.47 (17.18) 1.77
Table 9. Teacher Ratings of Academic Competence: Comparison of Pre and Post
Dimension Mean (Pre) Mean (Post) t-value
Whole group (n=65)
Academic competence 98.95 (14.16) 98.37 (14.45) 0.48 Cooperation 13.19 (3.19) 12.98 (3.49) 0.95 Self direction 11.27 (4.52) 11.06 (4.64) 0.74 Independent participation 4.86 (2.36) 4.59 (2.38) 1.67 School liking 8.40 (2.11) 8.39 (2.04) 0.10 School avoidance 1.18 (2.02) 1.48 (2.21) 1.57 Comfort with teacher 5.59 (1.90) 5.68 (1.92) 0.57
5 Five students are missing teacher questionnaire data because their teacher experienced the death of her husband prior to the post data collection. One additional student is missing data because of scheduling conflicts with a teacher. 6 Two students had incomplete data on teacher reported social skills.
Beyond the Playing Field: Final Report
15
Table 10. Teachers’ Perceptions of the Impact of Unified Sports on Athletes and Partners
Relationships with Peers
Athletes:
“[He is] more eager to join classmates at recess, more social. Yes I think being on the team helped him.”
“I have seen a more confident young man. He has no problem approaching guys and girls to play or to join a conversation…his friendships with the partners have developed into strong meaningful relationships. This has boosted his confidence.”
“…[he] has become much more interested in interacting with peers. He will initiate play with others. At recess, he is always interacting with others! This is a huge improvement.”
“…has made huge social gains this year. He approaches kids on his own and asks them if they want to play at recess. This is something he had never done before. I think having him interact and work as a team has been beneficial to [him]. He enjoys going to sports practices and games.”
“…has more topics to talk about with peers and does less talking at people. He seeks people out more often to converse and laugh with them.”
“I think [his] involvement with a team has increased his ability to work with others as a whole in cooperative learning situations.”
“[He] is very proud of being a successful member of a team. This involvement has supported his interactions during social situations.”
“Unified Sports has helped him to mature in his ability to cheer others on.”
“[She] participates in recess games and kickball games without prompting. During our class picnic she joined right in and enjoyed participating with her peers.”
Partners: “She certainly seems more willing and able to talk to those children outside of
her comfort zone of friends.”
“…seems to work better as a team with others in classroom cooperative activities…teamwork is obviously what the kids in Unfied work on so I think [he] has benefitted from this. He is complimentary to his peers and I never witnessed that prior to the sport program.”
“She seems more comfortable with her peers.”

Beyond the Playing Field: Final Report
16
Table 10. Teachers’ Perceptions (continued) Relationships with Adults
Athletes: “[He] has more confidence asking questions about that which he doesn’t understand…”
“[She] is learning to self advocate appropriately.”
“[He] used to be slow to approach me if he needed clarification about class work. He seems to be less timid about asking questions now. I think Unified Sports gave [him] a sense of self worth and a boost in his confidence.”
Partners “He now handles constructive criticism better” (partner)
Sense of Self
Athletes: “[He] was definitely more confident after being around his peers outside of school. A team atmosphere made the difference.”
“He has gained self confidence and self respect.”
“Has always been an incredible athlete. This has given him a chance to be a leader.”
“[Her] self-esteem has definitely been raised. She has been able to be a leader on the team. She has found new skills that she enjoys and that she is great at!”
Partners: “[He] is proud of the team he is on and likes to talk about the games they play against other schools.” (partner)
Attitudes of Partners
“He has a higher tolerance for children who are disruptive.”
“I believe he is more aware of kids with special needs and is more willing to offer help.”
“[He] has shown a better understanding of the students he played basketball with. He is more apt to interact with them at school. I believe this (Unified Sports) is the sole reason of the positive change.”
“[She] is the one student who this experience has affected in the most positive way. She connected with an autistic boy and really works well with him. They turned into great friends.”
“She is more accepting and more willing to help her peers with disabilities. Yes, I would attribute this to Unified Sports.”
Beyond the Playing Field: Final Report
17
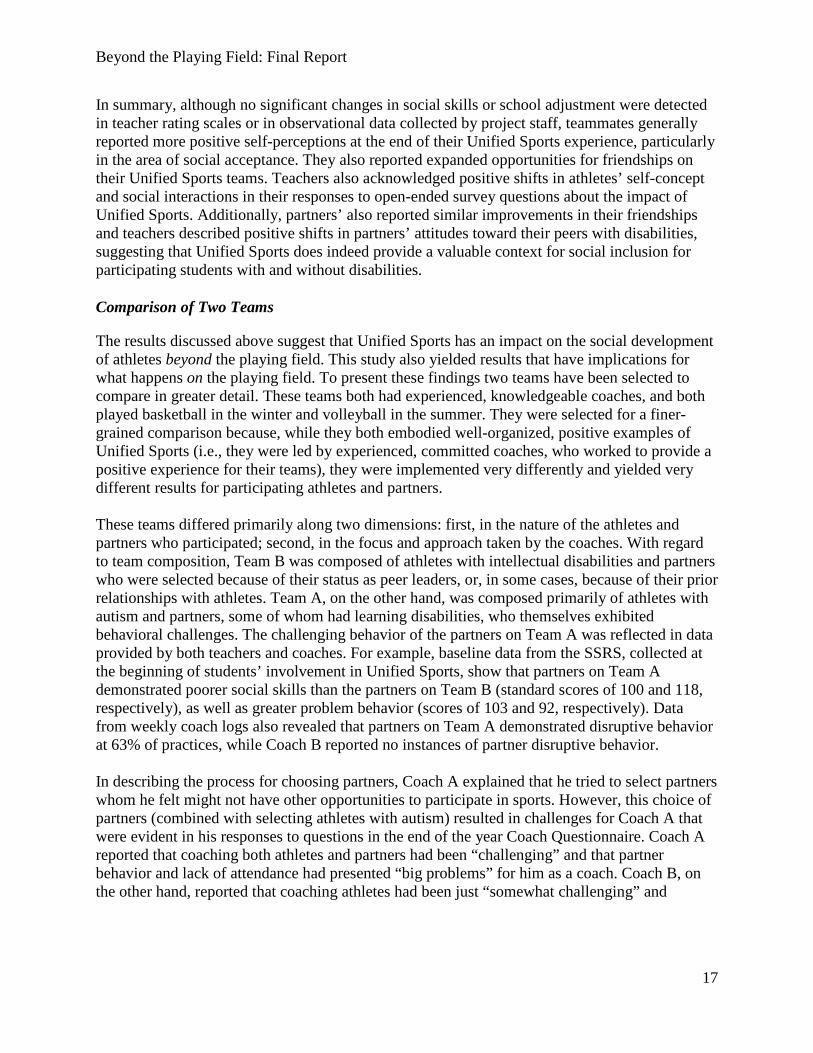
In summary, although no significant changes in social skills or school adjustment were detected in teacher rating scales or in observational data collected by project staff, teammates generally reported more positive self-perceptions at the end of their Unified Sports experience, particularly in the area of social acceptance. They also reported expanded opportunities for friendships on their Unified Sports teams. Teachers also acknowledged positive shifts in athletes’ self-concept and social interactions in their responses to open-ended survey questions about the impact of Unified Sports. Additionally, partners’ also reported similar improvements in their friendships and teachers described positive shifts in partners’ attitudes toward their peers with disabilities, suggesting that Unified Sports does indeed provide a valuable context for social inclusion for participating students with and without disabilities. Comparison of Two Teams
The results discussed above suggest that Unified Sports has an impact on the social development of athletes beyond the playing field. This study also yielded results that have implications for what happens on the playing field. To present these findings two teams have been selected to compare in greater detail. These teams both had experienced, knowledgeable coaches, and both played basketball in the winter and volleyball in the summer. They were selected for a finer-grained comparison because, while they both embodied well-organized, positive examples of Unified Sports (i.e., they were led by experienced, committed coaches, who worked to provide a positive experience for their teams), they were implemented very differently and yielded very different results for participating athletes and partners. These teams differed primarily along two dimensions: first, in the nature of the athletes and partners who participated; second, in the focus and approach taken by the coaches. With regard to team composition, Team B was composed of athletes with intellectual disabilities and partners who were selected because of their status as peer leaders, or, in some cases, because of their prior relationships with athletes. Team A, on the other hand, was composed primarily of athletes with autism and partners, some of whom had learning disabilities, who themselves exhibited behavioral challenges. The challenging behavior of the partners on Team A was reflected in data provided by both teachers and coaches. For example, baseline data from the SSRS, collected at the beginning of students’ involvement in Unified Sports, show that partners on Team A demonstrated poorer social skills than the partners on Team B (standard scores of 100 and 118, respectively), as well as greater problem behavior (scores of 103 and 92, respectively). Data from weekly coach logs also revealed that partners on Team A demonstrated disruptive behavior at 63% of practices, while Coach B reported no instances of partner disruptive behavior. In describing the process for choosing partners, Coach A explained that he tried to select partners whom he felt might not have other opportunities to participate in sports. However, this choice of partners (combined with selecting athletes with autism) resulted in challenges for Coach A that were evident in his responses to questions in the end of the year Coach Questionnaire. Coach A reported that coaching both athletes and partners had been “challenging” and that partner behavior and lack of attendance had presented “big problems” for him as a coach. Coach B, on the other hand, reported that coaching athletes had been just “somewhat challenging” and

Beyond the Playing Field: Final Report
18
coaching partners had been “easy.” This assessment most likely reflects Coach B’s choice of partners who had displayed responsibility and empathy. The responses from partners that address their reasons for participating in Unified Sports also appear to reflect the coaches’ choices as there were notable differences in partners’ motivations for participating. While two-thirds (67%) of the partners on Team B responded that they joined Unified Sports to help kids with disabilities, less than half (43%) of the partners on Team A responded the same way (Table 11). This might suggest differences in partners’ understanding and expectations of the Unified Sports program. The variation among partners across Teams A and B is further illuminated by the difference in partner attitudes toward their peers with intellectual disabilities. First, as measured by the Friendship Activity Scale (FAS), attitudes were significantly more positive among partners involved the Unified Sports program from Team B compared to those from Team A (t=3.14; p=.011) (see Table 11). The mean score for partners on Team B was 2.80 (SD=.31), compared to 2.03 (SD=.55) for the partners on Team A. Table 11. Partners’ Reasons for Joining Unified Sports
Team To get better
at sports To have fun To help kids
with disabilities To have
something to do
A 29% 14% 43% 14%
B 0% 33% 67% 0%
Table 12. Partner Attitudes: Results of the Friendship Activity Scale
Team
Mean SD Minimum Maximum
A 2.03 .55 1.47 2.94
B 2.80 .31 2.18 3.00
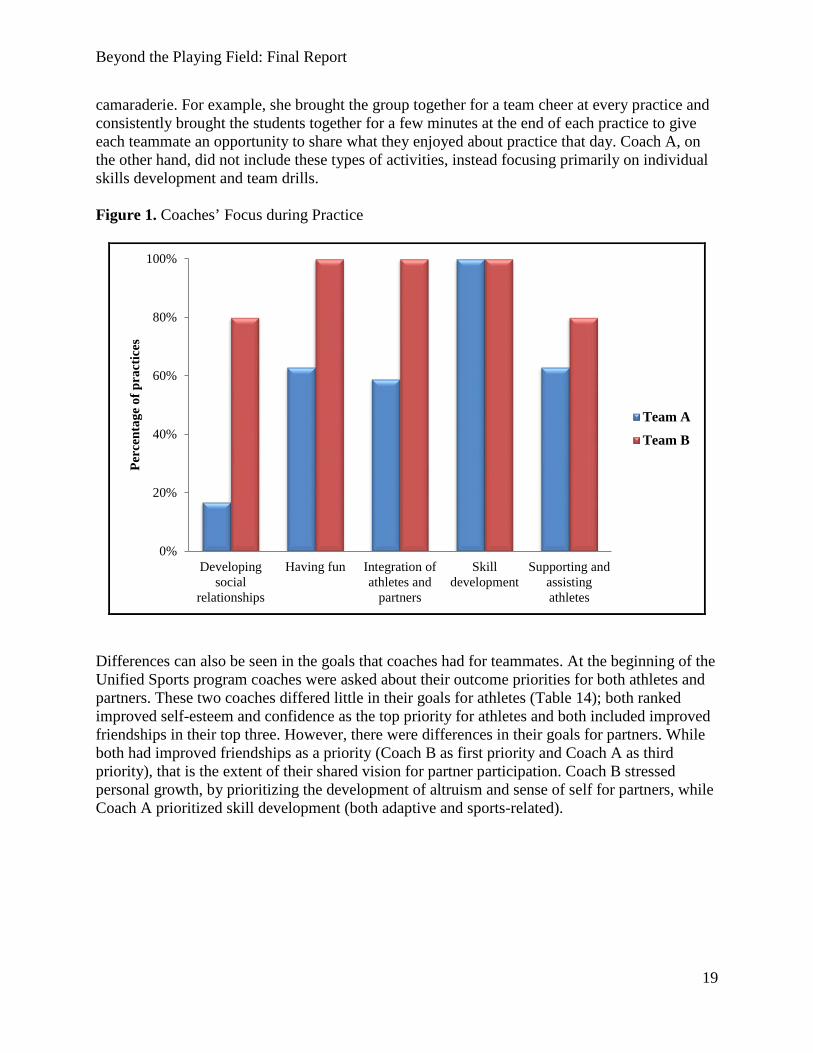
In addition to differences in team composition, there was variation in coaching style and focus. In the end of the year questionnaire, both coaches reported that they used a range of positive coaching behaviors (e.g., giving constructive feedback, demonstrating care and respect for students, and providing praise, encouragement, and motivation) on a regular basis (“often” or “always”), and observational data collected during team practice sessions support this. However, there were some notable differences that indicate that Coach B focused more on fostering a sense of team cohesion during practices. Specifically, in contrast to Coach A, Coach B focused more on promoting positive social relationships among teammates (observed at 100% of practices vs. 17%); promoting integration between athletes and partners (100% of practices vs. 59%), and making practices fun (100% of practices vs. 63%; Figure 1). Coach B also incorporated some unique activities into practices that demonstrated this emphasis on team cohesion and
Beyond the Playing Field: Final Report
19
camaraderie. For example, she brought the group together for a team cheer at every practice and consistently brought the students together for a few minutes at the end of each practice to give each teammate an opportunity to share what they enjoyed about practice that day. Coach A, on the other hand, did not include these types of activities, instead focusing primarily on individual skills development and team drills. Figure 1. Coaches’ Focus during Practice
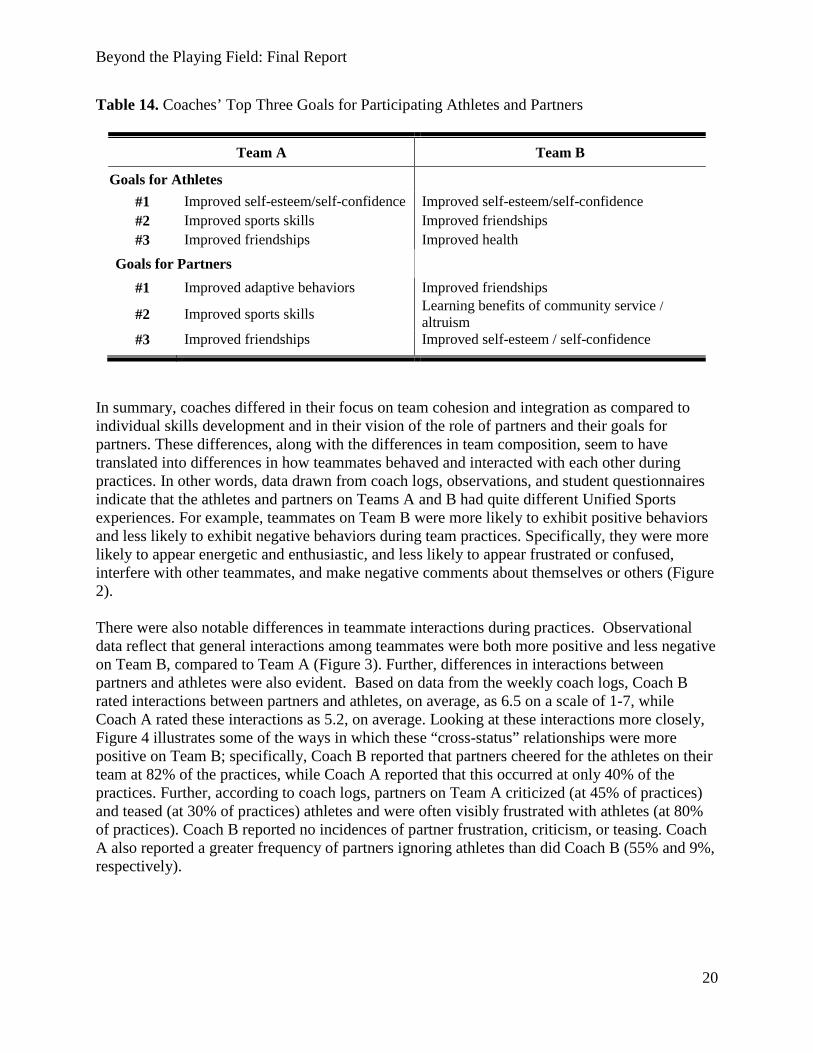
Differences can also be seen in the goals that coaches had for teammates. At the beginning of the Unified Sports program coaches were asked about their outcome priorities for both athletes and partners. These two coaches differed little in their goals for athletes (Table 14); both ranked improved self-esteem and confidence as the top priority for athletes and both included improved friendships in their top three. However, there were differences in their goals for partners. While both had improved friendships as a priority (Coach B as first priority and Coach A as third priority), that is the extent of their shared vision for partner participation. Coach B stressed personal growth, by prioritizing the development of altruism and sense of self for partners, while Coach A prioritized skill development (both adaptive and sports-related).
0%
20%
40%
60%
80%
100%
Developingsocial
relationships
Having fun Integration ofathletes and
partners
Skilldevelopment
Supporting andassistingathletes
Perc
enta
ge o
f pra
ctic
es
Team A
Team B
Beyond the Playing Field: Final Report
20
Table 14. Coaches’ Top Three Goals for Participating Athletes and Partners
Team A Team B
Goals for Athletes #1 Improved self-esteem/self-confidence Improved self-esteem/self-confidence #2 Improved sports skills Improved friendships #3 Improved friendships Improved health
Goals for Partners
#1 Improved adaptive behaviors Improved friendships
#2 Improved sports skills Learning benefits of community service / altruism
#3 Improved friendships Improved self-esteem / self-confidence
In summary, coaches differed in their focus on team cohesion and integration as compared to individual skills development and in their vision of the role of partners and their goals for partners. These differences, along with the differences in team composition, seem to have translated into differences in how teammates behaved and interacted with each other during practices. In other words, data drawn from coach logs, observations, and student questionnaires indicate that the athletes and partners on Teams A and B had quite different Unified Sports experiences. For example, teammates on Team B were more likely to exhibit positive behaviors and less likely to exhibit negative behaviors during team practices. Specifically, they were more likely to appear energetic and enthusiastic, and less likely to appear frustrated or confused, interfere with other teammates, and make negative comments about themselves or others (Figure 2). There were also notable differences in teammate interactions during practices. Observational data reflect that general interactions among teammates were both more positive and less negative on Team B, compared to Team A (Figure 3). Further, differences in interactions between partners and athletes were also evident. Based on data from the weekly coach logs, Coach B rated interactions between partners and athletes, on average, as 6.5 on a scale of 1-7, while Coach A rated these interactions as 5.2, on average. Looking at these interactions more closely, Figure 4 illustrates some of the ways in which these “cross-status” relationships were more positive on Team B; specifically, Coach B reported that partners cheered for the athletes on their team at 82% of the practices, while Coach A reported that this occurred at only 40% of the practices. Further, according to coach logs, partners on Team A criticized (at 45% of practices) and teased (at 30% of practices) athletes and were often visibly frustrated with athletes (at 80% of practices). Coach B reported no incidences of partner frustration, criticism, or teasing. Coach A also reported a greater frequency of partners ignoring athletes than did Coach B (55% and 9%, respectively).

Beyond the Playing Field: Final Report
21
Figure 2. Teammate Behaviors
0%
20%
40%
60%
80%
100%
Asked coach for help
Appeared energetic and enthusiastic
Interfered with other students' engagement
Appeared frustrated or confused
Made negative comments about other teamates
Made negative comments about self
Perc
enta
ge of
Pra
ctic
es Team ATeam B
Figure 3. Teammate Interactions*
0
1
2
3
4
Interactions between coach and teammates
Negative interactions among teammates
Positive interactions among teammates
Team ATeam B
*Reflects average levels of interactions observed at weekly team practices on a scale of 0 to 4 where 0 = “almost never” and 4 = ”all the time”
Beyond the Playing Field: Final Report
22
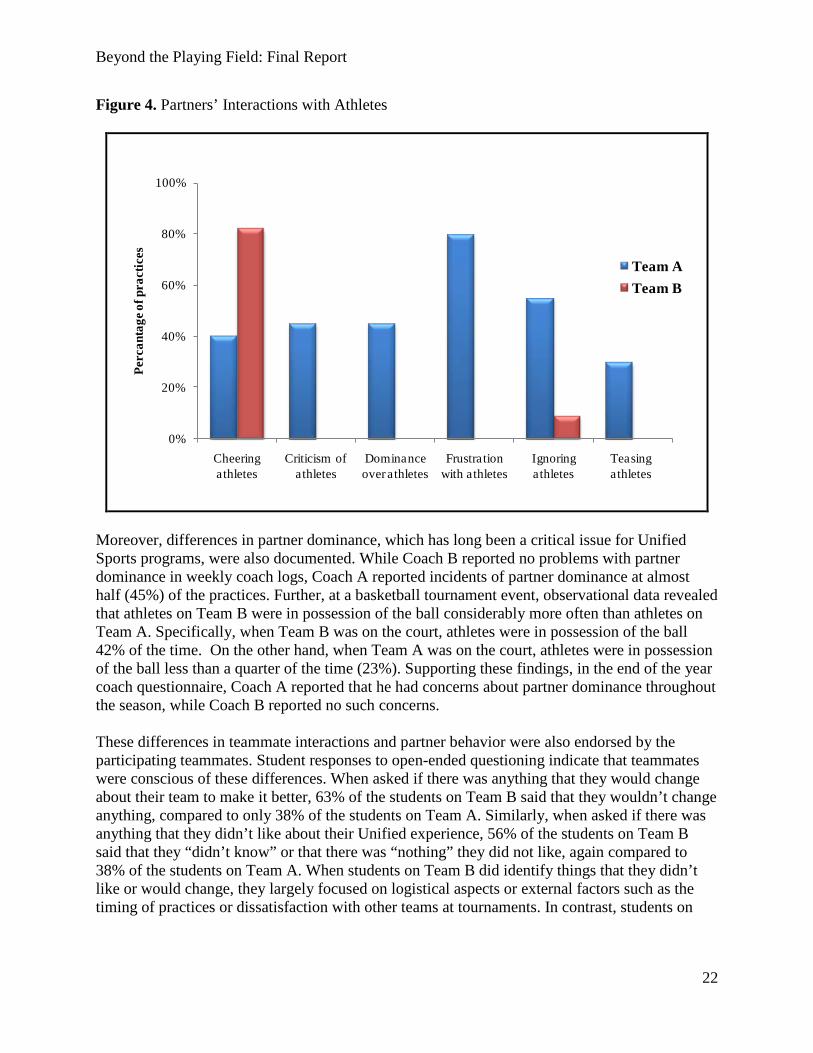
Figure 4. Partners’ Interactions with Athletes
0%
20%
40%
60%
80%
100%
Cheering athletes
Criticism of athletes
Dominance over athletes
Frustration with athletes
Ignoring athletes
Teasing athletes
Perc
anta
ge o
f pra
ctic
es
Team ATeam B
Moreover, differences in partner dominance, which has long been a critical issue for Unified Sports programs, were also documented. While Coach B reported no problems with partner dominance in weekly coach logs, Coach A reported incidents of partner dominance at almost half (45%) of the practices. Further, at a basketball tournament event, observational data revealed that athletes on Team B were in possession of the ball considerably more often than athletes on Team A. Specifically, when Team B was on the court, athletes were in possession of the ball 42% of the time. On the other hand, when Team A was on the court, athletes were in possession of the ball less than a quarter of the time (23%). Supporting these findings, in the end of the year coach questionnaire, Coach A reported that he had concerns about partner dominance throughout the season, while Coach B reported no such concerns. These differences in teammate interactions and partner behavior were also endorsed by the participating teammates. Student responses to open-ended questioning indicate that teammates were conscious of these differences. When asked if there was anything that they would change about their team to make it better, 63% of the students on Team B said that they wouldn’t change anything, compared to only 38% of the students on Team A. Similarly, when asked if there was anything that they didn’t like about their Unified experience, 56% of the students on Team B said that they “didn’t know” or that there was “nothing” they did not like, again compared to 38% of the students on Team A. When students on Team B did identify things that they didn’t like or would change, they largely focused on logistical aspects or external factors such as the timing of practices or dissatisfaction with other teams at tournaments. In contrast, students on
Beyond the Playing Field: Final Report
23
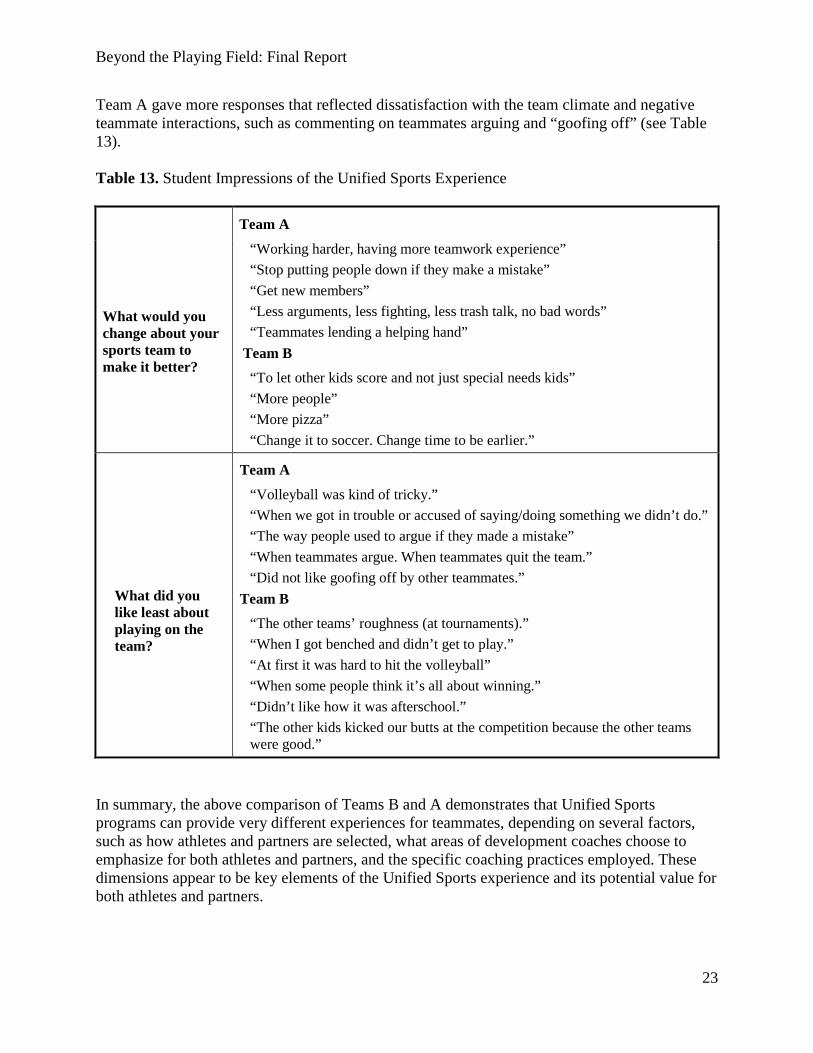
Team A gave more responses that reflected dissatisfaction with the team climate and negative teammate interactions, such as commenting on teammates arguing and “goofing off” (see Table 13). Table 13. Student Impressions of the Unified Sports Experience
Team A
What would you change about your sports team to make it better?
“Working harder, having more teamwork experience” “Stop putting people down if they make a mistake” “Get new members” “Less arguments, less fighting, less trash talk, no bad words” “Teammates lending a helping hand”
Team B
“To let other kids score and not just special needs kids” “More people” “More pizza” “Change it to soccer. Change time to be earlier.”
Team A
What did you like least about playing on the team?
“Volleyball was kind of tricky.” “When we got in trouble or accused of saying/doing something we didn’t do.” “The way people used to argue if they made a mistake” “When teammates argue. When teammates quit the team.” “Did not like goofing off by other teammates.”
Team B
“The other teams’ roughness (at tournaments).” “When I got benched and didn’t get to play.” “At first it was hard to hit the volleyball” “When some people think it’s all about winning.” “Didn’t like how it was afterschool.” “The other kids kicked our butts at the competition because the other teams were good.”
In summary, the above comparison of Teams B and A demonstrates that Unified Sports programs can provide very different experiences for teammates, depending on several factors, such as how athletes and partners are selected, what areas of development coaches choose to emphasize for both athletes and partners, and the specific coaching practices employed. These dimensions appear to be key elements of the Unified Sports experience and its potential value for both athletes and partners.
Beyond the Playing Field: Final Report
24
CONCLUSIONS This study sought to document the positive impact of participation in school-based Unified Sports programming “beyond the playing field” for elementary school children with and without disabilities. While benefits of participation in Unified Sports for both athletes and partners have previously been documented (Norins et al., 2008; Siperstein et al., 2001), their translation to the school context has not been considered. This is particularly relevant in light of increasing evidence that sport and recreational programming offers important school-related benefits to general education students (Fletcher et al., 2003; Howie, et al, 2010; Watts et al., 2008), as well as improvements in their social competence (e.g. Fletcher, Nickerson, Wright, 2003; Howie, et al., 2010). Similar to the findings of previous studies, athletes and partners reported more positive self-concept at the end of their Unified Sports experience, particularly in the area of social acceptance. They also reported expanded opportunities for friendships with their Unified Sports teammates and improvements in existing friendships, changes which were particularly robust for athletes. However, no significant changes in social skills, academic competence, or school adjustment were indicated in teacher rating scales or in observational data collected by project staff. It is possible that students’ self-perceived changes precede measurable transformations in behavior and, with time, these improvements would be reflected in standardized measures. In other words, perhaps Unified Sports has a direct positive impact on students’ (particularly students with disabilities) sense of self, but these internal transformations are not immediately quantifiable in terms of specific observable behaviors. On the other hand, teachers’ general (qualitative) observations of the impact of Unified Sports corroborated the positive shifts in self-concept and social interactions reported by athletes and partners. These findings, in combination with qualitative teacher feedback that revealed shifts in partners’ attitudes toward their peers with disabilities, suggest that Unified Sports does indeed provide a valuable context for social inclusion. Beyond the exploration of the impact of Unified Sports on school-aged participants’ social and academic competence, this study demonstrated that the Unified Sports experience is not singular, and, in fact, can vary appreciably. In their 2001 national evaluation of Unified Sports, Siperstein and colleagues concluded that “there is considerable variability around key aspects of program implementation at state and local levels” (p.24). Almost a decade later, the present study also found great variability in program implementation. More specifically, there were notable differences in: 1) team composition, particularly the disability diagnosis of athletes and the selection criteria of partners; 2) the training and preparation of coaches; and 3) coaches’ interpretations of the goals of Unified Sports which informed the specific practices and activities implemented during practices. In turn, these variations translated into very different experiences for the students involved. The results of this study suggest that when partners are selected on the basis of their positive attitudes toward their peers with disabilities, when the potential for behavior problems in both athletes and partners is minimized, and when coaches focused on building team cohesion (rather than on individual skills), the participating athletes and partners share more positive social

Beyond the Playing Field: Final Report
25
interactions, express greater enjoyment of their Unified Sports experience, and minimize partner dominance. While this study does not allow us to draw conclusions about how these differences on the playing field impact athletes and partners beyond the playing field, it does suggest that this question needs to be addressed. In other words, the results discussed here suggest that it is critical to better understand how coaches’ practices, in terms of their definition of athlete and partner and also their goals for participants, shape not only the experiences of athletes and partners within the Unified Sports program, but the way their participation impacts other aspects of their lives, particularly in educational settings. The results of the study also allow for the opportunity to provide several specific suggestions that can help guide SO in ensuring consistently high-quality Unified Sports programming as they continue to be a leader in bringing inclusive sports experiences to young people in the United States and around the world. First, it is suggested that SO clearly articulate the goal of social inclusion as central to the mission of Unified Sports, and that this mission be prominently featured not only in the Unified Sports Handbook and on the SO website, but also clearly communicated as part of coach training. Results of this study strongly suggest, as do the findings of prior research, that Unified Sports provides a valuable context for social inclusion not only in terms of improvements in the social relationships of athletes but also improved attitudes on the part of the partners. Therefore, while Unified Sports has come to be regarded and accepted as a program that does indeed provide a valuable opportunity for promoting the social inclusion of athletes, SO needs to keep pace with this evolution and re-position the Unified Sports program more definitively and explicitly. This is particularly salient given that Unified Sports, particularly in the Unified States, is most often implemented in the school setting; for example, Unified Sports is a pillar of the Project UNIFY initiative, which holds social inclusion as a core value and is being implemented in schools across the US. Further, the Unified Sports Handbook specifies that “a school setting also requires efforts to make the Unified Sports program accepted within the school community…steps need to be taken to both highlight the Unified Sports team and engender school pride in it” (Special Olympics, 2003, p.18); thus, positioning social inclusion as a primary goal and outcome of Unified Sports will help school personnel recognize its inherent value, not just as a recreational activity but as a true intervention to promote a more accepting, tolerant, and welcoming school climate (as is the case in Project UNIFY). Second, just as SO should highlight the value of Unified Sports’ as a catalyst for social inclusion to the educational community, SO can also look to the field of education for constructive lessons about how to promote camaraderie among teammates with and without disabilities. True integration does not simply come about because children with and without disabilities have been brought together in the classroom (or on the playing field); rather, decades of experience have taught that successful inclusive programming requires great care and organization. In their historical overview of attitude change in the school context, Siperstein, Norins, and Mohler (2006), advocated that attitudes can change but that, “…well-planned and structured contact [between children with and without intellectual disabilities] is critical.” This is particularly relevant as the results of this study suggest that positive interactions among athletes and partners were maximized, and partner dominance minimized, when coaches focused on team cohesion. In fact, the Unified Sports Handbook states that “on any team, team spirit and player cohesion are critical parts of team success. Positive interactions between players may not always happen on
Beyond the Playing Field: Final Report
26
their own. It is the coach’s job to promote these interactions” (Special Olympics, 2003, p.14). By promoting camaraderie among Unified Sports teammates through carefully planned activities and sports drills, coaches can facilitate positive interactions on the playing field that will translate into other contexts as well.
Third, it is suggested that great care and consideration is taken when choosing partners. The results of this study suggest that selecting partners who have more positive attitudes toward their peers with disabilities, and who are motivated by altruism, may enhance the experiences of all teammates. Among teams in this study, the composition of Unified teams varied greatly and these differences had a profound impact on the quality of athlete/partner interactions, including incidences of partner dominance, and thus, ultimately on the Unified Sports experience for all involved. While we acknowledge that team composition may be driven by multiple factors, including coaches’ differing interpretations of Unified Sports or the differences in the student populations of schools, it is clear that for a Unified Sports team to be successful, team composition is a vital consideration. The careful selection of teammates is currently emphasized in the Unified Sports Handbook, which states that athletes and partners should be matched as closely as possible with regards to ability and age. With regard to athlete selection specifically, the Handbook states that, “Unified Sports is a program suited for higher-ability athletes” (Special Olympics, 2003, p.15). However, as inclusive educational practices for ALL students of ALL ability levels increasingly becomes the norm in public education, and as Project UNIFY continues to reach more schools across the US, offering Unified Sports only to “higher-ability” athletes may become increasingly challenging. Therefore the careful and purposeful selection of partners becomes even more important.
Lastly, because coaches play a key role, including assembling the team, structuring practices, motivating players, fostering positive social interactions among teammates, and communicating with school administrators, teachers, parents, and SO regional staff, they need to be chosen carefully and trained appropriately. In fact, the Unified Sports Handbook states that, “the most important person to the success of a Unified Sports team is the coach” (Special Olympics, 2003, p.9). The Handbook also goes on to suggest that coaches should meet national standards for athletic coaches and provides a wealth of valuable tips and recommendations for coaches. However only half of the coaches observed in this study had any prior coaching experience, and most received only minimal training from SO. Adopting a standardized, systematic approach to the recruitment and training of Unified Sports coaches would help further ensure the positive experiences of athletes and partners. In conclusion, the results of this study indicate that school-based Unified Sports programming has the potential to provide positive social experiences and valuable benefits to elementary school children with and without disabilities. Findings also indicate, however, that the quality of this programming can vary across a number of dimensions. Although some variability is inherent and expected in any nationally implemented program, it is important to understand how this variability can impact the quality of the experience. Therefore, the results of this study can begin to guide SO as they work to ensure the consistent fulfillment of high-quality programming across the country and around the globe that will maximize the opportunity for athletes and partners to benefit from their Unified Sports experience.
Beyond the Playing Field: Final Report
27
REFERENCES Armstrong, R. W. (1992). Self-perceived social function among disabled children in regular
classrooms. Journal of Developmental Behavioral Pediatrics, 13, 11-16. Birch, S. H., & Ladd, G. W. (1997). The teacher-child relationship and children's early school
adjustment. Journal of School Psychology, 35, 61-79. Boivin, M., & Hymel, S. (1997). Peer experiences and social self-perceptions: A sequential
model. Developmental Psychology, 33, 135-145. Harter, M. (1985). Manual for the self-perception profile for children. University of Denver. Castagno, K. S. (2001). Special Olympics Unified Sports: Changes in male athletes during a
basketball season. Adapted Physical Activity Quarterly, 18, 193-206. Fletcher, A.C., Nickerson, P., & Wright, K.L. (2003). Structured leisure activities in middle
childhood links to well-being. Journal of Community Psychology, 31, 641-659. Gresham, F. M., & Elliot, S. N. (1990). Social Skills Rating System. Circle Pines, MN:
American Guidance Service. Howie, L.D., Lukacs, S.L., Pastor, P.N., Reuben, C.A., & Mendola, P. (2010). Participation in
activities outside of school hours in relation to problem behavior and social skills in middle childhood. Journal of School Health, 80, 119-125.
Norins, J., Harada, C.M., Parker, R. & Brecklinghaus, S. (2008). Evaluation of the Special
Olympics Europe/Eurasia Unified Football Pilot-Project: Findings from Austria, Poland, Romania, Serbia and Slovakia. Final Report for Special Olympics, Inc. Boston: University of Massachusetts, Centre for Social Development and Education.
Siperstein, G. N., & Bak, J. J. (1989). Social relationships of adolescents with moderate mental
retardation. Mental Retardation, 27, 5-10. Siperstein, G. N., Hardman, M. L., Wappett, M. T., & Clary, L. (2001). National Evaluation of
the Special Olympics Unified Sports Program. Boston: University of Massachusetts Boston, Center for Social Development and Education, & Utah: Department of Special Education, University of Utah.
Siperstein, G. N., Parker, R.C., Norins Bardon, J., & Widaman, K. F. (2007). A National Study
of Youth Attitudes toward the Inclusion of Students with Intellectual Disabilities. Exceptional Children, 73, 435-455.
Beyond the Playing Field: Final Report
28
Short, E. J. (1992). Cognitive, metacognitive, motivational, and affective differences among normally achieving, learning-disabled, and developmentally handicapped students: How much do they affect school achievement? Journal of Clinical Child Psychology, 21, 229-239.
Special Olympics Unified Sports Handbook (2003). Special Olympics International:
Washington, D.C. Watts, C.E., Witt, P.A., & King, T. (2008). Predictors of outcomes for after-school program
participants. Journal of Park and Recreation Administration, 26, 134-145. Williams, G. A., & Asher, S. R. (1992). Assessment of loneliness at school among children with
mild mental retardation. American Journal on Mental Retardation. Special Issue: Social Skills, 96, 373-385.