Embed Size (px)
Citation preview
Beyond the unemployment rate – labour underutilisation and underemployment in Australia and the USA
William F. Mitchell and Ellen Carlson1
Working Paper No. 00-06
November 2000
Centre of Full Employment and Equity The University of Newcastle
Callaghan NSW 2308, Australia Home Page: http://e1.newcastle.edu.au/coffee
Email: [email protected]

2
Abstract
Cross-country comparisons of labour force data are an integral component of
comparative policy analysis. The unemployment rate is often used as a summary
comparative measure and captures the attention of the media more often than other
labour market indicators. A simplistic interpretation of the periodically announced
unemployment rates is that a lower figure is better. Economists have long debated the
limitations of the aggregate unemployment rate measured in persons. In particular it is
based on a narrow concept of underutilisation and ignores underemployment. The
existence of discouraged workers is one example of underutilisation of labour
resources and is ignored in the standard measure. In terms of underemployment, the
growing trend to part-time employment with the additional information that a number
of part-time workers desire more hours, shows up another limitation on the usual
measure of unemployment.
In this paper, we outline the distinction between underutilisation and
underemployment and discuss the limitations of the official unemployment rate as a
measure of these sources of resource inefficiency. We then compute a range of
measures for Australia based on the BLS six indicators, which are designed to provide
better indication of labour slack. We extend the BLS concepts to take into account
data variations in Australia compared to the USA. The measures provide a better
indication of the extent to which existing and potential labour resources are being
under-utilised and therefore, arguably, give a more accurate indication of the degree
of tightness in the labour market. In the final section, we present two new hours-based
measures of labour underutilisation and underemployment for Australia. The
difference between the measures is that one of them includes hidden unemployment.
Both measures are computed by the Centre of Full Employment and Equity and
published as part of our Monthly Indicators. They attempt to quantify the degree of
underutilisation and underemployment among the unemployed, the hidden
unemployed, and the part-time workers who desire more hours of work. The
comparison with the conventional unemployment leads to the conclusion that the
degree of underutilisation is significantly understated by that measure. Concluding
comments follow.

3
“The overall unemployment rate for a country is often the most sought after of all
economic statistics. It is a measure of the unutilised labour supply of a country.” (ILO,
1999: 191)
1. Introduction Cross-country comparisons of labour force data are an integral component of
comparative policy analysis. The unemployment rate is often used as a summary
comparative measure and captures the attention of the media more often than other
labour market indicators. A simplistic interpretation of the periodically announced
unemployment rates is that a lower figure is better. Sorrentino (2000: 3) says,
“comparative levels are considered to be an important measure of U.S. economic
performance relative to that of other developed countries. Comparative
unemployment rates also provide a springboard for investigating economic,
institutional, and social factors that influence cross-country differences in
joblessness.”
There is a recognition that comparative unemployment rates have to be adjusted to
ensure that the conceptual basis is consistent (Shiskin, 1976; Sorrentino, 1993;
Bregger and Haugen, 1995). The major labour data gathering organisations have
recognised this need and now publish an array of standardised or harmonised
unemployment rates. The Bureau of Labor Statistics (BLS) in the USA “has adjusted
foreign unemployment rates to U.S. concepts since the early 1960s.” (Sorrentino,
2000: 3) Similarly, the Organisation for Economic Cooperation and Development
(OECD), the Statistical Office of the European Communities (Eurostat), and the
International Labour Organisation (ILO) now convert national statistical data to
present unemployment rates within a common conceptual framework. From a
research perspective three questions arise. First, once standardisation is achieved it is
important to determine the extent to which remaining differences in unemployment
rates are due to further measurement variations. Lawrence (1999) argues that if
differences in measurement remain and explain variations in standardised
unemployment rates then using comparative unemployment rates to justify the policy
position of one country over another is futile (see also Sorrentino, 2000). Second,
4
once all reasonable measurement differences are explained, it is important to explain
the remaining differences in unemployment rates in terms of policy and structural
factors. Third, if we are examining the unemployment rates as indicators of
comparative labour utilisation (or under-utilisation) then the issue of fitness for
purpose arises. Economists have long debated the limitations of the aggregate
unemployment rate measured in persons. The existence of discouraged workers for
example, where important, is one such limitation. The growing trend to part-time
employment with the additional information that a number of part-time workers desire
more hours, shows up another limitation on the usual measure of unemployment.
In this paper, we are concerned with this last issue as part of a larger project
embracing all of the issues, with special focus on Australia, Japan and the United
States. The Centre of Full Employment and Equity is currently preparing a range of
alternative indicators of labour underutilisation to overcome deficiencies in the
conventional official unemployment rate. This paper develops and discusses some of
these alternative indicators for Australia and the USA. It is argued that the alternative
measures are relatively easy to compute and provide a more meaningful and accurate
measure of the degree of labour market tightness.
The paper is laid out as follows: Section 2 reviews the labour force framework
developed by the ILO that is the basis for contemporary unemployment data and
discusses the limitations of the official unemployment rate as a measure of labour
underutilisation. Section 3 considers other perspectives that can be used in measures
of labour utilisation and computes a range of measures for Australia based on the six
BLS indicators. We extend the BLS concepts to take into account data variations in
Australia compared to the USA. The measures provide a better indication of the
extent to which existing and potential labour resources are being under-utilised and
therefore, arguably, give a more accurate indication of the degree of tightness in the
labour market. Section 4 presents for Australia, a comparison of the conventional
measures of labour underutilisation (the unemployment rate, the unemployment-
vacancy rate, the employment-population ratio) to new hours-based measures of the
unemployment rate and an unemployment measure, which explicitly accounts for
hidden unemployment. Both measures are computed by the Centre of Full
Employment and Equity and published as their Monthly Indicators. They attempt to

5
quantify the degree of underemployment among the unemployed, the hidden
unemployed, and the part-time workers who desire more hours of work. The
comparison with the conventional unemployment measure leads to the conclusion that
the degree of underutilisation is significantly understated by that measure. Concluding
comments follow.
2. Underutilisation and underemployment The labour force framework is the foundation for cross-country comparisons of labour
market data. The framework is made operational through the ILO and the conference
of International Labour Statisticians. These conferences develop the guidelines or
norms for implementing the labour force framework and generating the national
labour force data. Four organisations compile internationally ‘comparable’ series of
unemployment rates for groups of developed countries.2 The OECD publishes
Standardised Unemployment Rates (SURS) for 24 member countries, which are based
on the ILO concepts. The Bureau of Labor Statistics (BLS) provides unemployment
rates that are adjusted “as closely as possible” to U.S. concepts, which are narrower
than the ILO concepts.3 The Statistical Office of the European Communities
(EUROSTAT), has its own interpretation of ILO concepts, and publishes harmonized
unemployment rates for European Union countries. The ILO publishes ILO-
Comparable series of unemployment rates that are consistent with ILO guidelines
“except where adjustments are negligible and therefore be disregarded.” (ILO
Bulletin, p XI quoted in Sorrentino (2000:20)).
According to ILO concepts, a person is unemployed if they are over a particular age,
they do not have work, but they are available for work and actively seeking work.
Unemployed people are generally defined to be those who have no work at all.
Unemployment is therefore defined as the difference between the economically active
population (civilian labour force) and employment. The unemployment rate refers to
the number of unemployed persons as a percentage of the civilian labour force. The
inference is that the economy is wasting resources and sacrificing income by not
providing enough opportunities for work and underutilising labour.
There are, however, other avenues of labour resource wastage that are not captured by
the unemployment rate as defined in this manner. In this context, we distinguish

6
between underutilisation and underemployment. Underutilisation relates to workers
who are currently not working but who are willing and able to undertake work
whether they are classified as being in or out of the labour force. The unemployed as
defined above constitute a subset of the underutilised labour. Underemployment refers
to employed workers who are constrained by the demand side of the labour market to
work fewer hours than they desire.4 In conceptual terms, a part of an underemployed
worker is employed and a part is unemployed, even though they are wholly classified
among the employed.
To develop these concepts further, a number of considerations arise:
(a) Are the unemployed all the same in terms of the signal they send about the state of
the labour market? In their alternative measure of unemployment, the BLS take
into consideration what they call “more serious types of unemployment –
respectively, long-term unemployment, job loss, adult unemployment, and
unemployment of seekers of full-time jobs” (Sorrentino, 1995: 32). There may
also be overstatement of the extent of underutilisation if a number of unemployed
only desire part-time work.
(b) The operational difference between being classified under the ILO guidelines as
employed and unemployed is only one hour of paid employment or self-
employment.5 An economy with many part-time workers who desire but cannot
find full-time work is arguably less efficient than an economy with labour
preferences for work hours satisfied. In this regard, involuntary part-time workers
share characteristics with the unemployed. If this form of underemployment is
considered, the indicator would “move from an activity-based concept of the labor
force … [as in the unemployment rate] … to a ‘time lost’ type of concept.”
(Sorrentino, 1995: 32).
(c) Okun (1983: 171) believed that “unemployment was merely the tip of the iceberg
that forms in a cold economy.” The subterranean underutilisation includes the
extra labour participation that occurs in an economic upturn. The cyclical gains in
labour force participation are due to the entry of marginal workers into the labour
force when the probability of gaining work increases. These workers are often
termed hidden unemployed or discouraged workers. From a statistical
consideration, the hidden unemployed are classified as being not in the labour
force. From the perspective of underutilised labour resources, the issue is whether

7
these people have characteristics similar to those who are classified as being in the
labour force but unemployed. A large number of persons defined as not being in
the labour force still may have a marginal attachment to it. In Australia,
marginally attached are those who want to work and are actively looking for work
but not available to start work in the reference week, or those who are not actively
looking for work but who are available to start work within four weeks.6
Discouraged workers are a sub-group of the marginally attached. They want to
work and are available for work but believe that search activity is futile given the
poor state of the labour market.7 The discouraged (not in the labour force) worker
is thus more like the unemployed (in the labour force) worker than they are, for
example, like a retired person or a child in full-time education.
Labour utilisation is maximised if labour underutilisation and underemployment are
minimised. While these concepts can underpin a broader and more comprehensive
measure of labour utilisation, it remains true that the unemployment rate, as currently
defined is, as Sorrentino states (1995: 33), “the most readily available, well-
understood, and comparable measure.” The OECD standardised unemployment rates
are consistent with the ILO guidelines and are widely used to compare the state of
labour underutilisation across time, regions, and countries. The standardised
unemployment rates published by the OECD cover 24 OECD countries. According to
the OECD they are “as close as possible to ILO (and Eurostat) guidelines for
international comparisons of labour force statistics” (OECD, 2000). The data are
based on household labour force survey data of member countries.
General consensus would exist that a higher standardised unemployment rate is less
desirable than a lower rate and many commentators would conclude that a country
with higher unemployment rates is not managing the economy as well as another
country with a lower rate. However, even assuming the conceptual basis is consistent,
comparisons between periods within a country or at a point in time across countries
may be misleading because the unemployment rate neglects the factors outlined
above.
Figure 1 shows the standardised unemployment rates for Australia and the United
States and an average for the 20 OECD countries for which data was available (see
Mitchell, 2000a). Australia had the highest average unemployment rate through most

8
of the 1980s and the 1990s and tracked the OECD average for the entire period. The
USA and Australian cycles are highly correlated. Notwithstanding the fall in
unemployment in both countries through the 1990s, the Australian rate of
unemployment remains nearly 2 percentage points higher. Mitchell (2000a) has
argued that the difference in unemployment behaviour between Australia and the
USA over this period is largely explained by the performance of public sector
employment. In Australia, public sector employment growth was 0.64 per cent per
annum on average between 1970 and 1999, compared to the labour force growth of
1.87 per annum. In the USA, the public sector maintained a growth rate (1.6 per cent)
roughly proportional to the growth of the labour force (1.8 per cent per annum). In
both countries, the private sector maintained a growth rate commensurate with the
labour force growth.
Figure 1 Standardised unemployment rates for Australia and the USA, 1970-99
0.0
2.0
4.0
6.0
8.0
10.0
12.0
1970 1973 1976 1979 1982 1985 1988 1991 1994 1997
per c
ent
USA
Australia
Average
Source: OECD EO data and calculations by Mitchell (2000a). The average is for 20 OECD countries examined in Mitchell (2000a). The data are annual averages of semi-annual data. The question is whether this comparison of standardised unemployment rates provides
a reliable and meaningful indicator of the degree of utilisation of the labour resources
in each of the countries depicted. In the next section we consider alternative measures
of unemployment, which present a more comprehensive picture of labour market
performance.

9
3. Measure of underemployment and underutilisation for Australia and the USA
A decreasing unemployment rate with more workers making the transition from
unemployment to employment may give a falsely optimistic picture of the economy if
the number of under-employed part-time workers is rising. In this context, other
perspectives could be used in measures of labour utilisation. In this section we
compute a range of measures for Australia based on the six BLS indicators (Bregger
and Haugen, 1995). We extend the BLS concepts to take into account data variations
in Australia compared to the USA. The measures provide a better indication of the
extent to which existing and potential labour resources are being under-utilised and
therefore, arguably, give a more accurate indication of the degree of tightness in the
labour market. At issue is the treatment of various persons working but wanting more
hours and persons not counted as in the labour force in the numerator and
denominator of the measure. In the official ABS estimates of total unemployment,
full-time unemployment and part-time unemployment, the denominator reflects those
included in the numerator. For example, the full-time unemployment rate measures
the full-time unemployed as a proportion of the full-time unemployed and the full-
time employed.
3.1 The BLS U1-U6 Measures in the United States
Starting in 1977, the BLS began regular publication of 7 alternative unemployment
measures. In 1994 these were refined to 6 measures, which reflected changes made to
the design of survey questionnaires introduced at that time (Bregger and Haugen,
1995). The new indicators U4 to U6 are different from their predecessors. Of
particular note is the definition of marginally attached, of which discouraged workers
is a sub-category. Marginally attached workers are those who explicitly want a job,
are explicitly available for work and have looked sometime in the prior year, but are
not currently looking for various reasons. The explicit criteria is important as in the
old survey design some of these aspects were inferred from answers to other
questions. Discouraged workers are those whose reason for not currently looking is
job market-related i.e. they felt their search would be in vain. The U4 measure
includes discouraged workers with the unemployed, while the U5 measure includes
10
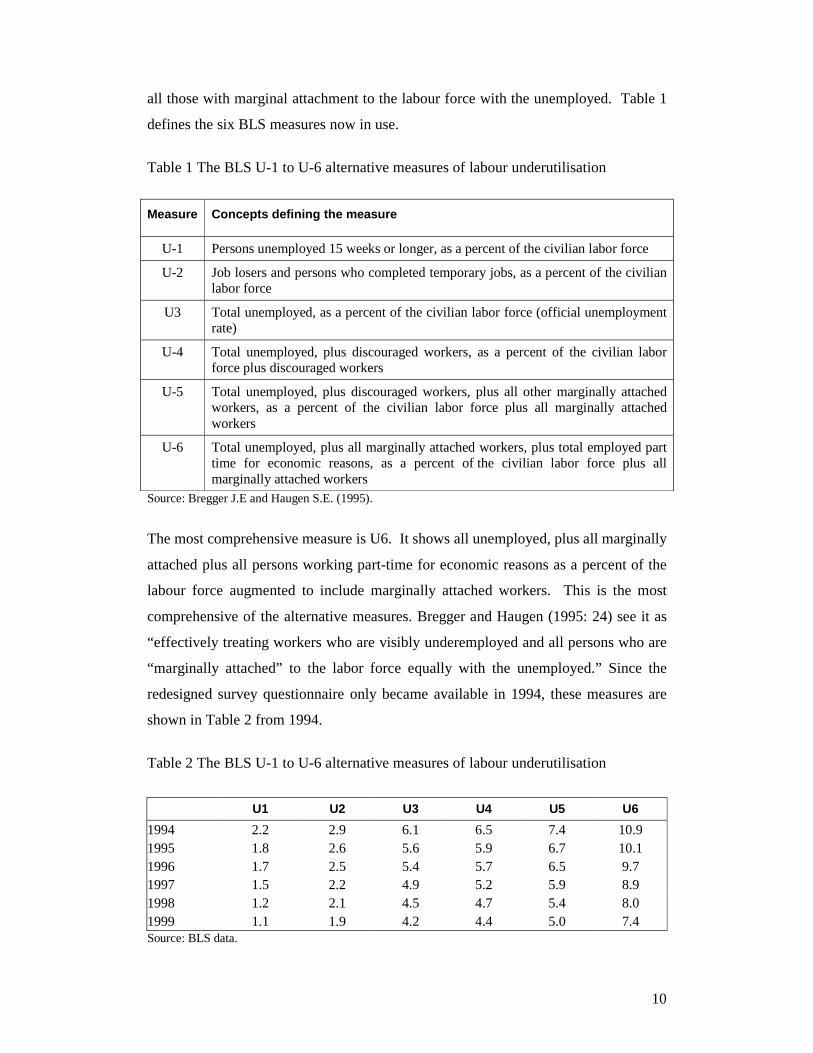
all those with marginal attachment to the labour force with the unemployed. Table 1
defines the six BLS measures now in use.
Table 1 The BLS U-1 to U-6 alternative measures of labour underutilisation
Measure Concepts defining the measure
U-1 Persons unemployed 15 weeks or longer, as a percent of the civilian labor force
U-2 Job losers and persons who completed temporary jobs, as a percent of the civilian labor force
U3 Total unemployed, as a percent of the civilian labor force (official unemployment rate)
U-4 Total unemployed, plus discouraged workers, as a percent of the civilian labor force plus discouraged workers
U-5 Total unemployed, plus discouraged workers, plus all other marginally attached workers, as a percent of the civilian labor force plus all marginally attached workers
U-6 Total unemployed, plus all marginally attached workers, plus total employed part time for economic reasons, as a percent of the civilian labor force plus all marginally attached workers
Source: Bregger J.E and Haugen S.E. (1995).
The most comprehensive measure is U6. It shows all unemployed, plus all marginally
attached plus all persons working part-time for economic reasons as a percent of the
labour force augmented to include marginally attached workers. This is the most
comprehensive of the alternative measures. Bregger and Haugen (1995: 24) see it as
“effectively treating workers who are visibly underemployed and all persons who are
“marginally attached” to the labor force equally with the unemployed.” Since the
redesigned survey questionnaire only became available in 1994, these measures are
shown in Table 2 from 1994.
Table 2 The BLS U-1 to U-6 alternative measures of labour underutilisation
U1 U2 U3 U4 U5 U6 1994 2.2 2.9 6.1 6.5 7.4 10.9 1995 1.8 2.6 5.6 5.9 6.7 10.1 1996 1.7 2.5 5.4 5.7 6.5 9.7 1997 1.5 2.2 4.9 5.2 5.9 8.9 1998 1.2 2.1 4.5 4.7 5.4 8.0 1999 1.1 1.9 4.2 4.4 5.0 7.4 Source: BLS data.

11
The question is whether these extra indicators offer any meaningful additional
information about the degree of underutilisation or underemployment in the US labour
market. For the indicators of more serious unemployment (U1 and U2) the smaller
they are as a percentage of total unemployment the better. The results show that as U3
has fallen, U1 and U2 have also fallen in percentage terms relative to U3, which
indicates that the improving labour market provides opportunities for longer-term
unemployed and the involuntary unemployed. In this sense, the U1 and U2 measure
relative to U3 provides additional and useful information about the dynamics of the
labour market. The U4 to U6 measures represent increment broadening of the U3
measure. Table 3 constructs gaps between U4-U3, U5-U4, and U6-U5, which can be
interpreted in incremental terms. The U3-U1 and U3-U2 gaps represent narrowing of
the definition of unemployment but cannot be interpreted in an incremental manner
and are not shown.
Table 3 Deviations in measures of underutilisation and underemployment, USA
U4-U3 U5-U4 U6-U5 1994 0.4 0.9 3.5 1995 0.3 0.8 3.4 1996 0.3 0.8 3.2 1997 0.3 0.7 3.0 1998 0.2 0.7 2.6 1999 0.2 0.6 2.4 Source: BLS data. Examining all the gaps, it is clear that they decrease as the economy has improved.
This means that the US labour market has provided improved fortunes for all the
categories that represent marginal attachments (U4 to U6). The gap between U4 and
U3 is due to discouraged workers. The gap indicates that hidden unemployment at the
levels of activity prevailing over the entire period examined has been significant
(adding 0.4 per cent in 1994). The declining gap is expected and indicates that the
labour force participation changes due to cyclical variations in activity are declining.
The gap between U5 and U4 is due to the inclusion of all other marginally attached
workers (in addition to the discouraged workers included in U4). As discouraged
workers, as defined, are only a part of all marginally attached workers, the inclusion
of the additional marginally attached workers has a more significant impact on the

12
degree of underutilisation. Interestingly, the gap U4-U3 was halved over the period
(1994 to 1999), while that for U5-U4 declined by a third. This indicates that in the
expansionary phase the discouraged workers as a group more readily changed their
status than the other marginally attached workers. Gross flows data may be able to
shed light on this.
The largest gap is between U6 and U5 (and by definition U6 to U3). That is, the U6
measure includes not only persons defined as Not in the Labour Force, but also those
employed part-time for economic reasons (underemployed part-time workers). While
U4 and U5 indicate underutilisation of willing labour resources, U6 provides
information about underemployment of currently employed labour. A larger gap
indicates that underemployment of part-time workers is higher. This would mean that
the economy fails to provide enough labour hours to satisfy the preferences of the
existing labour supply. A falling gap means that the degree of underemployment is
declining. The gaps in Table 3 show that underemployment is a more significant
source of wasted labour resources than underutilisation. The falling U6-U5 gap shows
that the expansion has provided increased working hours to part-timers who were
previously constrained. Combined with the falling U5-U4 and U4-U3 gaps, we can
conclude that the expansion has decreased both the degree of underutilisation and the
degree of underemployment. This supports the major conclusions of Okun’s
upgrading hypothesis (Okun, 1983).
In conclusion, the measures provide useful additional information about the dynamic
adjustments in the US labour market.
3.2 Labour underemployment and underutilisation measures for Australia
Table 4 defines a range of measures for Australia, which are similar to those
developed by the BLS and defined in Table 1. They are not strictly comparable
because some data restrictions result in certain differences from the BLS measures.
For example, we have not calculated U2 since data was not currently available on
persons who completed temporary jobs. The differences from BLS measures in the
other measures occur in U1 and U6. U1 for Australia refers to unemployed 13 weeks
or longer.8 We have also created two measures for U6 – one which includes all part-
time workers who preferred to work more hours and one which includes only those
13
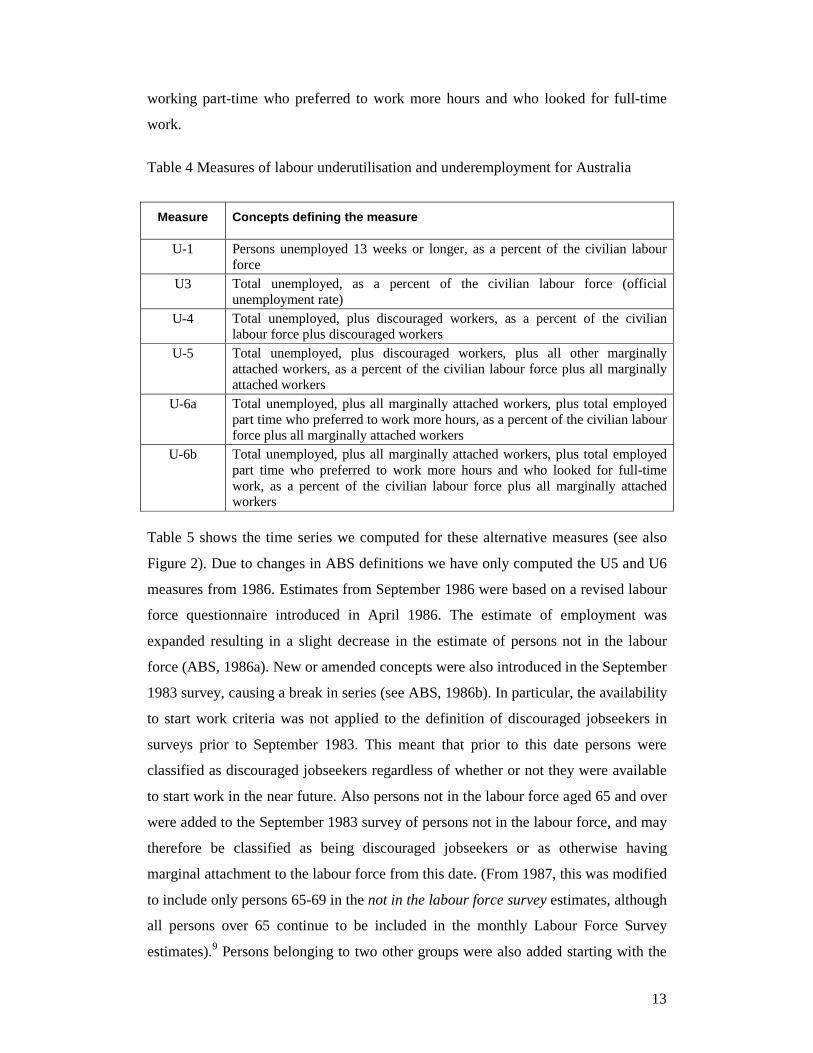
working part-time who preferred to work more hours and who looked for full-time
work.
Table 4 Measures of labour underutilisation and underemployment for Australia
Measure Concepts defining the measure
U-1 Persons unemployed 13 weeks or longer, as a percent of the civilian labour force
U3 Total unemployed, as a percent of the civilian labour force (official unemployment rate)
U-4 Total unemployed, plus discouraged workers, as a percent of the civilian labour force plus discouraged workers
U-5 Total unemployed, plus discouraged workers, plus all other marginally attached workers, as a percent of the civilian labour force plus all marginally attached workers
U-6a Total unemployed, plus all marginally attached workers, plus total employed part time who preferred to work more hours, as a percent of the civilian labour force plus all marginally attached workers
U-6b Total unemployed, plus all marginally attached workers, plus total employed part time who preferred to work more hours and who looked for full-time work, as a percent of the civilian labour force plus all marginally attached workers
Table 5 shows the time series we computed for these alternative measures (see also
Figure 2). Due to changes in ABS definitions we have only computed the U5 and U6
measures from 1986. Estimates from September 1986 were based on a revised labour
force questionnaire introduced in April 1986. The estimate of employment was
expanded resulting in a slight decrease in the estimate of persons not in the labour
force (ABS, 1986a). New or amended concepts were also introduced in the September
1983 survey, causing a break in series (see ABS, 1986b). In particular, the availability
to start work criteria was not applied to the definition of discouraged jobseekers in
surveys prior to September 1983. This meant that prior to this date persons were
classified as discouraged jobseekers regardless of whether or not they were available
to start work in the near future. Also persons not in the labour force aged 65 and over
were added to the September 1983 survey of persons not in the labour force, and may
therefore be classified as being discouraged jobseekers or as otherwise having
marginal attachment to the labour force from this date. (From 1987, this was modified
to include only persons 65-69 in the not in the labour force survey estimates, although
all persons over 65 continue to be included in the monthly Labour Force Survey
estimates).9 Persons belonging to two other groups were also added starting with the

14
1983 survey, as marginally attached (but not discouraged) workers: persons who were
actively looking for work but who were unable to start in the survey week for reasons
other than their own temporary illness or injury; persons who had been away from
work without pay for four weeks or longer and had not been actively looking for
work, of which those who wanted to work and were available to start work within
four weeks are included as having marginal attachment to the labour force.
Table 5 Underutilisation and underemployment measures, Australia, 1981-2000
U1 U3 U4 U5 U6a U6b UFT UPT
1981 2.9 5.8 6.8 5.7 6.0
1982 3.6 7.2 8.3 7.2 6.9
1983 6.2 9.9 11.5 10.5 7.5 1984 5.7 8.9 10.2 9.3 7.5 1985 5.1 8.3 9.4 8.4 7.5 1986 4.7 8.1 9.2 8.2 7.7 1987 4.8 8.1 9.3 8.3 7.3 1988 4.1 7.2 8.2 14.9 17.9 16.2 7.2 7.3 1989 3.2 6.2 7.0 13.6 16.7 14.8 6.1 6.6 1990 3.6 6.9 8.0 14.5 18.0 15.9 7.0 6.7 1991 5.9 9.6 11.0 17.6 22.0 19.4 10.2 7.6 1992 7.4 10.8 12.3 18.8 24.2 21.2 11.8 7.5 1993 7.4 10.9 12.4 19.4 24.9 21.8 11.8 7.7 1994 6.5 9.7 10.8 17.1 22.5 19.5 10.4 7.6 1995 5.3 8.5 9.6 16.5 21.8 18.9 9.0 6.9 1996 5.1 8.5 9.7 16.6 21.9 18.9 8.9 7.3 1997 5.3 8.6 9.7 16.6 22.2 19.1 9.0 7.2 1998 4.9 7.9 9.1 16.3 21.7 18.6 8.4 6.8 1999 4.2 7.2 8.3 15.2 20.5 17.3 7.4 6.9 U1 = Persons unemployed 13 weeks or longer, as a percent of the civilian labour force U3 = official unemployment rate U4 = Total unemployed, plus discouraged workers, as a percent of the civilian labour force plus discouraged workers U5 = Total unemployed, plus all marginally attached workers, as a percent of the civilian labour force plus marginally attached workers U6a = U5 plus underemployed part-time (preferred to work more hours). U6b = U5 + underemployed part-time (preferred to work more hours and looked for full-time work). UFT = ABS measure - unemployment rate for persons for looking for full-time work. UPT = ABS measure - unemployment rate persons for looking for part-time work From Table 6, it is interesting to note that in 1988 and 1999, U3 was equal to 7.2 per
cent. Both observations were in a year that followed several years of growth in the
economy and an increasingly tighter labour market. Over the same period, U1, U4 and
U5 are more or less back to their 1988 levels, but U6a and U6b, the broadest
measures, are significantly above their 1988 levels. This would be consistent with a

15
labour market that has created jobs but not matched the hours on offer to those desired
by the incumbents. That is, while utilisation has returned to the levels of 1998,
underemployment has worsened. The data in Table 6 also show that as we broaden the
measure, the extent of underutilisation and underemployment grows dramatically.
Indicator U6a, for example, suggests that around 20 per cent of willing labour
resources in 1999 are wasted in some way. The data also suggest that underutilisation
and underemployment are greater problems in the Australian labour market that
appears to be the case for the USA.10 On the surface, a wider coverage to reflect
marginal workers and underemployed part-timers provides a more comprehensive
measure of labour utilisation and raises a series of research questions not suggested by
the unemployment rate.
Figure 2 Underutilisation and underemployment measures, Australia, 1981-1999
0.00
5.00
10.00
15.00
20.00
25.00
30.00
1981 1983 1985 1987 1989 1991 1993 1995 1997 1999
per c
ent
U1
U3 - Official
U4
U5
U6a
U6b
The relationship between U1 and U3 can be examined in percentage terms because
they share the same denominator. The numerator of U1 is the unemployed longer than
13 weeks. If U1 rises as a percentage of U3 we conclude that the longer-term
unemployed are becoming more significant as a proportion of total unemployment.
The data shows that over the period 1981 to 1999 this percentage has moved in a
cyclical manner. The 1991-92 recession provided a more severe shock to the longer-

16
term unemployed than the 1983 recession. Since the last recession (1992) the
percentage has fallen from 68.3 per cent to 57.6 per cent. This indicates that the
fortunes of this group have improved in relative terms.
The other measures can be interpreted in incremental terms. Table 6 shows the gaps
between the various measures in an analogous fashion to the gaps shown in Table 3.
The U4-U3, U5-U4, and U6a-U5 and U6b-U5 gaps represent an incremental
broadening of the official unemployment rate (U3). Examining all the gaps, it is clear
that they exhibit markedly different patterns to those for the USA.
Table 6 Deviations in measures of underutilisation and underemployment, Australia U4-U3 U5-U4 U6a-U5 U6b-U5 1988 0.9 6.7 3.0 1.3 1989 0.9 6.6 3.1 1.2 1990 1.1 6.5 3.5 1.4 1991 1.4 6.5 4.5 1.9 1992 1.5 6.5 5.4 2.4 1993 1.5 7.0 5.5 2.4 1994 1.1 6.2 5.4 2.4 1995 1.1 6.9 5.3 2.4 1996 1.2 6.9 5.3 2.4 1997 1.2 6.9 5.6 2.5 1998 1.1 7.2 5.5 2.4 1999 1.0 6.9 5.4 2.2 The gap between U4 and U3 is due to discouraged workers and the results show that
this component of underutilisation adds around 1 per cent to the U3 measure. As
expected, the gap increased in the recession and declined in the late 1990s growth
phase. However, the impact of discouraged workers is not insignificant. The estimates
from ABS indicate that around 105 thousand workers are excluded from the labour
force under this category. Mitchell (2000b) using different methodology estimates that
hidden unemployment was around 180 thousand in 1999. At any rate, the size of the
gap indicates that hidden unemployment is a significant wastage of available
resources.
The gap between U5 and U4 is due to the inclusion of all other marginally attached
workers (in addition to the discouraged workers included in U4). As discouraged
workers, as defined, represent only a part of all marginally attached workers, the
17
inclusion of the additional marginally attached workers has a more significant impact
on the degree of underutilisation. The size of this gap is very significant and indicates
substantial resource wastage. This is a notable difference to the US behaviour. The
dynamic of this series is only mildly cyclical. As in the US case, the closure of the
U4-U3 gap was larger than the closure of the U5-U4 gap. This indicates that in the
expansionary phase the discouraged workers as a group more readily changed their
status than the other marginally attached workers.
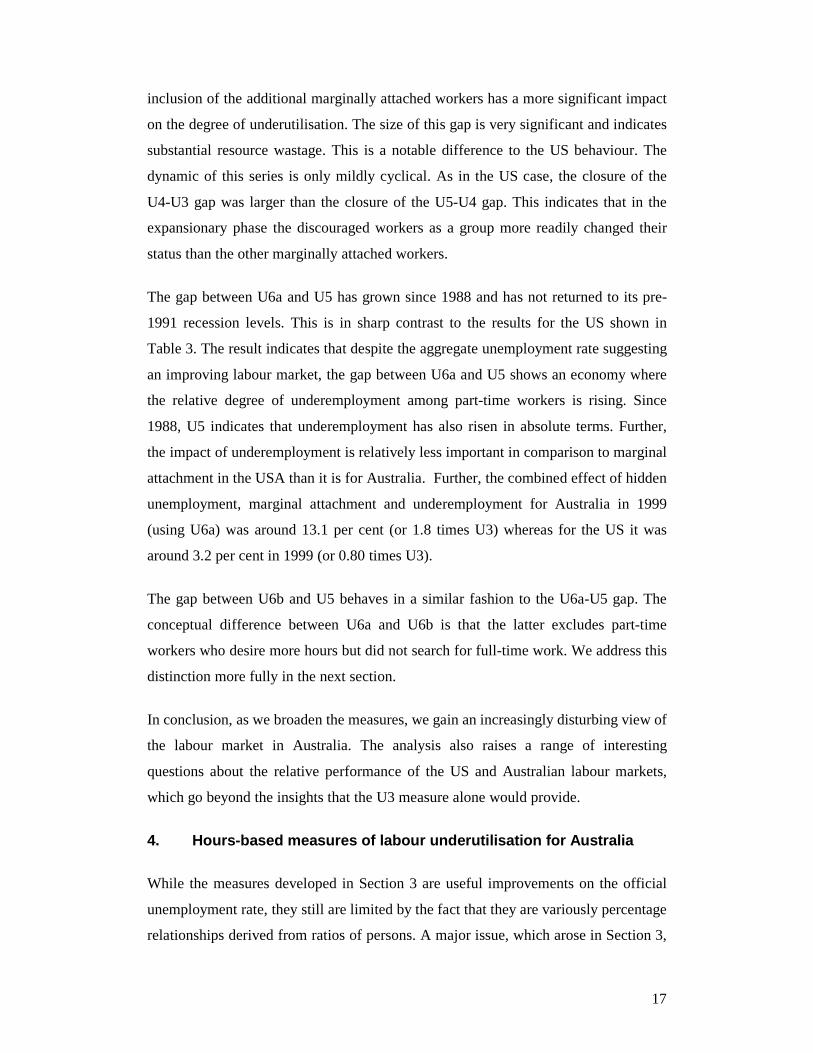
The gap between U6a and U5 has grown since 1988 and has not returned to its pre-
1991 recession levels. This is in sharp contrast to the results for the US shown in
Table 3. The result indicates that despite the aggregate unemployment rate suggesting
an improving labour market, the gap between U6a and U5 shows an economy where
the relative degree of underemployment among part-time workers is rising. Since
1988, U5 indicates that underemployment has also risen in absolute terms. Further,
the impact of underemployment is relatively less important in comparison to marginal
attachment in the USA than it is for Australia. Further, the combined effect of hidden
unemployment, marginal attachment and underemployment for Australia in 1999
(using U6a) was around 13.1 per cent (or 1.8 times U3) whereas for the US it was
around 3.2 per cent in 1999 (or 0.80 times U3).
The gap between U6b and U5 behaves in a similar fashion to the U6a-U5 gap. The
conceptual difference between U6a and U6b is that the latter excludes part-time
workers who desire more hours but did not search for full-time work. We address this
distinction more fully in the next section.
In conclusion, as we broaden the measures, we gain an increasingly disturbing view of
the labour market in Australia. The analysis also raises a range of interesting
questions about the relative performance of the US and Australian labour markets,
which go beyond the insights that the U3 measure alone would provide.
4. Hours-based measures of labour underutilisation for Australia While the measures developed in Section 3 are useful improvements on the official
unemployment rate, they still are limited by the fact that they are variously percentage
relationships derived from ratios of persons. A major issue, which arose in Section 3,

18
concerned which persons should be included in the numerator and denominator of the
adjusted unemployment rate. It was concluded that a wider coverage to reflect
marginal workers and counts of underemployed part-timers, gave us a more
comprehensive measure of labour underutilisation. However, a more sophisticated,
and arguably more precise measure of labour underutilisation can be constructed in
terms of hours.
In this section, we therefore extend the analysis to compute and include two new
measures of underutilisation – hours-based measures of unemployment one with and
one without hidden unemployment. We compute and compare the following measures
of labour underutilisation (see Appendix for technical explanations):
1. The official unemployment rate – denoted U3 as defined above in Table 4.
2. The official unemployment rate augmented by the hidden unemployment
estimates in Mitchell (2000b) (expressed in terms of a percentage ratio with
persons on the numerator and denominator) – denoted CU4.11
3. An hours-adjusted unemployment rate (expressed in terms of a percentage ratio
with hours on the numerator and denominator), being a ratio of unutilised hours of
work available (unemployed and underemployed part-time workers) to total the
available (fully-utilised) labour force in hours (the numerator plus the full-time
employed plus the part-time workers who are content with their working hours) -
denoted CU7.
4. An hours-adjusted unemployment rate including estimates of hidden
unemployment (expressed in terms of a percentage ratio with hours on the
numerator and denominator) – denoted CU8.
Table 7 compares the measures developed with the official unemployment rate, the
employment-to-population ratio and the unemployment-vacancy ratio. The
employment-population and UV series display clear cyclical patterns. The UV series
also demonstrates that the economy has been demand constrained for the entire
period. The series indicate considerable differences in the degree of labour utilisation.
The difference between U3 and CU4 is due to hidden unemployment (in persons).
The underutilisation arising from cyclical sensitive participation effects is pronounced
with the gap between the measures at its maximum during recession (3.6 percentage
points in 1992 and 1993). The gap narrows as the economy achieves higher levels of
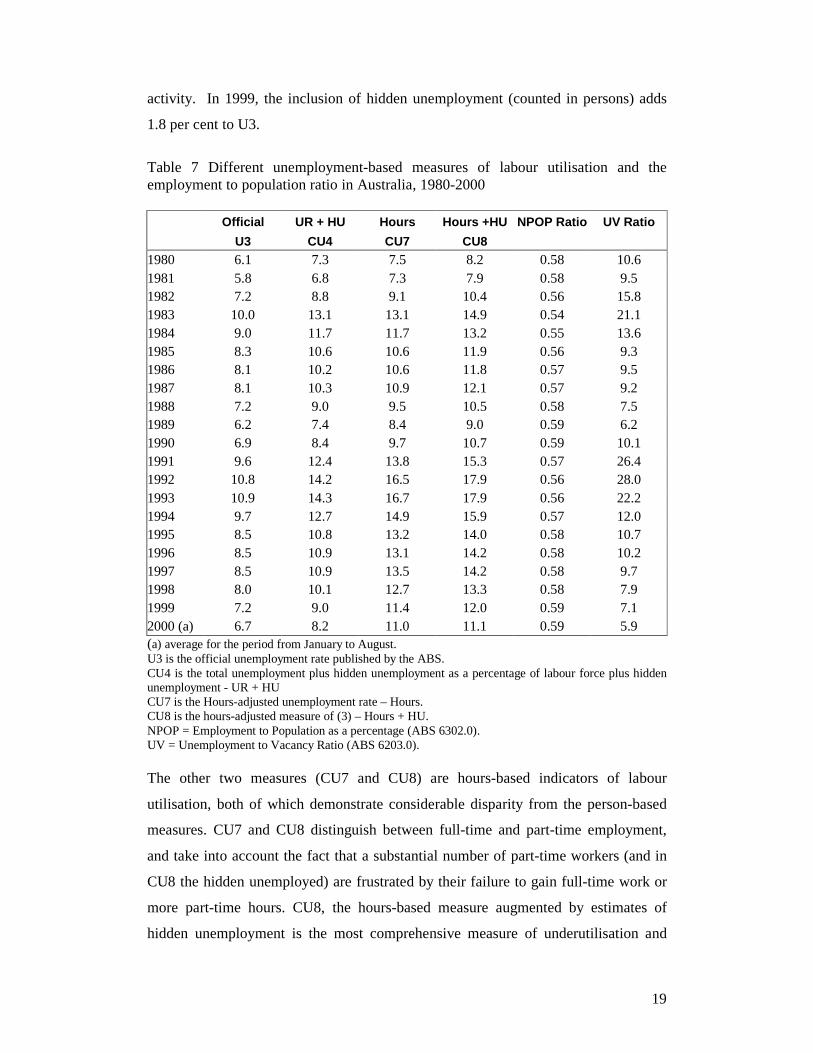
19
activity. In 1999, the inclusion of hidden unemployment (counted in persons) adds
1.8 per cent to U3.
Table 7 Different unemployment-based measures of labour utilisation and the employment to population ratio in Australia, 1980-2000 Official UR + HU Hours Hours +HU NPOP Ratio UV Ratio U3 CU4 CU7 CU8 1980 6.1 7.3 7.5 8.2 0.58 10.6 1981 5.8 6.8 7.3 7.9 0.58 9.5 1982 7.2 8.8 9.1 10.4 0.56 15.8 1983 10.0 13.1 13.1 14.9 0.54 21.1 1984 9.0 11.7 11.7 13.2 0.55 13.6 1985 8.3 10.6 10.6 11.9 0.56 9.3 1986 8.1 10.2 10.6 11.8 0.57 9.5 1987 8.1 10.3 10.9 12.1 0.57 9.2 1988 7.2 9.0 9.5 10.5 0.58 7.5 1989 6.2 7.4 8.4 9.0 0.59 6.2 1990 6.9 8.4 9.7 10.7 0.59 10.1 1991 9.6 12.4 13.8 15.3 0.57 26.4 1992 10.8 14.2 16.5 17.9 0.56 28.0 1993 10.9 14.3 16.7 17.9 0.56 22.2 1994 9.7 12.7 14.9 15.9 0.57 12.0 1995 8.5 10.8 13.2 14.0 0.58 10.7 1996 8.5 10.9 13.1 14.2 0.58 10.2 1997 8.5 10.9 13.5 14.2 0.58 9.7 1998 8.0 10.1 12.7 13.3 0.58 7.9 1999 7.2 9.0 11.4 12.0 0.59 7.1 2000 (a) 6.7 8.2 11.0 11.1 0.59 5.9 (a) average for the period from January to August. U3 is the official unemployment rate published by the ABS. CU4 is the total unemployment plus hidden unemployment as a percentage of labour force plus hidden unemployment - UR + HU CU7 is the Hours-adjusted unemployment rate – Hours. CU8 is the hours-adjusted measure of (3) – Hours + HU. NPOP = Employment to Population as a percentage (ABS 6302.0). UV = Unemployment to Vacancy Ratio (ABS 6203.0). The other two measures (CU7 and CU8) are hours-based indicators of labour
utilisation, both of which demonstrate considerable disparity from the person-based
measures. CU7 and CU8 distinguish between full-time and part-time employment,
and take into account the fact that a substantial number of part-time workers (and in
CU8 the hidden unemployed) are frustrated by their failure to gain full-time work or
more part-time hours. CU8, the hours-based measure augmented by estimates of
hidden unemployment is the most comprehensive measure of underutilisation and

20
underemployment. It is clear that the both of the hours-adjusted unemployment rates
(CU7 and CU8) are substantially higher than the official rate indicating that the extent
of underutilisation and underemployment is large. The gap between U3 and CU7 has
risen since 1980, which indicates that a proportion of jobs created have been part-time
but with less than desired hours on offer. The frustration of workers with less than
desired hours of work available is latent in the hidden unemployed as well. The gap
between CU7 and CU8 reflects the magnitude of hidden unemployment and the
hours-aspirations of the hidden unemployed. It has narrowed marginally since the
recession in the early 1990s, which suggests that there are fewer persons classified as
being not in the labour force that desire and are willing to work. Overall, the results
are consistent with the conclusions reached using the U1-U6b indicators in Table 5.
They all indicate substantial labour resource wastage in the Australian labour market.
Further, if we aspire to efficient use of our resources then the hours-adjusted measures
are better indicators of the degree of slack in the labour market than the other
measures in Table 5 or Table 7.
Figure 4 shows the official unemployment rate (U3), the persons-based
unemployment rate augmented by hidden unemployment (CU4), and the two hours-
adjusted measures of underutilisation and underemployment (CU7 and CU8), which
are explained above. It is clear that the waste of labour resources rises in an economic
downturn not only because unemployment rises but also because hours of work are
rationed and an increased number of workers are unable to work as many hours as
they would prefer. The losses are compounded by the falling labour force
participation rates captured by the CU4 and CU8. As the economy increases activity,
more employed workers find full-time hours of work, the participation rate stabilises
at a higher level, and the absolute number of unemployed falls.
The other interesting aspect of the relationship between the series is that while the
three series move in a clear cyclical pattern, CU8 leads CU7 and CU4 leads U3. CU8
leads all the other measures. This suggests that the labour participation effects impact
sooner than adjustments in hours. An examination of a chart of the percentage
changes in each measure (not shown) suggests that percentage changes in CU4 and
CU8 generally lead the other two indicators. At top of a cycle, it appears that

21
participation effects come more quickly than any hours-adjustment. More research is
needed in this area.
Figure 4 U3, CU4, CU7, and CU8, Australia, 1980-2000.
0.0
2.0
4.0
6.0
8.0
10.0
12.0
14.0
16.0
18.0
20.0
1980 1982 1984 1986 1988 1990 1992 1994 1996 1998 2000
U-3
CU-4
CU-7
CU-8
U3 = Official unemployment rate CU4 = Official plus hidden CU7 = Hours-adjusted official rate CU8 = Hours-adjusted plus hidden Table 8 provides summary statistics (mean, variance, and coefficient of variation) for
U3 and the three CU indicators in level form and quarterly percentage change form.
The results show that as expected the mean and variance of the levels increase as the
measure becomes more comprehensive. The most comprehensive measure (CU8)
varies due to changes in persons-unemployed, hours of work, preferences for hours
worked, and the cyclical sensitivity of the labour force participation rate.
Table 8 Summary statistics for U3, CU4, CU7 and CU8, 1980-2000.
Levels Percentage Changes Mean Variance CV (%) Mean Variance CV (%)
U3 8.2 2.4 18.9 0.61 83.2 1499.8 CU4 10.5 5.4 22.1 0.72 111.2 1456.5 CU7 11.4 7.2 23.6 0.68 54.5 1078.2 CU8 12.8 8.7 22.9 0.74 70.4 1128.2 Table 9 shows the correlation between the measures of labour utilisation shown in
Table 7. The correlations show that the employment-to-population ratio is more
strongly correlated with the person-based estimates of the unemployment rate

22
(including the hidden unemployment augmentations) than it is with the hours-based
measure. This means that the employment-to-population ratio, while providing a
clearer indication of employment (persons) trends than measures deflated by the
labour force, will overestimate the health of the labour market. The hours-based
measures provide a clearer picture of the resources wasted by the lack of activity in
the economy.
Table 9 Correlations between measures of labour utilisation in Australia, 1980-1999
Measure U3 CU4 CU7 CU8 NPOP UV
U3 1.000
CU4 1.000 1.000
CU7 0.931 0.926 1.000
CU8 0.969 0.965 0.991 1.000
NPOP -0.664 -0.673 -0.380 -0.482 1.000
UV 0.753 0.741 0.617 0.686 -0.649 1.000 Table 10 shows the correlations between the annual percentage changes in the
measures of labour utilisation and Gross Domestic Product (GDP). The interesting
point here is that changes in the employment-population ratio and GDP changes are
more highly correlated with the hours-based measures (CU7 and CU8) than they are
with the person-based measures.
Table 10 Correlations between percentage changes in various measures of activity, Australia, 1981-2000
Measure U3 CU4 CU7 CU8 NPOP UV GDP
U3 1.000
CU4 0.999 1.000
CU7 0.994 0.992 1.000
CU8 0.994 0.991 0.991 1.000
NPOP -0.931 -0.929 -0.935 -0.933 1.000
UV 0.837 0.826 0.827 0.855 -0.745 1.000
GDP -0.899 -0.892 -0.904 -0.912 0.810 -0.851 1.000 (a) average for the period from January to August. For GDP, the 2000 growth rate was measured as
the percentage change between the June quarter 1999 to June quarter 2000. Table 11 shows regression results based on a simple dynamic model, first discussed in
this context by Okun (1983: 148). The dependent variable is the unemployment gap

23
for each measure, which was constructed by smoothing the series with a Hodrick-
Prescott filter and subtracting the smoothed series from the actual. This provides one
method of constructing a deviation-from-trend time series. The independent variable
was the percentage change in GDP. The regressions tested 4 lags of the change in
GDP. The preferred regression in each case included only the first lag. There was very
little evidence of a contemporaneous effect. All the equations that tested for
contemporaneity were poorly specified. The results are interesting and reveal sharply
different cyclical sensitivities. For each extra one percent of GDP, the deviation of U3
from its trend is 0.10 points lower. Analogously, the deviation of CU4 from its trend
is 0.15 points lower, the deviation of CU7 from its trend is 0.16 points lower, and the
deviation of CU8 from its trend is 0.18 points lower. The results suggest that the
economy gains from higher levels of activity not only in terms of less unemployment,
but also through increased average working hours, and higher participation rates.
Given that the difference between U3 and CU4 is solely in terms of the estimated
hidden unemployed, the coefficient on CU4 (-0.1523) indicates a strong labour force
participation effect. More research is needed in this area.
Table 11 Unemployment measure regressions, Australia, 1980 (3) to 2000 (1)
U3 CU4 CU7 CU8 Constant 0.54 0.77 1.14 1.58 (1.94) (1.84) (2.70) (3.24) DGDP_1 -0.1017 -0.1512 -0.1561 -0.1772 (4.19) (4.17) (4.26) (4.17) R2 0.33 0.31 0.27 0.28 t-statistics in parentheses. 6. Conclusion This paper is the first of a series of research reports based on a comparative analysis
of labour market performance in the United States, Japan, and Australia. In this paper
we have computed a range of measures of underutilisation and underemployment for
Australia using BLS concepts and compared them to similar measures for the US
economy. The conclusion is that they provide a richer picture of the state of the labour
market than would have been gained if we relied on the unemployment rate as our
sole measure. Most importantly, while the aggregate unemployment rate in Australia

24
has returned to levels that existed in the late 1980s (after a severe recession in the
early 1990s), the level of underemployment and the impact of marginal attachment
have risen over that time. In 1999, around 20 per cent of willing labor resources were
in various states of underutilisation or underemployment. This represents a much
bleaker picture of the labour market than demonstrated by the aggregate
unemployment rate.
The paper also reports for the first time several new indicators of labour market
utilisation, which provide a more accurate guide to the state of resource usage than the
conventional unemployment rate. The hours-adjusted measures with updated hidden
unemployment estimates provide the most comprehensive indicator of labour
utilisation. According to the CU8 measure (hours adjusted plus hidden) 12 per cent of
willing labour resources measured in hours were being wasted compared to the
conventional unemployment rate measure of 7.2 per cent.

25
Appendix
Derivation of Hours-adjusted unemployment rates
There are two hours-adjusted measures of the unemployment rate presented in this
paper:
1) Hours-adjusted unemployment rate (CU7)
2) Hours-adjusted unemployment rate with hidden unemployment (CU8).
The hidden unemployment estimates are taken from Mitchell (2000b). Both measures
are designed to capture underutilisation and underemployment that is not measured by
the official aggregate unemployment rate or person-based derivatives:
1) CU7 estimates the impact of underemployment of part-time workers, who
want to work more hours than they are currently working.
2) CU8 is equal to CU7 plus an estimate (in hours) of the unused resources
currently not counted in the labour force but still willing to work – the so-
called hidden unemployed.
Hours-adjusted unemployment rate
The formula for the hours-adjusted unemployment rate (CU7) is given as:
(1) CU7 UH FT PT
H UH FT PT
PTE UN UNFTE PTE PTE UN UN
+ +=+ + + +
where FTUN is the number of unemployed who want full-time work multiplied by the
average full-time working hours, PTUN is the number of unemployed workers who
want part-time work multiplied by average part-time working hours, UHPTE is the
number of part-time workers who want to work full-time expressed in hours as
explained below, HPTE is the number of part-time workers who do not want to work
more hours multiplied by the hours they are currently working, FTE is total full-time
workers multiplied by the average full-time working hours. The numerator and
denominator of CU7 are expressed in hours and the resulting measure is a percentage.

26
Computing UHPTE and HPTE
The part-time workers are divided into those who want more hours and those who
don't wish to work more hours. The part-time workers who are content are divided by
the ABS into 4 hours bands: 0 hours per week, 1-15 hours per week, 16-29 hours per
week, and 30-34 hours per week. Average hours per week for each band are also
published. The total part-time hours in this category then equals the number of
workers in each category multiplied by the relevant average hours. For the workers in
the 0 hours per week category, we treated them as if they were in the 1-15 band. The
latter assumption provides some downward bias in the measure. The sum of these
individual products is the total hours of part-time workers who are content with the
number of hours they are working. These part-time workers are therefore not
construed as being underemployed.
The part-time workers who want more hours are divided into two groups: those who
want to work full-time and those who did not look for full-time work. The ABS also
publishes the numbers of these workers in the hours bands denoted above.
For the part-time workers who wanted more hours but did not look for full-time work,
we assumed they wanted to be in the next higher hours band than they were currently
working in. Underemployment then is the number of workers in this group expressed
in each hours band times the average hours of the part-time workers (who are content
as above) in the next higher hours band minus the actual hours they are currently
working. The individual products are summed. The workers in the 0 hours band are
treated as before. This generates the first component of underemployed part-time
work in hours. The underemployment of the part-time workers who want to work full-
time is the number of workers in each hours band times the average weekly full-time
hours minus the hours they are actually working. The individual products are then
summed. The workers in the 0 hours band are treated as before. This generates the
second component of underemployed part-time work in hours.
The total underemployment of part-time workers is the sum of these components.

27
Computing FT PTUN UN+
The actual unemployed are divided into those who want full-time work and those who
do not. The underutilised hours for those who want full-time work is equal to the total
persons in this category times the average weekly full-time hours. For those who are
currently unemployed but want part-time work, their underutilised hours are
computed by multiplying the number of unemployed in this category by the average
part-time hours worked. This gives total unemployment in hours
Computing FTE
This is simply the number of full-time workers times the average full-time working
hours.
Hours-adjusted unemployment rate with hidden unemployment
The formula for the hours-adjusted unemployment rate (CU8) is given as:
(2) CU8 UH FT PT FT PT
H UH FT PT FT PT
PTE UN UN HU HUFTE PTE PTE UN UN HU HU
+ + + +=+ + + + + +
where the additional terms are FTHU the estimated discouraged workers who want to
work full-time times the average full-time working hours, and PTHU is the estimated
number of discouraged workers who want to work part-time times the average part-
time working hours. We used the proportions that apply to the official unemployed to
allocated the estimated hidden unemployed between the two categories.
28
References Australian Bureau of Statistics (1986a). Persons Not in the Labour Force, Cat. No.
6220.0, September.
Australian Bureau of Statistics (1986b). Persons Not in the Labour Force, Cat. No.
6220.0, March.
Australian Bureau of Statistics (1999). Persons Not in the Labour Force, Cat. No.
6220.0, September.
Bregger J.E and Haugen S.E. (1995). “The BLS introduces new range of alternative
unemployment measures”, Monthly Labor Review, October, 1-25.
Bureau of Labor Statistics (2000). “Technical notes to household survey data
published in Employment and Earnings”, http://www.bls.gov/cpstn1.htm#Concepts
Castillo Monica D. (1998). “Persons outside the labor force who want a job”, Monthly
Labor Review, July, 34-42
International Labor Office (ILO), (1982). 13th International Conference of Labor
Statisticians in Geneva, which adopted the ILO definitions of unemployment. See
http://www.ilo.org/public/english/bureau/stat/res/ecacpop.htm for the October 1982
resolution.
Lawrence, Sophia (1999). “ILO-Comparable annual employment and unemployment
estimates”, ILO Bulletin of Labour Statistics, (3), XII-XIII.
Mitchell, William F. (2000a). “Full employment abandoned – the role of the public
sector”, Centre of Full Employment and Equity, Working Paper No. 5, November
2000.
Mitchell, William F. (2000b). “Updated hidden unemployment estimates for Australia
and the USA”, Centre of Full Employment and Equity, Working Paper No. 8,
November 2000.
OECD (2000). News Release, Standardised Unemployment Rates, 10 October 2000.

29
Okun, Arthur M. (1983). Economics for Policymaking, (MIT Press: Cambridge). Shiskin, Julius (1976). “Employment and unemployment: the doughnut or the hole?”,
Monthly Labor Review, February, 3-10.
Sorrentino, Constance (1993). “International comparisons of unemployment indicators”, Monthly Labor Review, March, 3-24. Sorrentino, Constance (2000). “International unemployment rates: how comparable
are they they?”, Monthly Labor Review, June, 3-20.
Statistics Canada (1998). Labour Force Update.
30
Endnotes 1The authors are, in order of naming, Professor of Economics and Director of the Centre of Full Employment and Equity and Senior Research Officer, Centre of Full Employment and Equity, University of Newcastle, NSW 2308 Australia. We asknowledge helpful input from Martin Watts and John Burgess. 2OECD, Standardised Unemployment Rates, published in each issue of Quarterly Labour Force Statistics; BLS, “Unemployment rates approximating US Concepts”, Foreign Labor Statistics Program, http://www.bls.gov/flshome.htm; ILO, ILO Program of “Comparable Annual Employment and Unemployment Estimates”, Bureau of Statistics of the ILO (STAT) www.ilo.org/public/english/bureau/stat/wedo.htm; Statistical Office of the European Communities (EUROSTAT), Harmonised Unemployment rates, www.europa.eu.int/comm/eurostat. 3“The foreign country data are adjusted as closely as possible to U.S. concepts, with the exception of age limits and the treatment of layoffs, for which no adjustments are made. In addition, for some countries, no adjustment is made for deviations from U.S. concepts in the treatment of unpaid family workers, persons waiting to start a new job, and passive job seekers (for example, persons only reading newspaper ads as their method of job search). In the United States, job search must be "active," such as placing or answering advertisements, and simply reading ads is not enough to qualify as active search.” (BLS, “Unemployment rates approximating US Concepts”, Foreign Labor Statistics Program, ftp://ftp.bls.gov/pub/special.requests/ForeignLabor/flsjec.txt ). 4We ignore the concept of underemployment based on skill mismatch. Further work is being done to generate a measure matching the skills of the labour supply to the jobs being performed. Clearly, if the society invests resources in education then the skills developed should be used appropriately. 5In the Resolution concerning statistics of the economically active population, employment, unemployment and underemployment, adopted by the Thirteenth International Conference of Labour Statisticians (ILO, 1982), the “employed“ comprise all persons above a specific age who during a specified brief period, either one week or one day, were in (a) "paid employment" - either “at work” which refers to persons who during the reference period performed some work for wage or salary, in cash or in kind; or “with a job but not at work” temporarily during the reference period, and (b) in “self-employment” either “at work” which refers to persons who during the reference period performed some work for profit or family gain, in cash or in kind; or “with an enterprise but not at work“ temporarily during the reference period. Point 2 of the Resolution states: “For operational purposes, the notion “some work” may be interpreted as work for at least one hour.” For paid employment this is the definition adopted by both the US and Australia. Point 5 of the Resolution states: “Unpaid family workers at work should be considered as in self-employment irrespective of the number of hours worked during the reference period.” Australia has adopted one hour of work for unpaid family workers to be counted as employed, while the US includes only those unpaid family workers who have worked more than 15 hours in the reference week. 6The strict definitions vary between countries. Concerning availability, in Australia persons must be available in the next four weeks, in the US they must be available for work in the same week. 7In the US survey, discouraged workers are persons not in the labour force who want a job and are available for a job and who have looked for work sometime in the past 12 months (or since the end of their last job if they held one within the past 12 months), but are not currently looking because they believe: there are no jobs available for them; that they could not find work; that they lack the necessary schooling, skills or experience; or they perceive some type of discrimination in the workplace. (BLS, 2000; Castillo, 1998) In Australia persons are classified as discouraged jobseekers if they want to work, are available for work in the next four weeks but are not actively looking for work (have not looked in the last 4 weeks) for one of the following reasons: considered too young or too old by employers; lacked necessary training, skills or experience; difficulties with language or ethnic background; no jobs in locality or line of work; or believe there are “no jobs at all”. (ABS, 1999). The main difference is the criteria of must have looked in the past year being applied in the US. This criterion is intended to measure a more formal attachment to the labour market. With the introduction of this criteria and a direct question to measure availability in the US surveys in 1994, the number of discouraged workers fell by roughly one half. (Castillo, 1998). 8There is an issue of inconsistency in the BLS measures. In the incremental measures the extra category of underutilisation or underemployment is added to both the denominator and numerator of the measure. However, in the U1 and U2 measures the total civilian labour force is used as the denominator despite narrowing the scope of the numerator (to be a subset of the total unemployed). For Australia, we computed U1 using the BLS method, which is the series presented in the paper. We also
31
tested the sensitivity of the U1 measure by including only those unemployed 13 weeks or longer in the denominator to correspond with the numerator. The two series were very similar. 9The difference between the estimates appearing in the ABS publication 6220.0 Persons Not in the Labour Force and the publication 6203.0 Labour Force, Australia are “chiefly the result of excluding persons aged 70 years and over from estimates appearing in th[e] supplementary survey publication [6220.0]. This is in line with the scope of this supplementary survey. [In 1999] Over one-quarter (32%) of the civilian population aged 15 years and over who were not in the labour force were excluded from answering questions from this supplementary survey because they were aged 70 years and over.” (ABS,1999:34) It should also be noted that the Not in the Labour Force survey “excludes persons in institutions (e.g. boarding schools, hospitals, prisons, retirement homes, homes for the handicapped), which are included in estimates of persons not in the labour force contained in Labour Force, Australia [6203.0].” (ABS,1999:34). 10This is the case when comparing, for example, US U6 and Aus U6b. Some differences may remain however, in the measures. For example, the US U6 measure includes those employed part-time “for economic reasons” as a measure of underemployment in the numerator. “Economic reasons include slack work or unfavorable business conditions, inability to find full-time work, and seasonal declines in demand. Those who usually work part time must also indicate that they want and are available to work full time to be classified as on part time for economic reasons.” (BLS, 2000). The AUS U6b measure we have computed includes part-timers who wanted to work more hours and who had looked for full-time work - that is it approximates the US definition of wanting and being available to work full-time. We believe that our U6a and U6b measures are pertinent in the Australian context, particularly given the enormous growth in part-time employment. For purposes of cross-country comparisons, however, work is continuing on the further standardisation of these measures. 11The CU prefix in the measures shown in Table 7 denote CofFEE Unemployment and refers to the comparative indicators developed by the Centre of Full Employment and Equity.