Embed Size (px)
Citation preview

RESEARCH ARTICLE
Beyond words: From jaguar population trends
to conservation and public policy in Mexico
Gerardo CeballosID1*, Heliot Zarza2, Jose F. Gonzalez-Maya1,2,3‡, J. Antonio de la
Torre4,5‡, Andres Arias-Alzate6‡, Carlos Alcerreca7, Horacio V. Barcenas8☯,
Gerardo Carreon-Arroyo9☯, Cuauhtemoc Chavez2‡, Carlos Cruz1,10☯, Daniela Medellın1☯,
Andres Garcıa11☯, Marco Antonio-Garcıa12, Marco A. Lazcano-Barrero13‡, Rodrigo
A. Medellın3☯, Oscar Moctezuma-Orozco14☯, Fernando Ruiz15☯, Yamel Rubio16☯, Victor
H. Luja17, Erik Joaquın Torres-RomeroID1
1 Laboratorio de Ecologıa y Conservacion de Fauna Silvestre, Instituto de Ecologıa, Universidad Nacional
Autonoma de Mexico, Ciudad Universitaria, Coyoacan, Ciudad de Mexico, Mexico, 2 Departamento de
Ciencias Ambientales, Universidad Autonoma Metropolitana, Unidad Lerma, CBS, Lerma de Villada, Mexico,
3 Proyecto de Conservacion de Aguas y Tierras, ProCAT Colombia/Costa Rica, Bogota, Colombia,
4 Laboratorio de Ecologıa y Conservacion de Vertebrados Terrestres, Instituto de Ecologıa, Universidad
Nacional Autonoma de Mexico, Ciudad Universitaria, Ciudad de Mexico, Mexico, 5 Bioconciencia A.C.,
Ciudad de Mexico, Mexico, 6 Universidad CES, Facultad de Ciencias y Biotecnologıa, Medellın, Antioquia,
Colombia, 7 Biocenosis, Merida, Yucatan, Mexico, 8 Facultad de Ciencias, Universidad Nacional Autonoma
de Mexico, Ciudad Universitaria, Ciudad de Mexico, Mexico, 9 Naturalia A.C., Hermosillo, Sonora, Mexico,
10 Universidad de Alicante, Campus San Vicente del Raspeig, Alicante, España, 11 Estacion de Biologıa
Chamela, Instituto de Biologıa, Universidad Nacional Autonoma de Mexico, San Patricio-Melaque, La Huerta,
Jalisco, Mexico, 12 Facultad de Ciencias Polıticas y Sociales, Universidad Autonoma de Queretaro,
Queretaro, Mexico, 13 Reserva Ecologica El Eden A.C., Cancun, Quintana Roo, Mexico, 14 Naturalia A.C.,
Col. Ampliacion Napoles, Benito Juarez, Ciudad de Mexico, Mexico, 15 Centro de Investigaciones
Biologicas, Instituto de Ciencias Basicas e Ingenierıa, Universidad Autonoma del Estado de Hidalgo, Ciudad
del Conocimiento, Col. Carboneras, Mineral de la Reforma, Hidalgo, Mexico, 16 Facultad de Biologıa,
Universidad Autonoma de Sinaloa, Ciudad Universitaria, Culiacan, Sinaloa, Mexico, 17 Unidad Academica
de Turismo, Universidad Autonoma de Nayarit, Ciudad de la Cultura, Tepic, Nayarit
☯ These authors contributed equally to this work.
‡ These authors also contributed equally to this work.
Abstract
The jaguar (Panthera onca) is one of the most threatened carnivores in the Americas.
Despite a long history of research on this charismatic species, to date there have been few
systematic efforts to assess its population size and status in most countries across its distri-
bution range. We present here the results of the two National Jaguar Surveys for Mexico,
the first national censuses in any country within the species distribution. We estimated jag-
uar densities from field data collected at 13 localities in 2008–2010 (2010 hereafter) and 11
localities in 2016–2018 (2018 hereafter). We used the 2010 census results as the basis to
develop a National Jaguar Conservation Strategy that identified critical issues for jaguar
conservation in Mexico. We worked with the Mexican government to implement the conser-
vation strategy and then evaluated its effectivity. To compare the 2010 and 2018 results, we
estimated the amount of jaguar-suitable habitat in the entire country based on an ecological
niche model for both periods. Suitable jaguar habitat covered ~267,063 km2 (13.9% of the
country’s territory) in 2010 and ~ 288,890 km2 (~14.8% of the country’s territory) in 2018.
Using the most conservative density values for each priority region, we estimated jaguar
PLOS ONE
PLOS ONE | https://doi.org/10.1371/journal.pone.0255555 October 6, 2021 1 / 22
a1111111111
a1111111111
a1111111111
a1111111111
a1111111111
OPEN ACCESS
Citation: Ceballos G, Zarza H, Gonzalez-Maya JF,
de la Torre JA, Arias-Alzate A, Alcerreca C, et al.
(2021) Beyond words: From jaguar population
trends to conservation and public policy in Mexico.
PLoS ONE 16(10): e0255555. https://doi.org/
10.1371/journal.pone.0255555
Editor: Stephen P. Aldrich, Indiana State University,
UNITED STATES
Received: May 24, 2019
Accepted: July 7, 2021
Published: October 6, 2021
Copyright: © 2021 Ceballos et al. This is an open
access article distributed under the terms of the
Creative Commons Attribution License, which
permits unrestricted use, distribution, and
reproduction in any medium, provided the original
author and source are credited.
Data Availability Statement: All relevant data are
within the paper and its Supporting Information
files.
Funding: This study was funded by Alianza WWF-
Fundacion/Telmex Telcel, Fundacion BBVA
Bancomer, and Comision Nacional de Areas
Naturales Protegidas (CONANP-Mexico) in the
form of grants awarded to GC. This study was also
funded by Direccion General de Asuntos del
Personal Academico, Universidad Nacional
Autonoma de Mexico in the form of grants

densities for both the high and low suitable habitats. The total jaguar population was esti-
mated in ~4,000 individuals for 2010 census and ~4,800 for the 2018 census. The Yucatan
Peninsula was the region with the largest population, around 2000 jaguars, in both cen-
suses. Our promising results indicate that the actions we proposed in the National Jaguar
Conservation Strategy, some of which have been implemented working together with the
Federal Government, other NGO’s, and land owners, are improving jaguar conservation in
Mexico. The continuation of surveys and monitoring programs of the jaguar populations in
Mexico will provide accurate information to design and implement effective, science-based
conservation measures to try to ensure that robust jaguar populations remain a permanent
fixture of Mexico’s natural heritage.
Introduction
The loss of biological diversity is one of the most severely threatening global environmental
problems caused by human activities. Thousands of species and millions of populations
become extinct every year [1,2]. Populations of large mammals, birds, and other vertebrates
have been decimated in the last decades, and it is estimated that more than 50% of all the verte-
brate populations have been lost since 1970 [3–5].
Carnivores are among the animals that have experienced the most severe declines due to
human activities such as habitat loss and fragmentation, illegal hunting and trade, conflict
with livestock, and diseases transmitted by domestic animals [6–14]. Large carnivores are espe-
cially vulnerable to population losses because of their need for large areas, relatively small
extant populations in comparison to medium and small carnivores, and slow population
growth rates [15,16]. Globally, the population decline of many large cat species has been dra-
matic in recent times: tigers are only limited to 6% of its historic geographic range and their
populations have declined 50% in the last decades. In a similar way lions occur only in 17% of
their historic range and populations have declined 47% over the last 21 years [16–19]. Asiatic
lions and cheetahs, for example, have disappeared from more than 98% of their historical
range [13]; roughly 500 Asiatic lions live exclusively in the Gir forest in India and the popula-
tion of Asiatic cheetahs in central Iran is less than 20 [15,20]. Other large cats, including leop-
ards (Panthera pardus), snow leopards (Panthera uncia), and clouded leopards (Neofelisnebulosa and N. diardi) have experienced similar declines, and the leopard conservation status
was recently uplisted by the IUCN to Vulnerable [13,21].
Large charismatic carnivores are good surrogates for biodiversity conservation [14], conser-
vation priority policies, and conservation impacts at multiple scales [10]. Therefore, knowledge
about carnivore current distribution and population trends is critical for conservation efforts.
However, estimating population size of large cat species is challenging because of their large
geographic and home ranges, elusiveness, and the fragmentation of the extant populations
[13,17]. Early population estimates were based on field surveys carried out using transects and
aerial counts [22]. In the last two decades, automatic camera traps have become widely used
for assessing populations of many mammal species including large cats [23–26] and they have
provided critical data for comprehensive large-scale censuses for species such as tigers, lions
and jaguars [17,19,27,28].
The jaguar (Panthera onca) is the largest felid species in the Neotropics and the least studied
in the genus Panthera [29]. Historically, jaguar geographic range extended from southwestern
United States to central Argentina [27,30], but currently the species is considered Near
PLOS ONE Jaguar population trends and conservation in Mexico
PLOS ONE | https://doi.org/10.1371/journal.pone.0255555 October 6, 2021 2 / 22
awarded to EJTR. The funders had no role in study
design, data collection and analysis, decision to
publish, or preparation of the manuscript.
Competing interests: The authors have declared
that no competing interests exist.

Threatened globally because it has been extirpated from roughly 55% of its historic range and
many of its populations are now either endangered or critically endangered [31–33]. Habitat
destruction and fragmentation, retaliatory killing by cattle ranchers, illegal hunting, prey
depletion, and introduced diseases, are the most significant threats to the long-term viability of
jaguar populations [21,27].
Development and expansion of agricultural lands and livestock pastures, human settle-
ments, roads and other infrastructure, are the primary causes of the loss and fragmentation of
jaguar habitat [34–40]. In many communities, jaguars are perceived as a threat and killed by
livestock ranchers in retaliation because the loss of livestock by predation is usually understood
only from the economic loss perspective [41–46]. Additionally, jaguars are still hunted (albeit
illegally) as trophies throughout their range, and recently illegal trade of their bones and teeth
for the Chinese black-market has become an emerging threat [47]. The Convention on Inter-
national Trade of Endangered Species (CITES) is taking action to curb this emerging threat
[48].
Jaguars are still present across most of their historic range in Mexico. Its distribution
extends along the lowlands and foothills of the mountains from Sonora to Chiapas in the
Pacific coast, and from Tamaulipas to the Yucatan Peninsula in the Gulf of Mexico coast
[49,50]. The main threats they face in the country are habitat loss and fragmentation, retalia-
tory killing, reduced abundance of their natural prey, and diseases transmitted by domestic
animals [e.g., 50,51]. Recognizing these threats, the Mexican government prohibited jaguar
trophy hunting in 1987 and listed it as an endangered species in 1994 [52].
In 2005, we organized a meeting of experts, which later became the National Alliance for
Jaguar Conservation [53], to contribute to the long-term conservation of jaguars. We carried
out basic ecological research, developed conservation and management initiatives, and helped
to implement conservation policies. The Alliance developed a National Jaguar Conservation
Strategy that identified nine fundamental and critical areas for jaguar conservation in Mexico:
i) protection of biological corridors and identification of priority areas for conservation; ii)
monitoring jaguar populations and its prey; iii) human-jaguar conflict resolution; iv) guide-
lines for translocation and reintroduction of jaguars; v) law and public policy; vi) mitigation of
human infrastructure impact; vii) local community conservation; viii) environmental educa-
tion; and ix) outreach [50,54–56]. They have become the framework for the Mexican govern-
ment´s jaguar conservation program [50,56].
Periodic estimates of jaguar populations are essential to determine the vulnerability of the
species and the structure and effectiveness of conservation policies and activities. We orga-
nized two national jaguar conservation censuses (Cenjaguar, the Spanish acronym) as a com-
ponent of jaguar and its prey population monitoring program: the 2008–2010 period
(hereafter, 2010 [54]) and the other 2016–2018 (hereafter, 2018). The 2010 national census
[50,51,57] provided the baseline data against which other censuses, such as the recently com-
pleted 2018, can be compared. The main issues addressed in the present study are to: i) Esti-
mate Mexico’s current jaguar population size; ii) evaluate its population trends by comparing
the 2010 and 2018 census data; and iii) and identify the effectiveness of the National Jaguar
Conservation Strategy and the long-term prospects of survival of the species in Mexico.
Methods
Records of occurrence
We developed a dataset of jaguar occurrences in Mexico over the past 20 years (1998–2018)
from journal articles, technical reports, theses, books, other documentation, and unpublished
records compiled by specialists from two workshops which included data from track signs,
PLOS ONE Jaguar population trends and conservation in Mexico
PLOS ONE | https://doi.org/10.1371/journal.pone.0255555 October 6, 2021 3 / 22

camera traps, GPS radio telemetry and jaguars killed. Most of the 15,632 records comprising
the dataset came from Oaxaca, Chiapas, and the Yucatan Peninsula region in southern Mexico.
Records in the country are from elevations ranging from sea level to about 3,000 masl (Fig 1).
Camera trap surveys
Camera trap surveys were conducted at 13 sites in 2010 and 11 sites in 2018 (Table 1, Fig 2).
Supplemental site information was gathered from multiple data sources [e.g., 29,54,57,59–63].
Under the Mexican environmental legislation no permit is required when studies are done
with non-intrusive methods such as camera–traps (https://www.gob.mx/semarnat/acciones-y-
programas/tramites-relacionados-al-tema-de-vida-silvestre). Sites were selected based on their
importance as priority regions for jaguar conservation and knowledge that the working groups
had of the areas. We used a standardized jaguar survey protocol designed for the first Cenja-
guar [54,57,64], which facilitated comparison and analyses of similar datasets, and the surveys
were carried out by personnel from multiple entities such as universities and non-governmen-
tal organizations.
The 2010 and 2018 national jaguar censuses were carried out in sampling locations located
across the country and representing all vegetation types where the species is known to occur.
Study sites (state, site, and plant association) for the Cenjaguar 2010 (top) are the following
ones: 1) Sonora: Rosario (dry scrubland and subtropical deciduous forest); 2) Sinaloa: San
Ignacio (tropical deciduous forest); 3) Nayarit: Sierra de Vallejo (tropical dry forest); 4) Guer-
rero: Petatlan (Tropical semideciduous and Pine forests); 5) Oaxaca: Los Chimalapas (tropical
Fig 1. Current geographic range of jaguar (Panthera onca) in Mexico (green, Ceballos et al. 2018 [58]) and records in the last 20 years.
https://doi.org/10.1371/journal.pone.0255555.g001
PLOS ONE Jaguar population trends and conservation in Mexico
PLOS ONE | https://doi.org/10.1371/journal.pone.0255555 October 6, 2021 4 / 22

rain forest); 6) Chiapas: Montes Azules (tropical rain forest); 7) Tamaulipas: Sierra de Tamau-
lipas (tropical semideciduous forest); 8) San Luis Potosı: San Nicolas de los Montes (tropical
semideciduous and Oak forests); 9) Campeche: Calakmul (tropical semigreen forest); 10)
Campeche: 20 de Noviembre (tropical semideciduous forest); 11) Quintana Roo: Caoba (tropi-
cal semigreen forest); 12) Quintana Roo: Noh Bec (tropical semigreen forest), and; 13) Quin-
tana Roo: El Eden (tropical deciduous forest).
The sites for the Cenjaguar 2018 (bottom) included the following ones: 1) Sonora: Sahuaripa
(dry scrubland and subtropical deciduous forest); 2) Sinaloa: Meseta de Cacaxtla (tropical
deciduous forest); 3) Colima: Nevado de Colima (tropical dry forest); 4) Guerrero: Sierra de
Table 1. Summary data and statistics for the 2010 and 2018 jaguar censuses in Mexico.
2010
State Sites Effort Sam
Area
Photos Captures Recaptures Climate Habitat
Sonora Rosario 1020 126 3 2 2 Subtropical Xeric scrublands and topical semideciduous
forest
Sinaloa San Ignacio 837 81 10 3 3 Warm Sub Humid Tropical semideciduous and deciduous forests
Nayarit Sierra de Vallejo 1035 81 12 4 3 Tropical Sub Humid Tropical semideciduous and deciduous forests
Guerrero Petatlan 2010 117 3 1 1 Subtropical Tropical semideciduous and Pine forests
Oaxaca Los Chimalapas 850 99 10 4 2 Tropical Humid Tropical rainforest
Chiapas Montes Azules 935 80 5 3 2 Tropical Humid Tropical rainforest
Tamaulipas Sierra de Tamaulipas 620 90 17 8 4 Subtropical Tropical semideciduous forest
San Luis
Potosı
San Nicolas de los
Montes
837 99 10 3 3 Warm Sub Humid Tropical semideciduous and Oak forests
Campeche Calakmul 810 81 0 0 0 Tropical Sub Humid Tropical semideciduous forest
Campeche 20 de Noviembre 810 81 1 1 1 Tropical Sub Humid Tropical semideciduous forest
Quintana Roo Caoba 800 117 22 5 3 Tropical Sub Humid Tropical semideciduous forest
Quintana Roo Noh Bec 552 90 15 11 3 Tropical Sub Humid Tropical semideciduous forest
Quintana Roo El Eden 802 81 45 6 3 Tropical Semi
Humid
Tropical deciduous and semideciduous forests
2018
State Sites Effort Sam
Area
Photos Captures Recaptures Climate Habitat
Sonora Sahuaripa 1,080 271 3 2 1 Subtropical Xeric scrubland and Topical semideciduous
forest
Sinaloa Cacaxtla 1,440 182 15 9 2 Warm Sub Humid Tropical semideciduous and deciduous forests
Jalisco Nevado de Colima 1,080 182 0 0 0 Tropical Sub Humid Tropical semideciuos, Pine-Oak forests
Guerrero Sierra de Chilpancingo 1,080 255 12 4 2 Subtropical Tropical semideciduous and Pine Forests
Oaxaca Los Chimalapas 1,080 156 10 3 3 Tropical Humid Tropical rainforest
Chiapas Montes Azules 1,608 359 12 4 6 Tropical Humid Tropical rainforest
San Luis
Potosı
Sierra del Abra
Tanchipa
1,080 176 38 6 4 Tropical Sub Humid Tropical deciduous forest
Campeche Calakmul 1,080 186 28 9 6 Tropical Sub Humid Tropical semideciduous forest
Quintana Roo Laguna Om 1,440 248 25 6 3 Tropical Sub Humid Tropical semideciduous and deciduous forests
Quintana Roo El Eden 1,080 142 22 8 3 Tropical Semi
Humid
Tropical deciduous and Semideciduous
forests
Yucatan Punto Put 1,080 405 29 5 3 Tropical Dry Tropical deciduous forest
State: Indicate the state of Mexico, where the sampling sites were located. Sites: Indicate the name of the sampling sites. Simbology are: Effort: Number of trap-nights in
the sample; SamArea: Effective sampling area (km2); Photos: Identifiable jaguar photos; Captures: Number of different jaguars identified; Recaptures: Number of jaguar
photographed more than once. Climate: Indicates the type of climate prevailing in the sampling site; Habitat: Indicate the main vegetation type in the site.
https://doi.org/10.1371/journal.pone.0255555.t001
PLOS ONE Jaguar population trends and conservation in Mexico
PLOS ONE | https://doi.org/10.1371/journal.pone.0255555 October 6, 2021 5 / 22

Chilpancingo (pine-oak forest); 5) Oaxaca: Los Chimalapas (tropical rain forest); 6) Chiapas:
Montes Azules (tropical rain forest); 7) Campeche: Calakmul (tropical semigreen forest); 8)
Quintana Roo: Laguna Om (tropical semigreen forest); 9) Quintana Roo: El Eden (tropical
deciduous forest); 10) Yucatan: Punto Put (tropical deciduous forest), and; 11) San Luis Potosı:
Sierra del Abra-Tanchipa (tropical deciduous forest).
The 2010 survey was carried out from March 2008 to June 2010 and the 2018 survey from
June 2016 to October 2018. In each study site, thirty-six cameras trap were set up across a ~81
km2 study area, in twenty-seven camera trap stations. The sampling cell was determined as the
smallest conservatively estimated home range size for a female in the tropical forest (10 km2;
63, 64) in a given amount of time. The study area was divided into 9 sampling cells, each one
of 9 km2, with two single and one double trap stations, Camera trap stations were strategically
placed 1–2 km apart between each other to ensure complete coverage of the sampling area and
where jaguar signs (e.g., tracks, scats, scrapes) were previously observed on the trails.
The 2010 survey was carried out for 30 days and the 2018 survey for 60 days. However, we
used information for our analysis from only the first 30-day period of the 2018 survey to make
the data collection period comparable to the 2010 survey. The mean effective sampling effort for
each survey was ~800 camera trap days. We used Cuddeback1 passive infra-red system (Non-
Typical Inc., WI, USA) camera-traps Model E1 for the 2010 survey and Model E2 for the 2018
survey. The camera traps were placed 40–50 cm above the ground and at least 3 m off the trail
where we expected jaguars to pass. The cameras remained active 24 hours per day and were
configured to take pictures during 5 seconds with a 1-minute delay between photo events.
Fig 2. The five jaguar conservation regions include all the current geographic range of the species in Mexico and location study sites from the
national jaguar census (CENJAGUAR).
https://doi.org/10.1371/journal.pone.0255555.g002
PLOS ONE Jaguar population trends and conservation in Mexico
PLOS ONE | https://doi.org/10.1371/journal.pone.0255555 October 6, 2021 6 / 22

Density estimates across the priority regions
We used a capture-recapture approach that requires identification of the individuals in the
photos to estimate jaguar populations at each site. In order to minimize bias, experts reviewed
all the photos of jaguars and made the identification based on their distinctive face and coat
markings [65]. Each photo of an individual represented a capture. We compiled a capture his-
tory and generated a matrix where we assigned “1” to indicate the capture or recapture of a
particular individual during the specific sampling episode and “0” to indicate that the individ-
ual was not recorded during the same sampling period [66].
To estimate abundance, we analyzed the capture-recapture history data using CAPTURE
[24,66]. Our a priori hypothesis maintained that the heterogeneity of the capture model (Mh)
was a reasonable representation of the probability of jaguar capture, and the variability of the
capture of individuals would be a better reflection of the demographic status of jaguars in com-
parison to other models available in CAPTURE [23,25,65,66].
In order to estimate jaguar density, we calculated the effective sampling area which
included the area encompassed by the perimeter that was covered by the camera trap stations
plus a buffer width outside this perimeter to include those individuals whose home ranges may
be partially within the sampling area; we used the mean maximum distance moved (MMDM)
to estimate this buffer width [64]. We followed Nichols & Karanth [67] to estimate jaguar den-
sities for the 2018 survey in order to be consistent with the earlier 2010 Cenjaguar survey
[54,57] and Karanth & Nichols [23] to calculate variances in density estimates. All estimates
used from our study and complementary studies included the mean and lower and upper
limits.
Time-calibrated habitat suitability models
To assess jaguar population sizes for each of the two survey periods, we used time-calibrated
habitat suitability models. This approach requires estimates of jaguar range at the specific time
when the population surveys were conducted and pairs the occurrence data gathered over long
periods with corresponding environmental conditions. Model outputs provide robust descrip-
tions of how species select their habitat and reconstruction of habitat dynamics over the time
[68–71].
We use the data compiled for the current jaguar distribution to generate the habitat suit-
ability models and the Maxent version 3.4.1 [72] model to describe time-calibrated habitat
suitability. This machine learning method generally outperforms other ecological niche model
algorithms [73]. Maxent provides an estimate of the probability of distribution of a species
based on the principle of maximum entropy and the assumption that all environmental con-
straints that regulate the species present are included in the model [74].
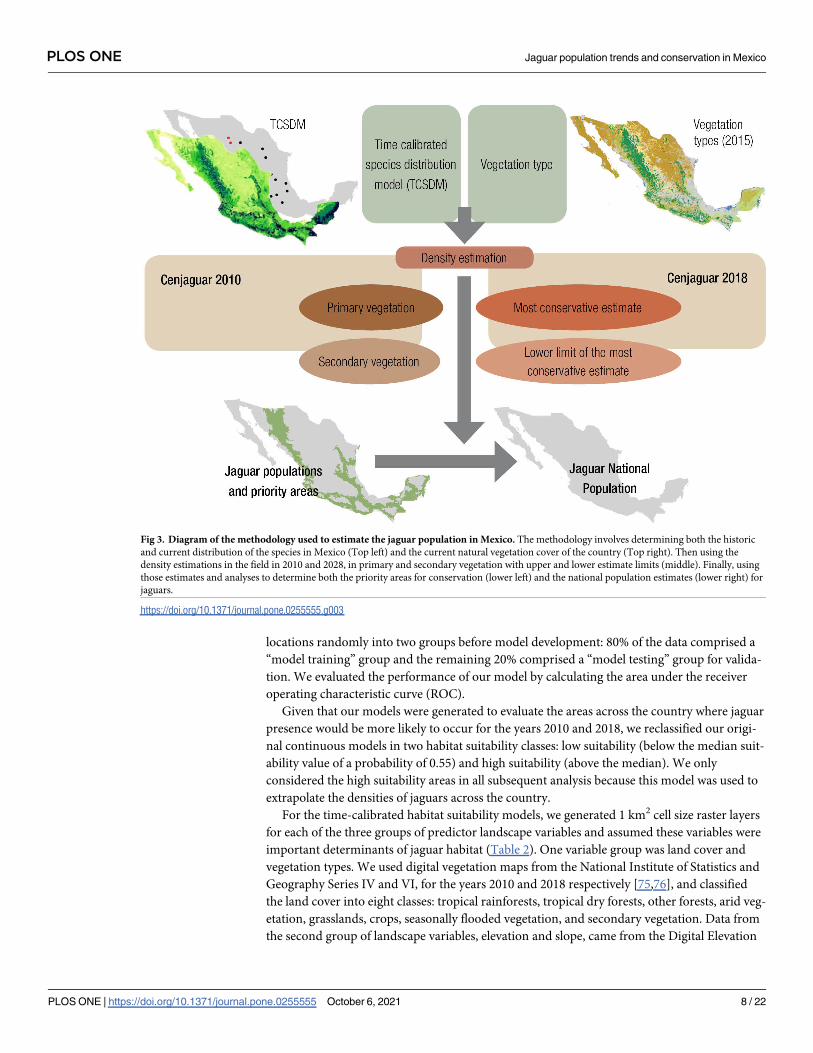
The methodology for our habitat suitability model (Fig 3) was similar to the approach used
by Rodriguez-Soto et al., [49] and we assigned values ranging from 0 (unsuitable habitat) to 1
(optimally suitable habitat). To avoid model over-fitting, we used only quadratic and hinge fea-
tures and a regularization multiplier of 1. We ran 10-fold cross-validation and assessed variable
importance through jackknife estimations.
In order to reduce sampling bias of the 15,632 jaguar records compiled from Mexico, we
applied a spatial filtering algorithm by randomly selecting occurrence records within a radius
of 7.5 km, the radial distance of the average female home range size (180 km2) in southern
Mexico and obtained a total of 622 records for the years 1998–2008 and 149 records for the
years 2010–2018 for the analysis.
We sampled 50,000 random locations across all the country’s territory as background
points and evaluated the predictive performance of our model by dividing the jaguar record
PLOS ONE Jaguar population trends and conservation in Mexico
PLOS ONE | https://doi.org/10.1371/journal.pone.0255555 October 6, 2021 7 / 22
locations randomly into two groups before model development: 80% of the data comprised a
“model training” group and the remaining 20% comprised a “model testing” group for valida-
tion. We evaluated the performance of our model by calculating the area under the receiver
operating characteristic curve (ROC).
Given that our models were generated to evaluate the areas across the country where jaguar
presence would be more likely to occur for the years 2010 and 2018, we reclassified our origi-
nal continuous models in two habitat suitability classes: low suitability (below the median suit-
ability value of a probability of 0.55) and high suitability (above the median). We only
considered the high suitability areas in all subsequent analysis because this model was used to
extrapolate the densities of jaguars across the country.
For the time-calibrated habitat suitability models, we generated 1 km2 cell size raster layers
for each of the three groups of predictor landscape variables and assumed these variables were
important determinants of jaguar habitat (Table 2). One variable group was land cover and
vegetation types. We used digital vegetation maps from the National Institute of Statistics and
Geography Series IV and VI, for the years 2010 and 2018 respectively [75,76], and classified
the land cover into eight classes: tropical rainforests, tropical dry forests, other forests, arid veg-
etation, grasslands, crops, seasonally flooded vegetation, and secondary vegetation. Data from
the second group of landscape variables, elevation and slope, came from the Digital Elevation
Fig 3. Diagram of the methodology used to estimate the jaguar population in Mexico. The methodology involves determining both the historic
and current distribution of the species in Mexico (Top left) and the current natural vegetation cover of the country (Top right). Then using the
density estimations in the field in 2010 and 2028, in primary and secondary vegetation with upper and lower estimate limits (middle). Finally, using
those estimates and analyses to determine both the priority areas for conservation (lower left) and the national population estimates (lower right) for
jaguars.
https://doi.org/10.1371/journal.pone.0255555.g003
PLOS ONE Jaguar population trends and conservation in Mexico
PLOS ONE | https://doi.org/10.1371/journal.pone.0255555 October 6, 2021 8 / 22

Model [77–80]. The third group of landscape variables was related to human infrastructure
and includes density of towns (data for 2000 and 2010), distance to urban zones (data for 2009
and 2018), and distance to paved roads (data for 2008 and 2012; Table 3).
Sensitivity analysis
We ran sensitivity analysis to identify the optimal combination of thresholds for habitat suit-
ability index. For each region, we generated a continuous positive and negative variation of
10% increases and decreases for each type of cover (primary and secondary) and for each
region (given the differences in availability, ecological conditions, and density estimates). We
then used the same extrapolation method for all regions in both years (2010 and 2018) and
built a parametric sensitivity-analysis [81,82] for each year and each type of cover, relating the
proportional change to the estimated population; we used as positive those values equal or
larger than the median of the estimate. We identified the tendency and threshold of variation
change, in terms of percentage changes in the different covers, regarding the significant change
on the estimation. For this, we kept constant the baseline parameters and only the area ratio
Table 2. Predictor variables used for modeling habitat suitability of jaguars in Mexico.
Type Variable name Source Description Expected
effect
Justification
Land cover Tropical
rainforest
INEGI Serie
VI
Areas covered by primary tropical
forests
+ Jaguars are restricted mostly to areas of primary forest
where they find their natural prey and refuge. Jaguars in
Mexico occur in tropical rainforests, tropical dry forests,
oaks and pine forests, and seasonally flooded habitats such
as mangroves. Depict different vegetation types and their
degradation degree by human activities for Mexico. This
dataset also describes other land cover types such as crops,
induced pastures, urbanized area and water.
Tropical dry
forest
INEGI Serie
VI
Areas covered by primary dry forests +
Other forest INEGI Serie
VI
Areas covered by primary oak, pine,
cloud forests
+
Seasonally
flooded
vegetation
INEGI Serie
VI
Areas covered by mangroves, and
wetlands habitat types.
+
Arid vegetation INEGI Serie
VI
Areas covered by arid vegetation such
as xeric scrubland vegetation types.
-
Secondary
vegetation
INEGI Serie
VI
Secondary vegetation of all the
vegetation types.
+ Secondary vegetation class includes all vegetation types
that present some kind of regenerative vegetation as an
arboreal, shrub, and herbaceous.
Crops INEGI Serie
VI
Areas of agriculture across the country -
Grasslands INEGI Serie
VI
Areas associated to pastures for
livestock.
-
Terrain Elevation Digital
Elevation
Model
Elevation ranges across Mexico
generated from a Digital Elevation
Model (1 km) of all the country.
- Jaguar habitat use is affected by different terrain
conditions. Jaguars are frequently associated with lowland
areas. Jaguar occupancy and movements would be
hampered by the mountain ranges at higher altitudes].
Slope Digital
Elevation
Model
Slope values generated from a Digital
Elevation Model (1 km) of all the
country.
-
Human
perturbation
Distance to
urban areas
INEGI The minimum distance to the nearest
urban area
+ Human activity affects habitat use by jaguars negatively
due to disturbance and persecution. Information of urban
areas, towns and roads was obtained from INEGI.Density of
towns
INEGI Density of towns around 7.5 km which
is the radius of the female home range
jaguars in southern Mexico
-
Distance to
paved roads
INEGI The minimum distance to the nearest
paved roads
+
https://doi.org/10.1371/journal.pone.0255555.t002
PLOS ONE Jaguar population trends and conservation in Mexico
PLOS ONE | https://doi.org/10.1371/journal.pone.0255555 October 6, 2021 9 / 22

was altered at a time; these parameters of available vegetation area were altered in incremental
and decremental (0.11) of the proportional area of each vegetation. Projections of estimated
values were compared with those from our baseline estimation by plotting estimation values
against the incremental model from the sensitivity analysis and estimating R2 [81,82]. If vege-
tation available for each region was highly sensitive larger changes were expected for the esti-
mate and lower R2 values.
Extrapolation of jaguar densities
To estimate the jaguar population size in Mexico, we first needed to determine the extent and
location of suitable habitat. Prior studies have shown that jaguars in forested habitats prefer
habitat with good vegetation cover and avoid areas modified by human activities such as agri-
culture, extensive pastures for cattle ranching, paved roads, towns, and so on [34–38]. We
extracted all natural vegetation covers within both habitat suitability models, classified each
cover according to primary and secondary vegetation types and estimated the area under each
type. To estimate the areas, we used vegetation and land cover data layers at a scale of
1:250,000 from the National Institute of Statistics and Geography Series IV and VI [75,76].
Finally, we extrapolated the density estimates obtained by both Cenjaguar and other densities
estimates for the country to the potential habitat for jaguars in Mexico.
The complete methodological process is depicted in Fig 3. In order to be as conservative as
possible and to obtain weighted population numbers, we generated differential estimates for
Table 3. Variable contribution to the habitat suitability models for jaguars in Mexico, as used in Maxent.
Model Variable Percent contribution Permutation importance Observed effect
2010 Elevation 30.2 38.3 -
Arid vegetation 22.1 5 -
Tropical rainforests 9.2 7.3 +
Secondary 8.4 15.4 +
Crops 8.1 2 -
Seasonally flooded vegetation 8 4.5 +
Slope 2.8 4.5 +
Tropical dry forest 2.6 4.8 +
Distance to roads 2.3 5.8 +
Other forests 2.2 7.6 +
Density of towns 2.1 1.9 -
Grasslands 1.2 1 +
Distance to urban areas 0.9 2 +
2018 Arid vegetation 23.7 16.3 -
Elevation 19.8 29.8 -
Tropical rainforests 13.9 3.7 +
Crops 13.5 14.4 -
Grasslands 12 9 -
Slope 6.2 7.9 +
Distance to urban areas 4.6 6.3 +
Density of towns 2.3 4.4 -
Seasonally flooded vegetation 1.1 0.6 +
Distance to roads 1.1 1.9 +
Secondary vegetation 0.9 3.4 -
Other forest 0.9 2.1 +
Dry forest 0.2 0.3 +
https://doi.org/10.1371/journal.pone.0255555.t003
PLOS ONE Jaguar population trends and conservation in Mexico
PLOS ONE | https://doi.org/10.1371/journal.pone.0255555 October 6, 2021 10 / 22

both primary and secondary vegetation (only with shrubby associations) types within the five
conservations regions (Fig 4). Throughout the jaguar geographic range, we defined the follow-
ing five ecogeographic regions for jaguar conservation in terms of the vegetation types and
biogeographic affinities (Fig 5): 1. North Pacific coast (Sonora and Sinaloa); 2. Central Pacific
coast (Nayarit, Jalisco, Colima, Michoacan, State of Mexico, and Morelos); 3. South Pacific
coast (Guerrero, Oaxaca, Chiapas, and Tabasco); 4. Yucatan Peninsula (Campeche, Quintana
Roo, and Yucatan); and 5. North central (Nuevo Leon, Tamaulipas, San Luis Potosı, Quere-
taro, Hidalgo, and Puebla).
We established each density estimate for every jaguar conservation region, and for each
one, we used the lower density estimate (lowest values) to avoid any overestimation and
weighted the number according to the available vegetation type (i.e., primary and secondary).
For areas within each region classified as suitable habitat and primary vegetation, we used the
lowest density estimate and extrapolated the potential number of individuals for the region; for
those areas with suitable habitat but with secondary vegetation, we used the lower limit of the
lowest density estimate and extrapolated the potential number of individuals for the region.
The techniques used in camera trapping can skew density estimates and most jaguar cam-
era trap studies do not satisfy the requirements necessary to produce unbiased estimates and
probably overestimate densities [83,84]. In our case, in order to avoid these biases, we conser-
vatively used the lower limit of the lowest density estimate and applied the previously used
Cenjaguar methodology. Nevertheless, our estimates of population size must be viewed with
caution given that the information has a potential bias when extrapolating these results to dif-
ferent areas that incorporate the jaguar distribution range in Mexico.
Results
Distribution and habitat suitability models
Jaguars are still present in the tropical and subtropical regions of Mexico, from Sonora to Chia-
pas in the Pacific coast, and from Tamaulipas in the East coast to the Yucatan Peninsula in the
Fig 4. Vegetation types and their broad-scale distribution for 2018 and location study sites from CENJAGUAR within jaguar (a). Time-calibrated species distribution
models for 2010 (b) and for 2018 (c) in Mexico.
https://doi.org/10.1371/journal.pone.0255555.g004
PLOS ONE Jaguar population trends and conservation in Mexico
PLOS ONE | https://doi.org/10.1371/journal.pone.0255555 October 6, 2021 11 / 22

PLOS ONE Jaguar population trends and conservation in Mexico
PLOS ONE | https://doi.org/10.1371/journal.pone.0255555 October 6, 2021 12 / 22

south (Fig 1). Jaguars are more likely to be found in areas covered by tropical rain forest, tropi-
cal dry forest, seasonally flooded tropical forests, and mangroves. They are sometimes found
in scrublands, clouds, pine and oak temperate forests adjacent to tropical regions. They are
mostly absent in areas of arid vegetation, grasslands, and urban areas (Table 2). The areas iden-
tified by our models as with high suitability habitat include the coastal areas from Sonora
(Pacific coast) and from Tamaulipas (Gulf coast) in the north of the country to the Yucatan
Peninsula and Chiapas in the south, because they maintain large areas of well-preserved habi-
tat. Furthermore, our model identified the Sierra Madre Oriental and Occidental, and the Bal-
sas River basin as important areas for jaguars.
Our model for the 2010 survey identified ~267,063 km2 of high suitability habitat for jag-
uars in Mexico (roughly 14% of the country), yielding an Area Under the Curve (AUC) value
of 0.85, whereas suitable habitat for the 2018 survey was ~288,890 km2 (14.8% of the country),
yielding an AUC value of 0.87. These net values suggest a gain of ~20,000 km2 (8%) of suitable
habitat for jaguars in the country between the two survey periods, that occurred primarily in
the northern range of their distribution, in the states of Sonora and Sinaloa. In contrast, the
models showed a loss of suitable habitat in the Yucatan Peninsula, one of the strongholds of
jaguar conservation efforts in Mexico. According with our analysis between the 2010–2018
periods, jaguars have lost 19% and 4% of their range in tropical forest and flooded vegetation
respectively, likely due to habitat transformation in southern Mexico. In the other hand, jag-
uars have gained range in dry forests (4%), arid vegetation (41%) and other forests (95%); this
probably due to the increasing of jaguar knowledge in the northern region of Mexico in the
last 10 years and the opportunistically adaptation of jaguars to exploit other suitable habitats.
Density estimates across priority regions
Jaguar densities varied greatly across sites and slightly increased from 2010 to 2018 (Table 4,
Fig 6). Average (±SD) jaguar density across all sampled sites was 2.8±1.2 ind/100 km2 for 2010
and 3.0±1.4 ind/100 km2 for 2018. Jaguar densities were lower in the drier subtropical sites in
northwestern Mexico (e.g., 1.05 ind/100 km2 in Sonora) and higher towards the center of the
country and especially in the Yucatan Peninsula region (e.g., 4.76 ind/100 km2 in El Eden).
Sensitive analysis
In terms of model sensitivity, time-calibrated habitat suitability models showed that variables
such as elevation, arid vegetation and tropical forests showed the most significant contribution
to the overall performance of the model, accounting for 61.5% of the total contribution for
2010, and 57.4% for the 2018 model (Table 3). For both vegetation types in both years, esti-
mates have apparent low sensitivity to changes in the amount of cover (Fig 7); in all cases, sen-
sitivity curves indicate that the thresholds for significant changes in our estimations are above
0.50 in all scenarios. Furthermore, for both cover types in 2018 and secondary vegetation in
2010, R2 values were low (0.05, 0.05 and 0.11, respectively), while primary vegetation in 2010
showed a larger R2 value (0.11) and relatively more significant change.
Fig 5. The five jaguar conservation regions and different vegetation types across current geographic range of the species in
Mexico. The regions are the following ones: (1) Northern Pacific (Sonora and Sinaloa states); (2) Central Pacific coast (Nayarit,
Jalisco, Colima, Michoacan, Mexico, and Morelos states); (3) South Pacific (Guerrero, Oaxaca, and Chiapas states); (4) Yucatan
Peninsula (Yucatan, Campeche, and Quintana Roo states); and (5) Northeast and central Mexico (Tamaulipas, Nuevo Leon, San
Luis Potosi, Queretaro, Puebla and Veracruz states. The vegetation types are as follows: (1) Scrubland (Nortthen Pacific region);
(2) Mangrove (Central Pacific coast); (3) Tropical dry forest (Central Pacific coast region); (4) Temperate cloud forest (South
Pacific region); (5) Tropical semegreen forest (Yucatan Peninsula); (6) Tropical rain forest (South Pacific region; All photos by
Gerardo Ceballos).
https://doi.org/10.1371/journal.pone.0255555.g005
PLOS ONE Jaguar population trends and conservation in Mexico
PLOS ONE | https://doi.org/10.1371/journal.pone.0255555 October 6, 2021 13 / 22

Table 4. Estimates of potential jaguar populations for both censuses relative to vegetation type and available suitable area for each region.
Cenjaguar Region Vegetation type Area in (km2) Estimate Total estimate
2010 1.North Pacific coast Primary 26,606.4 298 437
Secondary 13,931.8 139
2. Central Pacific coast Primary 14,011.2 280 500
Secondary 18,320.5 220
3. South Pacific coast Primary 24,863.3 298 616
Secondary 31,735.8 317
4.Yucatan Peninsula Primary 33,456.7 887 2097
Secondary 80,669.8 1210
5. North central Primary 10,026.1 308 375
Secondary 13,427.8 67
TOTAL 4025±570
2018 1. North Pacific coast Primary 41,488.5 506 644
Secondary 16,784.7 138
2. Central Pacific coast Primary 17,471.5 278 585
Secondary 25,177.3 307
3. South Pacific coast Primary 31,814.0 636 966
Secondary 43,339.5 329
4.Yucatan Peninsula Primary 28,251.8 913 2092
Secondary 55,365.0 1179
5. North central Primary 15,578.0 304 480
Secondary 13,593.0 177
TOTAL 4767±706
https://doi.org/10.1371/journal.pone.0255555.t004
Fig 6. Jaguar population estimates in the 2010 (left bars) and for 2018 (right bars) censuses in Mexico. Suitable habitat
available for 2010 (black line) and 2018 (gray line). Note: The population showed a ~20% increase in that period and
suitable habitat also increased for four of the five regions and overall country.
https://doi.org/10.1371/journal.pone.0255555.g006
PLOS ONE Jaguar population trends and conservation in Mexico
PLOS ONE | https://doi.org/10.1371/journal.pone.0255555 October 6, 2021 14 / 22

Jaguar population size 2010–2018
Interestingly, there was a 20% increase on the average jaguar population estimate in Mexico
between 2010 and 2018. Based on the analysis of the suitable habitat and extrapolations from
jaguar abundance estimates in each survey (2010, 2018) in the five priority regions, we calcu-
lated a total jaguar population in Mexico of 4,025 (±570) in 2010 and 4,766 (±706) in 2018.
The largest estimated numbers of individuals were located in the Yucatan Peninsula in both
surveys, with an estimate of over 2,000 jaguars for the two censuses. The lowest value was in
the northern central region, with estimates of 375 (±233) in 2010 and ~480 (±101) in 2018
(Table 3). Most regions across the country showed a significant increase in the number of
potential individuals (Table 3), and the largest variation in the number of estimated individuals
occurred in the southern Pacific region (Fig 6).
Discussion
This study is the first nation-wide field data-based assessment of jaguar abundance and popu-
lation size in a country throughout its distribution range. It represents an important step for-
ward in the conservation efforts for this species because it establishes a baseline database and
highlights the need and value of large-scale, national population assessments. Similar efforts
for jaguars and other large cats, such as tigers and lions, have been extremely useful in the
guidance of conservation needs and actions [1,24,78,83,85–88].
Our data shows that the jaguar population in Mexico has increased in the past 8–10 years.
This time-period framework represents the evaluation of jaguar conservation status in approx-
imately one jaguar generation length (~ 6.8 years) [32]. The censuses provided critical data
that advanced our understanding of the life history and needs of jaguars and critical guidance
for effective conservation measures. Other studies, based on continent-scale models, have esti-
mated similar population numbers for Mexico. For example, using the same regional popula-
tions as we did, de la Torre et al. [33] estimated a total population of 2,860 jaguars, whereas a
study by Jedrzejewski et al. [89], which used a coarser data set and one that was not specific to
Mexico, estimated a population of 4,343 (3,400±5,383), which approximated to our calculated
number.
Based on the results from the 2010 survey, the National Alliance for Jaguar Conservation in
Mexico (ANCJ; Spanish acronym) defined priority conservation actions to reduce the most
pressing threats to jaguar populations across the country, primarily habitat fragmentation,
Fig 7. Sensitivity analysis of jaguar estimations in relation to changes in primary and secondary vegetation in the (A)
2010 and (B) 2018 censuses in Mexico. The thresholds for significant changes in our estimations are above 0.50 in all
scenarios. This means that our jaguar population density estimations would change only if the vegetation changes
would be over 50%, indicating the robustness of our the thresholds for significant changes in our estimations are above
0.50 in all scenarios analyses.
https://doi.org/10.1371/journal.pone.0255555.g007
PLOS ONE Jaguar population trends and conservation in Mexico
PLOS ONE | https://doi.org/10.1371/journal.pone.0255555 October 6, 2021 15 / 22

road and other infrastructure development, human-wildlife conflicts, inappropriate tourism
development, and poaching [49,50]. While these threats are common throughout the jaguar
range [33], specific and targeted conservation actions in Mexico were designed for each region
under the ANCJ umbrella.
The 2010–2018 increases despite human population growth, expansion of infrastructure,
illegal hunting, and other threats, may be explained by a combination of factors. For example,
there has been an increment in tropical land cover with suitable jaguar habitat, especially in
western Mexico; protection of nature reserves such as biosphere reserves; payment of environ-
mental services to landowners located on jaguar habitat; law enforcement; community-based
conservation and education; and cattle insurance for jaguar predation [39,49,50,90,91]. It is
interesting to note that the Yucatan Peninsula region, which has the largest jaguar population
in Mexico, showed large habitat loss and, as expected, little increase in the population.
Collective and coordinated actions at regional and national scales are required to ensure
sustainable and healthy populations in Mexico. Our results highlight the importance of inte-
grating solid, coordinated science initiatives to inform decision-making for successful conser-
vation [82,92]. More limited, isolated, research and conservation approaches are useful to
focus at regional scales, but are insufficient to develop a national conservation strategy. Such
large-scale strategy is fundamental to try maintaining jaguars in Mexico and any other
country.
The Cenjaguar has identified areas throughout the country which have varying degrees of
isolation and other attributes important for jaguar conservation, the spatial distribution of
their populations, and estimates of their potential sizes, information that is essential to effective
conservation pathways [49–51,81,93,94]. Further refinements and analyses of these and other
potential habitat areas [49] will provide additional useful and realistic evaluations of their con-
servation potential.
Our study shows that focusing on strategic components tackling the most urgent threats for
jaguar survival is fundamental for maintaining the populations. We believe our Cenjaguar
approach, which is collaborative, inclusive, systematic, and at the national scale, offers the best
opportunity to provide high-quality scientific information for jaguar conservation in Mexico
[50,90]. The conservation of such iconic species in Mexico requires further reduction of the
main human-related threats common along the jaguar’s geographic range, such as habitat loss
and hunting [27] and the protection of all the remaining the habitat identified as critical for
the survival of the species.
The permanence of viable jaguar populations in Mexico will crystalize the vision and efforts
of many people involved in jaguar conservation past and present. It will show that the coexis-
tence of jaguars and people is possible if appropriate measures are taken. And it will offer hope
for Mexico, its biological diversity, and its people in the most challenging and dangerous time
that has been faced by humanity.
Supporting information
S1 File.
(XLSX)
Acknowledgments
We would like to express our profound gratitude to all stakeholders involved in this project
and acknowledge the contribution of the scientific community and all the landowners who
supported our efforts by providing logistics and the use of borrowed facilities. We are
PLOS ONE Jaguar population trends and conservation in Mexico
PLOS ONE | https://doi.org/10.1371/journal.pone.0255555 October 6, 2021 16 / 22

extremely grateful to the Alianza WWF-Fundacion Telmex/Telcel for the continuous support
that has made possible and successful our study. We are especially thankful to Marcela Velasco
and Sergio Pathger for their continuous support and encouragement. Our special thanks must
be given to Jesus Pacheco, who provided logistic support and to Dr. Ronald Bjorkland for com-
ments and editing of a previous version of the manuscript.
Author Contributions
Conceptualization: Gerardo Ceballos, Heliot Zarza, Carlos Alcerreca, Marco A. Lazcano-Bar-
rero, Rodrigo A. Medellın.
Data curation: Gerardo Ceballos, Heliot Zarza, J. Antonio de la Torre, Carlos Alcerreca, Hora-
cio V. Barcenas, Gerardo Carreon-Arroyo, Carlos Cruz, Daniela Medellın, Andres Garcıa,
Marco Antonio-Garcıa, Marco A. Lazcano-Barrero, Oscar Moctezuma-Orozco, Fernando
Ruiz, Yamel Rubio.
Formal analysis: Heliot Zarza, Jose F. Gonzalez-Maya, J. Antonio de la Torre, Andres Arias-
Alzate, Cuauhtemoc Chavez, Marco A. Lazcano-Barrero, Victor H. Luja, Erik Joaquın Tor-
res-Romero.
Funding acquisition: Gerardo Ceballos.
Investigation: Gerardo Ceballos, Heliot Zarza, J. Antonio de la Torre, Carlos Alcerreca, Hora-
cio V. Barcenas, Gerardo Carreon-Arroyo, Carlos Cruz, Daniela Medellın, Andres Garcıa,
Marco Antonio-Garcıa, Marco A. Lazcano-Barrero, Rodrigo A. Medellın, Oscar Mocte-
zuma-Orozco, Fernando Ruiz.
Methodology: Gerardo Ceballos, Heliot Zarza, Jose F. Gonzalez-Maya, Cuauhtemoc Chavez,
Marco A. Lazcano-Barrero, Erik Joaquın Torres-Romero.
Project administration: Gerardo Ceballos, Heliot Zarza.
Resources: Victor H. Luja.
Supervision: Gerardo Ceballos, Heliot Zarza.
Validation: Gerardo Ceballos, Heliot Zarza, Jose F. Gonzalez-Maya, Cuauhtemoc Chavez,
Erik Joaquın Torres-Romero.
Visualization: Gerardo Ceballos, Heliot Zarza.
Writing – original draft: Gerardo Ceballos, Heliot Zarza, Jose F. Gonzalez-Maya, J. Antonio
de la Torre, Andres Arias-Alzate, Cuauhtemoc Chavez, Marco Antonio-Garcıa, Marco A.
Lazcano-Barrero, Rodrigo A. Medellın, Oscar Moctezuma-Orozco, Fernando Ruiz, Yamel
Rubio.
Writing – review & editing: Gerardo Ceballos, Heliot Zarza, Jose F. Gonzalez-Maya, J. Anto-
nio de la Torre, Horacio V. Barcenas, Cuauhtemoc Chavez, Carlos Cruz, Daniela Medellın,
Marco A. Lazcano-Barrero, Rodrigo A. Medellın, Oscar Moctezuma-Orozco, Fernando
Ruiz, Victor H. Luja, Erik Joaquın Torres-Romero.
References1. Pimm SL, Jenkins CN, Abell R, Brooks TM, Gittleman JL, Joppa LN, et al. The biodiversity of species
and their rates of extinction, distribution, and protection. Science. 2014, May 30; 344 (6187):1246752.
https://doi.org/10.1126/science.1246752 PMID: 24876501
PLOS ONE Jaguar population trends and conservation in Mexico
PLOS ONE | https://doi.org/10.1371/journal.pone.0255555 October 6, 2021 17 / 22

2. Ceballos G, Ehrlich PR, Dirzo R. Biological annihilation via the ongoing sixth mass extinction signaled
by vertebrate population losses and declines. Proceedings of the National Academy of Sciences. 2017,
Jul 25; 114(30):E6089–96. https://doi.org/10.1073/pnas.1704949114 PMID: 28696295
3. Dirzo R, Young HS, Galetti M, Ceballos G, Isaac NJ, Collen B. Defaunation in the Anthropocene. sci-
ence. 2014 Jul 25; 345(6195):401–6. https://doi.org/10.1126/science.1251817 PMID: 25061202
4. Almond RE. Living planet report-2018: aiming higher. Living planet report-2018: Aiming higher. 2018.
5. Dıaz S, Settele J, Brondızio E, Ngo H, Guèze M, Agard J, et al. Summary for policymakers of the global
assessment report on biodiversity and ecosystem services. Intergovernmental Science-Policy Platform
on Biodiversity and Ecosystem Services. 2019.
6. Cardillo M, Purvis A, Sechrest W, Gittleman JL, Bielby J, Mace GM. Human population density and
extinction risk in the world’s carnivores. PLoS biology. 2004 Jul 13; 2(7):e197. https://doi.org/10.1371/
journal.pbio.0020197 PMID: 15252445
7. Ceballos G, Ehrlich PR, Soberon J, Salazar I, Fay JP. Global mammal conservation: what must we
manage?. Science. 2005 Jul 22; 309(5734):603–7. https://doi.org/10.1126/science.1114015 PMID:
16040704
8. Schipper J, Chanson JS, Chiozza F, Cox NA, Hoffmann M, Katariya V, et al. The status of the world’s
land and marine mammals: diversity, threat, and knowledge. Science. 200 Oct 10; 322(5899):225–30.
https://doi.org/10.1126/science.1165115 PMID: 18845749
9. Inskip C, Zimmermann A. Human-felid conflict: a review of patterns and priorities worldwide. Oryx. 2009
Jan; 43(1):18–34.
10. Loyola RD, Oliveira-Santos LG, Almeida-Neto M, Nogueira DM, Kubota U, Diniz-Filho JA, et al. Inte-
grating economic costs and biological traits into global conservation priorities for carnivores. PloS one.
2009 Aug 27; 4(8):e6807. https://doi.org/10.1371/journal.pone.0006807 PMID: 19710911
11. Karanth KU, Chellam R. Carnivore conservation at the crossroads. Oryx. 2009 Jan; 43(1):1–2.
12. Crooks KR, Burdett CL, Theobald DM, Rondinini C, Boitani L. Global patterns of fragmentation and con-
nectivity of mammalian carnivore habitat. Philosophical Transactions of the Royal Society B: Biological
Sciences. 2011 Sep 27; 366(1578):2642–51. https://doi.org/10.1098/rstb.2011.0120 PMID: 21844043
13. Ripple WJ, Estes JA, Beschta RL, Wilmers CC, Ritchie EG, Hebblewhite M, et al. Status and ecological
effects of the world’s largest carnivores. Science. 2014 Jan 10; 343(6167):1241484. https://doi.org/10.
1126/science.1241484 PMID: 24408439
14. Di Minin E, Slotow R, Hunter LT, Pouzols FM, Toivonen T, Verburg PH, et al. Global priorities for
national carnivore conservation under land use change. Scientific Reports. 2016 Apr 1; 6:23814. https://
doi.org/10.1038/srep23814 PMID: 27034197
15. Ceballos G, Ehrlich PR. Mammal population losses and the extinction crisis. Science. 2002 May 3; 296
(5569):904–7. https://doi.org/10.1126/science.1069349 PMID: 11988573
16. Dalerum F, Cameron EZ, Kunkel K, Somers MJ. Diversity and depletions in continental carnivore guilds:
implications for prioritizing global carnivore conservation. Biology letters. 2008 Oct 7; 5(1):35–8.
17. Bauer H, Chapron G, Nowell K, Henschel P, Funston P, Hunter LT, et al. Lion (Panthera leo) popula-
tions are declining rapidly across Africa, except in intensively managed areas. Proceedings of the
National Academy of Sciences. 2015 Dec 1; 112(48):14894–9. https://doi.org/10.1073/pnas.
1500664112 PMID: 26504235
18. IUCN 2019. The IUCN Red List of Threatened Species. Version 2019–1. https://www.iucnredlist.org.
19. Almond RE. Living planet report-2018: aiming higher. Living planet report-2018: aiming higher. 2018.
20. Singh HS. Dispersion of the Asiatic lion Panthera leo persica and its survival in human-dominated land-
scape outside the Gir forest, Gujarat, India. Current Science. 2017 Mar 10; 112(5):933–40.
21. Ceballos G, Ehrlich PR, Barnosky AD, Garcıa A, Pringle RM, Palmer TM. Accelerated modern human–
induced species losses: Entering the sixth mass extinction. Science advances. 2015 Jun 1; 1(5):
e1400253. https://doi.org/10.1126/sciadv.1400253 PMID: 26601195
22. Jolly GM. Sampling methods for aerial censuses of wildlife populations. East African Agricultural and
Forestry Journal. 1969 Jul 1; 34(sup1):46–9.
23. Karanth KU, Nichols JD. Estimation of tiger densities in India using photographic captures and recap-
tures. Ecology. 1998 Dec; 79(8):2852–62.
24. Karanth KU, Chundawat RS, Nichols JD, Kumar NS. Estimation of tiger densities in the tropical dry for-
ests of Panna, Central India, using photographic capture–recapture sampling. In: Animal Conservation
forum 2004 Aug (Vol. 7, No. 3, pp. 285–290). Cambridge University Press.
25. Maffei L, Cuellar E, Noss A. One thousand jaguars (Panthera onca) in Bolivia’s Chaco? camera trap-
ping in the Kaa-Iya National Park. Journal of Zoology. 2004 Mar; 262(3):295–304.
PLOS ONE Jaguar population trends and conservation in Mexico
PLOS ONE | https://doi.org/10.1371/journal.pone.0255555 October 6, 2021 18 / 22

26. Tobler MW, Carrillo-Percastegui SE, Pitman RL, Mares R, Powell G. An evaluation of camera traps for
inventorying large-and medium-sized terrestrial rainforest mammals. Animal Conservation. 2008 Jun 1;
11(3):169–78.
27. Sanderson EW, Redford KH, Chetkiewicz CL, Medellin RA, Rabinowitz AR, Robinson JG, et al. Plan-
ning to save a species: the jaguar as a model. Conservation Biology. 2002 Feb; 16(1):58–72.
28. Miquelle DG, Smirnov EN, Zaumyslova OY, Soutyrina SV, Johnson DH. Population dynamics of Amur
tigers (Panthera tigris altaica) in Sikhote-Alin Biosphere Zapovednik: 1966–2012. Integrative zoology.
2015 Jul; 10(4):315–28. https://doi.org/10.1111/1749-4877.12141 PMID: 26037543
29. de la Torre JA, Medellın RA. Jaguars Panthera onca in the Greater Lacandona Ecosystem, Chiapas,
Mexico: population estimates and future prospects. Oryx. 2011 Oct; 45(4):546–53.
30. Seymour KL. Panthera onca. Mammalian species. 1989 Oct 26(340):1–9.
31. Medellın RA, de la Torre JA, Zarza H, Chavez C, Ceballos G. El jaguar en el siglo XXI: la perspectiva
continental. Fondo de Cultura Economica; 2016 Sep 29.
32. Quigley H, Foster, R, Petracca L, Payan E, Salom R, Harmsen B. 2019 [cited 1 May 2019] Panthera
onca. The IUCN Red List of Threatened Species: The IUCN Red List of Threatened Species. Version
2019–1. https://www.iucnredlist.org.
33. de la Torre JA, Gonzalez-Maya JF, Zarza H, Ceballos G, Medellın RA. The jaguar’s spots are darker
than they appear: assessing the global conservation status of the jaguar Panthera onca. Oryx. 2018
Apr; 52(2):300–15.
34. Conde DA, Colchero F, Zarza H, Christensen NL Jr, Sexton JO, Manterola C, et al. Sex matters: Model-
ing male and female habitat differences for jaguar conservation. Biological Conservation. 2010 Sep 1;
143(9):1980–8.
35. Haag T, Santos AS, Sana DA, Morato RG, Cullen L Jr, Crawshaw PG Jr, et al. The effect of habitat frag-
mentation on the genetic structure of a top predator: loss of diversity and high differentiation among
remnant populations of Atlantic Forest jaguars (Panthera onca). Molecular Ecology. 2010 Nov; 19
(22):4906–21. https://doi.org/10.1111/j.1365-294X.2010.04856.x PMID: 21040050
36. Colchero F, Conde DA, Manterola C, Chavez C, Rivera A, Ceballos G. Jaguars on the move: modeling
movement to mitigate fragmentation from road expansion in the Mayan Forest. Animal Conservation.
2011 Apr; 14(2):158–66.
37. De Angelo C, Paviolo A, Di Bitetti M. Differential impact of landscape transformation on pumas (Puma
concolor) and jaguars (Panthera onca) in the Upper Parana Atlantic Forest. Diversity and Distributions.
2011 May; 17(3):422–36.
38. Cullen Junior L, Sana DA, Lima F, Abreu KC, Uezu A. Selection of habitat by the jaguar, Panthera onca
(Carnivora: Felidae), in the upper Parana River, Brazil. Zoologia (Curitiba). 2013 Aug; 30(4):379–87.
39. de la Torre JA, Nuñez JM, Medellın RA. Habitat availability and connectivity for jaguars (Panthera onca)
in the Southern Mayan Forest: Conservation priorities for a fragmented landscape. Biological conserva-
tion. 2017 Feb 1; 206:270–82.
40. Mendoza MS, Cun P, Horstman E, Carabajo S, Alava JJ. The last coastal jaguars of Ecuador: Ecology,
conservation and management implications. InBig Cats 2017 Dec 20. IntechOpen.
41. Zimmermann A, Walpole MJ, Leader-Williams N. Cattle ranchers’ attitudes to conflicts with jaguar
Panthera onca in the Pantanal of Brazil. Oryx. 2005 Oct; 39(4):406–12.
42. De Azevedo FC. Food habits and livestock depredation of sympatric jaguars and pumas in the Iguacu
National Park area, south Brazil. Biotropica. 2008 Jul; 40(4):494–500.
43. Silveira L, Boulhosa R, Astete S, Jacomo AT. Management of domestic livestock predation by jaguars
in Brazil. Cat News. 2008; 4:26–30.
44. Conforti VA, de Azevedo FC. Local perceptions of jaguars (Panthera onca) and pumas (Puma concolor)
in the Iguacu National Park area, south Brazil. Biological conservation. 2003 Jun 1; 111(2):215–21.
45. Peña-Mondragon JL, Castillo A, Hoogesteijn A, Martınez-Meyer E. Livestock predation by jaguars
Panthera onca in south-eastern Mexico: the role of local peoples’ practices. Oryx. 2017 Apr; 51(2):254–
62.
46. Tortato FR, Izzo TJ, Hoogesteijn R, Peres CA. The numbers of the beast: Valuation of jaguar (Panthera
onca) tourism and cattle depredation in the Brazilian Pantanal. Global ecology and conservation. 2017
Jul 1; 11: 106–14.
47. Bale R. Where jaguars are ‘killed to order’ for the illegal trade. National Geographic. 2018 Sep 23 [cited
1 May 2019]. In: Wildlife watch [internet]. https://www.nationalgeographic.com/animals/2018/09/
wildlife-watch-news-jaguar-poaching-trafficking-suriname/.
48. Convention on International Trade in Endangered Species of Wild Fauna and Flora, CITES. Jaguar
(Panthera onca), Jaguar Trade. Eighteenth meeting of the Conference of the Parties Colombo (Sri
PLOS ONE Jaguar population trends and conservation in Mexico
PLOS ONE | https://doi.org/10.1371/journal.pone.0255555 October 6, 2021 19 / 22
Lanka), 23 May– 3 June 2019. Available: https://cites.org/sites/default/files/eng/cop/18/doc/E-CoP18-
077-01.pdf).
49. Rodrıguez-Soto C, Monroy-Vilchis O, Maiorano L, Boitani L, Faller JC, Briones MA, et al. Predicting
potential distribution of the jaguar (Panthera onca) in Mexico: identification of priority areas for conser-
vation. Diversity and Distributions. 2011 Mar; 17(2):350–61.
50. Ceballos G, Zarza H, Chavez C, Gonzalez-Maya JF. Ecology and conservation of jaguars in Mexico.
Tropical Conservation: Perspectives on Local and Global Priorities. 2016 Sep 13:273.
51. Chavez C, Zarza H, De la Torre A, Medellın R, Ceballos G. Distribucion y estado de conservacion del
jaguar en Mexico. In: Medellın RA, de la Torre JA, Zarza H, Chavez C, Ceballos G. El jaguar en el siglo
XXI: la perspectiva continental. Fondo de Cultura Economica; 2016 Sep 29.
52. Secretarıa de Medio Ambiente y Recursos Naturales (SEMARNAT). NORMA Oficial Mexicana NOM-
059-SEMARNAT-2010, Proteccion ambiental-Especies nativas de Mexico de flora y fauna silvestres,
Categorıas de riesgo y especificaciones para su inclusion, exclusion o cambio, Lista de especies en
riesgo. Secretarıa de Medio Ambiente y Recursos Naturales, Mexico. 2010. Available: http://dof.gob.
mx/nota_detalle_popup.php?codigo=5173091.
53. Chavez C, Ceballos G. El jaguar mexicano en el siglo XXI: situacion actual y manejo. CONABIO–
UNAM–Alianza WWF Telcel. Mexico DF. 2006.
54. Chavez C, Ceballos G, Medellın R, Zarza H. Primer censo nacional del jaguar. In: Ceballos G, Chavez
C., List R., Zarza H. (editord). 2007:133–41.
55. Desbiez AL, de Paula RC. Species conservation planning: the jaguar National Action Plan for Brazil.
Cat News. 2012; 7: 4–7.
56. Comision Nacional de Areas Naturales Protegias (CONANP), Programa de Accion para la Conserva-
cion de las Especies (PACE): Jaguar(Panthera onca). Comision Nacional de Areas Naturales Protegi-
das, Ciudad de Mexico, Mexico, 2017 Aug. Available: https://www.gob.mx/conanp/documentos/
programa-de-accion-para-la-conservacion-de-la-especie-jaguar-Panthera-onca.
57. Ceballos G, Chavez C, Zarza H. Censo Nacional del Jaguar y sus Presas (1ª Etapa). CONANP, IE-
UNAM, Alianza WWF-TELCEL, TELMEX, CONABIO. Informe Final SNIB-CONABIO Proyecto HE011.
Mexico, DF. 2012.
58. Ceballos G, Zarza H, Cerecedo G, Barrero-Lazcano A, Huerta M, De la torres A, et al. Corredores biolo-
gicos y area prioritarias para la conservacion del jaguar en Mexico. 2018. p. 1–28.
59. Gutierrez-Gonzalez CE, Gomez-Ramırez MA, Lopez-Gonzalez CA. Estimation of the density of the
near threatened jaguar Panthera onca in Sonora, Mexico, using camera trapping and an open popula-
tion model. Oryx. 2012 Jul; 46(3):431–7.
60. Avila-Najera DM, Chavez C, Lazcano-Barrero MA, Perez-Elizalde S, Alcantara-Carbajal JL. Estimacion
poblacional y conservacion de felinos (Carnivora: Felidae) en el norte de Quintana Roo, Mexico.
Revista de Biologıa Tropical. 2015 Sep 1; 63(3):799–813. PMID: 26666134
61. Carrera-Treviño R, Lira-Torres I, Martınez-Garcıa L, Lopez-Hernandez M. El jaguar Panthera onca
(Carnivora: Felidae) en la Reserva de la Biosfera “El Cielo”, Tamaulipas, Mexico. Revista de Biologia
Tropical. 2016 Jul 20; 64(4):1451–68. PMID: 29465909
62. Villarreal SC. Selected ecological patterns and distribution of five sympatric felids in northeastern
Mexico (Doctoral dissertation, Texas A&M University-Kingsville).2016.
63. Coronel-Arellano H, Lara-Dıaz NE, Lopez-Gonzalez CA. Abundancia y densidad de jaguar (Panthera
onca) en el APFF Meseta de Cacaxtla, Sinaloa, Mexico. Acta zoologica mexicana. 2017 Apr; 33
(1):116–9.
64. Chavez C, De la Torre A, Barcenas H, Medellın RA, Zarza H, Ceballos G. Manual de fototrampeo para
estudio de fauna silvestre: el jaguar en Mexico como estudio de caso. Alianza WWF-Telcel, Universi-
dad Nacional Autonoma de Mexico. Ciudad de Mexico, Mexico. 2013.
65. Silver SC, Ostro LE, Marsh LK, Maffei L, Noss AJ, Kelly MJ, et al. The use of camera traps for estimat-
ing jaguar Panthera onca abundance and density using capture/recapture analysis. Oryx. 2004 Apr; 38
(2):148–54.
66. Otis DL, Burnham KP, White GC, Anderson DR. Statistical inference from capture data on closed ani-
mal populations. Wildlife monographs. 1978 Oct 1(62):3–135.
67. Nichols JD, Karanth KU. Statistical concepts: assessing spatial distributions. Center for Wildlife Stud-
ies, Bangalore, Karnataka-560 042, India.
68. Nogues-Bravo D. Predicting the past distribution of species climatic niches. Global Ecology and Bioge-
ography. 2009 Sep; 18(5):521–31.
69. Kuemmerle T, Hickler T, Olofsson J, Schurgers G, Radeloff VC. Reconstructing range dynamics and
range fragmentation of European bison for the last 8000 years. Diversity and Distributions. 2012 Jan 1;
18(1):47–59.
PLOS ONE Jaguar population trends and conservation in Mexico
PLOS ONE | https://doi.org/10.1371/journal.pone.0255555 October 6, 2021 20 / 22

70. Sieber A, Uvarov NV, Baskin LM, Radeloff VC, Bateman BL, Pankov AB, et al. Post-Soviet. Land-use
change effects on large mammals’ habitat in European Russia. Biological Conservation. 2015 Nov 1;
191: 567–76.
71. Romero-Muñoz A, Torres R, Noss AJ, Giordano AJ, Quiroga V, Thompson JJ, et al. Habitat loss and
overhunting synergistically drive the extirpation of jaguars from the Gran Chaco. Diversity and Distribu-
tions. 2019 Feb; 25(2):176–90.
72. Phillips SJ, Anderson RP, Dudık M, Schapire RE, Blair ME. Opening the black box: an open-source
release of Maxent. Ecography. 2017 Jul; 40(7):887–93.
73. Elith J, Phillips SJ, Hastie T, Dudık M, Chee YE, Yates CJ. A statistical explanation of MaxEnt for ecolo-
gists. Diversity and distributions. 2011 Jan 1; 17(1):43–57.
74. Phillips SJ, Anderson RP, Schapire RE. Maximum entropy modeling of species geographic distribu-
tions. Ecological modelling. 2006 Jan 25; 190(3–4):231–59.
75. Instituto Nacional de Estadıstica y Geografıa e Informatica (INEGI). Uso del suelo y vegetacion, escala
1:250000, SERIE IV (continuo nacional)’, escala: 1:250000. Direccion General de Geografıa. Instituto
Nacional de Estadıstica y Geografıa e Informatica. Aguascalientes, Ags., Mexico. 2009: Available.
76. Instituto Nacional de Estadıstica y Geografıa e Informatica (INEGI). Conjunto de Datos Vectoriales de
Uso del Suelo y Vegetacion Escala 1:250,000, SERIE VI. Instituto Nacional de Estadıstica y Geografıa
e Informatica, Mexico. 2016. Available: http://www.conabio.gob.mx/informacion/metadata/gis/
usv250s6gw.xml?_httpcache=yes&_xsl=/db/metadata/xsl/fgdc_html.xsl&_indent=no.
77. Instituto Nacional de Estadıstica y Geografıa e Informatica (INEGI).’Areas Geoestadısticas Munici-
pales, 2010’, escala: 1:250000. Instituto Nacional de Estadıstica y Geografıa e Informatica. Aguasca-
lientes, Ags., Mexico. 2010: Available: http://www.conabio.gob.mx/informacion/metadata/gis/
municipios_igw.xml?_httpcache=yes&_xsl=/db/metadata/xsl/fgdc_html.xsl&_indent=no.
78. CONABIO. ’Division polıtica estatal 1:250000. 2010’, escala: 1:250000. Comision Nacional para el Con-
ocimento y Uso de la Biodiversidad. Version 4. Modificado de Conjunto de Datos vectoriales y toponi-
mia de la carta topografica. Serie III. Instituto Nacional de Estadıstica, Geografıa e Informatica (2003–
2004). Y Areas Geoestadısticas Estatales, del Marco Geoestadıstico 2010 version 5.0. Instituto Nacio-
nal de Estadıstica y Geografıa. Escala 1:250000. Mexico. 2011. Available: http://www.conabio.gob.mx/
informacion/metadata/gis/dest_2010gw.xml?_httpcache=yes&_xsl=/db/metadata/xsl/fgdc_html.xsl&_
indent=no.
79. INEGI. ’Area geoestadıstica basica urbana, censo 2015.’, escala: 1:250 000. edicion: 2015. Instituto
Nacional de Estadıstica y Geografıa. Obtenido de Cartografıa geoestadıstica urbana y rural amanza-
nada. Cierre de la Encuesta Intercensal 2015. Aguascalientes, Mexico. 2016. Available: http://www.
conabio.gob.mx/informacion/metadata/gis/agebur15gw.xml?_httpcache=yes&_xsl=/db/metadata/xsl/
fgdc_html.xsl&_indent=no.
80. Maderey-R, L. E. y Torres-Ruata, C. ’Hidrografıa’. Extraido de Hidrografıa e hidrometrıa, IV.6.1 (A).
Atlas Nacional de Mexico. Vol. II. Escala 1: 4000000. Instituto de Geografıa, UNAM. Mexico. 1990.
Available: http://www.conabio.gob.mx/informacion/gis/.
81. Carrillo L, Ceballos G, Chavez C, Cornejo J, Faller JC, List R, et al. Population and habitat viability
assessment of jaguars in Mexico. Pp. Jaguar conservation and management in Mexico: Case studies
and perspectives. 2011:189–226.
82. Taylor S, Kumar L. Sensitivity analysis of CLIMEX parameters in modelling potential distribution of Lan-
tana camara L. PLoS One. 2012; 7(7):e40969. Epub 2012/07/21. https://doi.org/10.1371/journal.pone.
0040969 PMID: 22815881; PubMed Central PMCID: PMC3398004.
83. Tobler MW, Powell GV. Estimating jaguar densities with camera traps: problems with current designs
and recommendations for future studies. Biological conservation. 2013 Mar 1; 159:109–18.
84. Foster RJ, Harmsen BJ. A critique of density estimation from camera-trap data. The Journal of Wildlife
Management. 2012 Feb; 76(2):224–36.
85. Harmsen BJ, Foster RJ, Sanchez E, Gutierrez-Gonzalez CE, Silver SC, Ostro LE, et al. Long term mon-
itoring of jaguars in the Cockscomb Basin Wildlife Sanctuary, Belize; Implications for camera trap stud-
ies of carnivores. PloS one. 2017 Jun 28; 12(6): e0179505. https://doi.org/10.1371/journal.pone.
0179505 PMID: 28658274
86. Desbiez AL, Traylor-Holzer KA, Lacy B, Beisiegel BM, Breitenmoser-Wursten CH, Sana DA, et al. Pop-
ulation viability analysis of jaguar populations in Brazil. Cat News. 2012; 7:35–7.
87. Wang T., Feng L., Mou P. et al. Amur tigers and leopards returning to China: direct evidence and a land-
scape conservation plan. Landscape Ecology 2016, 31:491–503. https://doi.org/10.1007/s10980-015-
0278-1.
88. Saavedra-Mendoza M, Cun P, Horstman E, Carabajo S. Alava JJ. 2017. The Last Coastal Jaguars of
Ecuador: Ecology, Conservation and Management Implications. pp.1–21. In: Shrivastav A.B., Singh K.
P. (Eds.). Big Cats. IntechOpen. Croatia.
PLOS ONE Jaguar population trends and conservation in Mexico
PLOS ONE | https://doi.org/10.1371/journal.pone.0255555 October 6, 2021 21 / 22

89. Jędrzejewski W, Robinson HS, Abarca M, Zeller KA, Velasquez G, Paemelaere EA, et al. Estimating
large carnivore populations at global scale based on spatial predictions of density and distribution–
Application to the jaguar (Panthera onca). PloS one. 2018 Mar 26; 13(3): e0194719. https://doi.org/10.
1371/journal.pone.0194719 PMID: 29579129
90. Wikramanayake E, McKNIGHT ME, Dinerstein E, Joshi A, Gurung B, Smith D. Designing a conserva-
tion landscape for tigers in human-dominated environments. Conservation Biology. 2004 Jun; 18
(3):839–44.
91. Koprowski JL, Gonzalez-Maya JF, Zarrate-Charry DA, Spencer C. Local Approaches and Community-
Based Conservation. In: Koprowski JL, Krausman PR, editors. International Wildlife Management: Con-
servation Challenges in a Changing World. Baltimore, MD, USA: Johns Hopkins University Press;
2019. p. 198–207.
92. Ceballos G, Zarza H, Gonzalez-Maya JF. El potencial del jaguar como especie sustituta en la conserva-
cion de ecosistemas tropicales. Bioindicadores: Guardianes de nuestro futuro ambiental. Chiapas: El
Colegio de la Frontera Sur, Instituto Nacional de Ecologıa y Cambio Climatico. 2015:503–20.
93. Zarza H, Chavez C, Ceballos G, Castaño-Uribe C, Gonzalez-Maya JF, Zarrate-Charry D, et al. Impor-
tancia de las iniciativas regionales para la consolidacion de una estrategia nacional de conservacion de
jaguar: el caso de Mexico. El Plan de Conservacion de Felinos del Caribe colombiano: Los felinos y su
papel en la planificacion regional integral basada en especies clave. 2013:191–201.
94. EPA (US Environmental Protection Agency). Guidance on the Development, Evaluation, and Applica-
tion of Environmental Models. Washington DC, USA: Council for Regulatory Environmental Modeling,
U.S. Environmental Protection Agency 2009 Contract No.: EPA/100/K-09/003.
PLOS ONE Jaguar population trends and conservation in Mexico
PLOS ONE | https://doi.org/10.1371/journal.pone.0255555 October 6, 2021 22 / 22