Embed Size (px)
Citation preview

BFC 32302 : TRAFFIC ENGINEERING AND SAFETY
LECTURER : DR. KAMARUDIN B. AMBAK
ROOM : NORTH TOWER, LEVEL 4, NO. 9
PHONE (O) : 07 4564379
EMAIL : [email protected]

"Highway" and "Traffic"
Engineering ?

COURSE CONTENT
Chapter 1: Traffic Flow
Chapter 2: Highway Capacity
Chapter 3: Traffic Management and Control
Chapter 4: Intersection Design
Chapter 5: Traffic Safety

CHAPTER 1 : Traffic Studies
Consist of:
Traffic Data Collection and Measurement
Volume, speed, travel time and delay
Fundamental on traffic flow theory

TRAFFIC VOLUME STUDY Traffic volume is defined as the number of
vehicles passing a given point during a specified period of time or the number of vehicles that passes over a given section of a lane.
CHAPTER 1: Traffic Studies
It is important in traffic planning, operation, design and research. Important of understanding: - the efficiency at which the system works at present - the general quality of service offered to the road users

Traffic volume is also an important parameter in the design of road pavements,where traffic volume is converted into standard axle loads, which determines the pavement thickness and its load bearing ability.
Two methods are available for conducting traffic volume counts: (1) Manual count method (2) Automatic count method
CHAPTER 1: Traffic Studies

CHAPTER 1: Traffic Studies
Manual counts are typically used to gather data for determination of: - vehicle classification - turning movements - direction of travel - pedestrian movements - vehicle occupancy
Automatic counts are typically used to gather data for determination of: -vehicle hourly patterns -daily or seasonal variations and growth trends -annual traffic estimates

CHAPTER 1: Traffic Studies
The selection of study method should be determined using the count period by time of day, day of month, and month of year for the study area. Typical count periods are 15 minutes or 2 hours for peak periods, 4 hours for morning and afternoon peaks, 6 hours for morning, midday, and afternoon peaks, and 12 hours for daytime periods (Robertson, 1994).

MANUAL COUNT METHOD
Require small samples of data at any given location.
Normal intervals for a manual count are 5, 10, or 15 minutes.
Manual Count Recording Methods: tally sheets, mechanical counting boards, or electronic counting boards.
CHAPTER 1: Traffic Studies

CHAPTER 1: Traffic Studies
Manual Count Method: Tally Sheets
Figure 1 Example of Manual Count using Tally Sheet
*A watch or stopwatch is necessary to measure the desired count interval.

CHAPTER 1: Traffic Studies
Manual Count Method: Mechanical Counting Boards
Figure 2: Mechanical Counting Board
Common counts include pedestrian, bicycle, vehicle classification, and traffic volume counts.

CHAPTER 1: Traffic Studies
Manual Count Method: Electronic Counting Board
Figure 3: Electronic Counting Board
Electronic counting boards are battery-operated, hand-held devices used in collecting traffic count data. They have an internal clock that automatically separates the data by time interval.

AUTOMATIC COUNT METHOD
The automatic count method provides a means for gathering large amounts of traffic data.
Automatic counts are usually taken in 1-hour intervals for each 24-hour period.
Automatic counts are recorded using one of three methods: portable counters, permanent counters, and videotape.
CHAPTER 1: Traffic Studies

CHAPTER 1: Traffic Studies
Automatic Count Method: Portable Counters
Figure 4: Pneumatic Road Tube and Recorder
Portable counters serve the same purpose as manual counts but with automatic counting equipment. The period of data collection using this method is usually longer than when using manual counts. Additional data collection: Speed, Classification and Gap of Vehicles.

Permanent counters are used when long-term counts are to be conducted.
The data collected may be used to monitor and
evaluate traffic volumes and trends over a long period of time.
Permanent counters are not a cost-effective
option in most situations. Few jurisdictions have access to this
equipment.
CHAPTER 1: Traffic Studies
Automatic Count Method: Permanent Counters

Observers can record count data by videotaping traffic.
Traffic volumes can be counted by viewing videotapes recorded with a camera at a collection site.
A digital clock in the video image can prove useful in noting time intervals.
Videotaping is not a cost-effective option in most situations.
CHAPTER 1: Traffic Studies
Automatic Count Method: Videotape

EXAMPLES OF TRAFFIC VOLUME COUNT STUDIES
CHAPTER 1: Traffic Studies
INTERSECTION COUNTS Intersection counts are used for timing traffic signals, designing channelization,planning turn prohibitions, computing capacity, analyzing high crash, intersections, and evaluating congestion.
PEDESTRIAN COUNTS Pedestrian count data are used frequently in planning applications. Pedestrian counts are used to evaluate sidewalk and crosswalk needs, to justify pedestrian signals, and to time traffic signals.

CHAPTER 1: Traffic Studies
VEHICLE CLASSIFICATION COUNTS Vehicle classification counts are used in establishing structural and geometric design criteria, computing expected highway user revenue, and computing capacity. Typically cars, station wagons, pickup and panel trucks, and motorcycles are classified as passenger cars.
AVERAGE DAILY TRAFFIC AND ANNUAL AVERAGE DAILY TRAFFIC COUNTS Average daily traffic (ADT) counts represent a 24-hour count at any specified location. These counts are obtained by placing an automatic counter at the analysis location for a 24-hour period. Annual average daily traffic (AADT) counts represent the average 24-hour traffic volume at a given location averaged over a full 365-day year.

SPEED STUDY

SPOT SPEED STUDY
A spot speed study is“a study of speed of traffic
at one point or spot on a trafficway. It consists of
a series or a sample, of observations of the
individual speeds at which vehicles are
approaching an intersection or passing a point at
a non-intersection location. These observations
are used to estimate the speed distribution of the
entire traffic stream at that location, under the
conditions prevailing at the time of the study.”
CHAPTER 1: Traffic Studies

Spot speed studies can be carried out at the
following locations:
Trend locations
- straight, level, open sections of rural highways
- midblock locations on urban streets
Problem locations for specific purposes
- high accident frequency locations
- at points where the installation of traffic signals and traffic signs is contemplated
Representative locations for basic data surveys
Locations where before-and-after studies are being conducted
CHAPTER 1: Traffic Studies
CHAPTER 1: Traffic Studies
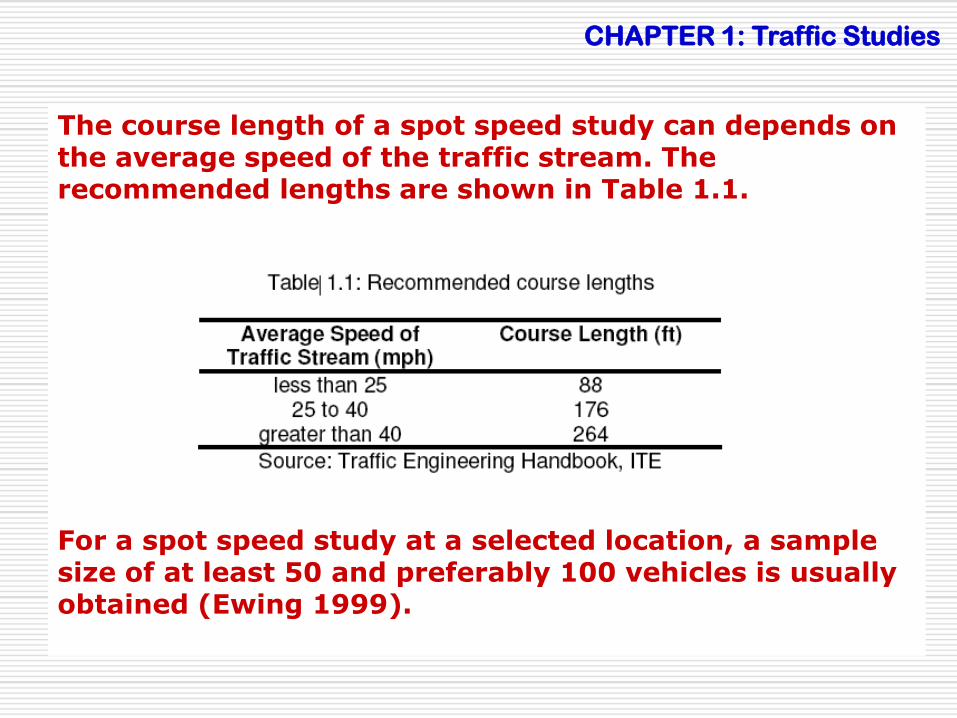
The course length of a spot speed study can depends on the average speed of the traffic stream. The recommended lengths are shown in Table 1.1. For a spot speed study at a selected location, a sample size of at least 50 and preferably 100 vehicles is usually obtained (Ewing 1999).

Applications of Spot Speed Data:
1. For trends in operating speeds of different vehicle types, which are obtained from data collected through periodic sampling at selected locations
2. For speeds at problem locations, to determine whether speeds are too high and if complaints received are justified
3. For traffic operation (regulation and control)
4. For accident analysis, to determine the relationship of speed to accidents which may help in developing corrective measures
5. For before-and-after studies, to evaluate the effect of some change in controls or conditions
6. For geometrical design features
CHAPTER 1: Traffic Studies

Applications of Spot Speed Data:…cont’d
7. To evaluate capacity in relation to desired speeds.
8. As aid to enforcement; determine the effect of speed control measures & measure the effectiveness of changes in enforcement programs
9. Research studies Spot speed data are gathered using one of three
methods: (i) stopwatch method (ii) radar/laser meter method (iii) pneumatic road tube method
CHAPTER 1: Traffic Studies

Method to collecting data
STOPWATCH METHOD
The stopwatch method can be used to successfully complete a spot speed study using a small sample size taken over a relatively short period of time.
Key Steps to a Stopwatch Spot Speed Study
1. Obtain appropriate study length.
2. Select proper location and layout.
3. Record observations on stopwatch spot speed study data form.
4. Calculate vehicle speeds.
5. Generate frequency distribution table and determine speed percentiles.
CHAPTER 1: Traffic Studies

STOPWATCH METHOD
CHAPTER 1: Traffic Studies
Figure 5: Stopwatch Spot Speed Study Layout

RADAR/LASER METER METHOD
A radar/laser meter is a commonly used device for directly measuring speeds in spot speed studies. This device may be hand-held, mounted in a vehicle, or mounted on a tripod. The effective measuring distance for radar meters ranges from 200 feet up to 2 miles.
CHAPTER 1: Traffic Studies
Method to collecting data
Radar Gun Laser Laser

RADAR METER METHOD
Key Steps to a Radar Meter Spot Speed Study
1. Select proper location and placement of radar meter.
2. Determine an appropriate selection strategy.
3. Record observations on radar meter spot speed study data form.
4. Generate frequency distribution table and determine speed percentiles.
CHAPTER 1: Traffic Studies

CHAPTER 1: Traffic Studies
Figure 6 Radar Meter Spot Speed Study Layout

Minimize cosine error by keeping angle
<7o on freeways, <9o on urban streets
CHAPTER 1: Traffic Studies

CHAPTER 1: Traffic Studies
Method to collecting data
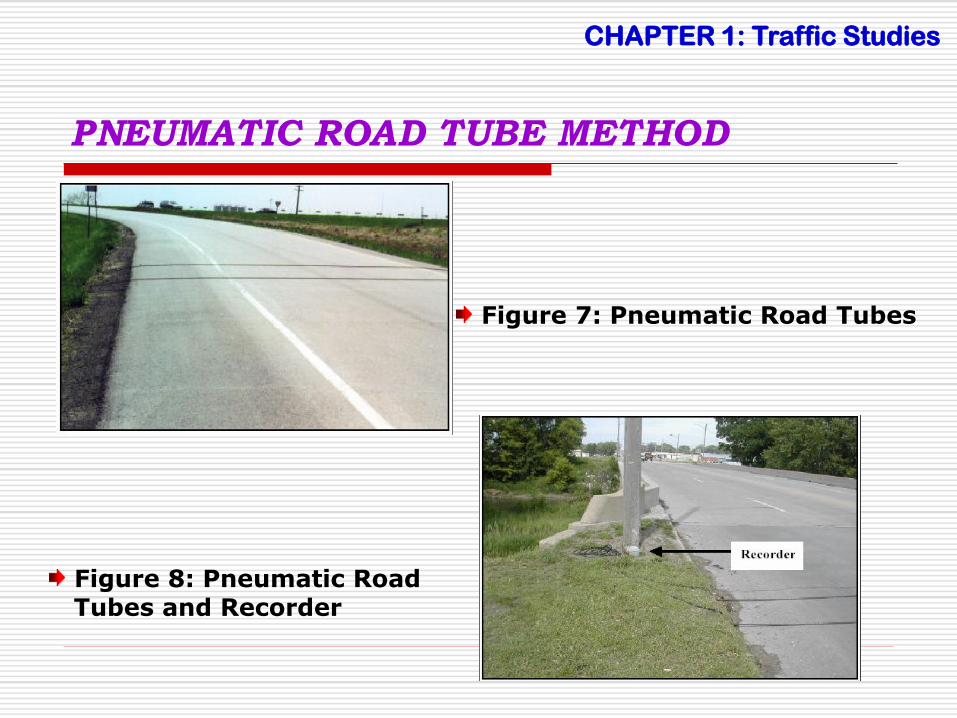
PNEUMATIC ROAD TUBE METHOD
The pneumatic road tube method is normally used for longer data collection time periods than those of either the stopwatch or radar meter method. Using this method, pneumatic tubes are placed in the travel lanes and are connected to recorders located at the side of the road.
PNEUMATIC ROAD TUBE METHOD
CHAPTER 1: Traffic Studies
Figure 7: Pneumatic Road Tubes
Figure 8: Pneumatic Road Tubes and Recorder

CHAPTER 1: Traffic Studies
PNEUMATIC ROAD TUBE METHOD
Key Steps to a Pneumatic Road Tube Spot Speed Study A pneumatic road tube spot speed study includes four key steps (Robertson 1994): 1. Perform necessary office preparations. 2. Deploy and calibrate data collection equipment. 3. Check data and retrieve equipment. 4. Generate frequency distribution table and determine speed percentiles.