Embed Size (px)
Citation preview

Statistical Approaches to Assessthe Association between PhenolicCompounds and the in vitroAntioxidant Activity of Camelliasinensis and Ilex paraguariensis Teas
CAMILA CARDOSO DE OLIVEIRA,1 VERONICAMARIA DE ARA�UJO CALADO,2
and GAST�ON ARES,3 DANIEL GRANATO4
1Instituto Adolfo Lutz– N�ucleo de An�alise e Tratamento de Dados—Av. Dr. Arnaldo, 355, 01246-902, S~ao Paulo,Brazil2Universidade Federal do Rio de Janeiro—Escola de QuOmica, Rio de Janeiro, Brazil3Universidad de la Rep�ublica—Departamento de Ciencia y Tecnologia de Alimentos—Gral. Flores 2124,
Montevideo, Uruguay4State University of Ponta Grossa, Department of Food Engineering - Av. Carlos Cavalcanti,
Tea presents a diverse phenolic composition which is responsible for its alleged biological activities, including the in vivo
and in vitro antioxidant capacity. It is very usual to find researches applying statistical methods, such as analysis of
variances (ANOVA) and linear Pearson correlation coefficients to analyze the strength of correlation between phenolic
composition and the in vitro antioxidant activity of teas from Camellia sinensis (green, black, white, oolong, red, and
yellow teas) and Ilex paraguariensis (Yerba-mate), which are the most produced and consumed types of teas. However,
evidence has shown that these approaches are not as suitable as multivariate statistical methods once they do not depict
nor show association among all results and variables simultaneously, making it difficult to understand clearly the data
structure and patterns. Then, the objective of this work is to review and explain some univariate/bivariate and multivariate
statistical techniques used to assess the association between phenolic compounds and the in vitro antioxidant activity of
green, white, black, red, yellow, oolong and Yerba-mate teas. Moreover, this paper provides an overview on some assays
used to estimate the in vitro antioxidant capacity of teas.
Keywords Correlation analysis, chemometrics, flavonoids, cluster analysis, PCA, Yerba-mate
INTRODUCTION
Recent epidemiological studies have shown that some age-
related diseases occur because of the oxidation of cells origi-
nated from the reaction between cell components and free rad-
icals/reactive species. Antioxidant compounds may be an
effective protection of body cells by scavenging these reactive
species or chelating pro-oxidant metals, such as iron and cop-
per (Halliwell and Gutteridge, 2006). Once there is a constant
formation of nitrogen, carbon, and oxygen reactive species on
account of aerobic metabolism, the cells tend to respond to the
oxidation promoted by such reactive species by increasing the
activity of some endogenous antioxidant enzymes, namely cat-
alase, glutathione peroxidase, and superoxide dismutase (Xu
et al., 2012). In many cases, this endogenous protection may
not be sufficient to buffer the free radicals and other reactive
species produced in the body. Hence, the consumption of
foods rich in antioxidant compounds, such as red wines, fruit
juices, and teas, should be included in the regular diet.
Tea, the most widely consumed beverage aside from
water, is an infusion prepared from dried leaves of many spe-
cies such as Camellia sinensis O. Kuntze (Theaceae) and
Ilex paraguariensis (Aquifoliaceae), and has been consid-
ered a source of health-promoting phenolic compounds
(Moderno et al., 2009). Tea has a worldwide per capita
Address correspondence to Daniel Granato, Department of Food Engineer-ing, State University of Ponta Grossa, 4748, 84030-900, Ponta Grossa, PR,E-mail: [email protected] or [email protected]
Color versions of one or more of the figures in the article can be found
online at www.tandfonline.com/bfsn
Critical Reviews in Food Science and Nutrition, 55:1456–1473 (2015)
Copyright cO Taylor and Francis Group, LLC
ISSN: 1040-8398 / 1549-7852 online
DOI: 10.1080/10408398.2012.750233
1456

consumption of approximately 40 L per year and three types
of tea are predominantly manufactured: black, green, and
oolong tea (Steele et al., 2000). However, Yerba-mate tea,
an infusion made from the leaves of Ilex paraguariensis
widely consumed in South America (especially in Uruguay,
Brazil, Argentina, and Paraguay) is gaining a rapid introduc-
tion into the world market, including the United States of
America and many countries in Europe, not only due to its
health-promoting benefits but also because of its sensory
properties (Heck & de Mejia, 2007).
Several in vitro and clinical protocols have suggested that
different types of teas may exert cancer protective effects on
humans. For example, Steele et al. (2000) concluded that
extracts from black and green teas successfully inhibited neo-
plastic transformation in mouse mammary organ cultures, rat
tracheal epithelial cells, and human lung tumor epithelial cells,
thus showing strong evidences of antimutagenic, antiprolifera-
tive, and antineoplastic. Carvalho et al. (2010) found that
green tea extract strongly inhibited the growth of renal carci-
noma cell lines, corroborating the fact that green tea is an
effective anticancer beverage. Ramirez-Mares et al. (2004)
verified that Yerba-mate tea inhibited 65% of human antito-
poisomerase II activity, whereas this inhibition was about 15%
for green tea. De Mejia et al. (2005) verified that the consump-
tion of Yerba-mate extracts at concentrations higher than
375 mg extract/mL inhibited the growth of oral cell carci-
noma. Therefore, teas from C. sinensis and I. paraguariensis
are suitable alternatives for consumers interested in phenolics
health benefits.
It is widely accepted that phenolic compounds present a
considerable antioxidant capacity both in in vivo and in vitro
protocols, and the correlation analysis between variables is
usually carried out by basic statistical techniques, such as the
Pearson linear correlations (Bert�e et al., 2011). However, mul-
tivariate unsupervised statistical techniques, such as Principal
Component Analysis (PCA) and Hierarchical Cluster Analysis
(HCA), also seem to be suitable techniques to assess the asso-
ciation among individual and total phenolic compounds and
the antioxidant capacity of beverages such as teas and wine,
once by using these approaches it is possible to compare all
results simultaneously, highlighting the similarity and associa-
tion among samples and experimental techniques (Deetae
et al., 2012; Macedo et al., 2012; Pekal et al., 2012). Indeed,
Table 1 shows a summary of some statistical approaches used
in Food Science and Technology.
Based on these considerations and taking into account that
there is an increasing number of publications regarding the
antioxidant capacity of teas, juices, beers, and other beverages,
the objective of this work is to review and explain some statis-
tical techniques used to assess the association between pheno-
lic compounds and the antioxidant activity of green, white,
black, red, yellow, and oolong (Camellia sinensis) and Yerba-
mate (Ilex paraguariensis) teas. Moreover, this paper provides
an overview on four assays widely used to estimate the in vitro
antioxidant capacity of teas.
Some Insights Regarding C. sinensis and Yerba-Mate Teas
More than half of the total world’s tea production is con-
sumed in the countries where it is produced, which is the case
of India, the world’s largest producer of tea and the world’s
biggest consumer. Whereas tea is the most common beverage
for 2/3 of the world’s growing population, there is a great
potential for an increasing demand. In accordance with Wu
and Wei (2002), around 78% of the total amount of tea pro-
duced and consumed in the world is black tea, while around
20% is composed by green tea and less than 2% is oolong tea.
According to Mejıa et al. (2010), the size of the tea market
reached up to $6.8 billion in 2005, while in 2010, about
4.1 million tons of different types of tea were produced world-
wide. The demand for green tea has increased and its market is
estimated to grow with a compound annual growth rate of
more than 10% in the next five years. In Germany, for exam-
ple, the average consumption of tea is around 26 L per capita
per year, and the most consumed teas are black and green teas
(Deutscher Teeverband, 2011). In Brazil, the most consumed
types of tea are Yerba-mate, followed by black and green teas.
Overall, the five countries that consume a greater quantity (kg/
person/year) of tea are United Kindom, Ireland, New Zealand,
Japan, and Australia (NationMaster, 2012).
One possible reason to the growth of the tea market is the
increased awareness of the health-promoting effects from bio-
active phenolic compounds, such as anticholesterolemic
(Chen et al., 2001), anticancer (Kuroda and Hara, 1999), anti-
inflammatory (Bacquer et al., 2006), hepatoprotective (Xu
et al., 2012), antimutagenic (Yen and Chen, 1994), antiather-
osclerotic activities (Kawai et al., 2008), and also by reducing
the blood pressure and improving parameters related to insu-
lin resistance (Bogdanski et al., 2012), reducing the risk of
developing Parkinson’s disease (Prakash and Tan, 2011), and
also by improving the plasma antioxidant activity in healthy
fasted subjects (Silva et al., 2008). Other clinical, in vitro, in
vivo, and epidemiological evidences of functionality of teas
against malignancies have been extensively revised by Tij-
burg et al. (1997), Higdon and Frei (2003), Butt and Sultan
(2009), and Huang et al. (2013). These beneficial effects are
believed to be mainly due to the antioxidant activity attribut-
able to phenolic compounds, especially flavonoids and pheno-
lic acids.
During the commercial production, leaves of Camellia
sinensis undergo different degrees of processing, giving rise to
various types of teas (Carter et al., 2007). In accordance with
Kim et al. (2011), the infusions came from the genus Camellia
can be divided into three categories based on the fermentation
process: green tea (unfermented), oolong tea (partially fer-
mented), and black tea (fully fermented). Herein, the aerial
parts of Yerba-mate (I. paraguariensis) are used to prepare a
tea-like beverage, the so called mate. In accordance with Filip
et al. (2000), mate-based beverages may be prepared by two
different ways: (i) by the simple addition of boiling water to
the dry plant material; (ii) by repeated additions of close to
ANTIOXIDANT ACTIVITY OF CAMELLIA SINENSIS AND ILEX PARAGUARIENSIS TEAS 1457
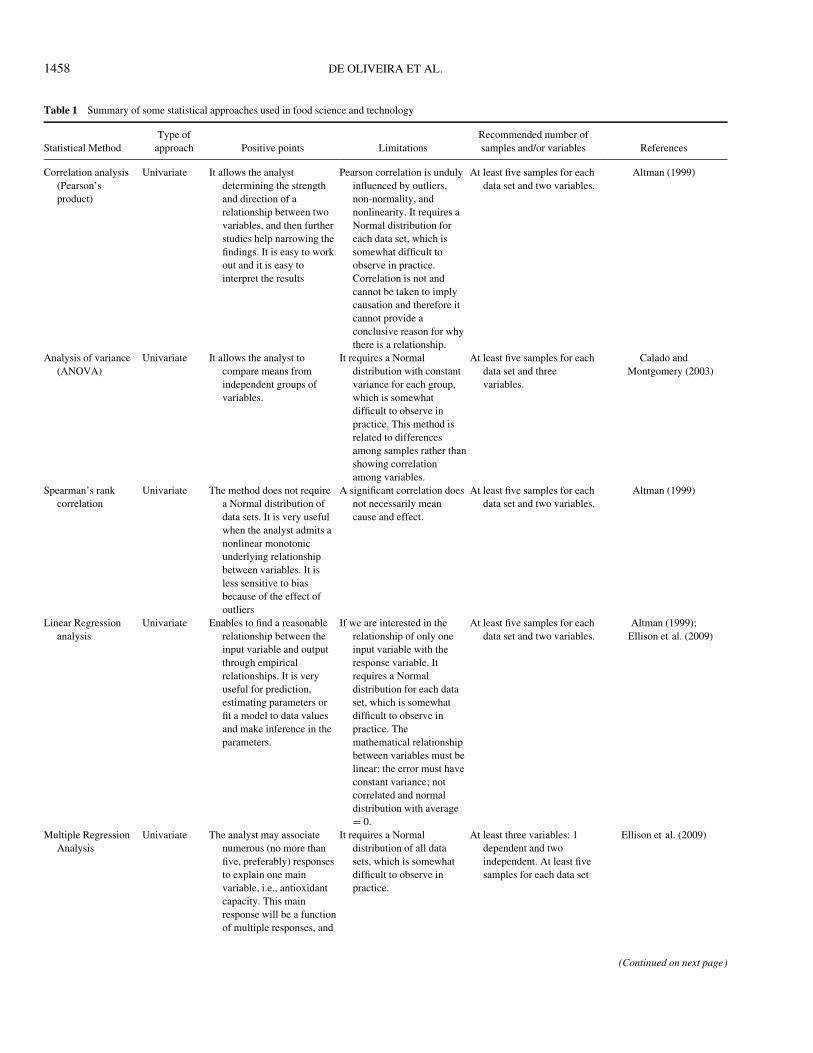
Table 1 Summary of some statistical approaches used in food science and technology
Statistical Method
Type of
approach Positive points Limitations
Recommended number of
samples and/or variables References
Correlation analysis
(Pearson’s
product)
Univariate It allows the analyst
determining the strength
and direction of a
relationship between two
variables, and then further
studies help narrowing the
findings. It is easy to work
out and it is easy to
interpret the results
Pearson correlation is unduly
influenced by outliers,
non-normality, and
nonlinearity. It requires a
Normal distribution for
each data set, which is
somewhat difficult to
observe in practice.
Correlation is not and
cannot be taken to imply
causation and therefore it
cannot provide a
conclusive reason for why
there is a relationship.
At least five samples for each
data set and two variables.
Altman (1999)
Analysis of variance
(ANOVA)
Univariate It allows the analyst to
compare means from
independent groups of
variables.
It requires a Normal
distribution with constant
variance for each group,
which is somewhat
difficult to observe in
practice. This method is
related to differences
among samples rather than
showing correlation
among variables.
At least five samples for each
data set and three
variables.
Calado and
Montgomery (2003)
Spearman’s rank
correlation
Univariate The method does not require
a Normal distribution of
data sets. It is very useful
when the analyst admits a
nonlinear monotonic
underlying relationship
between variables. It is
less sensitive to bias
because of the effect of
outliers
A significant correlation does
not necessarily mean
cause and effect.
At least five samples for each
data set and two variables.
Altman (1999)
Linear Regression
analysis
Univariate Enables to find a reasonable
relationship between the
input variable and output
through empirical
relationships. It is very
useful for prediction,
estimating parameters or
fit a model to data values
and make inference in the
parameters.
If we are interested in the
relationship of only one
input variable with the
response variable. It
requires a Normal
distribution for each data
set, which is somewhat
difficult to observe in
practice. The
mathematical relationship
between variables must be
linear; the error must have
constant variance; not
correlated and normal
distribution with average
D 0.
At least five samples for each
data set and two variables.
Altman (1999);
Ellison et al. (2009)
Multiple Regression
Analysis
Univariate The analyst may associate
numerous (no more than
five, preferably) responses
to explain one main
variable, i.e., antioxidant
capacity. This main
response will be a function
of multiple responses, and
It requires a Normal
distribution of all data
sets, which is somewhat
difficult to observe in
practice.
At least three variables: 1
dependent and two
independent. At least five
samples for each data set
Ellison et al. (2009)
(Continued on next page)
1458 DE OLIVEIRA ET AL.

boiling water to the dry plant material. Both preparations
extract almost all water-soluble bioactive compounds.
Green and Yerba-mate teas are blanched, in which green
tea leaves are steamed or pan-fried and Yerba-mate leaves are
flash-heated over open flame. This process deactivates poly-
phenol oxidase and avoids prolonged fermentation, what is in
contrast to the production of black teas, where the leaves are
allowed to wither and ferment, oxidizing the polyphenols to
form dimerized compounds, namely catechins to theaflavins
(Hara, 2001; Heck and de Mejia, 2007). The reddish-black
color of black tea, its reduced bitterness and astringency, and
the low perception of leafy and grassy flavor are derived from
the oxidation process, giving black tea a marked distinction as
compared to green tea (Cheng, 2006). White tea is composed
only by the bud or first leaves that are plucked, being the least
processed tea, as it is directly dried after harvesting and suffers
no fermentation. In this way, the delicate white leaf hairs are
left intact, leading to a pale yellow-colored infusion (Hilal and
Engelhardt, 2007). The production of yellow tea is similar to
green tea’s production, but instead of immediate drying after
fixation, the leaves are stacked, covered, and heated in a humid
environment. This condition propitiates the chlorophyll oxida-
tion by means of nonenzymatic and nonmicrobial reactions,
which results in a yellowish or greenish-yellow color.
The major difference between green tea and Yerba-mate is
the drying method, in which green tea is dried by a fast and
high temperature drying air, retaining the fresh leaves charac-
teristics and developing their characteristic flavor. Yerba-mate
is dried very slowly, usually using wood smoke, developing
new flavor characteristics and contributing to changes in the
chemical makeup and physical appearance (Heck and de
Mejia, 2007). Semi-fermented oolong tea is generally fer-
mented from 20% to 60% to avoid green tea’s characteristic
(leafy and grassy notes) while obtaining black tea’s sweet and
bold flavor. Black tea is more popular in North America and
Europe, whereas oolong tea is more produced and consumed
in China (Leung et al., 2001).
Teas, such as green/black/red/yellow, contain a consider-
able amount of catechins, which are flavonoids that present
considerable antioxidant-related effects. There are several cat-
echin present in Camellia sinensis and Yerba-mate leaves, but
the major tea catechins are (¡)-catechin, (C)-epicatechin,
(¡)-epigallocatechin, (¡)-epigallocatechin gallate, (¡)-epica-
techin, and (¡)-epicatechin gallate (Song et al., 2012).
Whereas catechins are the most abundant polyphenols in green
tea, the typical pigments in black tea are theaflavins, thearubi-
gins, and theabrownins, which are derived from the oxidation
of catechins during the fermentation process (Leung et al.,
Table 1 Summary of some statistical approaches used in food science and technology (Continued)
Statistical Method
Type of
approach Positive points Limitations
Recommended number of
samples and/or variables References
this can be observed in an
equation y D f (x1, x2,
x3,. . ., xn), where x
represents the responses
Principal Component
Analysis (PCA)
Multivariate The scatter plot generated for
samples is not easy way to
observe how samples
behave in relation to the
responses. It allows the
identification of patterns
and association among all
variables and samples
simultaneously in a 2D
graph. PCA is available in
almost every statistical
software
The method requires a large
set of samples and at least
3 response variables.
When many samples are
close to one another in the
dispersion graph, it is hard
to visualize trends and
intrinsic differences.
At least five variables and
five samples.
Mardia et al. (1979),
Piggott and Sharman
(1986)
Cluster Analysis
(CA)
Multivariate Enables to classify a set of
samples or variables,
according to their
similarities and
differences. Hierarchical
CA is available in almost
every statistical software.
CA imposes hierarchical
structure on data, whether
real or not, and it does not
neither have a mechanism
for differentiating between
relevant and irrelevant
variables nor depict data
with multiple, independent
underlying controls well.
Once it is based on
algorithms, solutions may
be nonunique.
There is no rule about sample
size necessary for CA.
Small number of samples
and high variable number:
it is very difficult to find
cluster structure in data, as
data points are positioned
in so many dimensions. It
is recommended to use, at
least, three variables and
2k cases (k D number of
variables), but preferably
5*2k
Formann (1984),
Mooi and Sarstedt (2011)
ANTIOXIDANT ACTIVITY OF CAMELLIA SINENSIS AND ILEX PARAGUARIENSIS TEAS 1459

2001). Out of these tea varieties, green tea has been proven to
present the highest amount of flavonoids and total polyphenols
as compared to oolong, black, and Yerba-mate teas (Vinson,
2000; Bert�e et al., 2011). Although the chemical composition
and functionality of C. sinensis teas are widely known and rec-
ognized, the ‘most functional’ tea is not known once there is
no scientific consensus among specialists once the production
method and terroir play a decisive role in the production anf
activity of chemical compounds. In this sense, in a recent
study of our group (Granato et al., 2014c), red tea presented
the highest content of gallic acid, total phenolic substances
and, therefore, the highest antioxidant activity towards DPPH,
copper chelating activity and cupric-ion reducing antioxidant
activity (Granato et al., 2014a).
In order to avoid losing ground to soft drinks, the tea indus-
try is actively trying to promote consumption by emphasizing
tea’s health benefits and also demonstrating that ready-to-drink
teas are healthier than soft drinks (OXFAM, 2002). Another
key-point to increase the consumption of teas is the develop-
ment of “exotic teas,” which are a mixture of a tea with fruit
juices and herbal extracts. This technological innovation has
been applied to many types of teas in order to dissipate nega-
tive off-flavors and to enhance aroma and fresh taste.
Overview on Some in vitro Assays to Evaluate Tea’sAntioxidant Activity
The antioxidant activity of teas has been demonstrated in in
vitro and in vivo biological systems, and researchers usually
find a direct and positive correlation between antioxidant
activity and the content of phenolic compounds, especially fla-
vonoids (Granato et al., 2011; Macedo et al., 2013). Antioxi-
dants can buffer free radicals mainly by three mechanisms:
hydrogen atom transfer, electron transfer and combination of
both mechanisms (Prior et al., 2005). Following this, the
hydrogen atom transfer mechanism measures the ability of an
antioxidant compound, gallic acid, for example, to quench free
radicals by hydrogen donation. The electron transfer measures
the ability of antioxidant compounds to transfer one electron
to reduce free radicals, pro-oxidant metals, and carbonyls
(Huang et al., 2005). In accordance with Prior et al. (2005)
and Huang et al. (2005), Ferric Reducing Antioxidant Power
(FRAP) is an electron transfer assay, while oxygen radical
absorbance capacity (ORAC) is a common hydrogen atom
transfer assay and the DPPH (2,2-diphenyl-1-picrylhydrazyl)
assay combines both hydrogen atom transfer and electron
transfer mechanisms.
There are many in vitro antioxidant assays available to
evaluate the bioactivity of teas, such as ferrous ion chelating
activity (Wang et al., 2012), lipid peroxidation inhibition
assay (Naithani et al., 2006), deoxyribose assay (Chen et al.,
2005), photoreduction of nitro blue tetrazolium assay (Chen
et al., 2005), superoxide dismutase mimetic activity (Naithani
et al., 2006), and assay of hydroxyl and superoxide radicals
scavenging activity (Xu et al., 2012), among others. A detailed
review on these methods is accurately described by Alves
et al. (2010). However, the most used methodologies are:
DPPH, ORAC, FRAP and ABTS (2,20-azino-bis(3-ethylben-zothiazoline-6-sulphonic acid). These methods differ among
each other in relation to the principles of the chemical reac-
tion, the target molecule, the way to express the results, the pH
of the medium, reaction time, among others. Moreover, once
many chemical mechanisms and multiple reactions are
involved, no single method will accurately reflect the antioxi-
dant capacity of complex matrices, such as teas. It is neces-
sary, therefore, to assess the in vitro antioxidant capacity of
teas by using different assays that use distinct mechanisms,
principles, and chemical reagents. It is also important to take
into consideration the polarity of the antioxidant compounds
present in the food matrix, that is, the methods used to assess
the antioxidant capacity should be able to measure the antirad-
ical capacity of both water-soluble and hydrophobic
compounds.
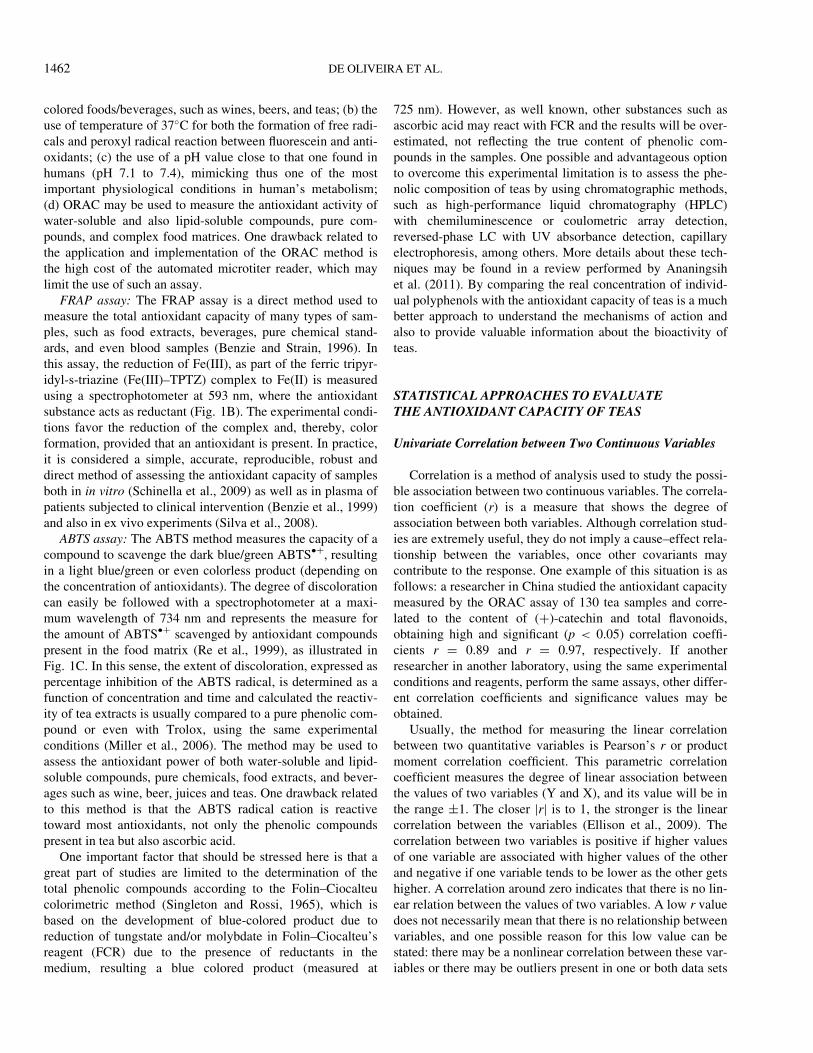
DPPH assay: DPPH is one of the most used assays to deter-
mine the electron transfer between the DPPH radical and the
antioxidant compound(s) present in the medium because of its
low-cost and also because it does not require sophisticated
equipments. This assay is based on the ability of antioxidant to
scavenge the DPPH cation radical, determining the hydrogen
donating capacity of the antioxidant, and does not produce oxi-
dative chain reactions nor does not react with free radical
intermediates. This method is highly dependent on the experi-
mental conditions employed, such as the final concentration of
the extracts, the concentration of the DPPH solution, the incu-
bation time, and the solvent used for the DPPH solution
(Dudonne et al., 2009).
In this assay, the 2,2-diphenyl-1-picrylhydrazyl radical
(purple), which absorbs in a wavelength of 517 nm, is reduced
and a yellow compound (2,2-diphenylpicrylhydrazine) is
formed, thus decreasing the absorbance (Brand-Williams
et al., 1995). Then, it is possible to determine the percentage
of antioxidant activity and/or the remaining DPPH radical
present in the medium (Sousa et al., 2007). In recent studies
regarding the DPPH method, Sharma and Bhat (2009) and
Hartwig et al. (2012) stated that one drawback of the compari-
son of data obtained by this assay is due to different experi-
mental conditions employed by different laboratories, such as
the DPPH concentration (4–500 mm), presence and intensity
of light, reaction time (5 to up 1440 min), solvent (ethanol,
methanol, toluene, methanol buffered solution), and pH of the
final mixture. These conditions hinder the comparison the data
obtained in different laboratories and point out the need for
standardization of this assay.
ORAC assay: The ORAC assay system uses an area-under-
curve technique and thus combines both inhibition time and
inhibition degree of free radical action by an antioxidant into a
single quantity. The ORAC assay measures the peroxyl-scav-
enging activity of compounds/extracts (Huang et al., 2002).
This method involves thermal degradation at 37�C, and
1460 DE OLIVEIRA ET AL.

carbon-centered radicals are generated by the azo-initiator
(usually 2,20-azobis-2-amidinopropane-dihydrochloride—
AAPH), where peroxyl radicals (ROO�) are formed from the
breakdown of AAPH. Peroxyl radicals can oxidize fluorescein
probe (30,60-dihydroxy-spiro[isobenzofuran-0[3H],90[9H]-xanthen]-3-one) to generate products without fluorescence or
react directly with the antioxidant compounds, suppressing
thus the fluorescein oxidation by a hydrogen atom transfer
mechanism, which preserves the fluorescence measured at
485 nm excitation and 525 nm emission (Zenbio, 2008). This
behavior persists until the antioxidant is totally consumed, at
which point the fluorescein probe is rapidly oxidized (Granato
et al., 2010b).
The concentration of antioxidants present in the food matrix
is directly proportional to the fluorescence intensity through
the course of the assay (Zenbio, 2008). The data are summa-
rized over the time and, usually, the area under the curve is
integrated by software. This is then compared to a chemical
standard, usually Trolox (6-hydroxy-2,5,7,8-tetramethylchro-
man-2-carboxylic acid—water-soluble vitamin E analog), and
is expressed as micromoles of Trolox equivalents (TE) per
gram or per milliliter of sample. The advantages of this tech-
nique are: (a) once fluorescein is used as a measure of oxida-
tive damage, there is little interference of colored substances
in the reading, which makes ORAC assay an important
approach to measure the antioxidant capacity of high-intensity
Figure 1 Example of a reaction between the DPPH radical (A), FRAP (B), and ABTS*C radical (C) and a phenolic compound present in a tea extract (Modified
from Rufino et al., 2006; 2007a, 2007b).
ANTIOXIDANT ACTIVITY OF CAMELLIA SINENSIS AND ILEX PARAGUARIENSIS TEAS 1461
colored foods/beverages, such as wines, beers, and teas; (b) the
use of temperature of 37�C for both the formation of free radi-
cals and peroxyl radical reaction between fluorescein and anti-
oxidants; (c) the use of a pH value close to that one found in
humans (pH 7.1 to 7.4), mimicking thus one of the most
important physiological conditions in human’s metabolism;
(d) ORAC may be used to measure the antioxidant activity of
water-soluble and also lipid-soluble compounds, pure com-
pounds, and complex food matrices. One drawback related to
the application and implementation of the ORAC method is
the high cost of the automated microtiter reader, which may
limit the use of such an assay.
FRAP assay: The FRAP assay is a direct method used to
measure the total antioxidant capacity of many types of sam-
ples, such as food extracts, beverages, pure chemical stand-
ards, and even blood samples (Benzie and Strain, 1996). In
this assay, the reduction of Fe(III), as part of the ferric tripyr-
idyl-s-triazine (Fe(III)–TPTZ) complex to Fe(II) is measured
using a spectrophotometer at 593 nm, where the antioxidant
substance acts as reductant (Fig. 1B). The experimental condi-
tions favor the reduction of the complex and, thereby, color
formation, provided that an antioxidant is present. In practice,
it is considered a simple, accurate, reproducible, robust and
direct method of assessing the antioxidant capacity of samples
both in in vitro (Schinella et al., 2009) as well as in plasma of
patients subjected to clinical intervention (Benzie et al., 1999)
and also in ex vivo experiments (Silva et al., 2008).
ABTS assay: The ABTS method measures the capacity of a
compound to scavenge the dark blue/green ABTS�C, resultingin a light blue/green or even colorless product (depending on
the concentration of antioxidants). The degree of discoloration
can easily be followed with a spectrophotometer at a maxi-
mum wavelength of 734 nm and represents the measure for
the amount of ABTS�C scavenged by antioxidant compounds
present in the food matrix (Re et al., 1999), as illustrated in
Fig. 1C. In this sense, the extent of discoloration, expressed as
percentage inhibition of the ABTS radical, is determined as a
function of concentration and time and calculated the reactiv-
ity of tea extracts is usually compared to a pure phenolic com-
pound or even with Trolox, using the same experimental
conditions (Miller et al., 2006). The method may be used to
assess the antioxidant power of both water-soluble and lipid-
soluble compounds, pure chemicals, food extracts, and bever-
ages such as wine, beer, juices and teas. One drawback related
to this method is that the ABTS radical cation is reactive
toward most antioxidants, not only the phenolic compounds
present in tea but also ascorbic acid.
One important factor that should be stressed here is that a
great part of studies are limited to the determination of the
total phenolic compounds according to the Folin–Ciocalteu
colorimetric method (Singleton and Rossi, 1965), which is
based on the development of blue-colored product due to
reduction of tungstate and/or molybdate in Folin–Ciocalteu’s
reagent (FCR) due to the presence of reductants in the
medium, resulting a blue colored product (measured at
725 nm). However, as well known, other substances such as
ascorbic acid may react with FCR and the results will be over-
estimated, not reflecting the true content of phenolic com-
pounds in the samples. One possible and advantageous option
to overcome this experimental limitation is to assess the phe-
nolic composition of teas by using chromatographic methods,
such as high-performance liquid chromatography (HPLC)
with chemiluminescence or coulometric array detection,
reversed-phase LC with UV absorbance detection, capillary
electrophoresis, among others. More details about these tech-
niques may be found in a review performed by Ananingsih
et al. (2011). By comparing the real concentration of individ-
ual polyphenols with the antioxidant capacity of teas is a much
better approach to understand the mechanisms of action and
also to provide valuable information about the bioactivity of
teas.
STATISTICAL APPROACHES TO EVALUATETHE ANTIOXIDANT CAPACITY OF TEAS
Univariate Correlation between Two Continuous Variables
Correlation is a method of analysis used to study the possi-
ble association between two continuous variables. The correla-
tion coefficient (r) is a measure that shows the degree of
association between both variables. Although correlation stud-
ies are extremely useful, they do not imply a cause–effect rela-
tionship between the variables, once other covariants may
contribute to the response. One example of this situation is as
follows: a researcher in China studied the antioxidant capacity
measured by the ORAC assay of 130 tea samples and corre-
lated to the content of (C)-catechin and total flavonoids,
obtaining high and significant (p < 0.05) correlation coeffi-
cients r D 0.89 and r D 0.97, respectively. If another
researcher in another laboratory, using the same experimental
conditions and reagents, perform the same assays, other differ-
ent correlation coefficients and significance values may be
obtained.
Usually, the method for measuring the linear correlation
between two quantitative variables is Pearson’s r or product
moment correlation coefficient. This parametric correlation
coefficient measures the degree of linear association between
the values of two variables (Y and X), and its value will be in
the range §1. The closer jrj is to 1, the stronger is the linear
correlation between the variables (Ellison et al., 2009). The
correlation between two variables is positive if higher values
of one variable are associated with higher values of the other
and negative if one variable tends to be lower as the other gets
higher. A correlation around zero indicates that there is no lin-
ear relation between the values of two variables. A low r value
does not necessarily mean that there is no relationship between
variables, and one possible reason for this low value can be
stated: there may be a nonlinear correlation between these var-
iables or there may be outliers present in one or both data sets
1462 DE OLIVEIRA ET AL.

(Altman, 1999). A simple way to check the type of correlation
between two variables is performed by visual inspection of the
“dispersion diagram.” It is important to interpret the r value in
conjunction with a plot of the data.
In accordance with Altman (1999), the linear correlation
coefficient may be calculated for any two data sets; how-
ever, there are some important assumptions for using this
coefficient: the variables involved must be random, all the
observations must be independent and it is preferable that
both variables present approximately normal distribution.
This is essential for small samples (�30); when the number
of samples is high (>30) the importance of normal distri-
bution is decreased. This is justified by the Central Limit
Theorem for multivariate distributions presented by John-
son and Wichern (1988). According to Snedecor and
Cochran (1980), in practice, often bivariate distribution of
interest is far from following a normal distribution. If both
variables do not follow a normal distribution, as formally
tested by Shapiro-Wilk, Lillifors, Anderson-Darling or Kol-
mogorov-Smirnov tests, data can be transformed (root
square or log transformation, for example) or a nonpara-
metric approach, such as the Spearman’s rank correlation
coefficient, can be used. A summary on how to use Spear-
man or Pearson correlation coefficients is demonstrated in
Fig. 2.
The Pearson’s linear coefficient correlation between two
variables X and Y is denoted by r and given by Equation (1):
rDPniD 1
.xi ¡ x/.yi ¡ y/ffiffiffiffiffiffiffiffiffiffiffiffiffiffiffiffiffiffiffiffiffiffiffiffiPniD 1
.xi ¡ x/2
s ffiffiffiffiffiffiffiffiffiffiffiffiffiffiffiffiffiffiffiffiffiffiffiffiPniD 1
.yi ¡ y/2
s (1)
where xi and yi are the values of X and Y for n observations.
Consider the example: one analyst determined in triplicate the
catechin content (mg/L) of a mixture of nine types of green,
black, and white teas and also measured the antioxidant capac-
ity of such products by using the ORAC assay (mmol TE/L),
and obtained the following mean results:
–Catechin content D 2.55; 3.08; 4.28; 5.39; 0.25; 6.75; 8.69;
9.25; 10.08
–Antioxidant Activity D 60.37; 65.28; 72.34; 79.68; 30.36;
71.27; 90.16; 90.20; 90.30
Initially, data were checked for normality by using the Kol-
mogorov–Smirnov test and the p-values for the catechin con-
tent and ORAC values were 0.7696 and 0.6016, showing the
results follow a normal distribution once p > 0.05. By using
Data set 1 Data set 2
Do data follow a normal distribution? Apply Shapiro-Wilks, Lillifors, Anderson-Darling or Kolmogorov-
Smirnov tests
Is there any correlation?
Neither data set follows a normal distribution (p<0.05)
One or both sets follow a normal distribution(p≥0.05)
Apply Spearman rank correlation
Calculate Pearson’s product (r)
No Yes
# #
Figure 2 Steps to analyze a linear correlation between two response variables.
ANTIOXIDANT ACTIVITY OF CAMELLIA SINENSIS AND ILEX PARAGUARIENSIS TEAS 1463

Equation (1), the analyst does not require computer software to
perform the analysis and check for association between the
catechin content and the antioxidant activity of teas. Indeed,
the correlation coefficient was found to beC0.9209 and, taking
into account that the correlation coefficient may be compre-
hended between ¡1 and 1, the obtained value may be consid-
ered high, meaning that the higher the content of catechin, the
higher the ORAC values of teas. But the correlation coefficient
solely is not the only parameter to be analyzed. Rather, the sig-
nificance and strength of correlation must be stated.
With regard to strength of correlation, there is no consensus
about the qualitative assessment of correlation coefficients. In
this sense, Callegari-Jacques (2003) stated that the correlation
coefficient can be assessed qualitatively as follows: if
0.00 < r < 0.30, there is a weak linear correlation between
variables; if 0.30 � r < 0.60, there is a moderate linear corre-
lation; if 0.60 � r < 0.90, there is a strong linear correlation;
and if 0.90 � r < 1.00, there is a very strong linear correlation
between both data sets. Similarly, with slight differences,
Granato et al. (2010a) established to analyze the strength of
correlations between variables using the following criteria:
perfect (r D §1.0), strong (§0.80 � r < §1.0), moderate
(§0.50 � r < §0.80), weak (§0.10 � r < §0.50), and very
weak correlation (§0.10 � r < §0.01).
As mentioned before, not only the correlation coefficient
should be calculated but also its significance, which is a useful
attribute that indicates how unlikely a certain correlation coef-
ficient occurs given no relationship in the population. There is
a simple test for significance of the null hypothesis of no asso-
ciation which is based on the t distribution. The null hypothe-
sis of this test is that there is no association between variables
(i.e. zero correlation), and it can be shown that the quantity
r
ffiffiffiffiffiffiffiffiffin¡ 21¡ r2
qfollows a t distribution with n ¡ 2 degrees of freedom.
Thus the null hypothesis of no association may be tested by
looking this value up in the table of the t distribution or by
checking p-value (usually it needs to be lower than 0.05).
From a practice standpoint and experience, it is usual to obtain
a strong correlation coefficient but with no significance (p >
0.05) when there is a small number of samples analyzed (n <
10). On the other hand, it is easy to achieve significance of a
correlation, but the analyst should pay attention to the strength
of the correlation to determine if the relationship explains the
data well. Consider the example given above and taking into
account that r D 0.9209 and n D 9, the calculated t would be
tD 0:9209ffiffiffiffiffiffiffiffiffi
9¡ 21¡ 0:8480
p D 6:2500, and the critical (from the Student
t-table, for 7 degrees of freedom is 2.365 at a 95% of confi-
dence. Therefore, once the calculated t is higher than the t dis-
played on the Student t-table, it is possible to reject the null
hypothesis and state that the correlation coefficient is regarded
as statistically significant. Indeed, if the analyst calculates the
p-value for this example, a p < 0.0001 will be attained. In this
situation, the analyst can confirm the positive and significant
effect of catechin on the antioxidant capacity of teas.
Besides Pearson correlation, which is virtually a parametric
test, nonparametric correlations, such as the Spearman
correlation coefficient, should be calculated for data sets that
do not present a normal distribution, when the sample size is
small, or when the variables are measured at an ordinal level.
Unlike Pearson’s correlation coefficient, the Spearman coeffi-
cient does not require the assumption that the relationship
between variables is linear, even it does not require that the
variables are measured in class intervals. Spearman’s r (rho),
which is a measure of nonparametric correlation between two
data sets, evaluates an arbitrary monotonic function that can
be used to describe the relationship between two variables,
without making any assumptions about the statistical distribu-
tion of variables.
It is important to emphasize that rank correlations are not
being interpreted at the same way as Pearson’s correlation.
The coefficient of Spearman r ranges between ¡1 and 1. The
closer jrj is to 1, the greater is the association between varia-
bles. The negative sign of the correlation means variables
which vary in the opposite direction, i.e., higher categories of
one variable are associated with lower categories of the other
variable. A Spearman correlation close to zero indicates that
there is no tendency for Y to either increase or decrease when
X increases.
Spearman’s rank correlation coefficient is obtained by rank-
ing the values of each of the two variables. The simplest way
to get r is to calculate Pearson’s r on the ranks of the data.
There is an alternative approach which assumes that there are
no ties in the data set. For each of N subjects being studied, the
difference in the ranks, di, is calculated and Spearman’s rank
correlation coefficient is given by Equation 2:
rD 1¡6PniD 1
d2i
N 3 ¡N(2)
where n D number of pairs ordination.
The null hypothesis for this test is that there is no associa-
tion in the population (i.e. zero correlation), and it can be
shown that for large samples (n > 30) the quantity rffiffiffiffiffiffiffiffiffin¡ 21¡ r2
qfollows a t distribution with n¡2 degrees of freedom.
Linear correlation has been used to study the relationship
between polypheonlic concentration and antioxidant activity
of teas, measured by different in vitro methods. Here we list
and discuss some examples:
Bassani, Granato, and Nunes (2014a) used design of experi-
ments (n D 11 assays) to optimize the extraction of antioxi-
dants from roasted yerba mate tea leaves and correlated, using
Pearson’s coefficient, the total content of flavonoids with the
antioxidant activity measured by the DPPH assay. Authors
verified a significant (p < 0.001) and high correlation
(r D 0.90) between variables. Likewise, Kodama et al. (2010)
quantified the total phenolic compounds, epigallocatechin, epi-
catechin gallate, epigallocatechin gallate, and gallocatechin in
green tea infusions prepared using tea bags or dry leaves and
the in vitro antioxidant activity was determined by using the
1464 DE OLIVEIRA ET AL.

DPPH and ORAC assays, and results were subjected to linear
correlation analyzes. Authors did not find a high correlation
(r D 0.58; n D 13) between total phenolic content and DPPH
assay, while no correlation (r D 0.06) was found between
ORAC and total phenolics. When the samples were analyzed
separately (teabags or ready-to-drink samples), a suitable lin-
ear correlation between DPPH and total phenolics was found
for teabags (r D 0.81; n D 6) and ready-to-drink samples (r D0.97; n D 4). Authors did not perform correlation analysis
between the flavonoids quantified by high performance liquid
chromatography and the antioxidant capacity assays. It is
important to mention that correlation analysis performed
should contain, at least, five pairs of data in order to identify a
trend (Altman, 1999).
Song et al. (2011) analyzed the linear correlation between the
antioxidant activity measured by ORAC and the total phenolic
content measured by the Folin–Ciocalteau method (r D 0.8840;
nD 5) and also betweenORAC and the total content of proanho-
cyanidin (rD 0.9908; nD 5) in yellow Camellia tea. These data
indicate that proanthocyanidins are major compounds responsi-
ble for scavenging peroxyl radicals as measured by the ORAC
technique. It is important to note that in linear correlation analy-
sis, the probability value (p-value) for each pairwise correlation
coefficient should be provided, once the significance is also
dependent on the number of samples present in the data set. This
is an important factor to be evaluated because, in many cases,
the correlation coefficient is high (>0.80) but the model shows a
weak or no significance (p> 0.05).
Kerio et al. (2013) evaluated the total polyphenolic content,
catequin profile, and in vitro antioxidant capacity of black and
green tee products from purple leaf colored tea cultivars. Sev-
eral correlations between the composition of the teas and their
antioxidant capacity were reported. Total polyphenolic content
was significantly correlated with antioxidant activity in both
green (r D 0.844; p � 0.01; n D 30) and black tea products
(r D 0.797; p � 0.01; nD 30). In green tea products, anthocya-
nins, and particularly cyanidin-3-O-glucoside, had a signifi-
cant role in their antioxidant activity, as shown by the high
and significant correlation coefficient between its concentra-
tion and antioxidant activity (r D 0.843; p � 0.01; n D 30). In
black tea products antioxidant activity was highly correlated
to the concentration of peonidin (r D 0.732; p � 0.01; n D 30),
cyanidin-3-O-glucoside (r D 0.764; p � 0.01; n D 30), and
cyanidin-3-O-galactoside (r D 0.748; p � 0.01; n D 30). Simi-
larly, Luximon-Ramma et al. (2005) reported high correlation
coefficients between total proanthocyanidin and antioxidant
capacity measured by TEAC (r D 0.96) and FRAP (r D 0.95)
in Mauritian black teas.
Jayasekera et al. (2011) reported a weak correlation (r D0.5) between FRAP antioxidant capacity and total phenolic
content (r D 0.5) for fermented and nonfermented Sri Lankan
teas. However, when correlations between total phenolic con-
tent and DPPH antioxidant capacity were calculated, results
depended on the type of tea considered. Correlation was sig-
nificant (p < 0.05) for fermented teas but not significant for
nonfermented teas (r D 0.1). These results suggest that poly-
phenols were a major contributor to the ferric reducing capac-
ity of fermented and nonfermented teas but were only a major
contribution to the antioxidant capacity of fermented Sri Lan-
kan teas. These authors also reported no significant correlation
between FRAP and DPPH (r D 0.2, p > 0.05, n D 20), sug-
gesting that the mechanisms involved in reduction of ferric
ions and radical scavenging activity were different.
Yerba Filip et al. (2000) induced the oxidation of liposomes
from egg yolk by incubation (37�C, 60 min) with 10 mM of
AAPH (which generates free radicals in the aqueous phase) in
the presence or the absence of different Yerba-mate aqueous
extracts (Ilex spp), and thiobarbituric acid-reactive substances
(TBARS) were quantified, while caffeoyl-derivatives were
estimated by using a spectrophotometer. A significant (p D0.0005) correlation was observed between the antioxidant
activity and the content of caffeoyl-derivatives of the mate
extracts (n D 8; r D 0.94) and authors also used linear regres-
sion analysis to propose a mathematical model to fit the results
(antioxidant activity D 0.07 C 1.89 £ caffeoyl-derivatives
content).
Grujic et al. (2012) determined the content of chlorogenic
acid, total phenolics, flavonoids, and antioxidant activity
(DPPH assay) in Yerba-mate tea extracts (n D 9) obtained by
ethanol extraction and liquid carbon dioxide extraction with
ethanol (co-solvent). Authors correlated, using linear regres-
sion analysis, the chemical composition with the antioxidant
activity of the extracts and verified that, besides not providing
any mathematical equation to explain the experimental data, a
correlation coefficient of 0.85 for total phenolic compounds
and a correlation coefficient of 0.74 for total flavonoids were
attained. No information about correlation between DPPH and
the content of chlorogenic acid was provided.
The antioxidant activity measured by the ABTS assay of
aqueous extracts from 23 Bulgarian plants (including Alchem-
illa vulgaris, Sambucus ebulus, Mentha spicata, and Fragaria
vesca) was studied in relation to their polyphenol content in
comparison with mate, black tea, and honeybush (Kiselova
et al., 2006). A positive correlation (r D 0.92) between antiox-
idant activity and polyphenol content was attained, corroborat-
ing the fact that polyphenols are one of the main responsible
for the in vitro antioxidant activity of plant extracts. From this
example, it is possible to observe that authors did not mention
the significance, expressed by the p-value, of the correlation.
It is widely accepted that the significance of a correlation
coefficient is a primary source of information about the reli-
ability of the correlation and, therefore, but be stated with the
calculated r.
The total oxyradical scavenging capacity, antiproliferative
activity, total phenolic compounds, and total flavonoid com-
pounds of seven different types of green, oolong, and black
teas marketed in bags was investigated by Yang and Liu
(2013). Authors expressed the correlation coefficient as R2
(and not as r) of 0.9755 for the antioxidant capacity of teas
and the total content of phenolics, and a R2 D 0.9350 for the
ANTIOXIDANT ACTIVITY OF CAMELLIA SINENSIS AND ILEX PARAGUARIENSIS TEAS 1465

correlation between total oxyradical scavenging capacity and
the flavonoid content of teas. It is important to be consistent
when correlation analysis is performed, that is, the correlation
coefficient, r, expresses the degree of association between two
data sets, and the coefficient of determination, which is cor-
rectly expressed by R2, should only be stated when regression
analysis is performed.
The total content of polyphenolics, flavonoids, theaflavins,
individual catechins content, metal chelating activity, and anti-
oxidant activity measured by ORAC, LDL-oxidation, and
ABTS assays of a white, two black, and two green teas were
assessed by Carloni et al. (2012). The metal chelating activity
did not correlate with the in vitro antioxidant activity. On the
other hand, the total phenolic compounds and total flavonoids
significantly correlated with the antiradical capacity of teas
measured by the ABTS method (R2 D 0.871, p D 0.000 and
R2 D 0.438, p D 0.007, respectively). Note that authors pro-
vided the coefficient of determination instead of the correla-
tion coefficients, r, which are 0.9333 and 0.6618, respectively.
This is a common mistake researchers often make to express
the experimental results, and therefore, attention should be
paid when correlation coefficient is calculated. As previously
mentioned, the correlation coefficient represents the linear
relationship between two data sets, and if this coefficient is
squared, the obtained value, R2, is called coefficient of deter-
mination. The R2 represents the proportion of common varia-
tion in the two variables and is usually expressed in regression
analysis.
In a study performed by Kim et al. (2011), the antioxidant
activity of green (not fermented), oolong (partially fermented),
and black (fully fermented) tea infusions was measured by
ORAC and data were subjected to linear correlation analyses.
The results showed that the ORAC data correlated well with
the total content of phenolic substances (r D 0.79), with
(¡)-epigallocatechin gallate (r D 0.81), with (¡)-epigallocate-
chin (r D 0.81), with (¡)-epicatechin (r D 0.87), with (¡)-epi-
catechin gallate (r D 0.82), and with total flavonol glycoside
(r D 0.79). Authors concluded that a reduction in antioxidant
activity was associated to a longer fermentation process and to
differences in concentration of polyphenols present in green
and black teas. Regarding this example, Multiple Linear
Regression or Principal Component Analysis would be more
appropriate to assess the association among all data at the
same time, in case there is a distinction between independent
and dependent variables.
Not only in vitro studies use correlation analysis to support
the conclusions regarding the relationship between polypheno-
lic content of tea and its antioxidant capacity, but also clinical
interventions. In this regard, Benzie et al. (1999) evaluated the
antioxidant capacity of plasma and urine, measured by the
FRAP method, after green tea ingestion in healthy adults.
Authors obtained a significant correlation between urinary
FRAP and urinary total phenolic concentrations, namely
reducing ability (r D 0.845, p < 0.001). On the other hand, no
significant (p > 0.05) correlation was found between
antioxidant activity of urine and plasma in the group that con-
sumed water.
Although linear correlation analysis is a useful tool for both
checking the degree of linear dependence between two random
sets of experimental results (antioxidant capacity assay vs.
phenolic composition, for example) and also for indicating a
predictive relationship that can be exploited in practice, many
scientists still have not widely used this statistical approach to
analyze their data; that is, in many cases, authors isolate and
quantify the content of individual phenolic compounds and
also measure the antioxidant capacity by means of diverse
methods, presenting thus a large amount of experimental
results. However, in many cases, authors do not use any corre-
lation method to verify how variables are in line with another,
which would invariably support the data from chemical analy-
ses in a statistically stand point of view and thus complement-
ing their findings. It is more common to observe scientists
concluding their work based on analysis of variance
(ANOVA) followed by a post hoc multiple comparison mean
test (Tukey, t-Student, Duncan, Fisher LSD, etc.) within tea
samples/groups rather than using correlation analysis (Nai-
thani et al. 2006; Chan et al. 2007; Bert�e et al. 2011). In this
case, it is highly recommended that multiple linear correlation
analysis be used when more than two variables are assessed.
It is widely accepted that the antioxidant activity of food
products and also teas as measured by in vitro methods is
affected by cultivation conditions, soil chemistry, environmen-
tal conditions, variety of the plant material, pathogenesis, col-
lection of plant materials, processing operations, packaging
systems, and storage conditions (Manzocco et al., 1988; Nai-
thani et al., 2006). Once more ready-to-drink teas have been
launched in the marketplace, it would be interesting to conduct
studies that check for association between the storage time and
the loss in phenolic composition and also in total antioxidant
capacity of tea samples. In this case, a simple linear correlation
analysis, measured by the Pearson correlation coefficient, may
be a suitable option when few variables (<5) are evaluated.
However, when more than five variables are assessed, a multi-
variate statistical approach is suggested to explain all experi-
mental data simultaneously, showing not only the association
among all response variables but also a multivariate compari-
son of all samples on a factor-plane.
Association among Three or More Variables: The Useof Unsupervised Pattern Recognition Methods
Most studies regarding the antioxidant capacity of teas
obtain data for many response variables by using simple analy-
ses (linear correlation or ANOVA procedures) instead of using
more sophisticated statistical methods. In general, it is prefera-
ble to use more advanced methods to assess the association
among three or more response variables than checking sepa-
rately at several parts of all data set (the case of linear correla-
tion coefficients) (Altman, 1999). A general guide to analyze
1466 DE OLIVEIRA ET AL.

experimental data regarding phenolic composition and the
antioxidant activity of teas is presented in Figs. 3 and 4. Fig. 3
describes the statistical methods to analyze tea samples by per-
forming descriptive and inferential tests, while Fig. 4
describes the steps to take when the analyst has more or less
than 10 variables by means of a chemometric approach, such
as by using Principal Components Analysis (Zielinski et al.,
2014a) and Cluster Analysis (Best�en et al., 2012; Zielinski
et al., 2014b).
Cluster analysis comprises a wide range of exploratory
multivariate statistical procedures which aim at identifying
homogeneous groups within a data set. It is basically an unsu-
pervised classification of objects or variables, according to
their similarities and differences (Mardia et al., 1979). In the
context of evaluating the antioxidant activity of teas this
methodology is useful for identifying tea samples with simi-
lar antioxidant capacity, based on a wide range of measure-
ments, usually results from different in vitro and/or in vivo
methods for measuring antioxidant capacity. The application
of this type of technique would allow the classification of
teas based on their antioxidant capacity, allowing consumers
to select those with the highest potential positive effect on
their health.
The most popular type of cluster analysis is called agglom-
erative hierarchical, which aims at identifying a series of
groups, named clusters, within a nested hierarchical structure
(Jacobsen and Gunderson 1986). It starts by considering that
each object is a separate cluster and then sequentially merges
clusters according to their similarity until only one cluster is
left (Burns and Burns 2008).
When working with variables in different units (as polyphe-
nolic content and antioxidant capacity measured using differ-
ent methods), the first step of the analysis is to standardize the
dataset by centering the variables to mean zero and scaling to
unit variance (Jacobsen and Gunderson, 1986). Then, the
degree of similarity or dissimilarity between each pair of
objects is calculated. Different distance measures can be used,
being Euclidean distance the most common (Tan et al., 2005).
If objects are considered as points in a coordinate space such
and their degree of difference is estimated by calculating the
geometric distance between them, using an extension of an
extension of Pythagoras’ theorem:
dij DffiffiffiffiffiffiffiffiffiffiffiffiffiffiffiffiffiffiffiffiffiffiffiffiffiffiffiffiffiXKkD 1
.xik ¡ xjk/2
vuut (3)
where dij is the Euclidean distance between clusters i and j, xikis the value of variable xk for cluster i, xjk is the value of
RAW DATA [phenolic composition + antioxidant capacity assay(s)]
How to describe the results?
Are there differences between/among treatments?
DESCRIPTIVE ANALYSIS
I) Central tendency: Means, median, mode.
II) Dispersion: (relative) standard deviation, variance.
III) Others: graphs, ranges, correlation, regression
INFERENTIAL ANALYSIS
Apply Shapiro-Wilks or Kolmogorov-Smirnov tests to check for normal distribution and the F-
test to check for homogeneity of variances:I) If p>0.05 for both tests: Apply
Student-t testII) If p<0.05 in any of the tests: Apply
Mann-Whitney or Wilcoxon tests
2 samples
Apply Shapiro-Wilks or Kolmogorov-Smirnov tests to check for normal
distribution and apply Levene test for homogeneity of variances:
I) If p>0.05 for both tests: Apply one-factor ANOVA followed by Duncan or Fisher LSD tests when
pAnova < 0.05II) If p<0.05 in any of the tests: Apply
Welch test followed by Kruskal-Wallis test
REPORT THE RESULTS
≥ 3 samples
Figure 3 Descriptive and inferential statistical methods applied to analyze experiments regarding the antioxidant activity of teas.
ANTIOXIDANT ACTIVITY OF CAMELLIA SINENSIS AND ILEX PARAGUARIENSIS TEAS 1467

variable xk for cluster j, and K is the total number of variables
in the dataset.
After the distances are calculated, the clusters are merged
according to the distance between them. In agglomerative hier-
archical clustering, every sample is considered as a cluster at
the beginning of the procedure. Then, clusters are successively
merged. In the first step of the procedure, the two samples
with the smallest distance are merged first into a cluster. Once
two samples or clusters have been merged, the next step is to
calculate the distance between the new and the original clus-
ters using a clustering procedure or amalgamation rule (Jacob-
sen and Gunderson 1986). One of the most popular clustering
procedures is average linkage, which calculates the distance
between two clusters as the average distance of all possible
pairs of objects from different clusters (Jacobsen and Gunder-
son 1986). This procedure continues until all samples belong
to only one cluster.
Results of agglomerative hierarchical clustering are repre-
sented graphically in a dendrogram (Næs et al., 2010), which
provides a simple visualization of the hierarchical structure of
the clustering and the level at which each cluster is formed, as
well as cluster membership (Jacobsen and Gunderson 1986).
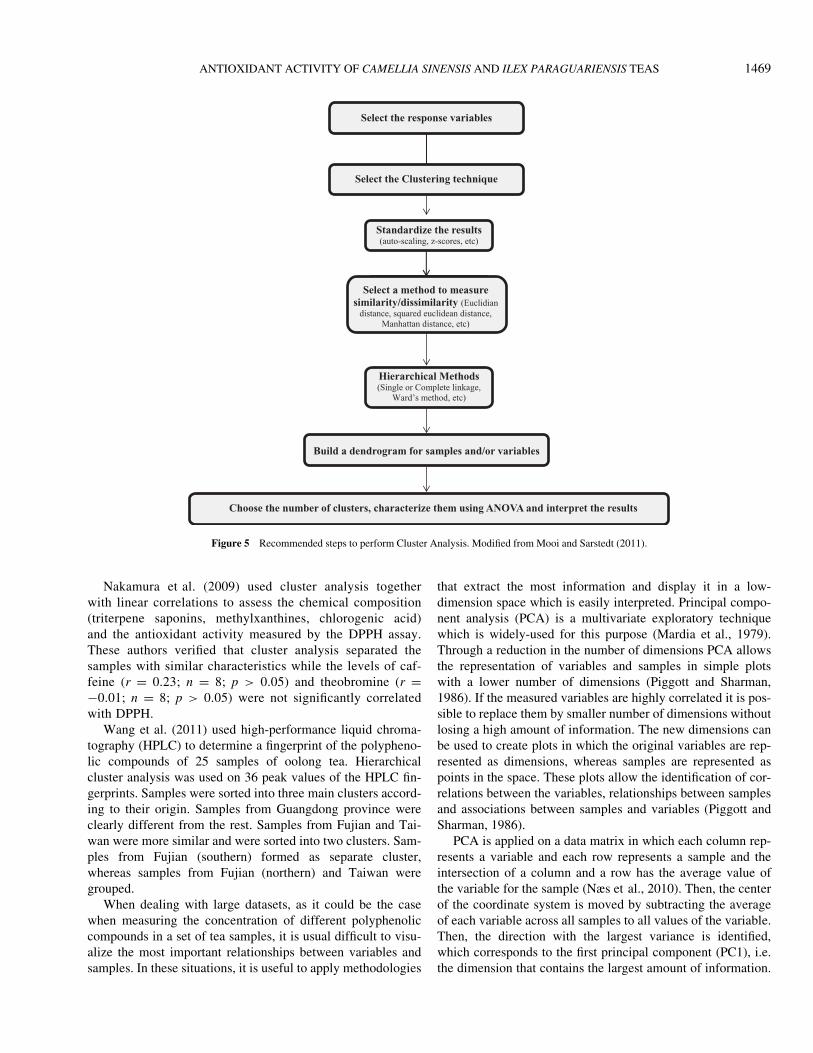
The main steps for performing hierarchical cluster analysis are
summarized in Fig. 5.
When studying the influence of domestic culinary processes
on the antioxidant capacity of green tea infusions, Samaniego-
S�anchez et al. (2011) applied hierarchical cluster analysis for
identifying groups of samples with similar antioxidant capac-
ity. The authors prepared the teas using different procedures,
extraction temperatures, and times. The author used hierarchi-
cal cluster analysis on data from Trolox Equivalent Antioxi-
dant Capacity (TEAC) in the ABTS assay to classify samples
based on their extraction temperature and time. Two main
groups were identified: one was composed of teas prepared at
70�C for 5 min, 80�C for 3 min, and 80�C for 5 min, which
showed the highest antioxidant capacity. A second group com-
prised green teas prepared at 70�C for 1 min, 80�C for 1 min,
70�C for 3 min, 80�C for 3 min, 80�C for 5 min, 90�C for
1 min, and 90�C for 3 min. These last preparation conditions
were similar with respect to their antioxidant potential, which
could be explained by a decrease in antioxidant capacity due
to poor extraction during preparation (e.g., teas prepared at
70�C for 1 min or 3 min) or to the negative effect of tempera-
ture (e.g., teas prepared at 90�C).
RAW DATA
Up to 10 variables ≥ 10 variables
Univariate analysis: linear correlation, ANOVA followed by a post hoc test
Multivariate statistical methods (chemometrics)
In some cases*, chemometrics may also be applied
Supervised pattern recognition
methods
Unsupervised pattern recognition
methods
Principal Components Analysis (PCA)
Hierarchical Cluster Analysis (HCA)
Dendrograms and 2D scatterplots: visualization of all data simultaneously
Analysis of multivariate correlations within response variables + classification of
groups with similar characteristics
Comparison between/among groups using univariate statistics
*When there are many variables and few samples to be analyzed simultaneously. To visualize an example
of this situation, see Besten et al. (2012).
Report the results
Figure 4 Univariate and multivariate analysis of raw data.
1468 DE OLIVEIRA ET AL.
Nakamura et al. (2009) used cluster analysis together
with linear correlations to assess the chemical composition
(triterpene saponins, methylxanthines, chlorogenic acid)
and the antioxidant activity measured by the DPPH assay.
These authors verified that cluster analysis separated the
samples with similar characteristics while the levels of caf-
feine (r D 0.23; n D 8; p > 0.05) and theobromine (r D¡0.01; n D 8; p > 0.05) were not significantly correlated
with DPPH.
Wang et al. (2011) used high-performance liquid chroma-
tography (HPLC) to determine a fingerprint of the polypheno-
lic compounds of 25 samples of oolong tea. Hierarchical
cluster analysis was used on 36 peak values of the HPLC fin-
gerprints. Samples were sorted into three main clusters accord-
ing to their origin. Samples from Guangdong province were
clearly different from the rest. Samples from Fujian and Tai-
wan were more similar and were sorted into two clusters. Sam-
ples from Fujian (southern) formed as separate cluster,
whereas samples from Fujian (northern) and Taiwan were
grouped.
When dealing with large datasets, as it could be the case
when measuring the concentration of different polyphenolic
compounds in a set of tea samples, it is usual difficult to visu-
alize the most important relationships between variables and
samples. In these situations, it is useful to apply methodologies
that extract the most information and display it in a low-
dimension space which is easily interpreted. Principal compo-
nent analysis (PCA) is a multivariate exploratory technique
which is widely-used for this purpose (Mardia et al., 1979).
Through a reduction in the number of dimensions PCA allows
the representation of variables and samples in simple plots
with a lower number of dimensions (Piggott and Sharman,
1986). If the measured variables are highly correlated it is pos-
sible to replace them by smaller number of dimensions without
losing a high amount of information. The new dimensions can
be used to create plots in which the original variables are rep-
resented as dimensions, whereas samples are represented as
points in the space. These plots allow the identification of cor-
relations between the variables, relationships between samples
and associations between samples and variables (Piggott and
Sharman, 1986).
PCA is applied on a data matrix in which each column rep-
resents a variable and each row represents a sample and the
intersection of a column and a row has the average value of
the variable for the sample (Næs et al., 2010). Then, the center
of the coordinate system is moved by subtracting the average
of each variable across all samples to all values of the variable.
Then, the direction with the largest variance is identified,
which corresponds to the first principal component (PC1), i.e.
the dimension that contains the largest amount of information.
Select the response variables
Select the Clustering technique
Hierarchical Methods(Single or Complete linkage,
Ward’s method, etc)
Choose the number of clusters, characterize them using ANOVA and interpret the results
Hierarchical Methods(Single or Complete linkage,
Ward’s method, etc)
Select a method to measure similarity/dissimilarity (Euclidian
distance, squared euclidean distance, Manhattan distance, etc)
Standardize the results (auto-scaling, z-scores, etc)
Build a dendrogram for samples and/or variables
Figure 5 Recommended steps to perform Cluster Analysis. Modified from Mooi and Sarstedt (2011).
ANTIOXIDANT ACTIVITY OF CAMELLIA SINENSIS AND ILEX PARAGUARIENSIS TEAS 1469

PC1 is simply a linear combination of the variables (Johnson
and Wichern, 1998; Rencher, 1998). The following step is to
identify the second principal component (PC2), which is an
orthogonal dimensions to PC1 that has the largest variance.
The procedure continues until all the variance of the original
dataset is explained. The maximum number of principal com-
ponents is the minimum between the number of samples and
the number of variables (Piggott and Sharman, 1986). Princi-
pal components correspond to a new coordinate system in
which variables and samples are projected (Ns et al., 2010).
Dominguez-Perles et al. (2011) evaluated the functional
properties and chemical composition of beverages developed
with organic green tea and broccoli and data were subjected to
linear regression analysis and PCA. Interestingly, authors veri-
fied that the antioxidant capacity measured by the DPPH
method was inversely correlated to the contents of synaptic
acid derivatives (r D ¡0.752; n D 7; p < 0.05), chlorogenic
acid derivatives (r D ¡0.731; n D 7; p < 0.05), total flavo-
noids (r D ¡0.752; n D 7; p < 0.05), and total phenolic com-
pounds (r D ¡0.758; n D 7; p < 0.05), whereas the cathechin
content and the DPPH results were positively correlated (r D0.733; n D 7; p < 0.05). Principal Component Analysis
showed that the first two principal components (PC) explained
up to 90% of the total variability, and the first PC correlated
positively with the total phenolic compounds, chlorogenic
acid derivatives, flavonoids and sinapic acid derivatives, while
the second PC was associated with differences in DPPH scav-
enging capacity and catechins. These variables were correlated
significantly with each other (by using linear correlation) and
the PCA also confirmed the correlation among all variables.
Deetae et al. (2012) evaluated the relationship between
total phenolic compounds and total nonflavonoid compounds,
and the antioxidant capacity measured by the ABTS and
FRAP assays of different types of teas, including green, black,
and oolong teas, by using univariate (Pearson linear correla-
tion) and chemometrics (PCA and HCA). Authors verified that
the antioxidant assays correlated well to the content of pheno-
lic compounds (r > 0.88; n D 18). In addition, by using PCA,
authors were able to explain up to 96% of the total variance in
experimental results. In this analysis, total polyphenolic con-
tent, total flavonoid content, ABTS antioxidant capacity,
FRAP antioxidant capacity, and antiadvanced glycation end-
products were highly correlated to each other and to the first
component of the PCA, suggesting that flavonoids strongly
contributed to the antioxidant capacity of the teas. On the other
hand, total nonflavoniod content and metal chelation capacity
were mainly correlated to the second and third principal com-
ponents, being not correlated to the total antioxidant capacity
of the teas. Meanwhile HCA (using all response variables)
was able to group the teas according to their antioxidant capac-
ity and to characterize stevia tea in the same cluster of green/
black tea, whereas sappan tea was grouped with oolong tea.
When studying the polyphenolic composition of oolong
teas, Wang et al. (2011) used PCA to identify relationships
between 25 samples from different sources. Sample
representation in the three first PC showed that samples could
be divided into three groups: samples from Fujian southern,
samples from Fujian northern and Taiwan, and finally samples
from Guangdong. These results were identical to that obtained
using hierarchical cluster analysis.
Heck et al. (2008) used PCA and multiple linear regression
to study the effect of growing location (forest or plantation),
average annual rainfall, average annual temperature, elevation,
country of origin, and drying method (hot air or wood smoke)
on phenolic concentration of 15 mate teas. The five first PCs
accounted for a total of 85.4% of the total variance of the data.
The first PC was correlated to growing location, whereas the
second component was positively correlated to elevation and
negatively correlated to temperature. Total phenolic concen-
tration was negatively correlated with rainfall. Using multivar-
iate linear regression, the authors showed that plantation
grown mate teas exhibited higher concentration of polyphenols
as compared to forest grown mate teas, which was explained
by the positive effect of sunlight on the synthesis of polyphe-
nolic compounds.
Bassani, Granato e Nunes (2014b) studied the antioxidant
activity measured by the DPPH assay and the total content
of phenolic and flavonoid compounds in commercial teas
(I. paraguariensis and C. sinensis) marketed in Brazil, and
results were subjected to PCA and HCA. PCA was not a suit-
able statistical tool to check for trends in data once no clear
separation among different teas was observed; however, when
HCA data were analyzed, three clusters were generated and
authors concluded that green teas presented the highest DPPH
radical scavenging activity and red, black and white teas pre-
sented the lowest content of antioxidant phenolic compounds.
Statistical Packages Used in Correlation Analyses
In order to analyze experimental data, there are some free
(the well-known is R, and Action for Microsoft Excel) and
commercial statistical packages, such as SAS (Statistical
Analysis Software), SPSS (Statistical Package for Social
Science), Statistica, Statgraphics, Minitab, Design-Expert,
Prisma, among others. Among these, Minitab and Statistica
are the most used packages once both have friendly interface,
although Statistica seems more complete and has a magnific
graphics output. Action software, developed by Brazilian sci-
entists, is also free to download. This software has also sui
graphics output and is the first statistical system that utilizes
the R platform together with Microsoft Excel.
FINAL REMARKS AND PERSPECTIVES
Tea is a recognized source of antioxidant compounds, espe-
cially flavonoids and phenolic acids, and many worldwide sci-
entific groups have studied the bioactivity of different types of
teas, especially the antimutagenic, antioxidant, antimicrobial,
1470 DE OLIVEIRA ET AL.
and antidiabetic activities. In this regard, statistical methods
may be useful to help the analyst to understand how the bio-
logical activity is correlated to the phenolic composition of
tea. The use of univariate linear correlation as formally
determined by the Pearson and Spearman products are the
most widely used and employed in all types of experimen-
tal designs. However, here we presented the importance,
potential applications and examples of researchers who
have associated the antioxidant capacity of teas from Ilex
paraguariensis and Camellia sinensis teas with the pheno-
lic composition (total and individual phenolics) by using
chemometrics. The advantages of using Cluster Analysis
and Principal Component Analysis are related to the visual-
ization of similarities of all samples, in accordance with
previously determined responses, and also to group samples
with similar characteristics. These features are not dis-
played neither provided by using univariate statistics and,
therefore, these multivariate unsupervised statistical meth-
ods should be more frequently used.
REFERENCES
Altman, D. G. (1999). Practical Statistics for Medical Research. Boca Raton:
Chapman & Hall/CRC, 8a ed., 611 pgs.
Ares, G., Barreiro, C. and G�ambaro, A. (2009). Evaluation of antioxidant
extracts from Uruguayan native plants: Importance of sensory characteris-
tics. CyTA—J. Food. 8:201–207.
Alves, C. Q., David, J. M., David, J. P., Bahia, M. V. and Aguiar, R. M. (2010).
Methods for determination of in vitro antioxidant activity for extracts and
organic compounds. Quımica Nova. 33:2202–2210.
Ananingsih, V. K., Sharma, A. and Zhou, W. (2011). Green tea catechins dur-
ing food processing and storage: A review on stability and detection. Food
Res. Int. In Press. DOI: 10.1016/j.foodres.2011.03.004.
Bacquer, D. D., Clays, E., Delanghe, J. and Backer, G. (2006). Epidemiologi-
cal evidence for an association between habitual tea consumption and
markers of chronic inflammation. Atherosclerosis. 189:428–435.
Bassani, D. C., Granato, D., Nunes, D. S. (2014a). Optimization of phenolics
and flavonoids extraction conditions and antioxidant activity of roasted
yerba-mate leaves (Ilex paraguariensis A. St.-Hil., Aquifoliaceae) using
response surface methodology. Annals of the Brazilian Academy of
Sciences, 86(2):923–933.
Bassani, D., Nunes, D. S., Granato, D., (2014b). Quality control of Camellia
sinensis and Ilex paraguariensis teas marketed in Brazil based on total phe-
nolics, flavonoids and free-radical scavenging activity using chemometrics.
In: Daniel Granato; Gaston Ares. (Org.). Mathematical and Statistical
Approaches in Food Science and Technology. 1ed. Oxford: Wiley Black-
well, v. 1, p. 219–230.
Benzie, I. F. F. and Strain, J. J. (1996). The ferric reducing ability of plasma
(FRAP) as a measure of ‘‘antioxidant power’’: The FRAP assay. Anal. Bio-
chem. 239:70–76.
Benzie, I. F., Szeto, Y. T., Strain, J. J. and Tomlinson, B. (1999). Consumption
of green tea causes rapid increase in plasma antioxidant power in humans.
Nutrition and Cancer. 34:83–87.
Bert�e, K. A., Beux, M. R., Spada, P. K. and Hoffmann-Ribani, R. (2011).
Chemical composition and antioxidant activity of Yerba-mate (Ilex para-
guariensis A.St.-Hil., Aquifoliaceae) extract as obtained by spray drying. J.
Agr. Food Chem. 59:5523–5527.
Besten, M. A., Jasinski, V. C. G., Costa, A. G. L. C., Nunes, D. S., Sens, S. L.,
Wisniewski Jr, A., Simionatto, E. L., Riva, D., Dalmarco, J. and Granato, D.
(2012). Chemical composition similarity between the essential oils isolated
from male and female specimens of each five Baccharis species. J. Brazilian
Chem. Soc. 23:1041–1047.
Bogdanski, P., Suliburska, J., Szulinska, M., Stepien, M., Pupek-Musialik, D.
and Jablecka, A. (2012). Green tea extract reduces blood pressure, inflam-
matory biomarkers, and oxidative stress and improves parameters associated
with insulin resistance in obese, hypertensive patients. Nutr. Res. 32:451–
457.
Burns, R. B. and Burns, R. A. (2008). Cluster analysis. In: Business Research
Methods and Statistics Using SPSS, pp. 552–567. SAGE, London.
Butt, M. S. and Sultan, M. T. (2009). Green tea: Nature’s defense against
malignancies. Cri. Rev. Food Sci. Nutr. 49:463–473.
Callegari-Jacques, S. M. (2003). BioestatOstica: PrincOpios e Aplicac~oes.
Artmed, Porto Alegre.
Carloni, P., Tiano, L., Padella, L., Bacchetti, T., Customu, C. and Kay, A.,
Damiani, E. (2012). Antioxidant activity of white, green and black tea
obtained from the same tea cultivar. Food Res. Int. In press. DOI: 10.1016/j.
foodres.2012.07.057
Carter, O., Wang, R., Dashwood, W. M., Orner, G. A., Fischer, K. A.,
Loumlhr, C. V., Pereira, C. B., Bailey, G. S., Williams, D. E. and Dash-
wood, R. H. (2007). Comparison of white tea, green tea, epigallocatechin-3-
gallate, and caffeine as inhibitors of PhIP-Induced colonic aberrant crypts.
Nutr. Cancer. 58:60–65.
Carvalho, M., Jer�onimo, C., Valent~ao, P., Andrade, P. B. and Silva, B. M.
(2010). Green tea: A promising anticancer agent for renal cell carcinoma.
Food Chem. 122:49–54.
Chan, E. W. C., Lim, Y. Y. and Chen, Y. L. (2007). Antioxidant activity of
Camellia sinensis leaves and tea from a lowland plantation in Malaysia.
Food Chem. 102:1214–1222.
Chen, H. L., Yang, M. H. and Wang, C. H. (2001). Green, oolong and black tea
extracts modulate lipid metabolism in hyperlipidemia rats fed high-sucrose
diet. J. Nutr. Biochem. 12:14–20.
Cheng, T. O. (2006). Review. All teas are not created equal: The Chinese
green tea and cardiovascular health. Int. J. Cardiol. 108:301–308.
de Mejia, E. G., Song, Y. S., Ramirez-Mares, M. V. and Kobayashi, H. (2005).
Effect of Yerba mate (Ilex paraguariensis) tea on topoisomerase inhibition
and oral carcinoma cell proliferation. J. Agr. Food Chem. 53:1966–73.
Chen, H., Zhang, M. and Xie, B. (2005). Components and antioxidant activity
of polysaccharide conjugate from green tea. Food Chem. 90:17–21.
Deetae, A., Parichanon, P., Trakunleewatthana, P., Chanseetis, C. and Lertsiri,
S. (2012). Antioxidant and anti-glycation properties of Thai herbal teas in
comparison with conventional teas. Food Chem. 133:953–959.
Deutscher Teeverband. (2011). The German tea market in 2010. Available
from www.teeverband.de. Assessed June 27, 2012.
Dominguez-Perles, R., Moreno, D. A., Carvajal, M. and Garcia-Viguera, C.
(2011). Composition and antioxidant capacity of a novel beverage produced
with green tea and minimally-processed byproducts of broccoli. Innovat.
Food Sci. Emerg. Technol. 12:361–368.Dudonn�e, S., Vitrac, X., Coutiere, P., Woillez, M. and M�erillon, J. M. (2009).
Comparative study of antioxidant properties and total phenolic content of
30 plant extracts of industrial interest using DPPH, ABTS, FRAP, SOD and
ORAC assays. J. Agr. Food Chem. 57:1768–1774.Ellison, S. L. R., Barwick, V. J. and Farrant, T. J. D. (2009). Practical Statistics
for the Analytical Scientist—A Bench Guide. RSC Publishing, Cambridge.
Filip, R., Lotito, S. B., Ferraro, G. and Fraga, C. (2000). Antioxidant activity of
Ilex paraguariensis and related species. Nutr. Res. 20:1437–144.
Formann, A. K. (1984). Die Latent-Class-Analyse: Einf€uhrungin die Theorie
und Anwendung. Weinheim: Beltz.
Granato, D., Calado, V. M. A., & Jarvis, B. (2014). Observations on the use of
statistical methods in food science and technology. Food Res. Int., 55:137–
149.
Granato, D., Castro, I. A., Ellendersen, L. S. N. and Masson, M. L. (2010a).
Physical stability assessment and sensory optimization of a dairy-free emul-
sion using response surface methodology. J. Food Sci. 75:149–155.Granato, D., Katayama, F. C. U. and Castro, I. A. (2010b). Assessing the asso-
ciation between phenolic compounds and the antioxidant activity of Brazil-
ian red wines using chemometrics. LWT Food Sci. Technol. 43:1542–1549.
ANTIOXIDANT ACTIVITY OF CAMELLIA SINENSIS AND ILEX PARAGUARIENSIS TEAS 1471

Granato, D., Katayama, F. C. U. and Castro, I. A. (2011). Phenolic composi-
tion of South American red wines classified according to their antioxidant
activity, retail price and sensory quality. Food Chem. 129:366–373.
Grujic, N., Lepojevic, Z., Srdjenovic, B., Vladic, J. and Sudji, J. (2012).
Effects of different extraction methods and conditions on the phenolic com-
position of mate tea extracts.Molecules. 17:2518–2528.
Halliwell, B. and Gutteridge, J. M. C. (2006). Free Radicals in Biology and
Medicine. Clarendon Press: Oxford.
Hara, Y. (2001). Green Tea: Health Benefits and Applications. Marcel Dekker,
New York.
Hartwig, V. G., Brumovsky, L. A., Fretes, R. M. and Boado, L. S. (2012). A
novel procedure to measure the antioxidant capacity of Yerba mat�e extracts.
Cien. Tec. Alim. 32:126–133.
Heck, C. I. and de Mejia, E. G. (2007). Yerba mate tea (Ilex paraguariensis): A
comprehensive review on chemistry, health implications, and technological
considerations. J. Food Sci. 72:R138–R151.
Heck, C. I., Schmalko, M. and Gonzalez de Mejia, E. (2008). Effect of grow-
ing and drying Conditions on the phenolic composition of mate teas (Ilex
paraguariensis). J. Agr. Food Chem. 56:8394–8403.
Higdon, J. V. and Frei, B. (2003). Tea catechins and polyphenols: Health
effects, metabolism, and antioxidant functions. Cri. Rev. Food Sci. Nutr.
43:89–143.
Hilal, Y. and Engelhardt, U. (2007). Characterization of white tea – Compari-
son to green and black tea. J. Verbr. Lebensm. 2:414–421.
Huang, D., Ou, B. and Prior, R. L. (2005). The chemistry behind antioxidant
capacity assay. J. Agr. Food Chem. 53:1841–1856.
Huang, W. Y., Davidge, S. T. and Wu, J. (2013). Bioactive natural constituents
from food sources—potential use in hypertension prevention and treatment.
Cri. Rev. Food Sci. Nutr. 53(6):615–630.
Huang, D. J., Ou, B. X., Hampsch-Woodill, M., Flanagan, J. A. and Prior, R. L.
(2002). High-throughput assay of oxygen radical absorbance capacity (ORAC)
using a multichannel liquid handling system coupled with a microplate fluores-
cence reader in 96-well format. J. Agr. Food Chem. 50:4437–4444.
Jacobsen, T. and Gunderson, R. W. (1986). Applied cluster analysis. In: Statis-
tical Procedures in Food Research, pp. 361–408. Elsevier Applied Science,
J.R. Piggott: New York.
Jayasekera, S., Molan, A. L., Garg, M. and Moughan, P. J. (2011). Variation in
antioxidant potential and total polyphenol content of fresh and fully-fer-
mented Sri Lankan tea. Food Chem. 125:536–541.
Johnson, R. A. and Wichern, D. W. (1988). Applied Multivariate Statistical
Analysis. Prentice—Hall, Englewood Cliffs, New Jersey.
Kawai, Y., Tanaka, H., Murota, K., Naito, M. and Terao, J. (2008). Epicate-
chin gallate accumulates in foamy macrophages in human atherosclerotic
aorta: Implication in the anti-atherosclerotic actions of tea catechins. Bio-
chem. Biophys. Res. Commun. 374:527–532.
Kerio, L. C., Wachira, F. N., Wanyoko, J. K. and Rotich, M. K. (2013). Total
polyphenols, catechin profiles and antioxidant activity of tea products from
purple leaf coloured tea cultivars. Food Chem. 136:1405–1413.
Kim, Y., Goodner, K. L., Park, J. D., Choi, J. and Talcott, S. T. (2011). Changes
in antioxidant phytochemicals and volatile composition of Camellia sinensis
by oxidation during tea fermentation. Food Chem. 129:1331–1342.
Kiselova, Y., Ivanova, D., Chervenkov, T., Gerova, D., Galunska, B. and Yan-
kova, T. (2006). Correlation between the in vitro antioxidant activity and
polyphenol content of aqueous extracts from Bulgarian herbs. Phytotherapy
Res. 20:961–5.
Kodama, D. H., Goncalves, A. E. S., Lajolo, F. M. and Genovese, M. I. (2010).
Flavonoids, total phenolics and antioxidant capacity: Comparison between
commercial green tea preparations. Cien. Tec. Alim.. 30:1077–1082.
Kuroda, Y. and Hara, Y. (1999). Antimutagenic and anticarcinogenic activity
of tea polyphenols.Mutat. Res./Rev. Mutat. Res. 436:69–97.
Leung, L. K., Su, Y., Chen, R., Zhang, Z., Huang, Y. and Chen, Z. Y. (2001).
Theaflavins in black tea and catechins in green tea are equally effective anti-
oxidants. J. Nutr. 131:2248–2251.
Li, H.,Wang, X., Li, Y., Li, P. andWang, H. (2009). Polyphenolic compounds and
antioxidant properties of selected China wines.Food Chem. 112:454–460.
Luximon-Ramma, A., Bahorun, T., Crozier, A., Zbarsky, V., Datla, K. P., Dex-
ter, D. T. and Aruoma, O. I. (2005). Characterization of the antioxidant
functions of flavonoids and proanthocyanidins in Mauritian black teas.
Food Res. Int. 38:357–367.
Macedo, L. F. L., Rogero, M. M., Guimar~aes, J. P., Granato, D., Lobato, L. P.,
Castro, I. A. (2013). Effect of red wines with different in vitro antioxidant activ-
ity on oxidative stress of high-fat diet rats.Food Chemistry. 137:122–129.
Manzocco, L., Anese, M. and Nicoli, M. C. (1988). Antioxidant properties of
tea extracts as affected by processing. LWT - Food Sci. Technol. 31:694–
698.
Mardia, K. V., Kent, J. T. and Bibby, J. M. (1979). Multivariate Analysis. Aca-
demic Press, New York.
Mejıa, E. G., Song, Y. S., Heck, C. I. and RamOrez-Moraes, M. V. (2010).
Yerba mate tea (Ilex paraguariensis): Phenolics, antioxidant capacity and in
vitro inhibition of colon cancer cell proliferation. J. Funct. Foods. 2:23–34.
Miller, A. R., Scheerens, J. C., Tulio Jr., A. Z., Reese, R. N. and Ozgen, M.
(2006) Modified 2,2-azino-bis-3-ethylbenzothiazoline-6-sulfonic acid
(ABTS) method to measure antioxidant capacity of selected small fruits and
comparison to ferric reducing antioxidant power (frap) and 2,20-diphenyl-1-picrylhydrazyl (DPPH) methods. J. Agr. Food Chem. 54:1151–1157.
Moderno, P. M., Carvalho, M. and Silva, B. M. (2009). Recent patents on
Camellia sinensis: Source of health promoting compounds. Recent Patents
Food, Nutr. Agr. 1:182–192.
Mooi, E. and Sarstedt, M. (2011). A Concise Guide to Market Research. 1st ed,
p. 308, Springer-Verlag, Berlin Heidelberg,
Næs, T., Brockhoff, P. B. and Tomic, O. (2010). Statistics for Sensory and
Consumer Science. John Wiley and Sons, Chichester.
Naithani, V., Nair, S. and Kakkar, P. (2006). Decline in antioxidant capacity of
Indian herbal teas during storage and its relation to phenolic content. Food
Res. Int. 39:176–181.
NationMaster. (2012). Tea consumption. Available from http://www.
nationmaster.com/graph/foo_tea_con-food-tea-consumption. Assessed June
27, 2012).
Oxfam. (2002). The tea market: A background study. Available from http://
www.maketradefair.com/assets/english/TeaMarket.pdf. Assessed July 11, 2012.
Pekal, A., Dr�o _zd _z, P., Biesaga, M. and Pyrzynska, K. (2012). Polyphenolic
content and comparative antioxidant capacity of flavoured black teas. Int. J.
Food Sci. Nutr. 63(6):742–748.
Piggott, J. R. and Sharman, K. (1986). Methods to aid interpretation of multidi-
mensional data. In: Statistical Procedures in Food Research, pp. 181–232.
Elsevier Applied Science, J.R. Piggott, New York.
Prakash, K. M. and Tan, E. K. (2011). Clinical evidence linking coffee and tea
intake with Parkinson’s disease. Basal Ganglia. 1:127–130.
Prior, R. L., Wu, X. and Schaich, K. (2005). Standard methods for the determi-
nation of antioxidant capacity and phenolics in foods and dietary supple-
ments. J. Agr. Food Chem. 53:4290–4302.
Ramirez-Mares, M. V., Chandra, S. and de Mejia, E. G. (2004). In vitro
chemopreventive activity of Camellia sinensis, Ilex paraguariensis and
Ardisia compressa tea extracts and selected polyphenols. Mut. Res. 554:
53–65.
Re, R., Pellegrini, N., Proteggente, A., Pannala, A., Yang, M. and Rice-Evans,
C. (1999). Antioxidant activity applying an improved ABTS radical cation
decolorization assay. Free Radical Biol. Med. 26:1231–1237.
Rencher, A. C. (1998). Multivariate Statistical Inference and Applications.
John Wiley and Sons, New York.
Rufino, M. S. M., Alves, R. E., Brito, E. S. Morais, S. M., Sampaio, C. G.,
P�erez-Jim�enez, J. and Saura-Calixto, F. D. (2006). Metodologia cientOfica:
Determinac~ao da atividade antioxidante total em frutas pelo m�etodo de
reduc~ao do ferro. Fortaleza: Embrapa Agroind�ustria Tropical. (Embrapa
Agroind�ustria Tropical. Comunicado T�ecnico, 125).
Rufino, M. S. M., Alves, R. E., Brito, E. S. Morais, S. M., Sampaio, C. G.,
P�erez-Jim�enez, J. and Saura-Calixto, F. D. (2007a). Metodologia cientOfica:
Determinac~ao da atividade antioxidante total em frutas pela captura do radi-
cal livre DPPH. Fortaleza: Embrapa Agroind�ustria Tropical. (Embrapa
Agroind�ustria Tropical. Comunicado T�ecnico, 125).
1472 DE OLIVEIRA ET AL.

Rufino, M. S. M., Alves, R. E., Brito, E. S. Morais, S. M., Sampaio, C. G.,
P�erez-Jim�enez, J. and Saura-Calixto, F. D. (2007b). Metodologia cientOfica:
Determinac~ao da atividade antioxidante total em frutas pela captura do radi-
cal livre ABTSC. Fortaleza: Embrapa Agroind�ustria Tropical. (Embrapa
Agroind�ustria Tropical. Comunicado T�ecnico, 128).
Samaniego-S�anchez, C., Inurreta-Salinas, Y., Quesada-Granados, J. J., Blanca-Herrera, R., Villal�on-Mir, M., L�opez-GarcOa de la Serrana, H. and L�opez
MartOnez, M. C. (2011). The influence of domestic culinary processes on
the Trolox equivalent antioxidant capacity of green tea infusions. J. Food
Composit. Anal. 24:79–86.
Schinella, G., Fantinelli, J. C., Tournier, H., Prieto, J. M., Spegazzini, E.,
Debenedetti, S. and Mosca, S. M. (2009). Antioxidant and cardioprotective
effects of Ilex brasiliensis: A comparative study with Ilex paraguariensis
(Yerba mate). Food Res. Int. 42:1403–1409.
Sharma, O. P. and Bhat, T. K. (2009). DPPH antioxidant assay revisited. Food
Chem. 113:1202–1205.
Silva, E. L., Neiva, T. J. C., Shirai, M., Terao, J. and Abdalla, D. S. P. (2008).
Acute ingestion of Yerba mate infusion (Ilex paraguariensis) inhibits
plasma and lipoprotein oxidation. Food Res. Int. 41:973–979.
Singleton, V. L. and Rossi Jr, J. A. (1965). Colourimetry of total phenolics
with phosphomolybdic–phosphotungstic acid reagent. Amer. J. Enol. Viti-
cult. 16:144–158.
Snedecor, G. W. and Cochran, W. G. (1980). Statistical Methods. Iowa State
University Press, Ames, Iowa.
Song, L., Wang, X., Zheng, X. and Huang, D. (2011). Polyphenolic antioxi-
dant profiles of yellow camellia. Food Chem. 129:351–357.
Song, R., Kelman, D., Johns, K. L. and Wright, A. D. (2012). Correlation
between leaf age, shade levels, and characteristic beneficial natural constituents
of tea (Camellia sinensis) grown in Hawaii. Food Chem. 133:707–714.
Sousa, C. M. M., Silva, H. R., Vieira Jr., G.M., Ayres, M. C. C., Costa, C. L.
S., Ara�ujo, D. S., Cavalcante, L. C. D., Barros, E. D. S., Ara�ujo, P. B. M.,
Brand~ao, M. S. and Chaves, M. H. (2007). Total phenolics and antioxidant
activity of five medicinal plants. Quımica Nova. 30:351–355.
Steele, V. E., Kelloff, G. J., Balentine, D., Boone, C. W., Mehta, R., Bagheri,
D., Sigman, C. C., Zhu, S. and Sharma, S. (2000). Comparative chemo-
preventive mechanisms of green tea, black tea and selected polyphenol
extracts measured by in vitro bioassays. Mol. Epidemiol. Cancer Prev.
21:63–67.
Tan, P. N., Steinbach, M. and Kumar, V. (2005). Introduction to Data Mining.
Addison-Wesley, Upper Saddle River, New Jersey.
Tijburg, L. B. M., Mattern, T., Folts, J. D., Weisgerber, U. M. and Jatan, M. B.
(1997). Tea flavonoids and cardiovascular diseases: A review. Cri. Rev.
Food Sci. Nutr. 37:771–785.
Vinson, J. A. (2000). Black and green tea and heart disease: A review. Biofac-
tors. 13:127–132.
Wang, Y., Huang, S., Shao, S., Qian, L. and Xu, P. (2012). Studies on bioactiv-
ities of tea (Camellia sinensis L.) fruit peel extracts: Antioxidant activity
and inhibitory potential against a-glucosidase and a-amylase in vitro. Ind.
Crops Products. 37:520–526.
Wang, Y., Li, Q., Wang, Q., Li, Y., Ling, J, Liu, L., Chen, X. and Bi, K.
(2011). Simultaneous determination of seven bioactive components in
oolong tea Camellia sinensis: Quality control by chemical composition and
HPLC fingerprints. J. Agr. Food Chem. 60:256–260.
Wu, C. D. and Wei, G. X. (2002). Tea as a functional food for oral health.
Nutr. Oral Health. 18:443–444.
Xu, R., Sun, H. Y. Y., Tu, Y. and Zeng, X. (2012). Preparation, preliminary
characterization, antioxidant, hepatoprotective and antitumor activities of
polysaccharides from the flower of tea plant (Camellia sinensis). Food
Chem. Toxicol. 50:2473–2480.
Yang, J. and Liu, R. H. (2013). The phenolic profiles and antioxidant activity
in different types of tea. Int. J. Food Sci. Technol. 48(1):163–171.
Yen, G. C. and Chen, H. Y. (1994). Comparison of antimutagenic effect of var-
ious tea extracts (Green, Oolong, Pouchong, and Black Tea). J. Food Pro-
tect. 57:54–58.
Zenbio. (2008). Instruction manual: ORAC antioxidant assay kit. Available
from http://www.zen-bio.com. Assessed: July 11, 2012).
Zielinski, A. A. F., Alberti, A., Braga, C. M., Silva, K. M., Canteri, M. H. G.,
Mafra, L. I., Granato, D., Nogueira, A., & Wosiacki, D. (2014b). Effect of
mash maceration and ripening stage of apples on phenolic compounds and
antioxidant power of cloudy juices: A study using chemometrics. LWT -
Food Sci. Tech., 57(1):223–229.
Zielinski, A. A. F., Haminiuk, C. W. I., Alberti, A., Nogueira, A., Demi-
ate, I. M., & Granato, D. (2014a). A comparative study of the phenolic
compounds and the in vitro antioxidant activity of different Brazilian
teas using multivariate statistical techniques. Food Res. Int.
60:246–254.
ANTIOXIDANT ACTIVITY OF CAMELLIA SINENSIS AND ILEX PARAGUARIENSIS TEAS 1473