Embed Size (px)
Citation preview

BGC PARTNERS, INC. NASDAQ: BGCP
4Q 2013 GENERAL INVESTOR PRESENTATION

Date
DISCLAIMER
Discussion of Forward-Looking Statements by BGC Partners Statements in this document regarding BGC Partners’ business that are not historical facts are "forward-looking statements" that involve risks and uncertainties. Except as required by law, BGC undertakes no obligation to release any revisions to any forward-looking statements. For a discussion of additional risks and uncertainties, which could cause actual results to differ from those contained in the forward-looking statements, see BGC’s Securities and Exchange Commission filings, including, but not limited to, the risk factors set forth in our public filings, including our most recent Form 10-K and any updates to such risk factors contained in subsequent Form 10-Q or Form 8-K filings. Note Regarding Financial Tables and Metrics Excel files with the Company’s quarterly financial results and metrics from full year 2008 through 3Q2013 are accessible in the various financial results press releases at the “Investor Relations” section of http://www.bgcpartners.com. They are also available directly at ir.bgcpartners.com/news-releases/news-releases. “Newmark Grubb Knight Frank” is synonymous in this release with “NGKF” or “Real Estate Services.” On June 28, 2013, BGC sold its fully electronic trading platform for benchmark U.S. Treasury Notes and Bonds to NASDAQ OMX Group, Inc. For the purposes of this document, the assets sold are referred to as “eSpeed.” Distributable Earnings This presentation should be read in conjunction with BGC’s most recent financial results press release. Unless otherwise stated, throughout this presentation we refer to our results only on a distributable earnings basis. For a complete description of this term and how, when and why management uses it, see the penultimate page of this presentation. For both this description and a reconciliation to GAAP, see the sections of BGC’s most recent financial results press release entitled “Distributable Earnings Defined”, “Differences Between Consolidated Results for Distributable Earnings and GAAP”, and “Reconciliation of GAAP Income to Distributable Earnings”, which are incorporated by reference, and available in the “Investor Relations” section of our website at http://www.bgcpartners.com. Adjusted EBITDA See the sections of BGC’s most recent financial results press release titled “Adjusted EBITDA Defined” and “Reconciliation of GAAP Income to Adjusted EBITDA (and Comparison to Pre-Tax Distributable Earnings)”. © 2013 BGC Partners, Inc. All rights reserved.
2

GENERAL OVERVIEW

Date
4
SOLID BUSINESS WITH SIGNIFICANT OPPORTUNITIES
Two segments: Financial Services & Real Estate Services
Diversified revenues by geography & product category
Value of assets of the Company not fully understood by the market
Accretively hiring and acquiring while reducing overall expense base
Growing fully electronic trading
Intermediary-oriented, low-risk business model
Deep and experienced management team with ability to attract and retain key talent
Attractive ≈9%1 dividend yield; current dividend expected to be maintained for the
foreseeable future.
1. BGCP dividend yield calculated based on closing stock price at 9/30/2013

Date
1 FIRM, 2 SEGMENTS, 3 BUSINESSES
5
Key products include: • Sales • Leasing • Valuation • Property & Facilities
Management • Capital Raising
887 brokers & salespeople In 40+ cities
Key products include: • Rates • Credit • Foreign Exchange • Equities
1,545 brokers & salespeople ≈ 200 Financial desks In 20+ cities
Real Estate Services
Fully Electronic Voice/Hybrid
Key products include: • Interest Rate Derivatives • Credit • FX • Off-the-Run UST • European & Canadian
Government Bonds • Market Data • Software Solutions
Proprietary network connected to the global financial community
Substantial investments in creating proprietary technology / network
In 20+ cities
Financial Services
TTM
Rev ≈ $554 MM Pre-Tax Margin ≈ 8%
TTM Rev $80 MM
Pre-Tax Margin ≈ 43%
TTM
Rev $1,023 MM Pre-Tax Margin ≈ 10%
Note: “TTM” = Trailing Twelve Months ended 9/30/2013. Before Corporate items. Fully Electronic excludes eSpeed; including eSpeed, technology-based revenues were ≈ $149 MM with a pre-tax margin of ≈ 50%.
Commercial Real Estate

Date
3Q 2013 GLOBAL REVENUE BREAKDOWN
Americas Revenue down 4% Y-o-Y, excluding eSpeed (including eSpeed Americas Revenue down 14%)
Europe, Middle East & Africa Revenue up 5% Y-o-Y Asia Pacific Revenue down 16% Y-o-Y
New York Paris
Hong Kong London
Singapore
EMEA 41.0%
Americas 48.6%
APAC 10.4%
3Q2013 Revenues
Real Estate seasonally strongest in 4th Quarter IDBs seasonally strongest in 1st Quarter
Note: percentages may not sum to 100% due to rounding.
6

Date
3Q 2013 SEGMENT DATA
7
3Q2013 Revenues 3Q2013 Revenues Pre-tax Earnings
Pre-tax Margin
Financial $256.7 $29.7 11.6%
Real Estate $148.1 $15.5 10.5%
Corporate $9.6 ($7.8) NMF
In USD millions
Excluding eSpeed, Financial Service revenues down 4.9% Y-o-Y Real Estate seasonally strongest in 4Q IDBs seasonally strongest in 1Q
3Q2012 Revenues Pre-tax Earnings
Pre-tax Margin
Financial $292.6 $44.2 15.1%
Real Estate $141.1 $16.1 11.4%
Corporate $12.0 ($13.6) NMF
Financial Services
62.0%
Real Estate Services
35.7%
Corporate 2.3%
In USD millions

Date
STRONG RECORD OF SUCCESSFUL, ACCRETIVE ACQUISITIONS
(a) BGC acquired Marex Financial’s emerging markets business. (b) BGC acquired various assets and businesses of Mint Partners and Mint Equities. (c) BGC acquired all of the outstanding shares of Newmark & Company Real Estate, Inc., which operates as “Newmark Knight Frank” in the United States and is associated with London-based Knight Frank. (d) BGC acquired substantially all the assets of Grubb & Ellis.
8
Singapore OTC Energy
Radix Energy
London Mainly Equities, also
Credit ~100 brokers
Mint Partners/ Mint Equities (b)
Across U.S. 425 Brokers Commercial RE
Newmark Knight Frank (c)
Brazil 70 brokers FX and Rates
Liquidez London, Johannesburg
Equity derivatives emerging markets
Marex Financial (a)
~75 brokers in Paris Equity derivatives
Aurel Leven
New York, London and Tokyo
Rates ~325 brokers
Maxcor / Eurobrokers
Across U.S. Property & Facilities
Management Commercial RE ≈ 400 brokers
Grubb & Ellis (d)
Across U.S. Municipal Bonds
Wolfe & Hurst
2013 2005 2006 2007 2008 2009 2010 2011 2012
70 Brokers in Paris Rates, Credit
ETC Pollock
Istanbul Turkish equities and
electronic bonds
AS Menkul
Paris Credit, Swaps
Ginalfi
Denver Commercial RE
Frederick Ross
Philadelphia Commercial RE
Smith Mack
U.K. Rates
Sterling
Real Estate
Financial Services
Key

Date
ESPEED TRANSACTION DETAILS
9
1. Delivery of Nasdaq OMX shares are contingent upon Nasdaq OMX, as a whole, producing at least $25MM per annum in gross revenues. Because of this low earn-out, we expect to receive 100% of current shares receivable.
Please see the BGC 8-K dated 7/01/2013 in the Investor Relations section of our website for complete announcement details.
On June 28, 2013 BGC completed the sale of its fully electronic trading platform for U.S. Treasury Notes and Bonds ("eSpeed") to the NASDAQ OMX Group, Inc.
eSpeed platform generated $99 million in revenues for BGC in 2012, less than 6% of overall revenues.
The purchase price included $750 million in cash, plus approximately 14.9 million shares of NASDAQ OMX common stock to be paid ratably over 15 years.1 Expected value as of 11/14/2013 was approximately $554 million.
BGC retained all other voice, hybrid, and fully electronic trading, market data, and
software businesses, including voice, hybrid and electronic brokerage of off-the-run U.S. Treasuries, as well as Treasury Bills, Treasury Swaps, Treasury Repos, Treasury Spreads, and Treasury Rolls.
Our remaining technology-based businesses in BGC’s Financial Services segment had a 20% CAGR from December 31, 2010 – September 30, 2013.

Date
QUANTITATIVE EASING CONTINUES TO BENEFIT REAL ESTATE, BUT TEMPER RATES VOLUMES
Source: Bloomberg
10

FINANCIAL SERVICES SEGMENT OVERVIEW

Date
12
A LEADING INTER-DEALER BROKER (PRE DODD-FRANK ACT)
Note: Incremental margin estimates based on BGC’s historical financial performance.
Banks Trading Firms I-Banks
Corporations Investors Governments
Corporations Investors Governments
Banks Trading Firms I-Banks

Date
U.S. OTC DERIVATIVES MARKET (POST DODD-FRANK)
On October 2, 2013, BGC Derivative Markets, LP began operating our Swap Execution Facility as prescribed by the Dodd-Frank Act.
The new model of Swap trading will not take effect until the first quarter of 2014 and the SEF
volumes to date are not indicative of the overall industry results or outlook.
13

Date
Rates43%
Credit21%
Foreign exchange
18%
Equities and other asset
classes14%
Market data, Software &
Other4%
WELL DIVERSIFIED FINANCIAL SERVICES SEGMENT
14
TTM Rev $1,172MM, TTM Pre-tax margin ≈16%
Rates
Credit
FX
Equities & Other (shipping, energy, etc)
Market data, Software & Other
Both cash & derivatives across asset classes
% of 3Q 2013 Segment Revenues Overview
Long-term:
Growth of fully electronic trading
Dodd-Frank compliant trading
Corporate & other issuance
Near-term:
Eliminated less profitable brokers
Lower industry volumes & volatility
Regulatory uncertainty in the U.S.
Drivers
Note: “TTM” = Trailing Twelve Months ended 9/30/2013
Fully electronic notional volumes and revenues have been normalized to exclude eSpeed activity
Financial Services Revenue
-
20,000
40,000
60,000
80,000
100,000
120,000
140,000
Market data, Software & Other
Equities and other asset classes
Foreign exchange
Credit
Rates
Y-o-Y Change (4.7) % ex. eSpeed

Date
VOLATILITY LEVELS TRENDING BELOW HISTORICAL AVERAGE
Interest rate and foreign exchange volatilities based on the annualized standard deviation of daily price returns. Source: FactSet, Bloomberg, Credit Suisse data as of 11/11/2013.
15

Date
16
SIGNIFICANT LEVERAGE POSSIBLE THROUGH SCALE AND TECHNOLOGY
Hybrid Brokerage:
Hire and Acquire
Market Data & Software:
Distribute
Fully Electronic:
Convert
Pre-Tax Distributable Earnings Contribution
30%
Incremental
Margin
60%
or More
Incremental
Margin
45-75%
Incremental
Margin
Note: Incremental margin estimates based on BGC’s historical financial performance.

Date
3Q13 ≈ 110 OUT OF 200 DESKS OFFER FULLY ELECTRONIC TRADING VS. ≈ 40 AT BEG. OF 2010 & ≈ 20 AT BEG. OF 2008
NEW
PRO
DU
CT
S
Phone Prices Screen Prices and Streaming Prices
VOLU
ME G
ROW
TH
VOICE HYBRID FULLY ELECTRONIC
Money Markets Property Derivatives Exotic IR & FX Options Commodity Derivatives Shipping Commodities USD & EUR Sovereigns New Issue Securities Commercial Real Estate European Power Precious Metal ETFs
UST Curve Swaps UST Off-the-Runs Equity Derivatives (Global) Emerging Market Bonds Japanese Corporates Convertible Bonds US Cash Bonds Asset Backed Securities
Spot FX ELX-CME Basis Swaps Futures Routing Canadian Sovereigns Sovereign CDS CDS Indices (Global)
Cash Equities Basis Swaps Floating Rate Notes Base Metals Covered Bonds
TIPS and Inflation Swaps Repos FX Options Corporates (EU & Aust.) APAC Sovereigns Single-Name CDS (Global) IRS (multiple currencies) IR Options (multiple
currencies) Non-deliverable Forwards Metals Options European Govt Bonds
Note: The above is only a partial list.
17

Date
Voice/Hybrid 93.1%
RetainedTech***
6.9%
18
BGC'S RETAINED TECH - HIGHER MARGINS AND FASTER GROWTH
Technology-Based Products** grew at a CAGR of 20% from 2010 to 3Q13
*For the purposes of this analysis, the assets sold to NASDAQ OMX are referred to as “eSpeed.” **Technology-Based Products = fully electronic brokerage, fees from related parties related to fully electronic trading, market data, and software solutions. *** Retained Tech = businesses remaining with BGC post-eSpeed transaction. Note: These figures are those recorded in the Financial Services segment and exclude those revenues and expenses included in corporate items.
Pre-tax margin ≈ 45%

Date
LARGE BANKS AND IDBS EXPECTED TO GROW ELECTRONIC TRADING INDUSTRY-WIDE
Estimates per McKinsey, Oliver Wyman, Greyspark, JP Morgan
19
7055-65
40-50 4030
758065-75
60 6050
85
CDS Index FX Spot European Govt Bonds
Precious Metals
U.S. Treasuries Cash Equities
2012
2015 estimate
Industry Fully Electronic Trading Volumes (%) by Asset Class

REAL ESTATE SEGMENT OVERVIEW

Date
BUSINESS OVERVIEW: REAL ESTATE SERVICES
21
Leasing Advisory Global Corporate Services Retail Services Property & Facilities Management Consulting Program and Project Management Industrial Services Valuation Property Sales Capital Markets (Includes: Debt & Equity Raising, Mortgage)
Real Estate Services Revenue
% of 3Q 2013 Total Distributable Earnings Revenue Example of Products
BGC’s Real Estate segment continues to grow and now comprises a larger percentage of revenues than ever
Superior yields in low interest rate environment continue to make Real Estate a more attractive investment class
Excluding non-core Grubb & Ellis purchased assets, NGKF brokerage revenues were up 10.5% Y-o-Y
Drivers
Sources: Newmark Grubb Knight Frank, Real Capital Analytics, Moody’s and CoStar.
(USD
Mill
ions
)
Q3 2012 Q3 2013 Q3 2012 Q3 2013
$101.3 $107.5 $96.1 $106.2
$39.8 $40.6 $39.8 $40.6
Management Services
Real Estate Brokerage
Incl. G&E Non-Core Assets
Ex. G&E Non-Core Assets
$141.1 $148.1 $135.9 $146.8

Date
7.35%
7.20%
7.10%
7.00%
6.80%
2.00%
2.90%
6.50%
6.60%
6.70%
6.80%
6.90%
7.00%
7.10%
7.20%
7.30%
7.40%
0.00%
0.50%
1.00%
1.50%
2.00%
2.50%
3.00%
3.50%
3Q13 4Q13 1Q14 2Q14 3Q14
U.S. Economic Forecast Unemployment Rate Real GDP Growth
ECONOMIC RECOVERY FORECASTED TO CONTINUE INTO 2014
Source: Bloomberg (consensus estimates)
Improving U.S. economic conditions should continue to provide tailwinds for our Real Estate business
Rea
l GD
P G
row
th
Une
mpl
oym
ent R
ate
22

Date
COMMERCIAL REAL ESTATE YIELDS REMAIN ATTRACTIVE
Cap rates remain well above 10-year UST yields Recent jump in 10-year U.S. Treasury yields reduces spread as cap rates remain steady Rising rates will have less impact on Institutional & Other all cash/low leverage buyers Debt & equity capital continues to chase CRE in low interest rate environment
0
100
200
300
400
500
600
0%
2%
4%
6%
8%
10%
12%
'06 '07 '08 '09 '10 '11 '12 '13
Spre
ad (b
asis
poi
nts)
Cap
Rat
e &
10-
year
Yie
ld
10-yr. Yield Cap Rate Spread
23
Date
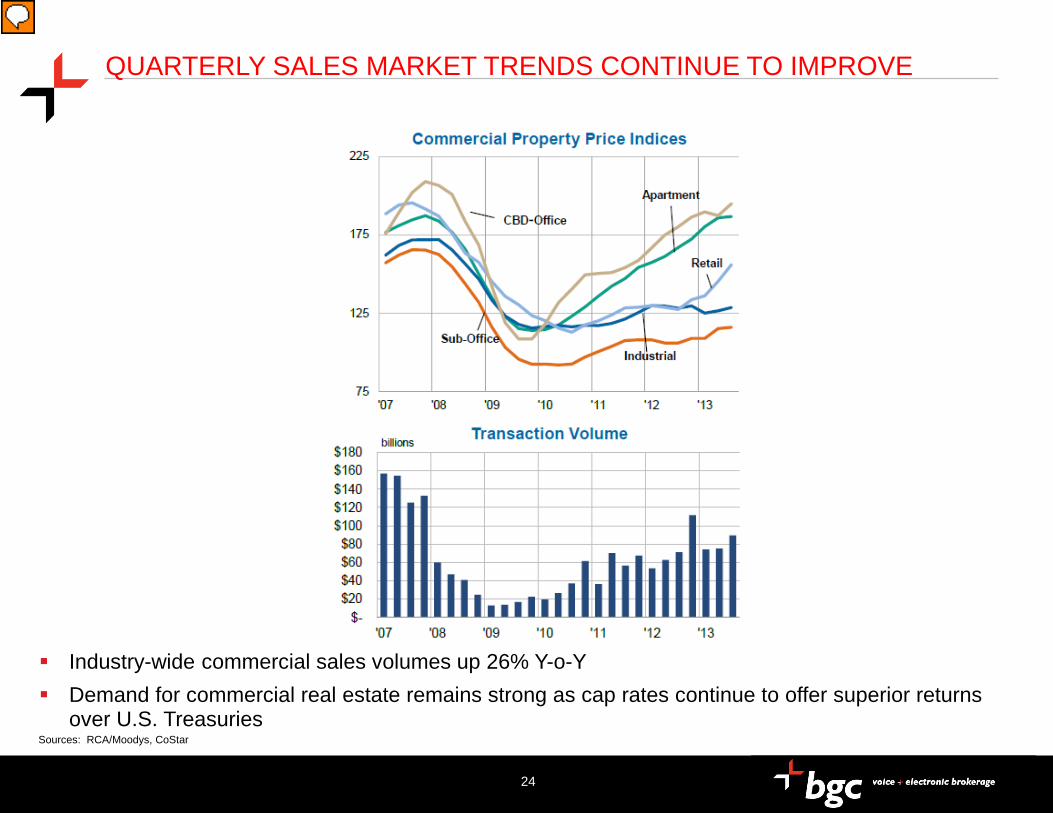
QUARTERLY SALES MARKET TRENDS CONTINUE TO IMPROVE
24
Sources: RCA/Moodys, CoStar
Industry-wide commercial sales volumes up 26% Y-o-Y Demand for commercial real estate remains strong as cap rates continue to offer superior returns
over U.S. Treasuries

Date
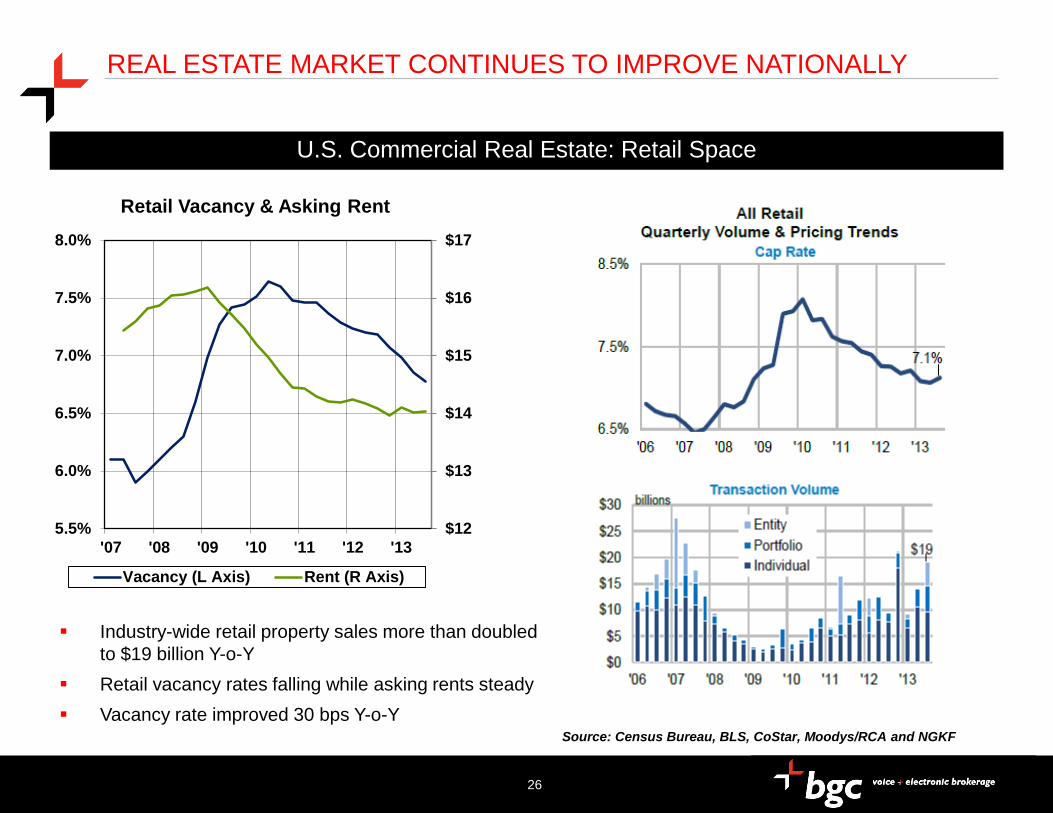
REAL ESTATE MARKET CONTINUES TO IMPROVE NATIONALLY
25
U.S. Commercial Real Estate: Office Space
Commercial office sales volumes up 36% Y-o-Y Office asking rent up ~2% Y-o-Y nationally Vacancy rates improved 70 bps Y-o-Y Cap rates up off pre-recession lows
$24
$25
$26
$27
$28
10%
12%
14%
16%
18%
'07 '08 '09 '10 '11 '12 '13
Office Vacancy & Asking Rent
Vacancy (L Axis) Rent (R Axis)
Source: Census Bureau, BLS, CoStar , Moodys/RCA and NGKF
Date
REAL ESTATE MARKET CONTINUES TO IMPROVE NATIONALLY
$12
$13
$14
$15
$16
$17
5.5%
6.0%
6.5%
7.0%
7.5%
8.0%
'07 '08 '09 '10 '11 '12 '13
Retail Vacancy & Asking Rent
Vacancy (L Axis) Rent (R Axis)
Industry-wide retail property sales more than doubled to $19 billion Y-o-Y
Retail vacancy rates falling while asking rents steady Vacancy rate improved 30 bps Y-o-Y
U.S. Commercial Real Estate: Retail Space
Source: Census Bureau, BLS, CoStar, Moodys/RCA and NGKF
26

Date
Times Square Building:Represented AFI USA in the sale of the office condominium, formerly the New York Times headquarters building to Blackstone
FURTHER GROWTH FOR NGKF
27
The market has lacked a third top-tier firm in the United States
$20B+ U.S. market (brokerage only). Top 5 firms have approx. 30% market share
BGC and its affiliates have very strong financial services industry connections – financial services industry is the largest user of leased space and most active buyers/sellers by far
We are still in early part of Commercial Real Estate recovery
Providing strategy to implementation through our consulting division
Profitable hiring, accretive acquisition
Plan to grow higher-margin “capital markets” business – i.e. sales and capital raising

CONCLUSION

Date
BGC ASSETS: SUM OF THE PARTS ANALYSIS
29
Cash position as of 9/30/2013 =$ 827MM; Debt = $423MM
Expected to receive 14.9MM NDAQ shares ratably over next 15 years, currently = $554MM
BGC’s retained technology-based businesses grew at a CAGR of 20% from 2010-3Q13
Assets of the Company are not fully understood by the market
$ in millions. "TTM" = trailing twelve months ended 9-30-2013. P/S = Price to Sales ratio. “Retained Tech” excludes eSpeed revenues from prior periods. Notes: Data for NDAQ stock price and for peer multiples s is from Bloomberg as of 11-14-2013 market close. Tech peers = BVMF3 BZ, CBOE US, CME US, DB1 GR, 388 HK (HKEX), ICE US, ITG US, KCG US, LSE LN, MKTX US, & NDAQ US. Voice peers for P/E=tickers IAP LN, CFT SW, & TLPR LN. GFIG US is also included for voice P/S. Real Estate Peers = CBG US, FSV CN, HF US, MMI & JLL US. These segment/business line pre-tax distributable earnings figures are before corporate allocations. For the TTM ended 9/30/2013, BGC’s corporate items generated revenues of $45MM and a pre-tax loss of $55MM. The Company’s cash position includes “cash and cash equivalents”, “marketable securities”, and unencumbered “securities owned” held for liquidity purposes.
($ in millions)
TTM Revenue TTM Pre-Tax
Margin Average Peer TTM P/S
Average Peer CY2012 P/E
Retained Tech ≈43% ≈8.4x ≈31.2x
Financial Services Voice $1,023 ≈10% ≈0.8x ≈11.9x
Real Estate Segment $554 ≈8% ≈1.3x ≈20.9x
Note: BGC currently expects a 14.5% Tax Rate for Distributable Earnings
$80

Date
BGC PARTNERS OPERATIONAL OUTLOOK
We expect to profitably hire and make accretive acquisitions across both of our segments while investing in our technology-based businesses.
BGC's previously announced $50MM cost savings initiative near complete; newly announced
$50MM cost savings initiative in early stages, with total expected cost savings at a $100MM run-rate from 2012 levels.
Attractive 9% dividend yield; expected to maintain dividend for the foreseeable future Intermediary-oriented, low-risk business model
BGC launched its Swap Execution Facility (SEF), consistent with derivatives trading
regulations under the Dodd-Frank Act (see next page). ELX, a CFTC-approved DCM has been actively planning for the launch of Dodd-Frank
compliant swap and swap-futures trading, execution for customers.
30

Q&A

APPENDIX

Date
33
BGC’S ABILITY TO ATTRACT AND RETAIN KEY TALENT
*Excluding shares associated with the Company’s Convertible Senior Notes
Partnership structure tax efficient for both partners and public shareholders
Fundamentally aligns employees’ interests with shareholders’
Partnership is a key tool in attracting and retaining top producers
Unlike peers, large number of key employees have sizable and mostly restricted equity or unit stakes (≈34% of fully diluted shares*)
Structure combines best aspects of private partnership with public ownership

Date
NGKF RECENT HIGHLIGHTS AND HEADLINES
Brookfield Office Properties awarded NGKF the leasing assignment for the 2.3 MSF One Liberty Plaza in Lower Manhattan.
SunGard Availability Services appointed Global Corporate Services as its North American real estate
advisor. This includes transaction management and global lease administration.
Global Corporate Services assisted Kenall Manufacturing in selecting a new 354,000-square-foot HQ facility and negotiating incentives in Kenosha, Wis.
NGKF represents CME on pending sale of NYMEX Headquarters to Brookfield Office Properties.
Global Healthcare Services awarded exclusive agency sale and leasing assignment for March LifeCare Medical City, a $3.3 billion, 6 MSF health and wellness development on the former March Air Force Base in Riverside County, Calif.
Time Equities Inc. selected NGKF as exclusive leasing and management agent for Travelers Towers I & II in suburban Detroit after we successfully sold the 790,000 SF office complex.
Appeared on 2013 InformationWeek 500 list of top technology innovators across the U.S.
Courtney Adham, Managing Director, joined the firm to establish NGKF’s Strategic Agency Group (SAG). Ms. Adham brings more than a decade of strategic agency experience from previous posts with Cushman & Wakefield's Strategic Agency Services division and in-house leasing and asset management roles for owners including RXR.
Nationally recognized self storage experts, Aaron Swerdlin and Kenneth Cox joined NGKF Capital Markets to serve investors in 2.3-Billion-Square-Foot sector.
34

Date
NGKF REVENUE ANALYSIS
35
On April 13, 2012, BGC purchased certain assets of Grubb & Ellis. Because of this, NGKF collected $21.7 million during full year 2012 not related to the Company’s ongoing Real Estate Services business, of which $5.2 million was recognized as distributable earnings revenue in the third quarter of 2012. $1.3 million of these non-core Grubb & Ellis revenues were recognized as distributable earnings revenue in the third quarter of 2013. These revenues were primarily associated with the collection of receivables related to deals initiated by Grubb & Ellis brokers who left that company prior to the acquisition. As a result, NGKF’s distributable earnings revenues were higher than they otherwise would have been in the third quarters of 2012 and 2013.
($ in millions) 3Q2012 4Q2012 1Q2013 2Q2013 3Q2013 SUMActual Revenues $141.1 $148.7 $114.2 $143.8 $148.1 $839.9
Actual YoY Revenue Change NA $91.6 $66.3 ($0.2) $7.0 NA
Actual YoY % Change NA 160% 139% 0% 5% NA
Adjusted Revenues $135.9 $144.2 $112.4 $142.5 $146.8 $813.8
Adjusted YoY Revenue Change NA $87.1 $64.5 $10.5 $10.9 NA
Adjusted YoY % Change NA 152% 135% 8% 8% NA

Date
Others ≈ $72B or
29%
Broker-Dealers ≈ $180B or
71% ($175B ≈
Execution)
(State St)
36
SMALL SLICE FROM BANKS = SIGNIFICANT POTENTIAL OPPORTUNITY FOR BGC
Custodians 9.1% (of ≈ $250B total)
Data Providers 6.7%
Derivative Execution Venues 4.4%
Public IDBs 3.2% Cash Execution 2.4%
Securities Depositories 1.6% Prop Trading Firms 1.2%
5-Year Growth Outlook Color Key Growth Area Little Change Declining
Sources, including growth prospects: Morgan Stanley Research and Oliver Wyman, March 2012
$250B Global Sales & Trading Market (2010 – 2011)
(Reuters)
(CME)
(Nasdaq)
(DTCC)
(Citadel)
Examples
(BGC)
Public IDBs ≈ $8B

Date
37
STRUCTURE CREATES EMPLOYEE RETENTION AND LOWER EFFECTIVE TAX RATE
Public shareholders
Class A common stock
BGC Partners, Inc.
BGC Holdings, L.P.
General Partner Interest (controlling interest) Special Voting Limited Partnership Interest
Limited Partnership Interests
General Partner Interest (controlling interest)
Special Voting Limited Partnership Interest Limited Partnership Interests
Exchangeable Limited Partnership Interests
Founding/ Working Partners
Limited Partnership Interests
Exchangeable Limited Partnership Interests
U.S Opco
Global Opco
General Partner Interests (controlling interest)
Special Voting Limited Partnership Interest
Limited Partnership Interests
Limited Partnership Interests
Cantor Fitzgerald, L.P.
Class A & B common stock
KEY:
Type of Owner Companies Type of Ownership )

Date
SELECT 3Q 2013 RESULTS COMPARED TO 3Q 2012
BGC Partners’ Board of Directors declared a quarterly cash dividend of $0.12 per share payable on December 2, 2013, with an ex-dividend date of November 14, 2013 to Class A and Class B common stockholders of record as of November 18, 2013.
Highlights of Consolidated Results ($ millions, except per share data) 3Q 2013 3Q 2012 Change
(%)
Revenues for distributable earnings $414.4 $445.7 (7.0) Pre-tax distributable earnings before non-controlling interest in subsidiaries and taxes 37.4 46.7 (20.0)
Pre-tax distributable earnings per share 0.12 0.16 (25.0)
Post-tax distributable earnings 31.0 38.6 (19.5)
Post-tax distributable earnings per share 0.10 0.13 (23.1)
Adjusted EBITDA 78.7 63.7 23.6
Effective tax rate 14.5% 14.5%
Pre-tax earnings margin 9.0% 10.5%
Post-tax earnings margin 7.5% 8.7%
38

Date
3Q 2013 PRODUCT DIVERSITY
39
Note: percentages may not sum to 100% due to rounding.
Rates 26.3%
Credit 13.1%
Foreign exchange 11.4%Equities and other
asset classes 8.4%
Real estate brokerage 25.9%
Real estate management
services 9.8%
Other revenues, interest income &
related parties 4.6%
Market data & software solutions
0.4%

Date
BUSINESS OVERVIEW: RATES
40
$0
$100
$200
$300
$400
$500
$600
FY 2011 FY 2012 Q3 2012 Q3 2013 Q3 2012 Q3 2013
$578.5 $532.4
$131.4 $109.1 $116.4
$109.1 (USD
mill
ions
)
Interest Rate Derivatives US Treasuries (off-the-run) Global Government Bonds Agencies Interest Rate Futures Dollar Derivatives Repurchase Agreements Non-Deliverable Swaps Interest Rate Swaps & Options
Rates Revenue Growth
% of 3Q 2013 Total Distributable Earnings Revenue Example of Products
Global sovereign and corporate debt issuance cause long-term tailwinds in our Rates business
Near-term headwinds due to continued Quantitative Easing (QE)
Low interest rates in most major economies continue to hold down volumes
Interest rate volatility decreased from recent highs in 3Q 2013 due to continued QE policy
Drivers
RATES 26.3%
(Excluding eSpeed brokerage)

Date
BUSINESS OVERVIEW: CREDIT
41
Credit Derivatives Asset-Backed Securities Convertibles Corporate Bonds High-Yield Bonds Emerging Market Bonds
Credit Revenue Growth
% of 3Q 2013 Total Distributable Earnings Revenue Example of Products
Industry derivatives volumes generally lower
Large bank corporate bond trading activity impacted due in part to Basel III capital requirements
Drivers
$0
$100
$200
$300
$400
$500
FY 2011 FY 2012 Q3 2012 Q3 2013
$315.0 $284.6
$67.9 $54.4
(USD
mill
ions
)

Date
BUSINESS OVERVIEW: FOREIGN EXCHANGE
42
Foreign Exchange Revenue Growth
% of 3Q 2013 Total Distributable Earnings Revenue Example of Products
FX volumes tracked lower globally for most currency products during the quarter
BGC Fully Electronic FX volumes outperformed industry trends during 3Q13 (see following page)
Drivers
$0
$25
$50
$75
$100
$125
$150
$175
FY 2011 FY 2012 Q3 2012 Q3 2013
$218.4 $208.0
$48.9 $47.4
(USD
mill
ions
)
In virtually all currency pairs Options Exotics Spot Forwards Non-deliverable forwards

Date
BUSINESS OVERVIEW: EQUITIES & OTHER ASSET CLASSES
43
Equity Derivatives Cash Equities Index Futures Commodities Energy Derivatives Other Derivatives and Futures
Equities & Other Asset Classes Revenue Growth
% of 3Q 2013 Total Distributable Earnings Revenue Example of Products
Weaker global equity cash & derivatives volumes industry-wide
BGC’s Equities and Other asset class business generally outperformed the industry during 3Q13
Drivers
$0$25$50$75
$100$125$150$175$200$225
FY 2011 FY 2012 Q3 2012 Q3 2013
$214.5 $156.1
$34.5 $34.9 (USD
mill
ions
) 0.9%
8.4%

Date
$10
$15
$20
$25
$30
$35
$40
$45
3Q2012 4Q2012 1Q2013 2Q2013 3Q2013
$19.3 $17.9
$22.7 $21.9
$17.8
($ m
illio
ns)
$0
$500
$1,000
$1,500
$2,000
$2,500
$3,000
3Q2012 4Q2012 1Q2013 2Q2013 3Q2013
$1,988.2
$1,701.0
$2,622.5
$2,416.3
$2,167.0
($ b
illio
ns)
BGC’S FULLY ELECTRONIC BROKERAGE METRICS
Fully Electronic Brokerage Notional Volumes (in billions)1
Percent of technology based revenue2 (excluding eSpeed) in the Financial Services segment was 6.9% vs. 7.2% in 3Q2012
Retained Technology Revenues (in millions)2
1. Fully electronic notional volumes and revenues have been normalized to exclude eSpeed activity
2.“Retained Technology” includes fees captured in both the “total brokerage revenues” and “ fees from related party” line items related to fully electronic trading and Market Data and Software Solutions, all of which are reported within the Financial Services segment.
44

Date
45
TECH-BASED PRODUCTS HAVE MUCH HIGHER MARGINS
Revenue and Pre-Tax DE amounts denoted in USD millions Note: For all periods, “Technology-Based” revenues include fully electronic trading in the “total brokerage revenues” GAAP income statement line item, the portion of “fees from related parties” line item related to fully electronic trading, all “market data” revenues , and all “software solutions” revenues. All of the aforementioned are reported within the Financial Services segment. “Voice/Hybrid” includes results from the “Real Estate Services” segment, “Voice/Hybrid” and “Other” from “Financial Services” segment, and also includes $8 million from the NASDAQ OMX stock earn-out for 3Q13. Prior periods include eSpeed which had pre-tax margins of ~60%; retained “Technology-Based” business has margins of ~45%.
Technology - Based
Voice / Hybrid
Corporate / Other Total
Technology - Based
Voice / Hybrid
Corporate / Other Total
Revenue $18 $387 $10 $414 $42 $391 $12 $446
Pre-Tax DE $8 $37 ($7) $37 $20 $39 ($12) $47
Pre-tax DE Margin 45% 10% NMF 9% 47% 10% NMF 10%
Technology - Based
Voice / Hybrid
Corporate / Other Total
Technology - Based
Voice / Hybrid
Corporate / Other Total
Revenue $45 $415 $11 $471 $43 $410 $12 $465
Pre-Tax DE $23 $44 ($13) $54 $21 $51 ($16) $56
Pre-tax DE Margin 52% 11% NMF 11% 50% 12% NMF 12%
Technology - Based
Voice / Hybrid
Corporate / Other Total
Technology - Based
Voice / Hybrid
Corporate / Other Total
Revenue $171 $1,532 $48 $1,751 $176 $1,251 $50 $1,476
Pre-Tax DE $85 $173 ($62) $196 $90 $208 ($61) $237
Pre-tax DE Margin 50% 11% NMF 11% 51% 17% NMF 16%
Q3 2013 Q3 2012
Q2 2013 Q2 2012
FY2012 FY2011

Date
BGC PARTNERS COMPENSATION RATIO
46
$713.3 $749.8 $793.5 $1,036.8
$822.2
60.9% 56.2% 53.8%
59.2% 61.6%
0%
10%
20%
30%
40%
50%
60%
70%
80%
90%
100%
$0
$200
$400
$600
$800
$1,000
$1,200
2009 2010 2011 2012 YTD 2013
($ m
illio
ns)
Compensation and Employee Benefits Compensation and Employee Benefits as % of Total Revenue
3Q 2013 BGC Partners Compensation Ratio was 62.0% vs. 59.8% in 3Q2012 Commercial Real Estate brokers generally have a higher compensation ratio than IDBs with significant electronic
trading revenues.
Date
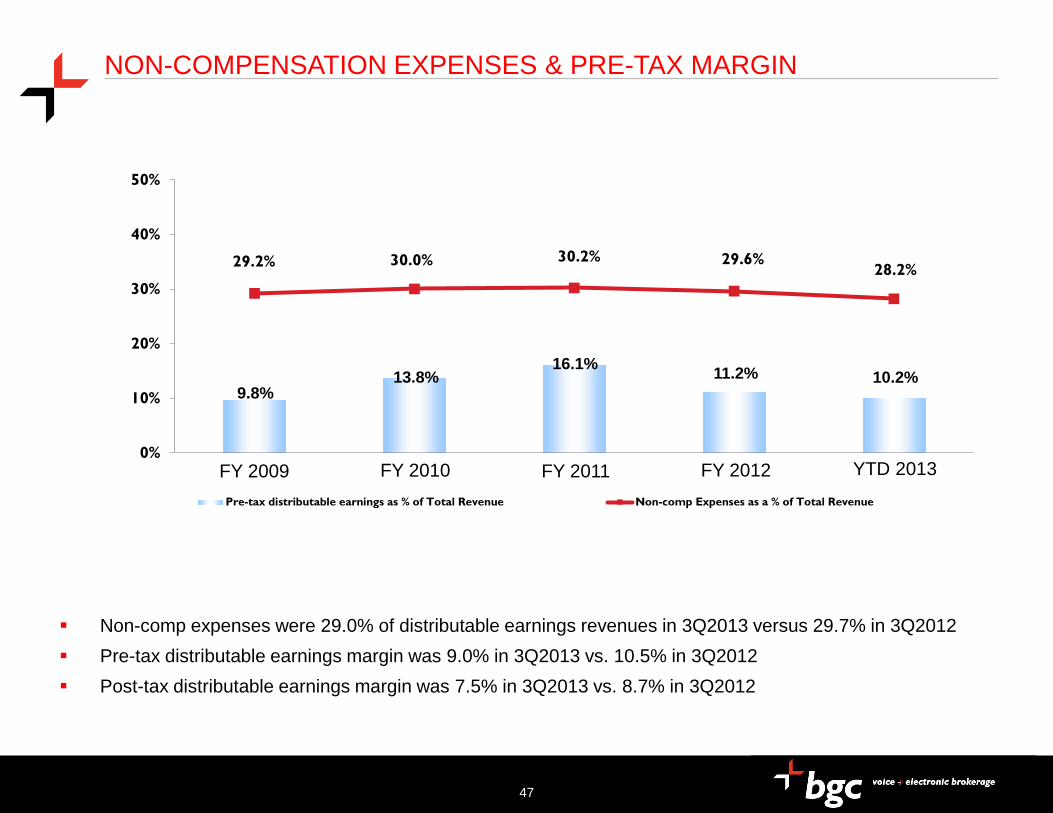
NON-COMPENSATION EXPENSES & PRE-TAX MARGIN
47
9.8% 13.8%
16.1% 11.2% 10.2%
29.2% 30.0% 30.2% 29.6% 28.2%
0%
10%
20%
30%
40%
50%
Pre-tax distributable earnings as % of Total Revenue Non-comp Expenses as a % of Total Revenue
FY 2009 FY 2010 FY 2011 FY 2012
Non-comp expenses were 29.0% of distributable earnings revenues in 3Q2013 versus 29.7% in 3Q2012 Pre-tax distributable earnings margin was 9.0% in 3Q2013 vs. 10.5% in 3Q2012 Post-tax distributable earnings margin was 7.5% in 3Q2013 vs. 8.7% in 3Q2012
YTD 2013

Date
ADJUSTED EBITDA
48
BGC Partners, Inc
Reconciliation of GAAP Income to Adjusted EBITDA(and Comparison to Pre-Tax Distributable Earnings)(in thousands) (unaudited)
Q3 2013 Q3 2012GAAP Income from continuing operations before income taxes 42,663$ 3,612$
Add back:
Employee loan amortization 7,744 9,716
Interest expense 9,164 9,758
Fixed asset depreciation and intangible asset amortization 10,666 13,502
Impairment of fixed assets 410 93
Exchangeability charges (1) 5,376 24,031
Losses on equity investments 2,705 2,995
Adjusted EBITDA 78,728$ 63,707$ (2)
Pre-Tax distributable earnings 37,410$ 46,742$
(1) Represents non-cash, non-economic, and non-dilutive charges relating to grants of exchangeability to limited partnership units
(2) Certain reclassifications have been made to previously reported amounts to conform to the current presentation

Date
MONTHLY REVENUE EXCLUDING REAL ESTATE SERVICES ($MM)
49
BG
C M
onth
ly D
istr
ibut
able
Ear
ning
s R
even
ues
($M
M)
Note: October 2013 revenue number is preliminary. Monthly revenue prior to 2008 is available in the 2010 earnings presentations at www.ir.bgcpartners.com
First 21 trading
days for October down about 4%
per day excluding eSpeed and
NGKF
Revenue for August 2010 included $11.6M in “other revenues” as the
result of a favorable arbitration ruling
pertaining to Refco Securities.

Date
BGC’S ECONOMIC OWNERSHIP AS OF 9/30/13
50
Public 42%
Cantor 24%
Employees, Executives, & Directors
34%
Note: Employees, Executives, and Directors ownership figure attributes all units (PSUs, FPUs, RSUs, etc.) and distribution rights to founding partners & employees and also includes all A shares owned by BGC executives and directors. Cantor ownership includes all A and B shares owned by Cantor as well as all Cantor exchangeable units and certain distribution rights. Public ownership includes all A shares not owned by executives or directors of BGC. The above chart excludes shares related to convertible debt.

Date
AVERAGE EXCHANGE RATES
51
Source: Oanda.com.
Average
3Q2013 3Q2012 October 1- 30th, 2013 October 1- 30th, 2012
US Dollar 1 1 1 1
British Pound 1.550 1.580 1.610 1.608
Euro 1.325 1.251 1.363 1.297
Hong Kong Dollar 0.129 0.129 0.129 0.129
Singapore Dollar 0.789 0.802 0.804 0.817
Japanese Yen* 98.900 78.640 97.780 78.900
* Inverted

Date
DISTRIBUTABLE EARNINGS
BGC Partners uses non-GAAP financial measures including "revenues for distributable earnings," "pre-tax distributable earnings" and "post-tax distributable earnings," which are supplemental measures of operating performance that are used by management to evaluate the financial performance of the Company and its subsidiaries. BGC Partners believes that distributable earnings best reflect the operating earnings generated by the Company on a consolidated basis and are the earnings which management considers available for distribution to BGC Partners, Inc. and its common stockholders, as well as to holders of BGC Holdings partnership units during any period. As compared with "income (loss) from operations before income taxes," "net income (loss) for fully diluted shares," and "fully diluted earnings (loss) per share," all prepared in accordance with GAAP, distributable earnings calculations primarily exclude certain non-cash compensation and other expenses which generally do not involve the receipt or outlay of cash by the Company, which do not dilute existing stockholders, and which do not have economic consequences, as described below. In addition, distributable earnings calculations exclude certain gains and charges that management believes do not best reflect the ordinary operating results of BGC. Revenues for distributable earnings are defined as GAAP revenues excluding the impact of BGC Partners, Inc.'s non-cash earnings or losses related to its equity investments, such as in Aqua Securities, L.P. and ELX Futures, L.P., and its holding company general partner, ELX Futures Holdings LLC. Revenues for distributable earnings include the collection of receivables which would have been recognized for GAAP other than for the effect of acquisition accounting. Revenues for distributable earnings also exclude certain one-time or unusual gains that are recognized under GAAP, because the Company does not believe such gains are reflective of its ongoing, ordinary operations. Pre-tax distributable earnings are defined as GAAP income (loss) from operations before income taxes excluding items that are primarily non-cash, non-dilutive, and non-economic, such as:
Non-cash stock-based equity compensation charges for REUs granted or issued prior to the merger of BGC Partners, Inc. with and into eSpeed, as well as post-merger non-cash, non-dilutive equity-based compensation related to partnership unit exchange or conversion.
Allocations of net income to founding/working partner and other limited partnership units, including REUs, RPUs, PSUs, LPUs, and PSIs. Non-cash asset impairment charges, if any. Distributable earnings calculations also exclude charges related to purchases, cancellations or redemptions of partnership interests and certain unusual, one-time or non-recurring items, if any. “Compensation and employee benefits” expense for distributable earnings will also include broker commission payouts relating to the aforementioned collection of receivables. BGC’s definition of distributable earnings also excludes certain gains and charges with respect to acquisitions, dispositions, and resolutions of litigation. This exclusion pertains to the one-time gain related to the NASDAQ OMX transaction. Management believes that excluding these gains and charges best reflects the operating performance of BGC. However, because NASDAQ OMX is expected to pay BGC in an equal amount of stock on a regular basis for 15 years as part of the transaction, the payments associated with BGC’s receipt of such stock will be included in the Company’s calculation of distributable earnings. To make quarter-to-quarter comparisons more meaningful, one-quarter of the annual contingent earn-out amount will be included in the Company’s calculation of distributable earnings each quarter as “other revenues.” Since distributable earnings are calculated on a pre-tax basis, management intends to also report "post-tax distributable earnings" and "post-tax distributable earnings per fully diluted share":
"Post-tax distributable earnings" are defined as pre-tax distributable earnings adjusted to assume that all pre-tax distributable earnings were taxed at the same effective rate. "Post-tax distributable earnings per fully diluted share" are defined as post-tax distributable earnings divided by the weighted-average number of fully diluted shares for the period. BGC’s distributable earnings per share calculations assume either that:
The fully diluted share count includes the shares related to the dilutive instruments, such as the Convertible Senior Notes, but excludes the associated interest expense, net of tax, when the impact would be dilutive; or
The fully diluted share count excludes the shares related to these instruments, but includes the associated interest expense, net of tax. Each quarter, the dividend to common stockholders is expected to be determined by the Company’s Board of Directors with reference to post-tax distributable earnings per fully diluted share. In addition to the Company’s quarterly dividend to common stockholders, BGC Partners expects to pay a pro-rata distribution of net income to BGC Holdings founding/working partner and other limited partnership units, including REUs, RPUs, LPUs, PSUs and PSIs, and to Cantor for its non-controlling interest. The amount of all of these payments is expected to be determined using the above definition of pre-tax distributable earnings per share. Certain employees who are holders of RSUs are granted pro-rata payments equivalent to the amount of dividends paid to common stockholders. Under GAAP, a portion of the dividend equivalents on RSUs is required to be taken as a compensation charge in the period paid. However, to the extent that they represent cash payments made from the prior period's distributable earnings, they do not dilute existing stockholders and are therefore excluded from the calculation of distributable earnings. Distributable earnings is not meant to be an exact measure of cash generated by operations and available for distribution, nor should it be considered in isolation or as an alternative to cash flow from operations or GAAP net income (loss). The Company views distributable earnings as a metric that is not necessarily indicative of liquidity or the cash available to fund its operations. Pre- and post-tax distributable earnings are not intended to replace the Company’s presentation of GAAP financial results. However, management believes that they help provide investors with a clearer understanding of BGC Partners’ financial performance and offer useful information to both management and investors regarding certain financial and business trends related to the Company’s financial condition and results of operations. Management believes that distributable earnings and the GAAP measures of financial performance should be considered together. Management does not anticipate providing an outlook for GAAP “revenues,” “income (loss) from operations before income taxes,” “net income (loss) for fully diluted shares,” and “fully diluted earnings (loss) per share,” because the items previously identified as excluded from pre-tax distributable earnings and post-tax distributable earnings are difficult to forecast. Management will instead provide its outlook only as it relates to revenues for distributable earnings, pre-tax distributable earnings and post-tax distributable earnings. For more information on this topic, please see the tables in BGC's most recent financial results on Form 8-K, entitled “Reconciliation of Revenues Under GAAP and Distributable Earnings,” and “Reconciliation of GAAP Income to Distributable Earnings” which provides a summary reconciliation between pre- and post-tax distributable earnings and the corresponding GAAP measures for the Company in the periods discussed in this document.
© 2013 BGC Partners, Inc. All rights reserved.
52

Date
ADJUSTED EBITDA
.
© 2013 BGC Partners, Inc. All rights reserved.
53
BGC also provides an additional non-GAAP financial measure, “adjusted EBITDA,” which it defines as GAAP income from operations before income taxes, adjusted to add back interest expense as well as the following non-cash items:
Employee loan amortization; Fixed asset depreciation and intangible asset amortization; Non-cash impairment charges; Charges relating to grants of exchangeability to limited partnership interests; Charges related to redemption of units; Charges related to issuance of restricted shares; and Non-cash earnings or losses related to BGC’s equity investments, such as in Aqua Securities, L.P. and ELX Futures, L.P., and its holding company
general partner, ELX Futures Holdings LLC.
The Company’s management believes that this measure is useful in evaluating BGC’s operating performance compared to that of its competitors, because the calculation of adjusted EBITDA generally eliminates the effects of financing and income taxes and the accounting effects of capital spending and acquisitions, which would include impairment charges of goodwill and intangibles created from acquisitions. Such items may vary for different companies for reasons unrelated to overall operating performance. As a result, the Company’s management uses these measures to evaluate operating performance and for other discretionary purposes. BGC believes that adjusted EBITDA is useful to investors to assist them in getting a more complete picture of the Company’s financial results and operations.
Since adjusted EBITDA is not a recognized measurement under GAAP, when analyzing BGC’s operating performance, investors should use adjusted EBITDA in addition to GAAP measures of net income. Because not all companies use identical EBITDA calculations, the Company’s presentation of adjusted EBITDA may not be comparable to similarly titled measures of other companies. Furthermore, adjusted EBITDA is not intended to be a measure of free cash flow, because adjusted EBITDA does not consider certain cash requirements such as tax and debt service payments.
For a reconciliation of adjusted EBITDA to GAAP income from operations before income taxes, the most comparable financial measure calculated and presented in accordance with GAAP, see the table in BGC's most recent financial results press release "Reconciliation of GAAP Income to Adjusted EBITDA (and Comparison to Pre-Tax Distributable Earnings)”.