Embed Size (px)
Citation preview

BGP-lens: Patterns and Anomalies in Internet RoutingUpdates ∗
B. Aditya Prakash#
[email protected] Valler+
David Andersen#
[email protected] Faloutsos+
[email protected] Faloutsos#
[email protected]#Computer Science Department, Carnegie Mellon University, USA
+Computer Science Department, University of California - Riverside, USA
ABSTRACTThe Border Gateway Protocol (BGP) is one of the funda-mental computer communication protocols. Monitoring andmining BGP update messages can directly reveal the healthand stability of Internet routing. Here we make two con-tributions: firstly we find patterns in BGP updates, likeself-similarity, power-law and lognormal marginals; secondlyusing these patterns, we find anomalies. Specifically, we de-velop BGP-lens, an automated BGP updates analysis tool,that has three desirable properties: (a) It is effective, able toidentify phenomena that would otherwise go unnoticed, suchas a peculiar ‘clothesline’ behavior or prolonged ‘spikes’ thatlast as long as 8 hours; (b) It is scalable, using algorithmsthat are all linear on the number of time-ticks; and (c) It isadmin-friendly, giving useful leads for phenomenon of inter-est.
We showcase the capabilities of BGP-lens by identifyingsurprising phenomena verified by syadmins, over a massivetrace of BGP updates spanning 2 years, from the publiclyavailable site datapository.net.
Categories and Subject DescriptorsH.2.8 [Database Management]: Database Applications—Data Mining
General TermsAlgorithms, Measurement, Security
∗This material is based upon work supported by the NationalScience Foundation under Grants No. CNS-0721736 and CNS-0721889, and also under the auspices of the U.S. Department ofEnergy by the Lawrence Livermore National Laboratory undercontract DE-AC52-07NA27344 (LLNL-CONF-404625) and sub-contracts B579447, B580840. Any opinions, findings, and conclu-sions or recommendations expressed in this material are those ofthe authors and do not necessarily reflect the views of the Na-tional Science Foundation, or other funding parties.
Permission to make digital or hard copies of all or part of this work forpersonal or classroom use is granted without fee provided that copies arenot made or distributed for profit or commercial advantage and that copiesbear this notice and the full citation on the first page. To copy otherwise, torepublish, to post on servers or to redistribute to lists, requires prior specificpermission and/or a fee.KDD’09, June 28–July 1, 2009, Paris, France.Copyright 2009 ACM 978-1-60558-495-9/09/06 ...$5.00.
KeywordsBGP Monitoring, Anomalies, Patterns, Self-similarity
1. INTRODUCTIONThe ‘Border Gateway Protocol’ (BGP) is responsible for
keeping route information up-to-date. Thus, each routersends BGP updates to its neighbors, to keep them currentwith the path information that it has. Path informationchanges, e.g., whenever a link goes down or whenever itcomes back up again. In an ideal setting, there shouldbe no BGP updates; in reality there are, due to link fail-ures, node failures, router-maintenance shut-downs, miscon-figured routers, bugs in the router software etc. Our goalhere is two-fold: (a) we want to find how normal BGP up-dates look like and (b) how to automatically spot deviationsand anomalies, which ultimately helps system administra-tors diagnose/repair undesirable network behaviors.
The volume and the complexity of BGP updates makes itpractically impossible for a human to process all the updateinformation at several different levels of granularity. For ex-ample, we studied about 18 million BGP updates spanningover 2 years from datapository.net.
In this paper, we present BGP-lens, a novel tool for auto-matically detecting patterns and anomalies in BGP updatesat many different scales of observation. We also showcaseits capabilities on massive traces involving millions of mea-surements. The key novelties of BGP-lens are:
a. It is effective: Applying it to real BGP data, weidentify several subtle phenomena that may otherwise gounnoticed, such as a peculiar “clothesline” behavior, as wellas prolonged high-activity periods with high, near-constantvolume of updates for several hours. The tool builds ona carefully chosen set of algorithms, avoiding methods likeFFT, auto-correlation, thresholding, which despite their pop-ularity, would be unsuitable here due to the bursty and noisynature of the data. Instead, BGP-lens builds on top of moresophisticated, lesser-known tools like wavelets and medianfiltering (see §3 and §6.)
b. It is scalable: The algorithms are linear on thenumber of time-ticks and thus BGP-lens can handle largedatasets: the runtimes were in the order of minutes (see §4).
Moreover, we carefully designed our tool so that it isadmin-friendly: BGP-lens works with zero user input. Itautomates the definition of surprising phenomena, providesreasonable defaults for all the required thresholds, and ranks

the phenomena according to their statistical significance. Fi-nally, BGP-lens also provides the leads for an investigationor troubleshooting, by identifying the network entities (ori-gin ASes, prefixes) that participate 1.
For expert users, the tool offers the additional capabilityto tune a few “knobs” that control the level of sensitivity.These knobs are intuitive and require only simple tuning(e.g. low, medium, high), without the need to understandthe intricate details of the underlying data mining methods(see §5).
Finally, BGP-lens can help sysadmins identify surprisingphenomena that may otherwise go unnoticed, as was the casein Section 6, with the Alabama Supercomputing Network,whose sys-admin confirmed the anomaly.
The rest of the paper is organized as follows: We reviewthe related work in Section 2. The proposed strategies withmotivating observations are discussed in Section 3; the al-gorithms of the tool with a discussion on user interface etc.are presented in Section 4 and Section 5 respectively. Theexperimental results and case studies are presented in Sec-tion 6. We then conclude the paper in Section 7.
2. RELATED WORKIn this section, we survey earlier BGP analysis, as well as
time series analysis tools.
2.1 BGP Measurements and AnalysisThere has been significant work in studying BGP phenom-
ena, which can roughly be grouped into: (a) measurementand modeling studies [9] [10]; (b) studies of network-wideBGP dynamics [5]; and (c) attempts to troubleshoot andimprove BGP [21].
The characteristics of BGP updates have been studied indetail by Labovitz, who presented canonical measurementstudies on BGP anomaly and route instability detection [9][10]. Modeling studies can be characterized by the workof Maennel and Feldmanm [12], who presented a workloadmodel to capture the structure of BGP traffic. Furthermore,Feldmann et al. [5] present methods to detect various BGPanomalies that affect inter-domain routing.
Work closely related to our own is presented by Teoh etal. [22] and employs statistical and visualization methods todiagnose BGP anomalies. Our work differs in that they focuson novel visualization methods to detect BGP anomaliesrather than data mining techniques. Additionally, Tseng etal. [23] detect routing changes and management actions of anAS by examining BGP related data, but do not necessarilydetect anomalies or other surprising BGP phenomena.
2.2 Time Series Analysis ToolsTypical tools for time series analysis and pattern discovery
include the Discrete Fourier Transform (DFT) (see, e.g., Op-penheim and Schafer [14]) and the family of wavelet trans-forms ([16] [3]), with the Haar, Daubechies-4, Morlet, andGabor, among the most famous. Wavelets have been exten-sively used for analysis of real time series before, for e.g. see[6] and [25].
For time series indexing, earlier works have used the Fouriertransform, wavelets, or piece-wise linear approximations [4][17] [8].1This can be considered as a first step towards identifyingthe source of an anomaly, which is a much harder problem[5].
Table 1: BGP-updates snippet; Washington Router
time peerAS originAS prefix2005-02-17 12:39:42 11317 1252 204.29.119.0/242005-02-17 12:39:43 10490 3464 204.29.80.0/242005-02-17 12:39:46 10490 3464 204.29.79.0/242005-02-17 12:39:49 10490 3464 204.29.118.0/222005-02-17 12:39:55 11317 776 204.29.78.0/242005-02-17 12:39:55 22388 7588 207.157.115.0/242005-02-17 12:39:56 1252 6677 192.211.42.0/242005-02-17 12:39:58 10764 2200 204.29.120.0/24. . . . . . . . . . . .
For time series forecasting, the typical method is linearforecasting, also known as autoregression (AR) methodology,or Box-Jenkins [1], with its numerous variations (ARIMA,seasonal ARIMA, Fractional Integration (ARFIMA) [15] etc.).Non-linear forecasting includes the Delayed Coordinate Em-bedding method [18] [2], as well as tools from chaos, fractalsand self-similarity.
With few exceptions, several of the above tools do notwork well for the bursty, self-similar sequences we have, be-cause they assume ergodicity, smooth changes and Gaussianerrors. As we show later (Figure 6), BGP update messages,are indeed self-similar and bursty. Typical tools for self-similar analysis employ the Hurst exponent (see, eg., theSELFIS tool [7]), and the entropy plots [26] (Figure 5).
Among the applicable tools from the list above, we pro-pose to use the Haar wavelet transform. We describe it inmore detail in Section 3.4.
3. TOOL COMPONENTS ANDOBSERVATIONS
BGP-lens examines a given time-series of BGP updates todiscover interesting phenomena, such as periodicities, andanomalies. Below we present a description of the data usedin this analysis and detail the two complementary compo-nents of BGP-lens (temporal and frequency).
3.1 The DataWe examine BGP Monitor data containing 18 million BGP
update messages over a period of two years (09/2004 to09/2006) from the Datapository project [13]. The primarysource of data is Abilene, an academic research network em-ploying Juniper routers running a full-mesh of iBGP ses-sions. Abilene uses one Zebra monitoring router per pointof presence (PoP) to collect BGP updates by establishingan iBGP session as a client. As Figure 1(a) shows, there aresome significant gaps in the BGP update record, which thetools handle seamlessly.
A snippet of the data is provided in Table 1. A BGPupdate is basically an advertisement of path to some partof the network from a router to another router. Concep-tually, a BGP update is a row with many fields (columns)each containing some piece of information of the update. Forexample, time gives the time the update was sent, origi-nAS is the AS (Autonomous System) which sent the update,prefix is the network space for which the update is beingsent. Other data, primarily used for traffic engineering, isnot shown in the snippet. In this paper, we will focus ontime, originAS and prefix.

Problem Definition.Although there are many aspects of this data, we look at
a time-series which gives us the number of updates receivedby a router every b seconds (called the bin size). After iden-tification of target time periods, the originAS and prefix
fields are used to find out which parties are involved in thesuspected updates. We now describe the problem we areattacking precisely:
General Problem:
• Given: The raw data as before (e.g. Table 1)• Problem: Find patterns and anomalies.
Specific Problem:
• Given: Time-series after converting the raw data usingappropriate bin size (as described above). Also someassociated auxiliary data (originAS, prefix fields).
• Problem: Find patterns and anomalies. Also reportsuspicious entities (paths, IPs).
3.2 Shortcomings of standard techniquesGiven the data, what can we discover? Regardless of bin
size b, a linear-linear plot of the BGP update time series em-phasizes the very high values and obliterates the others (e.g.Figure 1(a)). Therefore, a visual inspection of that plot pro-vides minimal information: it shows several high spikes withthe vast majority of time-intervals having few BGP updates.But, there can be lots of patterns hidden: e.g., consider el-lipse E (Figure 1(a)) and its corresponding magnification(Figure 1(b)); we clearly see a short duration spurt. Notethat these patterns can’t be obtained through simple thresh-olding as choosing a threshold when there are such hugevariations in the data is near-impossible. For example, if wechoose 103 as the threshold, it will miss Ellipse E completely.Other methods like FFT and auto-regression [1] (which as-sumes Gaussian errors) also don’t work here because of theburstiness (for example see Figure 1(c)). We analyze theburstiness of the time-series later in Section 5.
3.3 Temporal Analysis - The “Clothesline”Effect
As we saw above, the challenge of employing temporalanalysis on BGP updates stems from the burstiness of theupdates. To overcome this challenge, we propose using thelog-linear plot (we use the transformation log(x+1), to han-dle bins with x=0 updates), (e.g. see Figure 2(b) (bottom)),which emphasizes small values over high values. We refer toit as the clotheslines plot, for reasons that we explain next.
3.3.1 Multi-scale AnalysisThe log-linear (‘clotheslines’) plot shows no striking out-
liers in the BGP update activity, with the obvious exceptionof the large gaps in the data due to missing values. But inthis plot, the bin size plays an important role. For example,see Figure 2. The bottom figures show the clothesline plotsfor bin sizes 10sec and 600sec. While the 10sec plot doesnot show anything striking, the 600sec plot shows an unex-pected phenomenon. The phenomenon is visually similar tobed sheets hanging from a clothesline, thus we refer to itas the “clothesline” phenomenon. Analysis of the clotheslinephenomenon leads directly to the following observation:
Observation 1. Depending on the bin size b, we may ob-serve ‘clotheslines’, that is, near-consecutive bins with sim-ilar count of updates per bin.
For example, for b=600sec, there are many, near-consecutiveupdates in the range of 50 updates per bin (henceforth “50-clothesline”). Similarly, there is another clothesline at ap-proximately 100 updates per 600sec, (henceforth called the“100-clothesline”).
An intuitive explanation of the clothesline phenomenonis simply a periodic stream of BGP update messages (bothupdate and withdraw) over a prolonged time period. A likelyexplanation may be Route Flapping, as suggested by thesys-admins of the related networks (see Section 6).
Up to this point in our analysis, we have described theclothesline phenomenon and how to identify it through vi-sual inspection. The logical follow-up question is, ratherthan visual inspection of clothesline plots, how can BGP-lensspot clotheslines automatically? To answer this, we leveragethe power of the “marginal” distribution; it turns out thatoutliers in the “marginal” distribution usually correspond toclotheslines.
3.3.2 MarginalsFigure 2 (top figures) show the PDF (probability density
function) of the volume of updates, i.e. it plots the numberof times we see bins with volume v (within a given timeperiod) versus the volume v. Here, we use log-log scales,expecting a power law. Indeed, the distribution of updatesis skewed, with a power-law-like tail. However, the marginalplot for b=600sec has a very pronounced tilt and severalsmaller spikes. Thus, we have the observation w.r.t. thisplot:
Observation 2. The PDF of the update volume seemsto be a mixture of lognormals. The dominating one spikesat volume v=50, which is also the mode of the distribution(most common value)
Closer inspection, e.g., of Figure 2(b) (top) shows thatthere is a spike at number of updates v=100 in additionto the one at around v=50; compared to the ‘clothesline’plot (Figure 2(b) (bottom)), these are exactly the heightsof the ‘hanging bed sheets’. Thus, extremes in the marginaldistribution helps us spot clotheslines.
3.4 Frequency Analysis - “Tornado” PlotsThe challenge of frequency analysis of the BGP update
message signal stems from the self-similar nature of the sig-nal (see Section 5). To overcome this challenge, we chose amulti-resolution analysis tool, and specifically the DiscreteWavelet Transform (DWT), with Haar wavelets.
The wavelet analysis is similar to the Fourier analysis, ina multi-resolution way. In order to visually interpret thewavelet transform, we employ the scalogram (see Figure 3),which plots the (absolute) values of the wavelet coefficientsin the scale-space domain. The horizontal axis is time; thevertical axis is scale (coarser scales correspond to lower fre-quencies, and are at the top); dark color indicates high ab-solute value of the corresponding wavelet coefficient. Thus,dark colors at a coarse scale indicate long, slow-moving peri-odicities. Dark colors at fine scales indicate short duration,fast-moving cycles.
Figure 3 shows scalograms (top) and the correspondingtime-signals. We have marked the areas of interest with
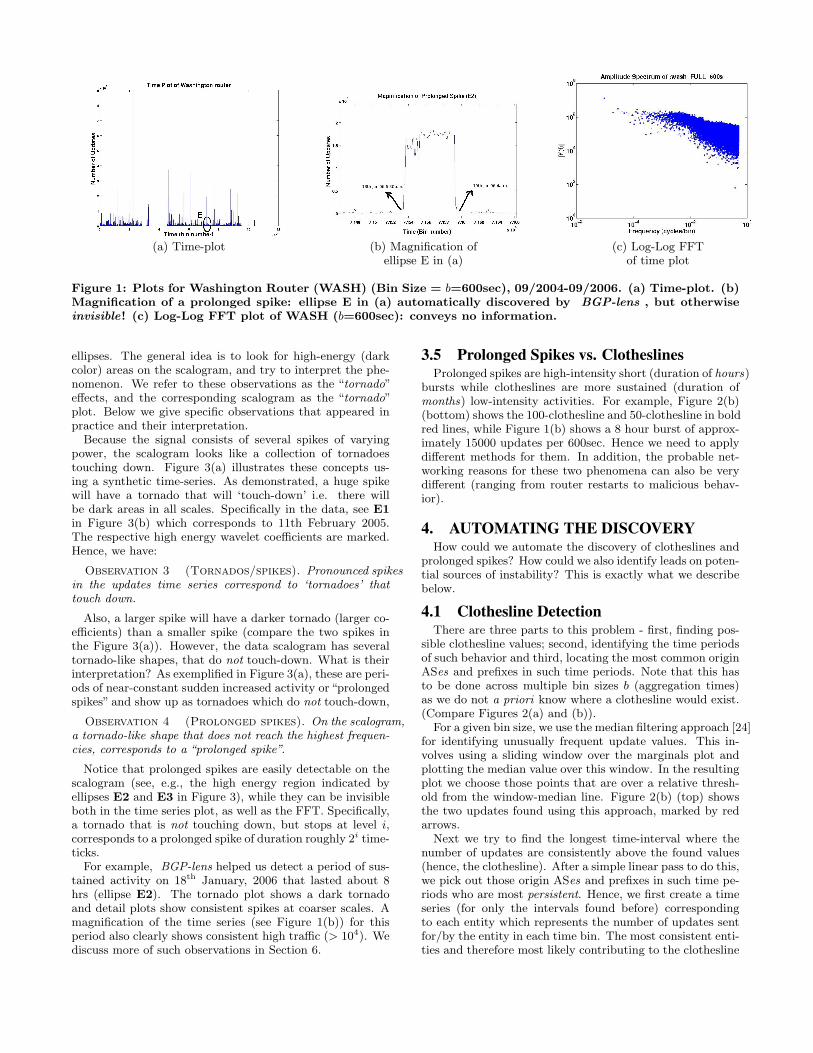
(a) Time-plot (b) Magnification of (c) Log-Log FFTellipse E in (a) of time plot
Figure 1: Plots for Washington Router (WASH) (Bin Size = b=600sec), 09/2004-09/2006. (a) Time-plot. (b)Magnification of a prolonged spike: ellipse E in (a) automatically discovered by BGP-lens , but otherwiseinvisible! (c) Log-Log FFT plot of WASH (b=600sec): conveys no information.
ellipses. The general idea is to look for high-energy (darkcolor) areas on the scalogram, and try to interpret the phe-nomenon. We refer to these observations as the “tornado”effects, and the corresponding scalogram as the “tornado”plot. Below we give specific observations that appeared inpractice and their interpretation.
Because the signal consists of several spikes of varyingpower, the scalogram looks like a collection of tornadoestouching down. Figure 3(a) illustrates these concepts us-ing a synthetic time-series. As demonstrated, a huge spikewill have a tornado that will ‘touch-down’ i.e. there willbe dark areas in all scales. Specifically in the data, see E1in Figure 3(b) which corresponds to 11th February 2005.The respective high energy wavelet coefficients are marked.Hence, we have:
Observation 3 (Tornados/spikes). Pronounced spikesin the updates time series correspond to ‘tornadoes’ thattouch down.
Also, a larger spike will have a darker tornado (larger co-efficients) than a smaller spike (compare the two spikes inthe Figure 3(a)). However, the data scalogram has severaltornado-like shapes, that do not touch-down. What is theirinterpretation? As exemplified in Figure 3(a), these are peri-ods of near-constant sudden increased activity or “prolongedspikes” and show up as tornadoes which do not touch-down,
Observation 4 (Prolonged spikes). On the scalogram,a tornado-like shape that does not reach the highest frequen-cies, corresponds to a “prolonged spike”.
Notice that prolonged spikes are easily detectable on thescalogram (see, e.g., the high energy region indicated byellipses E2 and E3 in Figure 3), while they can be invisibleboth in the time series plot, as well as the FFT. Specifically,a tornado that is not touching down, but stops at level i,corresponds to a prolonged spike of duration roughly 2i time-ticks.
For example, BGP-lens helped us detect a period of sus-tained activity on 18th January, 2006 that lasted about 8hrs (ellipse E2). The tornado plot shows a dark tornadoand detail plots show consistent spikes at coarser scales. Amagnification of the time series (see Figure 1(b)) for thisperiod also clearly shows consistent high traffic (> 104). Wediscuss more of such observations in Section 6.
3.5 Prolonged Spikes vs. ClotheslinesProlonged spikes are high-intensity short (duration of hours)
bursts while clotheslines are more sustained (duration ofmonths) low-intensity activities. For example, Figure 2(b)(bottom) shows the 100-clothesline and 50-clothesline in boldred lines, while Figure 1(b) shows a 8 hour burst of approx-imately 15000 updates per 600sec. Hence we need to applydifferent methods for them. In addition, the probable net-working reasons for these two phenomena can also be verydifferent (ranging from router restarts to malicious behav-ior).
4. AUTOMATING THE DISCOVERYHow could we automate the discovery of clotheslines and
prolonged spikes? How could we also identify leads on poten-tial sources of instability? This is exactly what we describebelow.
4.1 Clothesline DetectionThere are three parts to this problem - first, finding pos-
sible clothesline values; second, identifying the time periodsof such behavior and third, locating the most common originASes and prefixes in such time periods. Note that this hasto be done across multiple bin sizes b (aggregation times)as we do not a priori know where a clothesline would exist.(Compare Figures 2(a) and (b)).
For a given bin size, we use the median filtering approach [24]for identifying unusually frequent update values. This in-volves using a sliding window over the marginals plot andplotting the median value over this window. In the resultingplot we choose those points that are over a relative thresh-old from the window-median line. Figure 2(b) (top) showsthe two updates found using this approach, marked by redarrows.
Next we try to find the longest time-interval where thenumber of updates are consistently above the found values(hence, the clothesline). After a simple linear pass to do this,we pick out those origin ASes and prefixes in such time pe-riods who are most persistent. Hence, we first create a timeseries (for only the intervals found before) correspondingto each entity which represents the number of updates sentfor/by the entity in each time bin. The most consistent enti-ties and therefore most likely contributing to the clothesline

(a) Bin Size 10s: Marginal Plot (top) (b) Bin Size 600s: Marginal Plot (top)and Clotheslines Plot and Clotheslines Plot
Figure 2: Clotheslines and aggregation bin sizes (a) Bin Size 10sec (b) Bin Size 600sec. Clotheslines markedwith bold red lines (automatically discovered by BGP-lens )
would be the ones whose time series’ have the least variance.These can now serve as an initial lead for the sysadmin. Inshort the procedure is:
1. For each time bin size b=2i, derive the correspondingmarginals plot.
2. For each marginals plot use the median filtering ap-proach to determine ‘outliers’; Rank them accordingto their deviations, and pick the top N .
3. For each of the previous outliers, find the longest time-interval from the corresponding clothesline plot.
4. For each time interval found, report the most consis-tent IPs/ASes etc.
4.2 Prolonged Spike DetectionThe problem of finding a prolonged spike can be stated as
one to find tornadoes in the scalogram which don’t ‘touch-down’. The suspected time-period would be the scale of thelevel at which the tornado stops. The entire algorithm isshown in Algorithm 1. It outputs a set of smallest timeintervals containing the prolonged spikes.
Note that it takes in two parameters, τsens and τduration
corresponding to user sensitivity for a spike’s strength andduration. BGP-lens, by default, is set it to 60% and 8 re-spectively - this means that BGP-lens will report spikes
Algorithm 1 Prolonged Spike
Require: Timeseries T , τsens, τduration
1: M = Wavelet transform of T2: len = maximum wavelet level in M3: for l = τduration to len do4: cmax = max(M(l, :))5: for all coefficients c in M(l, :), c > τsens ∗ cmax do6: intrc = time interval corresponding to c7: best interval = find tornado(intrc, intrc, l)8: print “Prolonged spike found in” best interval9: end for
10: end for
– find tornado(intr, intrbest, l)
1: if l > len then2: return intrbest
3: end if4: cmax = max(M(l, :))5: if ∃ only 1 coefficient c in M(l, :), c > τsens ∗ cmax then6: intrc = time interval corresponding to c7: return find tornado(intr, intrc, l + 1)8: else9: return intrbest
10: end if

(a) Synthetic: scalogram (top) (b) Real: scalogram (top)and time-plot and time-plot
Figure 3: Time-series and their wavelet scalograms: (a) Synthetic series (b) Real series (WASH)
whose corresponding wavelet coefficients are within 60% ofthe maximum and whose duration is at least 2len−8+1 (where2len is the duration of our time series). Having spotted thetime-intervals of interest, BGP-lens must acquire all rele-vant updates for each time interval and find the associatedheavy hitters with respect to origin ASes, prefixes etc. Theseare the initial leads for a sysadmin to follow, to determinethe cause of the events.
4.3 ScalabilityHow scalable are our algorithms? This is a natural ques-
tion as the BGP-lens has been designed to run on largebody of updates. We have given a running time vs. numberof months of updates plot in Figure 4. It plots the runningtime of our tool for discovering the top-5 anomalies versusupdates gathered in 1, 3, 6, 12, 24 months for the Washing-ton router. The experiments were performed on commodityhardware having two AMD Opteron dual-core 2.4GHz CPUs(4 cores), 48G memory and the OS as Fedora Core 5. Therunning time are averages over 3 runs. Clearly, we grow lin-early - in addition, even for running over 2 years worth ofdata (> 18 million updates) we take less than 4 mins. Thismakes BGP-lens attractive to be deployed actively on realnetworks.
5. DISCUSSIONIn this section, we discuss the self-similarity of BGP-updates
and expand on our human interface design principle.
5.1 Burstiness AnalysisAs we mentioned before in Section 3, tools like DFT etc.
are ill-suited to such time-series due to the inherent bursti-ness. While analyzing this, we discovered that our time-
Figure 4: Scalability Results: Plot of Running Timevs. Number of months of updates. Detecting top-5anomalies.
series, is in fact, self-similar. We first give a little backgroundon entropy and self-similarity and then note our findings.
Entropy. There are several ways to measure self-similarity(Hurst exponent, variance plot etc). Among them, we choosethe so-called entropy plot which is more robust and leads toan intuitive interpretation with the b-model [26].
In more detail, the entropy plot Hs(P ) of a sequence Pis defined as the entropy Hs as a function of scale s. Weelaborate next: Let pt be the fraction of packets at time-tickt (so that they sum up to 1). We divide the time sequence

into 2s disjoint, equal intervals, and we define s as the scale.Let pt,s be the fraction of packets at interval t and scale s.
The entropy Hs(P ) of the time sequence P = p1, . . . , pt, . . .at scale s is defined by Shannon’s entropy formula [20]:
Hs(P ) = −2sX
t=0
pt,s log2 pt,s
and it clearly increases with the scale s. If our traffic isself-similar for some range of scales (s1, s2), then the entropyplot is linear for this range, and the slope is by definition theinformation fractal dimension D1 [19].
A generator that gives self-similar sequences and linear en-tropy plots is the so-called b-model [26]. A “b”-model withbias parameter b generates activity recursively: If the totalnumber of packets is, say, N , during the full interval of ob-servation, and b=0.8 (80-20 law), then the first half of thetime interval receives b=80% fraction of the activity, and thesecond half receives the remaining 20%; and so on, recur-sively, for the quarters, eighths, etc. Figure 5(a) illustratesthe first few steps of the recursive generation of such burstytraffic. Figure 5(b) plots the generated traffic, with bias fac-tor b=0.8, after 210 subdivisions. For traffic generated by ab-model, the slope s of the entropy plot, and the bias factorb obey the equation s = − b log2 b − (1 − b) log2(1 − b)(see [26] for the proof).
Findings in our Data. Several network-related traffic se-quences exhibit self-similar behavior [11]. Is this the casehere? Figure 6 repeats the time-plot and also gives the en-tropy plot for the full sequence (Washington router, 2 yearsduration, b = 600sec). We use the entropy plot that we de-scribed earlier, and indeed we see that the plot is a straightline with slope 0.83 (Figure 6(b)). This approximately cor-responds to a b-model of 75-25. This motivates the needto use a multi-resolution technique like wavelets rather thanDFT.
5.2 User InterfaceAs developed, BGP-lens was a series of command line
tools. In order to improve usability, we spent time designingan admin-friendly graphical user interface. We describe thedetails next and show an example screenshot (Figure 7).
BGP-lens is ready to be used without any manual config-uration: it will scan the data at multiple thresholds usingdefault values, identify and rank statistical deviations, andreport them to the user in order of statistical significance.
To increase the usefulness of the tool, we also provide “ba-sic” and “advanced” modes of operation. In more detail, ourcomponents for identifying prolonged spikes and clotheslinescontain user knobs for better control over the exploration.Broadly, they can be classified into ‘sensitivity’ knobs and‘duration’ knobs. The sensitivity knobs control the num-ber of ‘suspicious’ events that the sys-admin is willing tolook into: the higher the sensitivity, the more events we re-turn. The duration knobs control the length of the eventsthat BGP-lens will check (e.g., daily versus monthly, ver-sus yearly disturbances). The important point is that theseknobs are (a) optional and (b) they have settings like ‘low’,‘medium’, ‘high’, thus hiding all the details of the underly-ing algorithms.
Figure 7: BGP-lens GUI Example
6. BGP-LENS AT WORKIn this section, we demonstrate the impact that BGP-lens
can have when used as a network administration tool. First,BGP-lens identifies phenomena that may escape the radarof sys-admins or other monitoring tools. Second, it provideleads as to where to look for the origin of the observed phe-nomena.
6.1 ClotheslinesAs mentioned earlier, BGP-lens detected two distinct clothes-
line phenomena, the 50-clothesline and the 100-clothesline,both at bin size b=10 minutes. The former was observedfrom approximately late-August to late-September 2005. Thelatter clothesline lasted approximately 1 month, from Febru-ary to March 2005.
Digging deeper: a success story. While simply identify-ing an anomaly is interesting, BGP-lens goes further andpresents potential leads in the form of the origin AS(es) andprefixes most commonly observed contributing to clotheslineeffects. Table 2 indicates the AS origin and prefixes thatcontributed to the periodic 50-clothesline. Note that our in-terest is not to claim that all BGP routers see this clotheslinebehavior, but the capability of the tool to identify such pe-culiar behaviors automatically within a very large dataset.
BGP-lens pointed to the education network of the stateof Alabama (AL Supercomputer Net) as a potential sourceof this phenomenon. We contacted the administrators ofthe network who attributed the anomaly to changes whiletransitioning address space causing IGP route flapping, sothat “the route for 207.157.115.0/24 was appearing and dis-appearing in [the] IGP routing table ... [which] may havecaused BGP to flap.” We contacted other network adminis-trators, but in many cases we did not get a response.
Note that this particularly anomaly shows up so stronglyusing BGP-lens, but it went undetected and unresolved, de-spite its 30 day duration, in a professionally managed net-work. We believe that this incident highlights the need forautomated, parameter-free anomaly detection for routingevents.

(a) generation (b) synthetic data (c) entropy plot
Figure 5: Illustration of the b-model: (a) the recursive 80-20 procedure in its first three iterations (b) thegenerated synthetic activity (eg., number of updates, over time) (c) its entropy plot (entropy versus scale - seetext) Because the synthetic input traffic is self-similar, the entropy plot is linear, that is, scale free. Its slopeis 0.881, much different than 1.0, which would be the uniform distribution (50-50)
(a) Time plot (b) Entropy Plot
Figure 6: Time plots are bursty. Number of updates over time for an Abilene node (WASHINGTON),09/2004-09/2006. (a) time plot in linear-linear axes (b) entropy plot. Notice that the time-plot is bursty,and that the entropy plot is linear, with slope 0.83, which implies self-similarity - no characteristic scales.
6.2 Prolonged SpikesBGP-lens detects prolonged spikes in the number of BGP
update messages across multiple different time-scales as weexplained earlier. Spikes are directly related to route insta-bility and the overall health of inter-domain routing.
We detected three examples of prolonged BGP updatespikes that would go unnoticed with most previous tech-niques. The first spike was observed on May 12, 2006 witha duration of approximately 5 hours. Table 3 shows theobserved number of updates and leads as to the origin ASand prefix contributing the most update messages to thespike. In fact, our analysis of this spike attributes the pri-mary sources of BGP update to primary and middle schoolsin the city of Guangzhou, China. Unfortunately, despite nu-merous attempts, we did not receive a response from the theGuangzhou network administrators.
Two more spikes were observed on January 18-19, 2006lasting approximately 8 hours, and on August 1, 2005 last-ing approximately 3 hours. BGP-lens provides again thestarting points of where to look for the cause of these spikes,but the results are omitted due to space limitations.
7. CONCLUSIONSIn this paper, we develop BGP-lens, a novel, admin-friendly
tool for automatically detecting surprising patterns and anoma-lies of BGP updates at many different scales of observation.The key characteristics of our approach are:
1. It is effective, spotting subtle phenomena like the ‘clothes-lines’ and ‘prolonged spikes’.
2. It is admin-friendly, requiring no parameters and pro-viding leads to network administrators, like most fre-quent IP addresses and paths, in the phenomenon ofinterest.
3. It is scalable: All its algorithms are linear on the num-ber of time-ticks, and thus BGP-lens can handle hugedatasets.
In addition we discover surprising aspects of the data:
• Marginals that are mixture of log-normals with a power-law tail.
• Self-similarity corresponding to a 75-25 b-model (=slope of 0.83 in the entropy plot).

Table 2: 50-Clothesline Results, 22-Aug to 25-Sept-2005
MedianOrigin AS #Updates Comments
4788 235 TM Net, Malaysia3464 21 AL Supercomp. Net, US10036 134 C&M Comm., Korea9768 109 KT, Korea
MedianPrefixes #Updates Comments
207.157.115.0/24 14 AL Supercomp Net, US192.211.42.0/24 14 AL Ind. Dev. Training, US216.109.38.0/24 14 AL Supercomp. Net, US192.94.104.0/22 14 U. of NE Medical Center
Table 3: Prolonged Spike Results, 12-May-2005
Origin AS #Updates Comments
4538 229960 CERNET, China9406 4976 CERNET, China23911 1516 CERNET, China
Prefixes #Updates Comments
222.200.236.0/23 1314 CERNET, China222.203.64.0/24 1311 CERNET, China222.202.96.0/24 1311 CERNET, China
Future work will focus on making the algorithms incremen-tal and “any-time”, so that we can deploy it as a non-stopmonitoring tool.
8. REFERENCES[1] G. E. Box, G. M. Jenkins, and G. C. Reinsel. Time Series
Analysis: Forecasting and Control. Prentice Hall,Englewood Cliffs, NJ, 3rd edition, 1994.
[2] D. Chakrabarti and C. Faloutsos. F4: Large-scaleautomated forecasting using fractals. CIKM 2002, Nov.2002.
[3] I. Daubechies. Ten Lectures on Wavelets. Capital CityPress, Montpelier, Vermont, 1992. Society for Industrialand Applied Mathematics (SIAM), Philadelphia, PA.
[4] C. Faloutsos, M. Ranganathan, and Y. Manolopoulos. Fastsubsequence matching in time-series databases. In Proc.ACM SIGMOD, pages 419–429, Minneapolis, MN, May25-27 1994. ‘Best Paper’ award; also available asCS-TR-3190, UMIACS-TR-93-131, ISR TR-93-86.
[5] A. Feldmann, O. Maennel, Z. M. Mao, A. Berger, andB. Maggs. Locating Internet Routing Instabilities.SIGCOMM Comput. Commun. Rev., 34(4):205–218, 2004.
[6] D. Field. Scale-invariance and self-similar ‘wavelet’transforms: an analysis fo natural scenes and mammalianvisual systems. In M. Farge, J. Hunt, and J. Vassilicos,editors, Wavelets, Fractals, and Fourier Transforms, pages151–193. Clarendon Press, Oxford, 1993.
[7] T. Karagiannis, M. Molle, and M. Faloutsos. AUser-Friendly Self-Similarity Analysis Tool. In ACMComputer Communication Review, volume 33, pages81–93, 2004.
[8] E. J. Keogh, K. Chakrabarti, S. Mehrotra, and M. J.Pazzani. Locally adaptive dimensionality reduction forindexing large time series databases. In SIGMODConference, Santa Barbara, CA, 2001.
[9] C. Labovitz, G. R. Malan, and F. Jahanian. Internetrouting instability. In SIGCOMM ’97: Proceedings of theACM SIGCOMM ’97 conference on Applications,technologies, architectures, and protocols for computercommunication, pages 115–126, New York, NY, USA, 1997.ACM.
[10] C. Labovitz, G. R. Malan, and F. Jahanian. Origins ofinternet routing instability. Technical ReportCSE-TR-368-98, 1998.
[11] W. Leland, M. Taqqu, W. Willinger, and D. Wilson. Onthe self-similar nature of ethernet traffic. IEEETransactions on Networking, 2(1):1–15, Feb. 1994. (earlierversion in SIGCOMM ’93, pp 183-193).
[12] O. Maennel and A. Feldmann. Realistic BGP Traffic forTest Labs. SIGCOMM Comput. Commun. Rev.,32(4):31–44, 2002.
[13] H. B. N. Feamster, D. Andersen and F. Kaashoek. Bgpmonitor - the datapository project,http://www.datapository.net/bgpmon/.
[14] A. V. Oppenheim and R. W. Schafer. Digital SignalProcessing. Prentice-Hall, Englewood Cliffs, N.J., 1975.
[15] S. Papadimitriou, A. Brockwell, and C. Faloutsos.Adaptive, hands-off stream mining. VLDB, Sept. 2003.
[16] W. H. Press, S. A. Teukolsky, W. T. Vetterling, and B. P.Flannery. Numerical Recipes in C. Cambridge UniversityPress, 2nd edition, 1992.
[17] D. Rafiei and A. O. Mendelzon. Similarity-based queries fortime series data. In SIGMOD Conference, pages 13–25,Tucson, AZ, 1997.
[18] T. Sauer. Time series prediction using delay coordinateembedding. In A. S. Weigend and N. A. Gershenfeld,editors, Time Series Prediction: Forecasting the Future andUnderstanding the Past. Addison-Wesley, 1994.
[19] M. Schroeder. Fractals, Chaos, Power Laws: Minutes froman Infinite Paradise. W.H. Freeman and Company, NewYork, 1991.
[20] C. E. Shannon and W. Weaver. Mathematical Theory ofCommunication. University of Illinois Press, 1963.
[21] L. Subramanian, M. Caesar, C. T. Ee, M. Handley,M. Mao, S. Shenker, and I. Stoica. HLP: A NextGeneration Inter-Domain Routing Protocol. SIGCOMMComput. Commun. Rev., 35(4):13–24, 2005.
[22] S. T. Teoh, K. Zhang, S.-M. Tseng, K.-L. Ma, and S. F.Wu. Combining Visual and Automated Data Mining forNear-Real-Time Anomaly Detection and analysis in BGP.In VizSEC/DMSEC ’04: Proceedings of the 2004 ACMworkshop on Visualization and data mining for computersecurity, pages 35–44, New York, NY, USA, 2004. ACM.
[23] S.-M. Tseng, S. F. Wu, X. Zhao, and K. Zhang. ReverseEngineering the Management Actions from Observed BGPData. In IEEE Workshop on Automated NetworkManagement, INFOCOM 2008, 2008.
[24] D. Vernon. Machine Vision: Automated Visual Inspectionand Robot Vision. Prentice-Hall International (UK) Ltd.,1991.
[25] K. Wang and S. Shamma. Spectral shape analysis in thecentral auditory system. NNSP, Sept. 1993.
[26] M. Wang, T. Madhyastha, N. H. Chang, S. Papadimitriou,and C. Faloutsos. Data mining meets performanceevaluation: Fast algorithms for modeling bursty traffic.ICDE, Feb. 2002.