Embed Size (px)
Citation preview

Investor Presentation
August 2018
Bharti Airtel
Bharti Airtel: Who Are We
Bharti Airtel Limited 2
Thirdlargest telecom
operator in the
world
#1operator in India2
and
#2 operator in Africa3
Presence in
16countries1 serving
around 457 mn
customers
Highest standards of
Corporate
Governance – ranked
#1 by Transparency
International
Our Guiding Strategy
Win customers
through differentiated
products and world
class technology
Accelerate non-mobile
business, grow market
share and strip out
waste
Highest Corporate
Governance and
disclosure rankings
Customer
Centricity
Performance
Excellence
Transparency and
Ethical Governance
Sources - 1. Excluding JV in Africa (Ghana) 2. Only integrated operator with wireless, wireline & satellite TV. 3. Market leadership (Rank 1 or 2) in 12 of 14 countries
Bharti Airtel: Investment Rationale
Bharti Airtel Limited 3
1
3
4
5
2
6
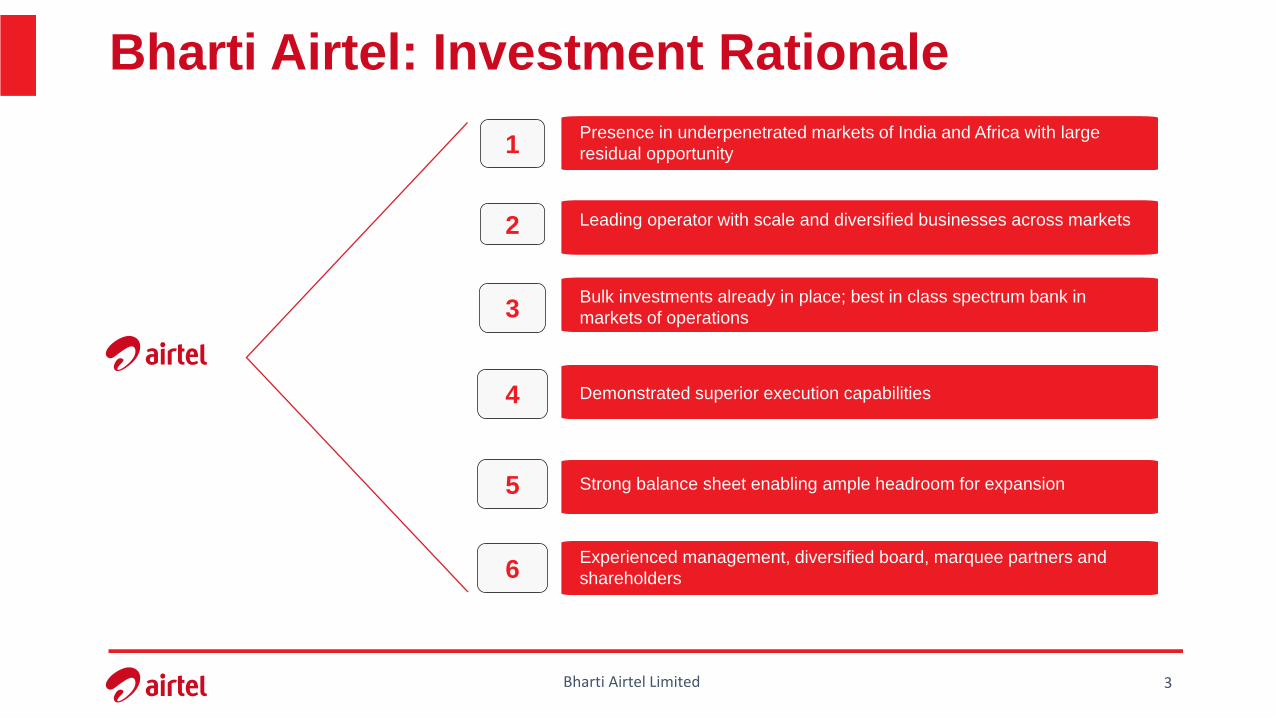
Presence in underpenetrated markets of India and Africa with large
residual opportunity
Leading operator with scale and diversified businesses across markets
Bulk investments already in place; best in class spectrum bank in
markets of operations
Demonstrated superior execution capabilities
Strong balance sheet enabling ample headroom for expansion
Experienced management, diversified board, marquee partners and
shareholders
Bharti Airtel Limited 4
India & Africa - Mobile Market
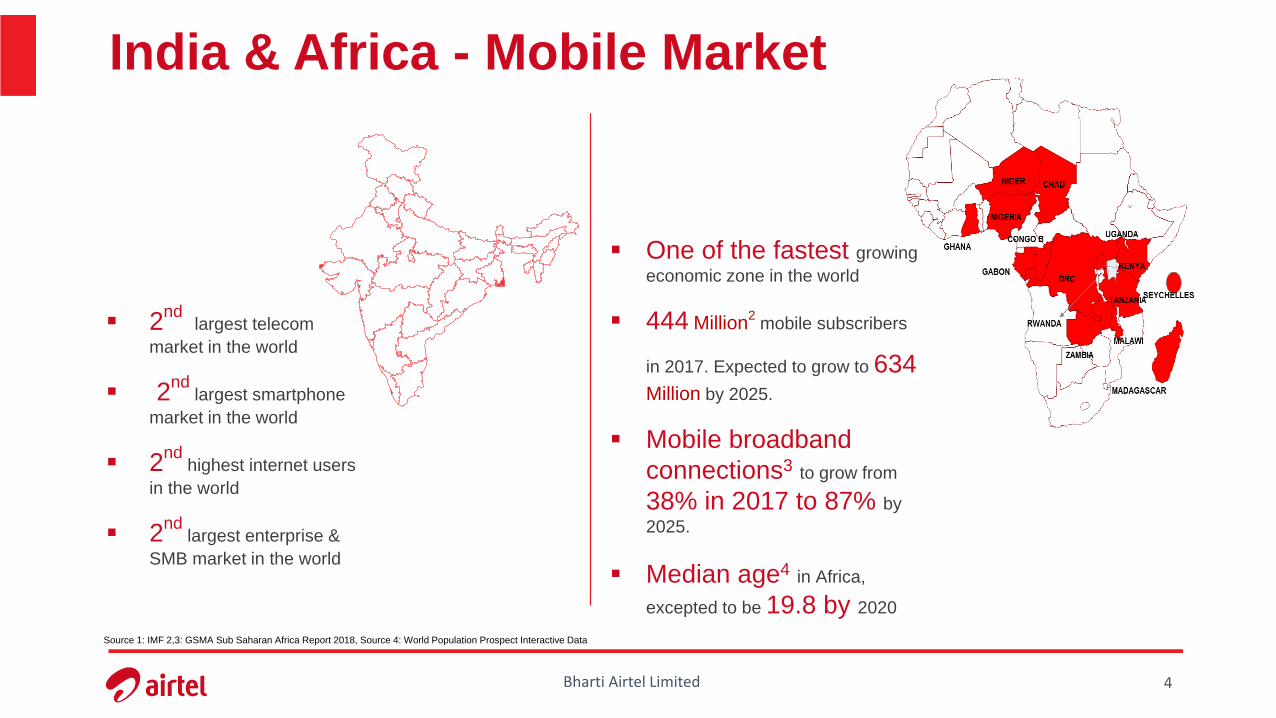
2nd
largest telecom
market in the world
2nd
largest smartphone
market in the world
2nd
highest internet users
in the world
2nd
largest enterprise &
SMB market in the world
One of the fastest growing
economic zone in the world
444 Million2
mobile subscribers
in 2017. Expected to grow to 634Million by 2025.
Mobile broadband
connections3 to grow from
38% in 2017 to 87% by
2025.
Median age4 in Africa,
excepted to be 19.8 by 2020
Source 1: IMF 2,3: GSMA Sub Saharan Africa Report 2018, Source 4: World Population Prospect Interactive Data
Bharti Airtel Limited 5
Opportunity in Indian Telecom
WIRELESS WIRELESS DATA WIRED BROADBAND
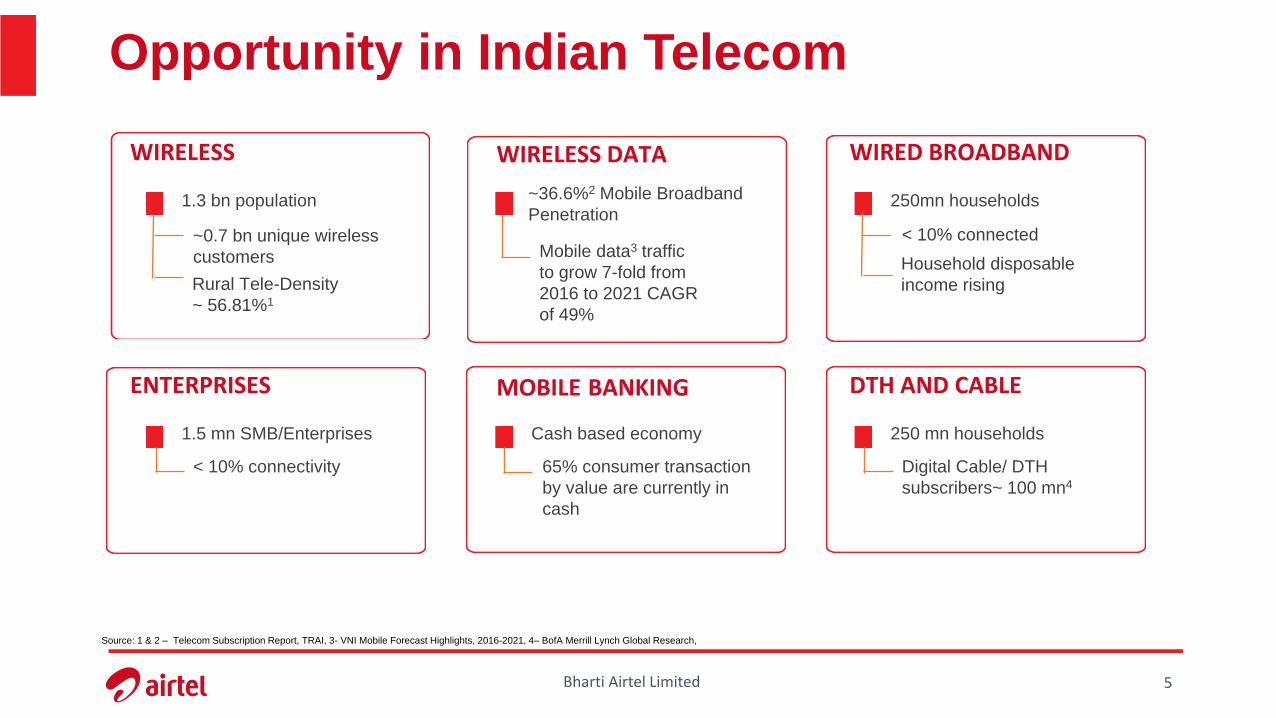
1.3 bn population ~36.6%2 Mobile Broadband
Penetration250mn households
Rural Tele-Density
~ 56.81%1
~0.7 bn unique wireless
customers Household disposable
income rising
< 10% connected
ENTERPRISES MOBILE BANKING DTH AND CABLE
1.5 mn SMB/Enterprises Cash based economy 250 mn households
< 10% connectivity Digital Cable/ DTH
subscribers~ 100 mn4
65% consumer transaction
by value are currently in
cash
Massive untapped opportunitySource: 1 & 2 – Telecom Subscription Report, TRAI, 3- VNI Mobile Forecast Highlights, 2016-2021, 4– BofA Merrill Lynch Global Research,
Mobile data3 traffic
to grow 7-fold from
2016 to 2021 CAGR
of 49%
Bharti Airtel Limited 6
Opportunity in African Telecom
WIRELESS SMARTPHONE PENETRATION1
MOBILE BANKING2
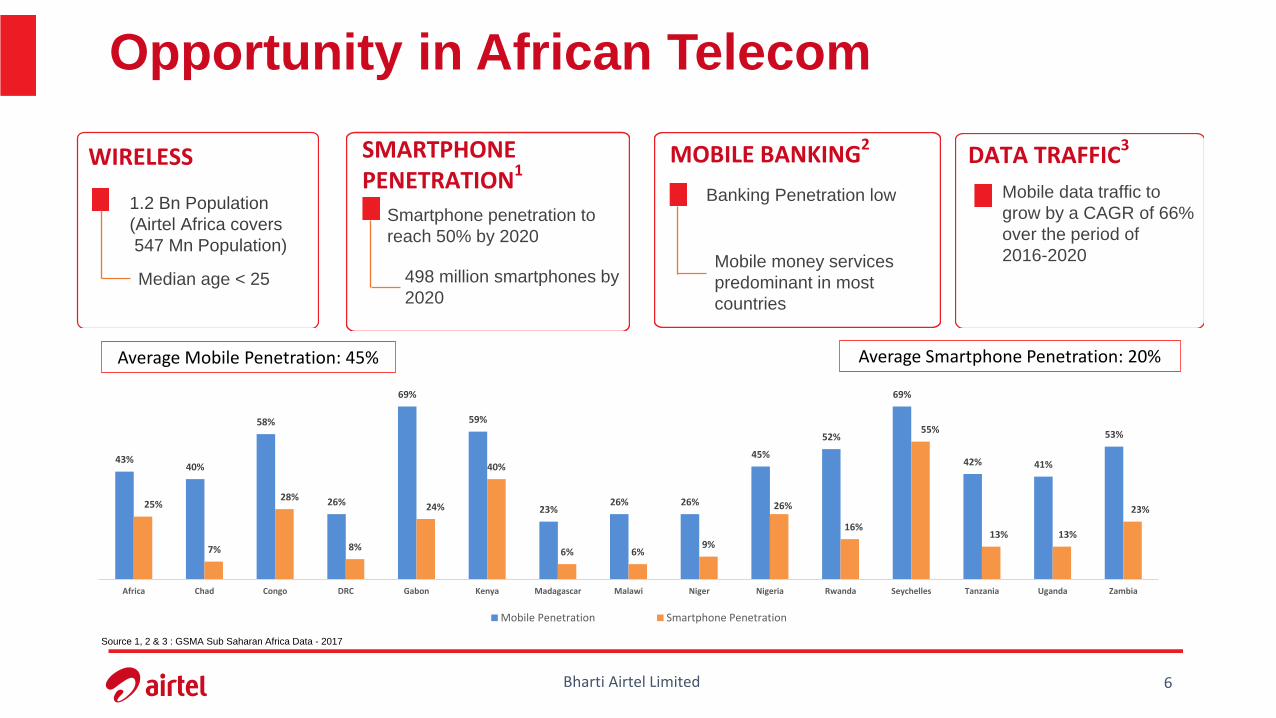
1.2 Bn Population
(Airtel Africa covers
547 Mn Population)
Median age < 25
Smartphone penetration to
reach 50% by 2020
498 million smartphones by
2020
Mobile money services
predominant in most
countries
Banking Penetration low
DATA TRAFFIC3
Mobile data traffic to
grow by a CAGR of 66%
over the period of
2016-2020
43%40%
58%
26%
69%
59%
23%26% 26%
45%
52%
69%
42% 41%
53%
25%
7%
28%
8%
24%
40%
6% 6%9%
26%
16%
55%
13% 13%
23%
Africa Chad Congo DRC Gabon Kenya Madagascar Malawi Niger Nigeria Rwanda Seychelles Tanzania Uganda Zambia
Mobile Penetration Smartphone Penetration
Source 1, 2 & 3 : GSMA Sub Saharan Africa Data - 2017
Average Mobile Penetration: 45% Average Smartphone Penetration: 20%
Bharti Airtel Limited 7
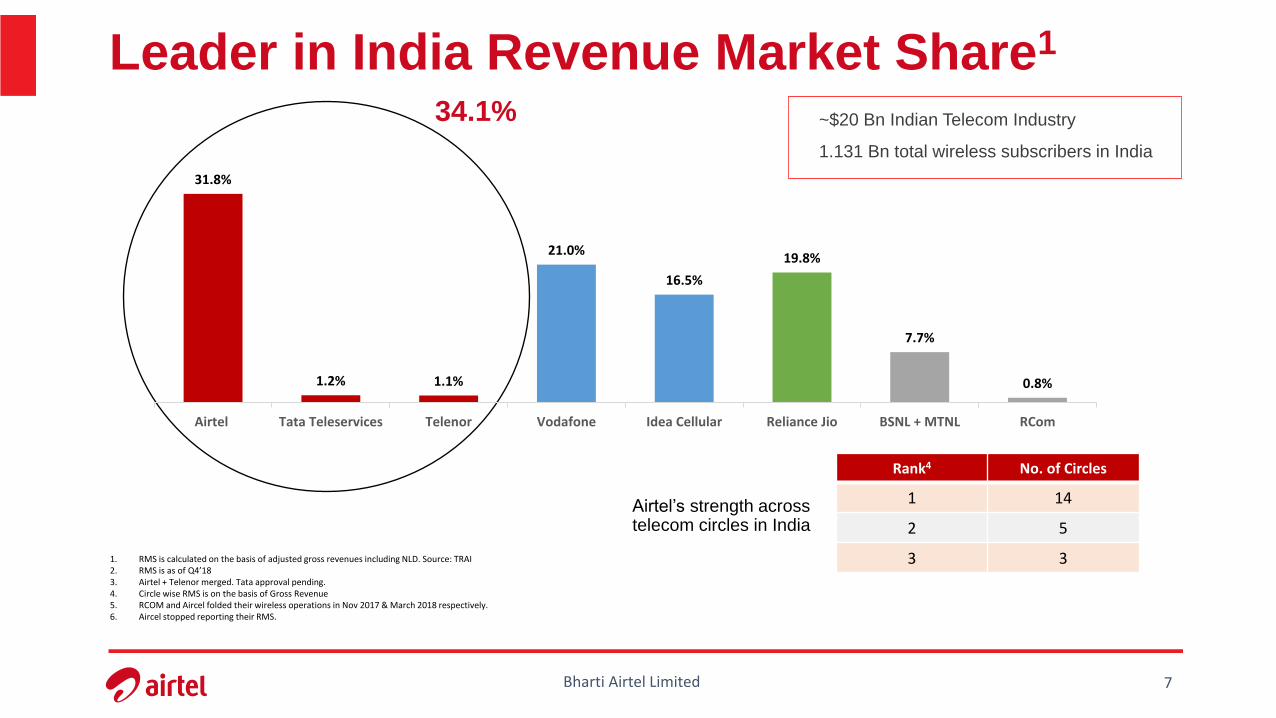
Leader in India Revenue Market Share1
34.1% ~$20 Bn Indian Telecom Industry
1.131 Bn total wireless subscribers in India
Rank4 No. of Circles
1 14
2 5
3 3
Airtel’s strength across telecom circles in India
1. RMS is calculated on the basis of adjusted gross revenues including NLD. Source: TRAI 2. RMS is as of Q4’183. Airtel + Telenor merged. Tata approval pending.4. Circle wise RMS is on the basis of Gross Revenue 5. RCOM and Aircel folded their wireless operations in Nov 2017 & March 2018 respectively.6. Aircel stopped reporting their RMS.
31.8%
1.2% 1.1%
21.0%
16.5%
19.8%
7.7%
0.8%
Airtel Tata Teleservices Telenor Vodafone Idea Cellular Reliance Jio BSNL + MTNL RCom
Bharti Airtel Limited 8
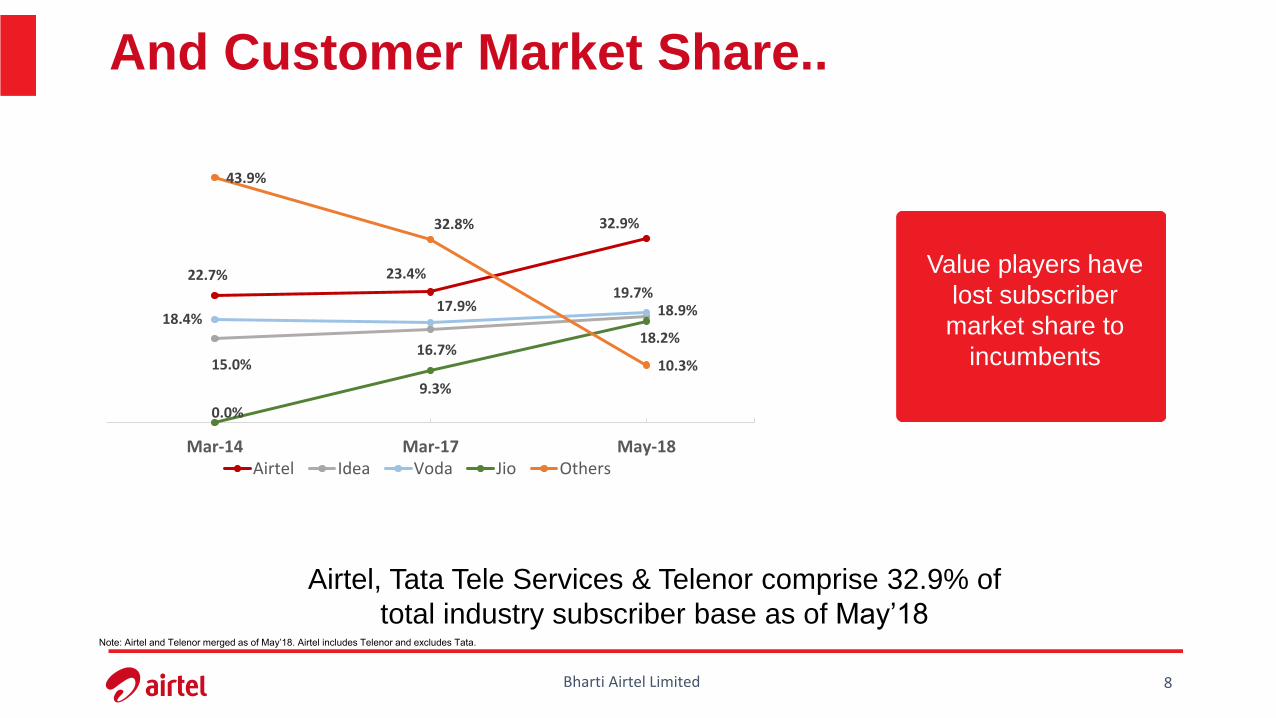
And Customer Market Share..
Value players have
lost subscriber
market share to
incumbents
Airtel, Tata Tele Services & Telenor comprise 32.9% of
total industry subscriber base as of May’18Note: Airtel and Telenor merged as of May’18. Airtel includes Telenor and excludes Tata.
22.7% 23.4%
32.9%
15.0%16.7%
18.9%18.4%
17.9%19.7%
0.0%
9.3%
18.2%
43.9%
32.8%
10.3%
Mar-14 Mar-17 May-18Airtel Idea Voda Jio Others
Bharti Airtel Limited 9
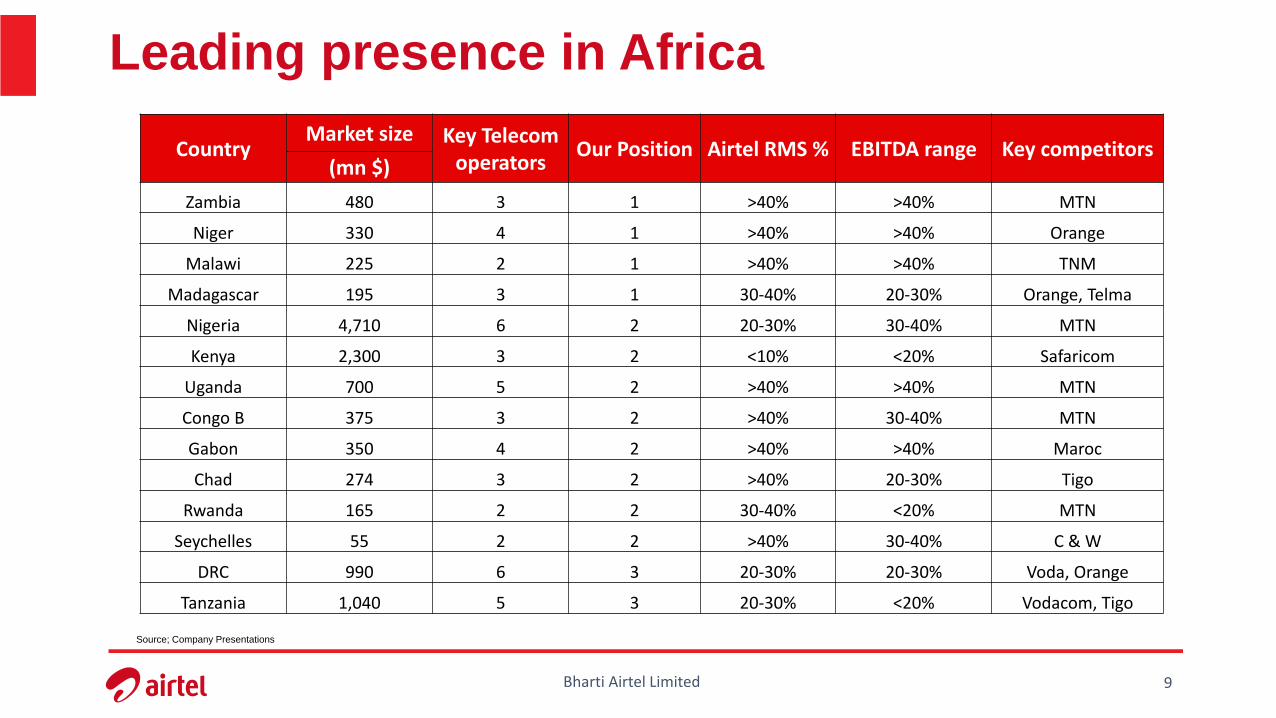
Leading presence in Africa
CountryMarket size Key Telecom
operatorsOur Position Airtel RMS % EBITDA range Key competitors
(mn $)
Zambia 480 3 1 >40% >40% MTN
Niger 330 4 1 >40% >40% Orange
Malawi 225 2 1 >40% >40% TNM
Madagascar 195 3 1 30-40% 20-30% Orange, Telma
Nigeria 4,710 6 2 20-30% 30-40% MTN
Kenya 2,300 3 2 <10% <20% Safaricom
Uganda 700 5 2 >40% >40% MTN
Congo B 375 3 2 >40% 30-40% MTN
Gabon 350 4 2 >40% >40% Maroc
Chad 274 3 2 >40% 20-30% Tigo
Rwanda 165 2 2 30-40% <20% MTN
Seychelles 55 2 2 >40% 30-40% C & W
DRC 990 6 3 20-30% 20-30% Voda, Orange
Tanzania 1,040 5 3 20-30% <20% Vodacom, Tigo
Source; Company Presentations
Bharti Airtel Limited 10
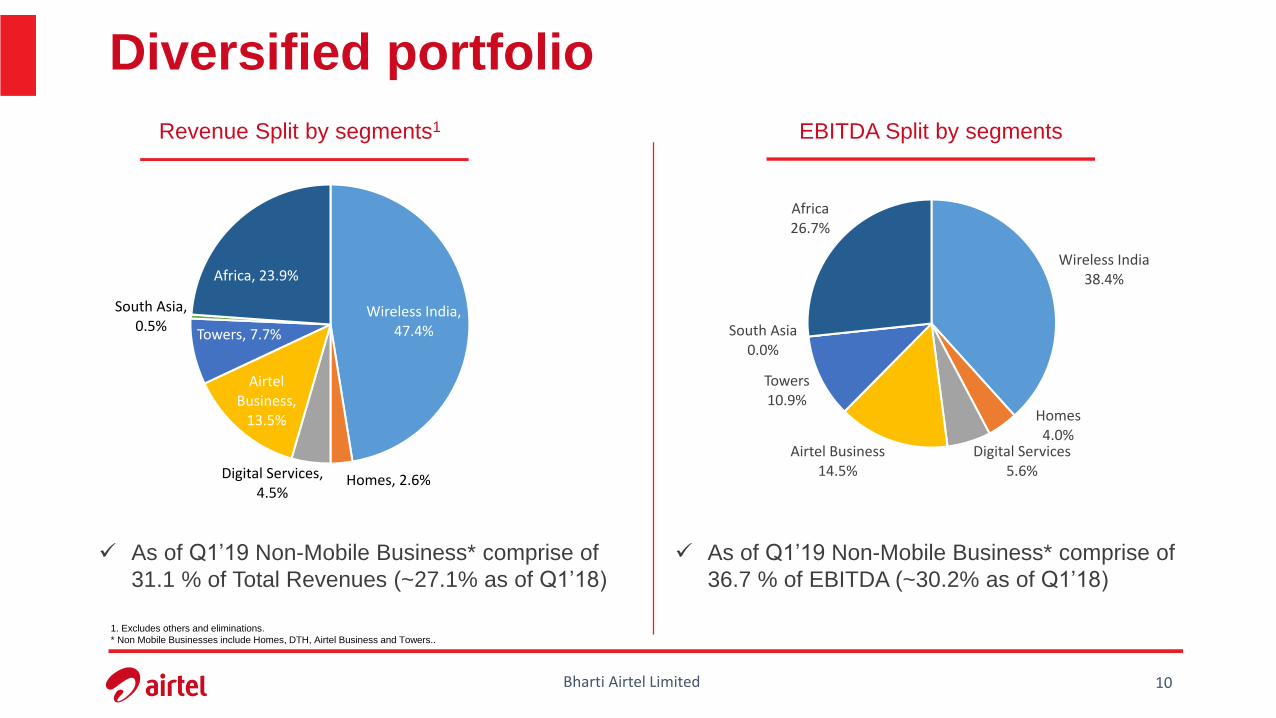
Diversified portfolio
Revenue Split by segments1
As of Q1’19 Non-Mobile Business* comprise of
31.1 % of Total Revenues (~27.1% as of Q1’18)
EBITDA Split by segments
1. Excludes others and eliminations.
* Non Mobile Businesses include Homes, DTH, Airtel Business and Towers..
Wireless India, 47.4%
Homes, 2.6%Digital Services, 4.5%
Airtel Business,
13.5%
Towers, 7.7%
South Asia, 0.5%
Africa, 23.9%Wireless India
38.4%
Homes4.0%
Digital Services5.6%
Airtel Business14.5%
Towers10.9%
South Asia0.0%
Africa26.7%
As of Q1’19 Non-Mobile Business* comprise of
36.7 % of EBITDA (~30.2% as of Q1’18)
Bharti Airtel Limited 11
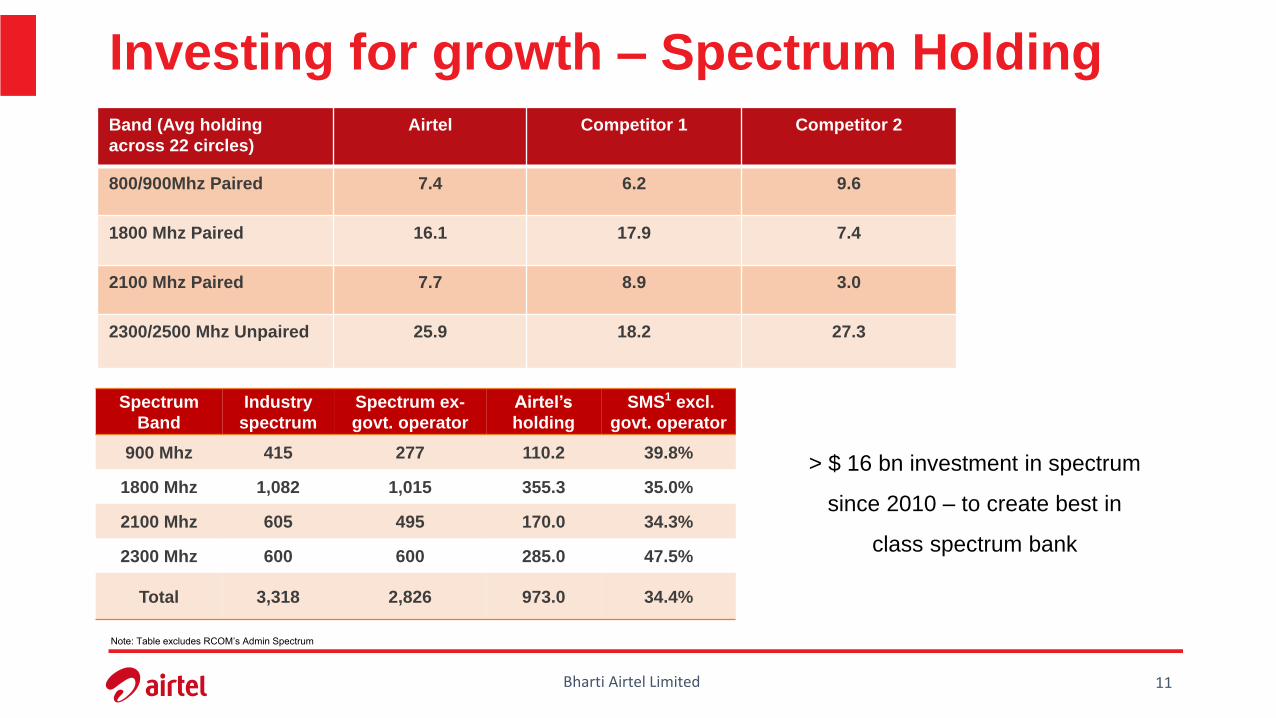
Investing for growth – Spectrum Holding
Spectrum
Band
Industry
spectrum
Spectrum ex-
govt. operator
Airtel’s
holding
SMS1 excl.
govt. operator
900 Mhz 415 277 110.2 39.8%
1800 Mhz 1,082 1,015 355.3 35.0%
2100 Mhz 605 495 170.0 34.3%
2300 Mhz 600 600 285.0 47.5%
Total 3,318 2,826 973.0 34.4%
Band (Avg holding
across 22 circles)
Airtel Competitor 1 Competitor 2
800/900Mhz Paired 7.4 6.2 9.6
1800 Mhz Paired 16.1 17.9 7.4
2100 Mhz Paired 7.7 8.9 3.0
2300/2500 Mhz Unpaired 25.9 18.2 27.3
> $ 16 bn investment in spectrum
since 2010 – to create best in
class spectrum bank
Note: Table excludes RCOM’s Admin Spectrum
Bharti Airtel Limited 12
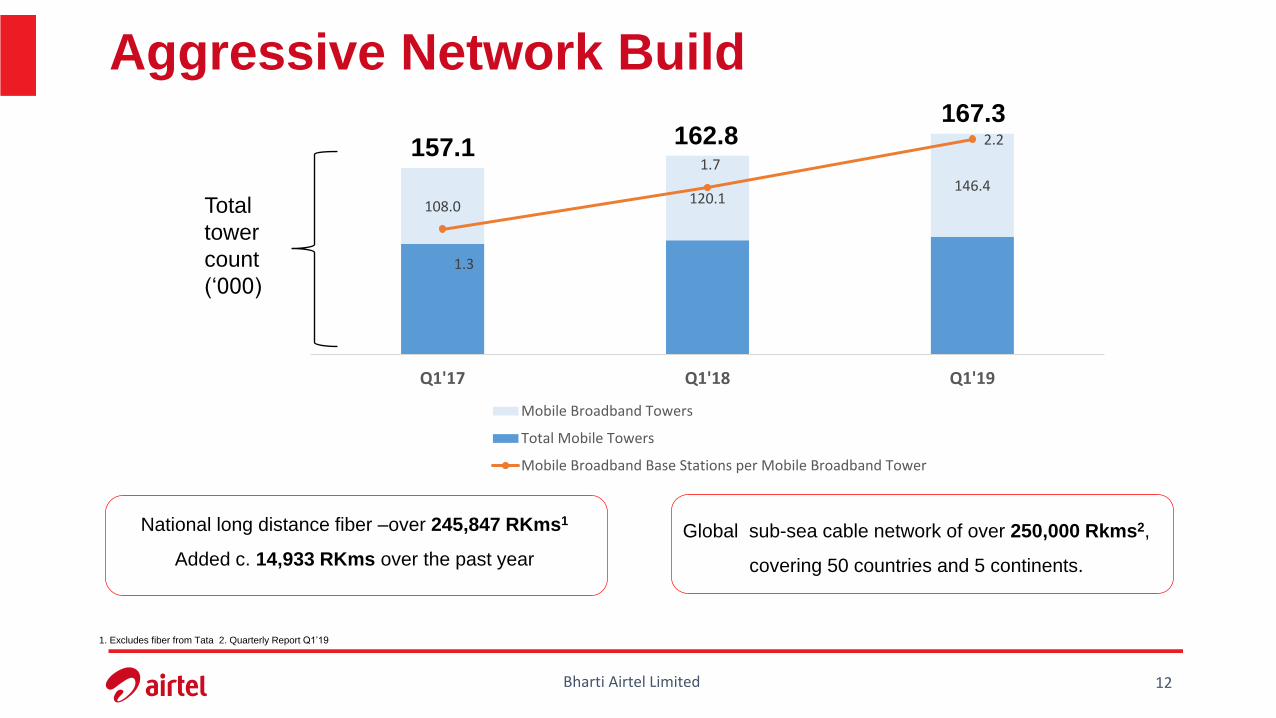
Aggressive Network Build
Total
tower
count
(‘000)
157.1 162.8167.3
National long distance fiber –over 245,847 RKms1
Added c. 14,933 RKms over the past year
Global sub-sea cable network of over 250,000 Rkms2,
covering 50 countries and 5 continents.
1. Excludes fiber from Tata 2. Quarterly Report Q1’19
108.0120.1
146.4
1.3
1.7
2.2
Q1'17 Q1'18 Q1'19
Mobile Broadband Towers
Total Mobile Towers
Mobile Broadband Base Stations per Mobile Broadband Tower
Bharti Airtel Limited 13
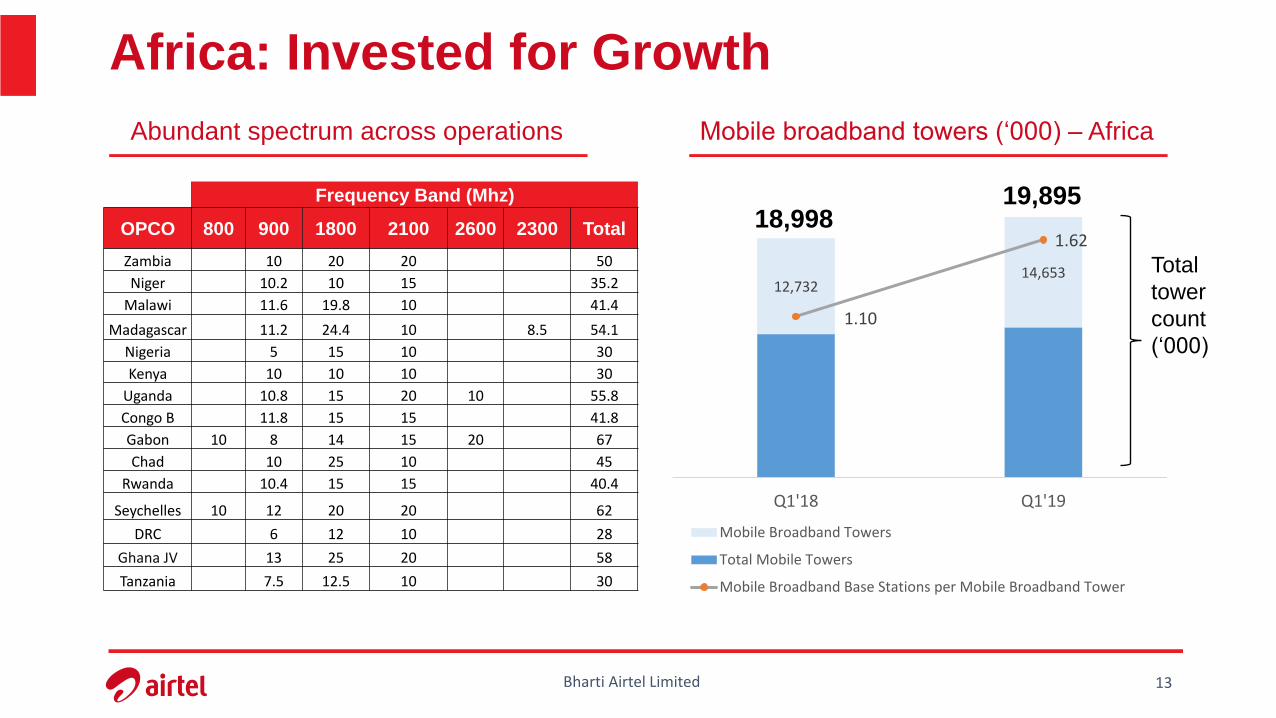
Africa: Invested for Growth
Frequency Band (Mhz)
OPCO 800 900 1800 2100 2600 2300 Total
Zambia 10 20 20 50
Niger 10.2 10 15 35.2
Malawi 11.6 19.8 10 41.4
Madagascar 11.2 24.4 10 8.5 54.1
Nigeria 5 15 10 30
Kenya 10 10 10 30
Uganda 10.8 15 20 10 55.8
Congo B 11.8 15 15 41.8
Gabon 10 8 14 15 20 67
Chad 10 25 10 45
Rwanda 10.4 15 15 40.4
Seychelles 10 12 20 20 62
DRC 6 12 10 28
Ghana JV 13 25 20 58
Tanzania 7.5 12.5 10 30
Abundant spectrum across operations Mobile broadband towers (‘000) – Africa
Total
tower
count
(‘000)
18,99819,895
12,732 14,653
1.10
1.62
Q1'18 Q1'19
Mobile Broadband Towers
Total Mobile Towers
Mobile Broadband Base Stations per Mobile Broadband Tower

STRATEGY
INDIA
Bharti Airtel Limited 15
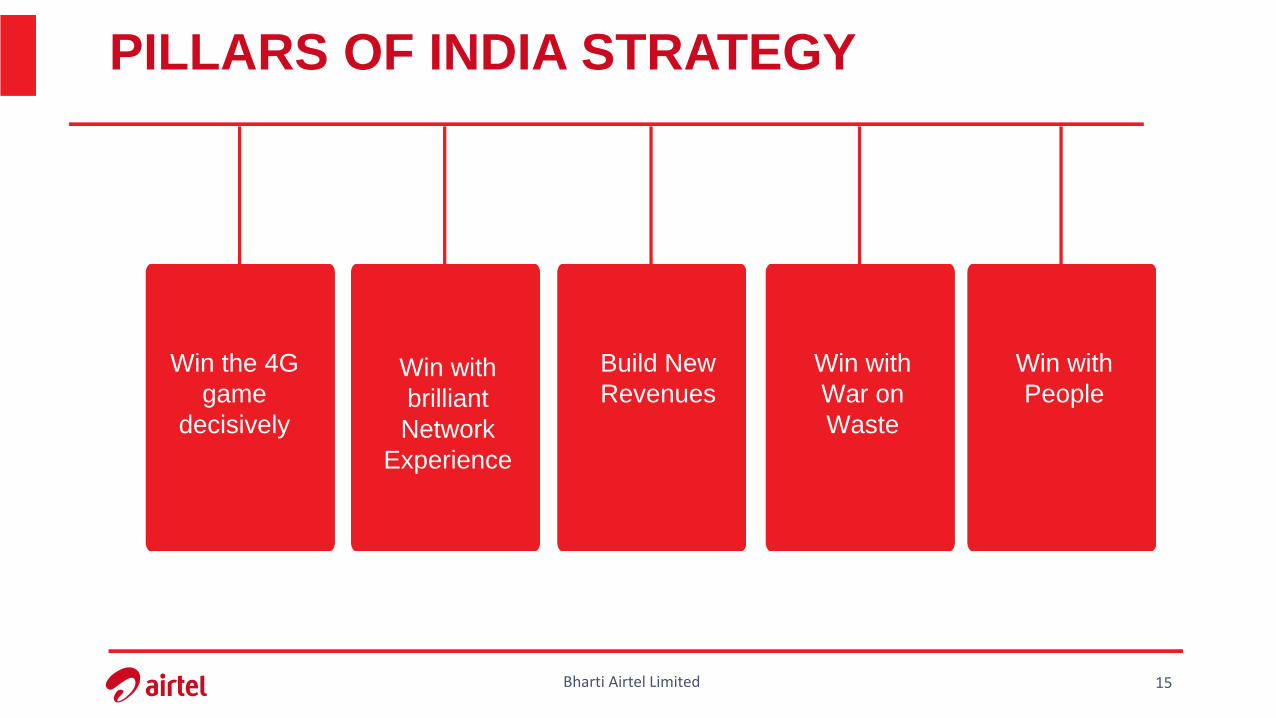
PILLARS OF INDIA STRATEGY
Win the 4G
game
decisively
Win with
brilliant
Network
Experience
Build New
Revenues
Win with
War on
Waste
Win with
People
Bharti Airtel Limited 16
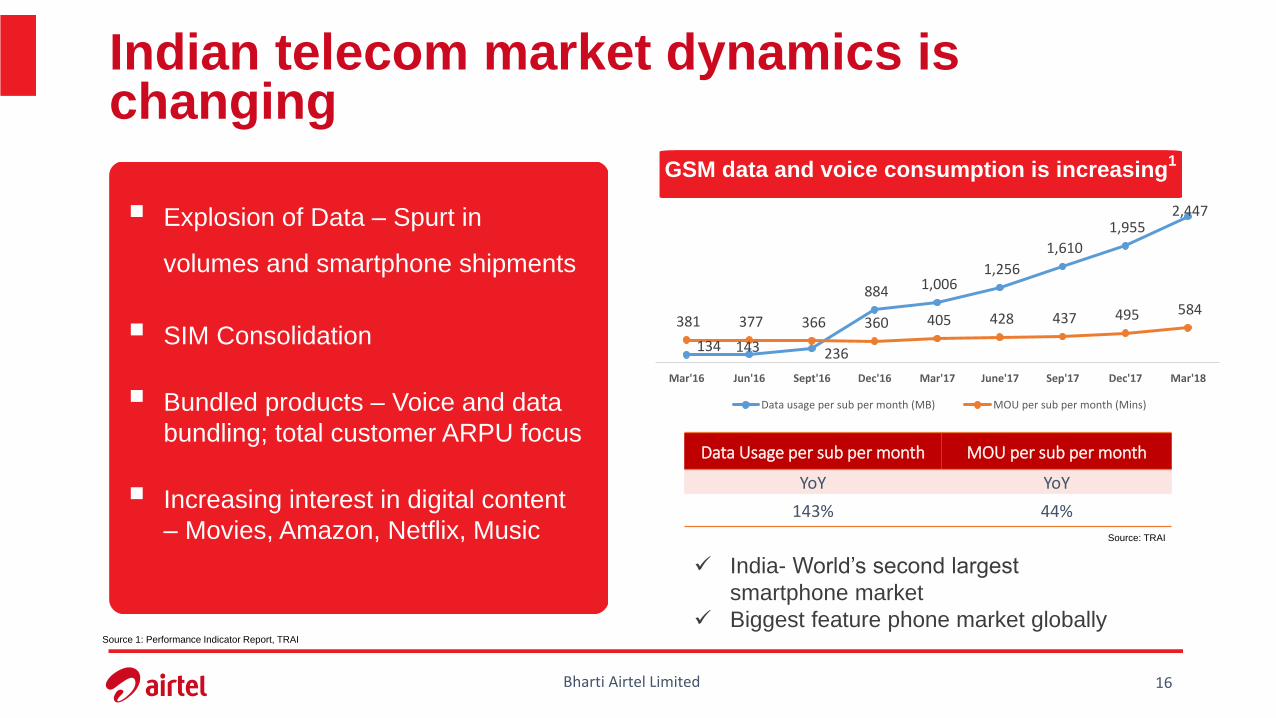
Indian telecom market dynamics is changing
Explosion of Data – Spurt in
volumes and smartphone shipments
SIM Consolidation
Bundled products – Voice and data
bundling; total customer ARPU focus
Increasing interest in digital content
– Movies, Amazon, Netflix, Music
GSM data and voice consumption is increasing1
Data Usage per sub per month MOU per sub per month
YoY YoY
143% 44%
India- World’s second largest
smartphone market
Biggest feature phone market globally
Source: TRAI
Source 1: Performance Indicator Report, TRAI
134 143 236
884 1,006 1,256
1,610
1,955 2,447
381 377 366 360 405 428 437 495 584
Mar'16 Jun'16 Sept'16 Dec'16 Mar'17 June'17 Sep'17 Dec'17 Mar'18
Data usage per sub per month (MB) MOU per sub per month (Mins)
Bharti Airtel Limited 17
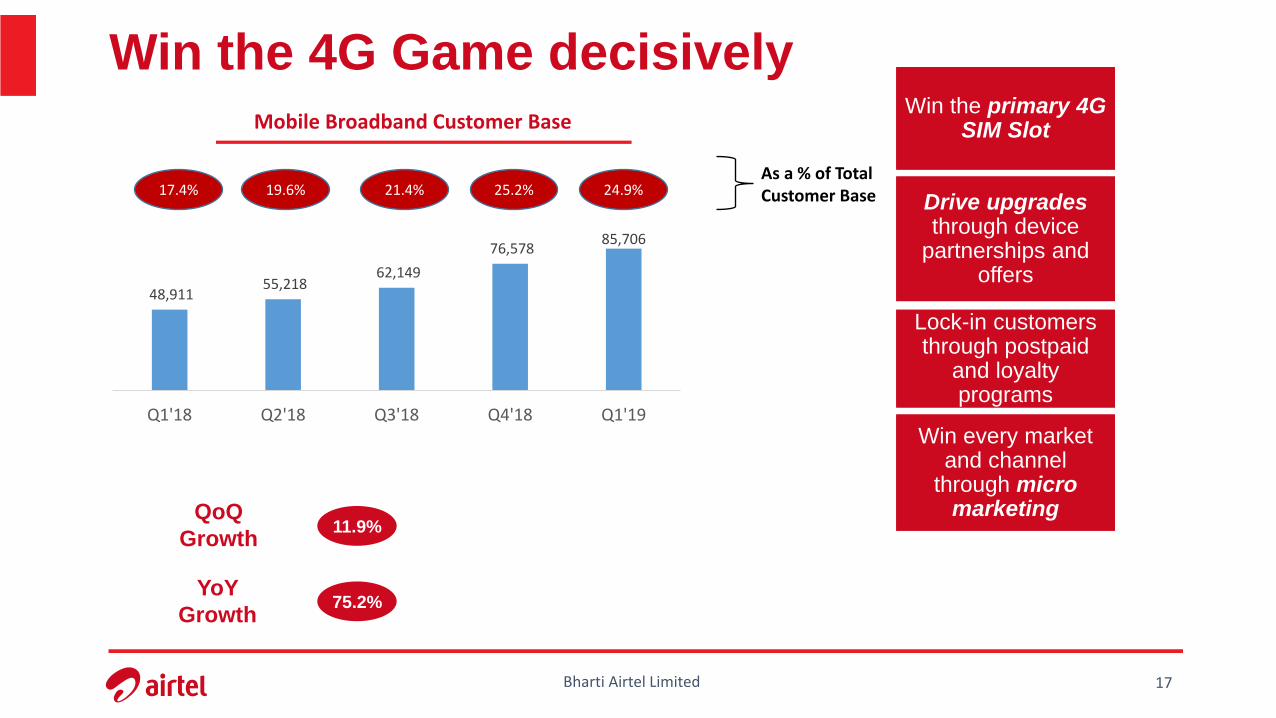
Win the 4G Game decisivelyMobile Broadband Customer Base
Win the primary 4G SIM Slot
Win every market and channel
through micro marketing
Drive upgrades through device
partnerships and offers
Lock-in customers through postpaid
and loyalty programs
QoQ
Growth
YoY
Growth
11.9%
75.2%
As a % of Total Customer Base
85,706 76,578
62,149 55,218
48,911
Q1'19Q4'18Q3'18Q2'18Q1'18
24.9%25.2%21.4%19.6%17.4%
Bharti Airtel Limited 18
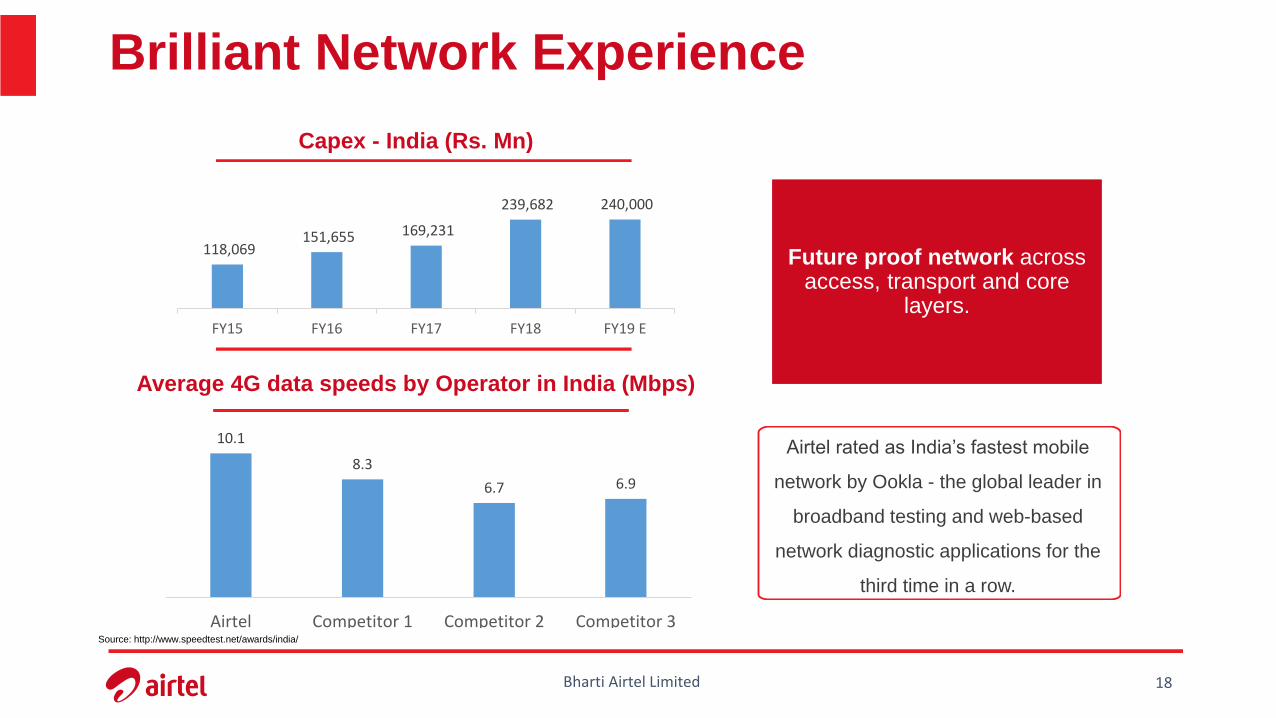
Brilliant Network Experience
Capex - India (Rs. Mn)
Average 4G data speeds by Operator in India (Mbps)
Future proof network across access, transport and core
layers.
Airtel rated as India’s fastest mobile
network by Ookla - the global leader in
broadband testing and web-based
network diagnostic applications for the
third time in a row.
Source: http://www.speedtest.net/awards/india/
118,069 151,655 169,231
239,682 240,000
FY15 FY16 FY17 FY18 FY19 E
10.1
8.3
6.7 6.9
Airtel Competitor 1 Competitor 2 Competitor 3
Bharti Airtel Limited 19
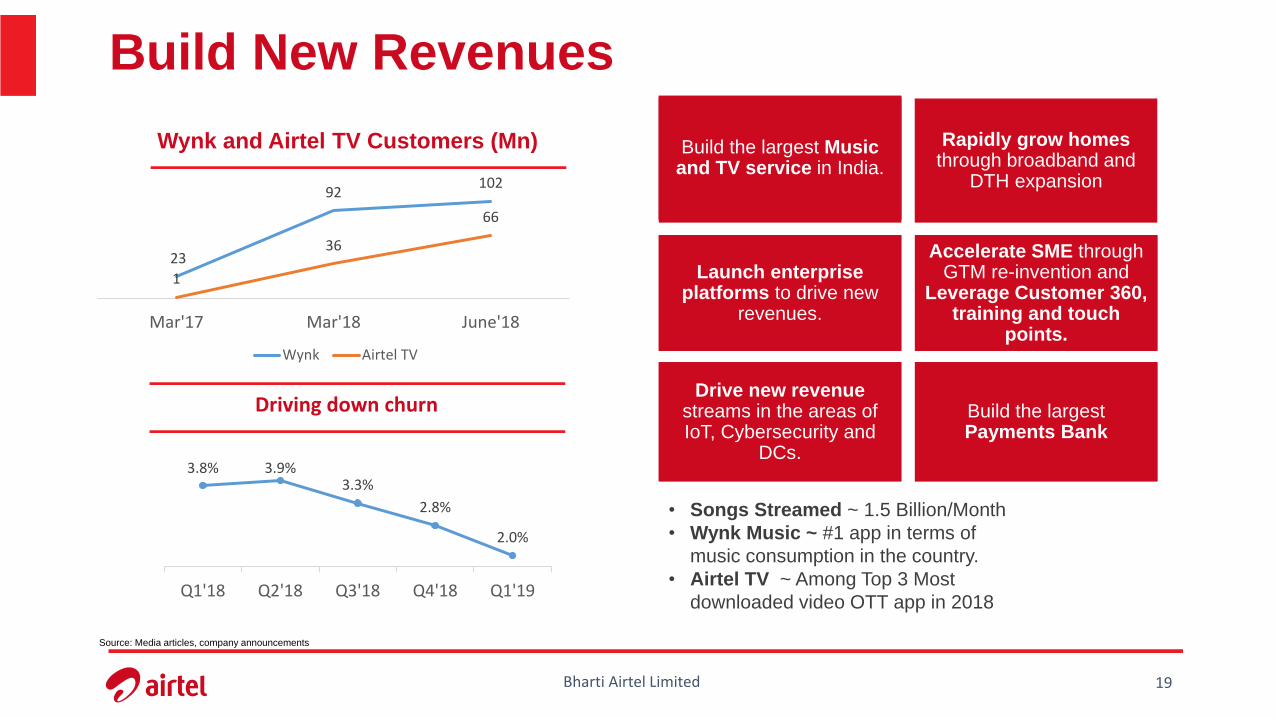
Build New Revenues
Wynk and Airtel TV Customers (Mn)
Driving down churn
Rapidly grow homes through broadband and
DTH expansion
Build the largest Music and TV service in India.
Launch enterprise platforms to drive new
revenues.
Accelerate SME through GTM re-invention and
Leverage Customer 360, training and touch
points.
Drive new revenue streams in the areas of IoT, Cybersecurity and
DCs.
Build the largest Payments Bank
• Songs Streamed ~ 1.5 Billion/Month
• Wynk Music ~ #1 app in terms of
music consumption in the country.
• Airtel TV ~ Among Top 3 Most
downloaded video OTT app in 2018
Source: Media articles, company announcements
23
92102
1
36
66
Mar'17 Mar'18 June'18
Wynk Airtel TV
3.8% 3.9%3.3%
2.8%
2.0%
Q1'18 Q2'18 Q3'18 Q4'18 Q1'19
Bharti Airtel Limited 20
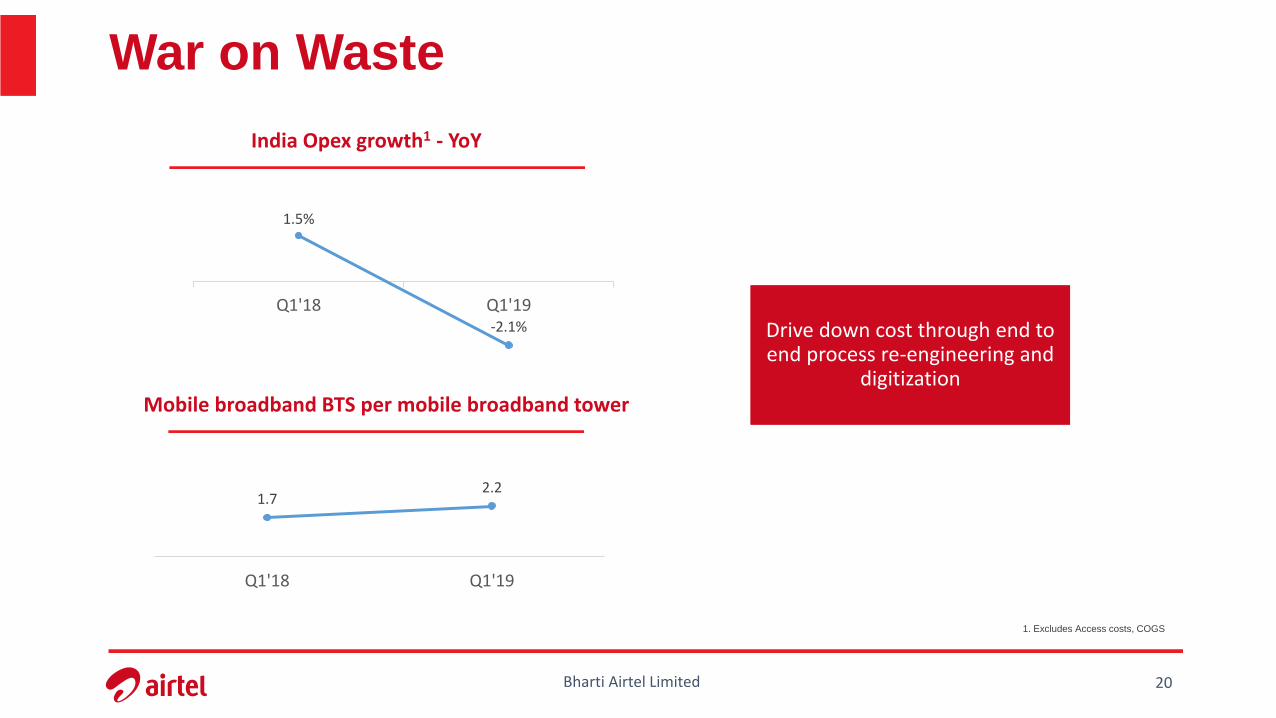
War on Waste
India Opex growth1 - YoY
Mobile broadband BTS per mobile broadband tower
Drive down cost through end to end process re-engineering and
digitization
1. Excludes Access costs, COGS
1.5%
-2.1%
Q1'18 Q1'19
1.72.2
Q1'18 Q1'19
STRATEGY
AFRICA
Bharti Airtel Limited 22
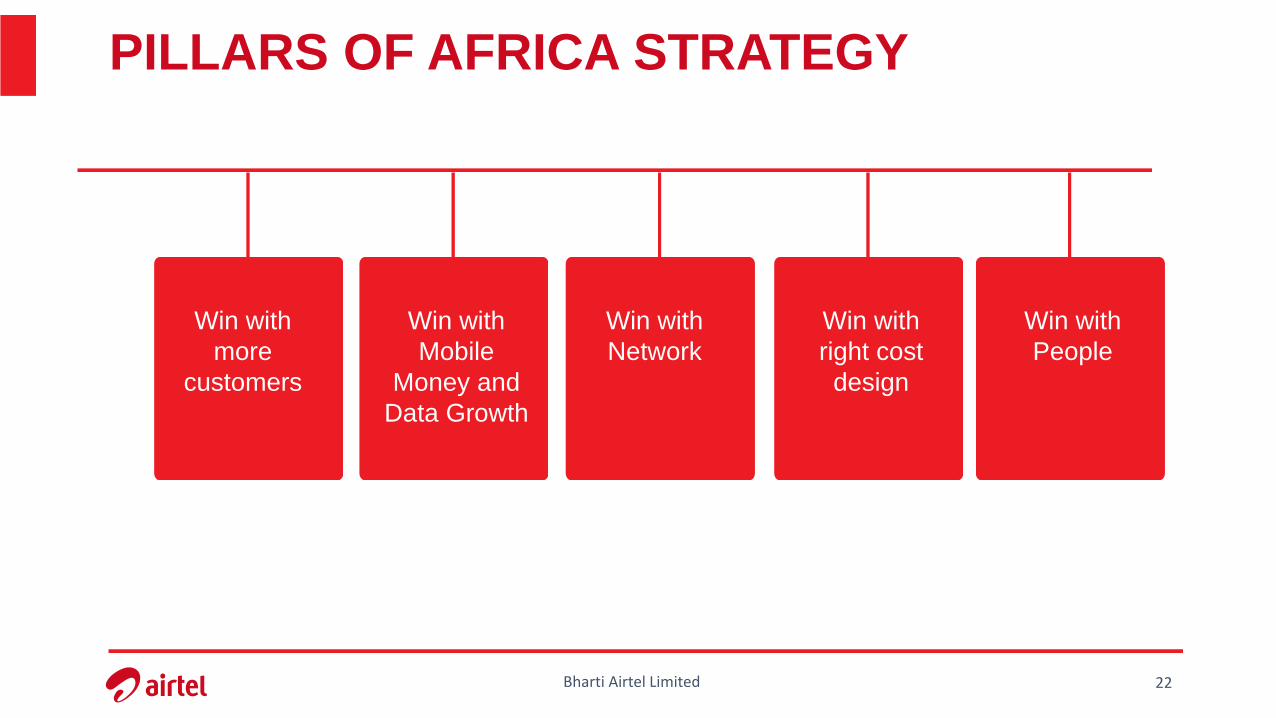
PILLARS OF AFRICA STRATEGY
Win with
more
customers
Win with
Mobile
Money and
Data Growth
Win with
Network
Win with
right cost
design
Win with
People
Key
Enablers
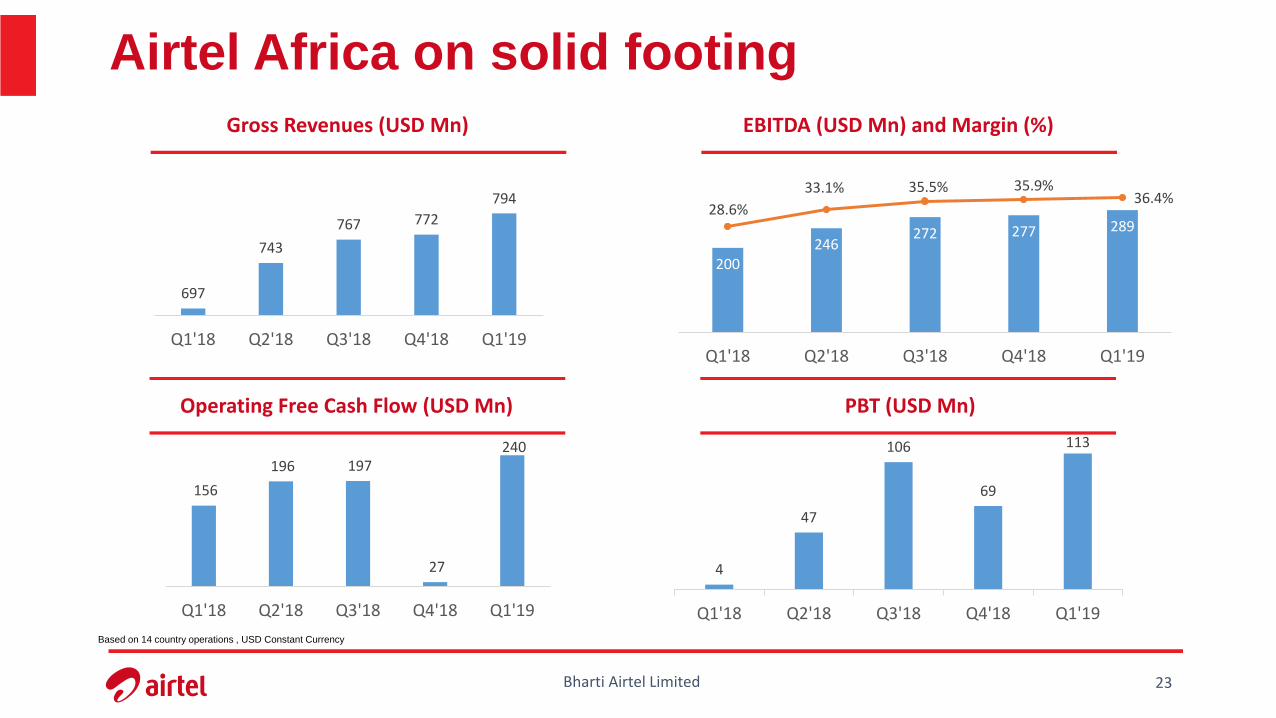
Bharti Airtel Limited 23
Airtel Africa on solid footing
Gross Revenues (USD Mn)
Operating Free Cash Flow (USD Mn)
EBITDA (USD Mn) and Margin (%)
Based on 14 country operations , USD Constant Currency
PBT (USD Mn)
200 246
272 277 289 28.6%
33.1% 35.5% 35.9%36.4%
Q1'18 Q2'18 Q3'18 Q4'18 Q1'19
697
743
767 772
794
Q1'18 Q2'18 Q3'18 Q4'18 Q1'19
156
196 197
27
240
Q1'18 Q2'18 Q3'18 Q4'18 Q1'19
4
47
106
69
113
Q1'18 Q2'18 Q3'18 Q4'18 Q1'19
Bharti Airtel Limited 24
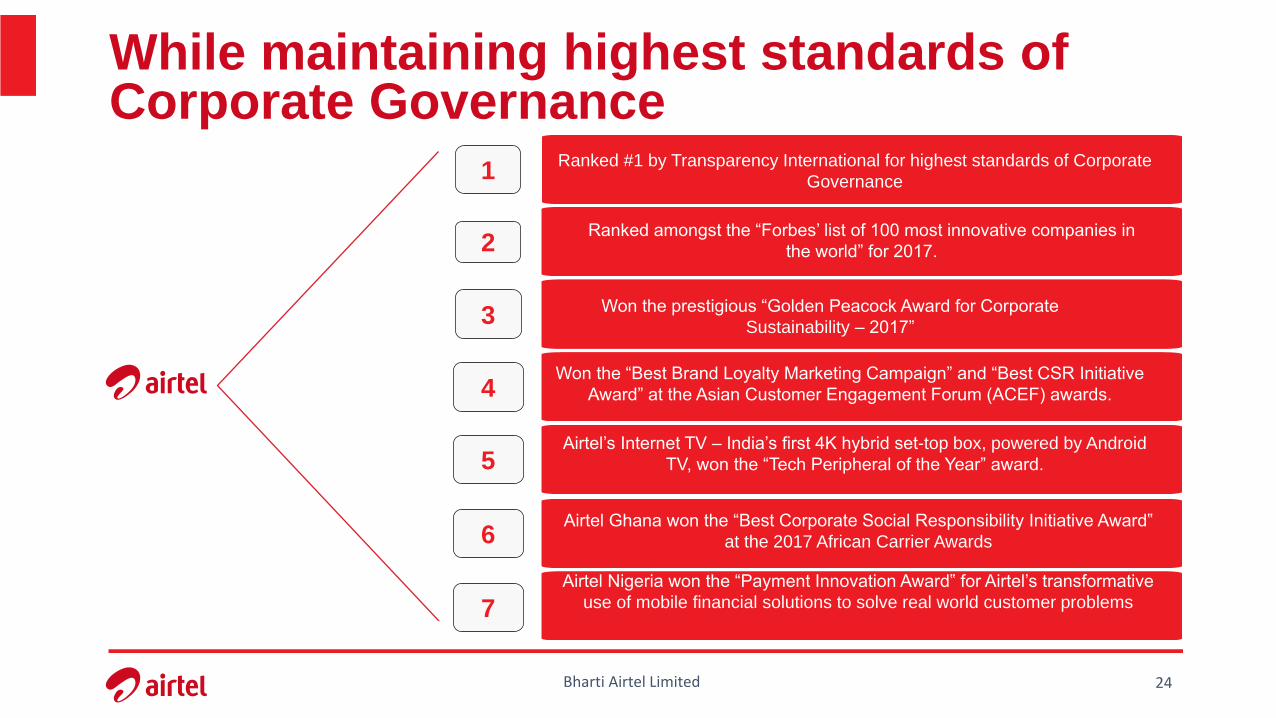
While maintaining highest standards of Corporate Governance
1
3
4
5
2
6
7
Ranked #1 by Transparency International for highest standards of Corporate
Governance
Airtel Nigeria won the “Payment Innovation Award‟ for Airtel’s transformative
use of mobile financial solutions to solve real world customer problems
Airtel Ghana won the “Best Corporate Social Responsibility Initiative Award‟
at the 2017 African Carrier Awards
Airtel’s Internet TV – India’s first 4K hybrid set-top box, powered by Android
TV, won the “Tech Peripheral of the Year” award.
Won the “Best Brand Loyalty Marketing Campaign” and “Best CSR Initiative
Award” at the Asian Customer Engagement Forum (ACEF) awards.
Won the prestigious “Golden Peacock Award for Corporate
Sustainability – 2017”
Ranked amongst the “Forbes’ list of 100 most innovative companies in
the world” for 2017.
Bharti Airtel Limited 25
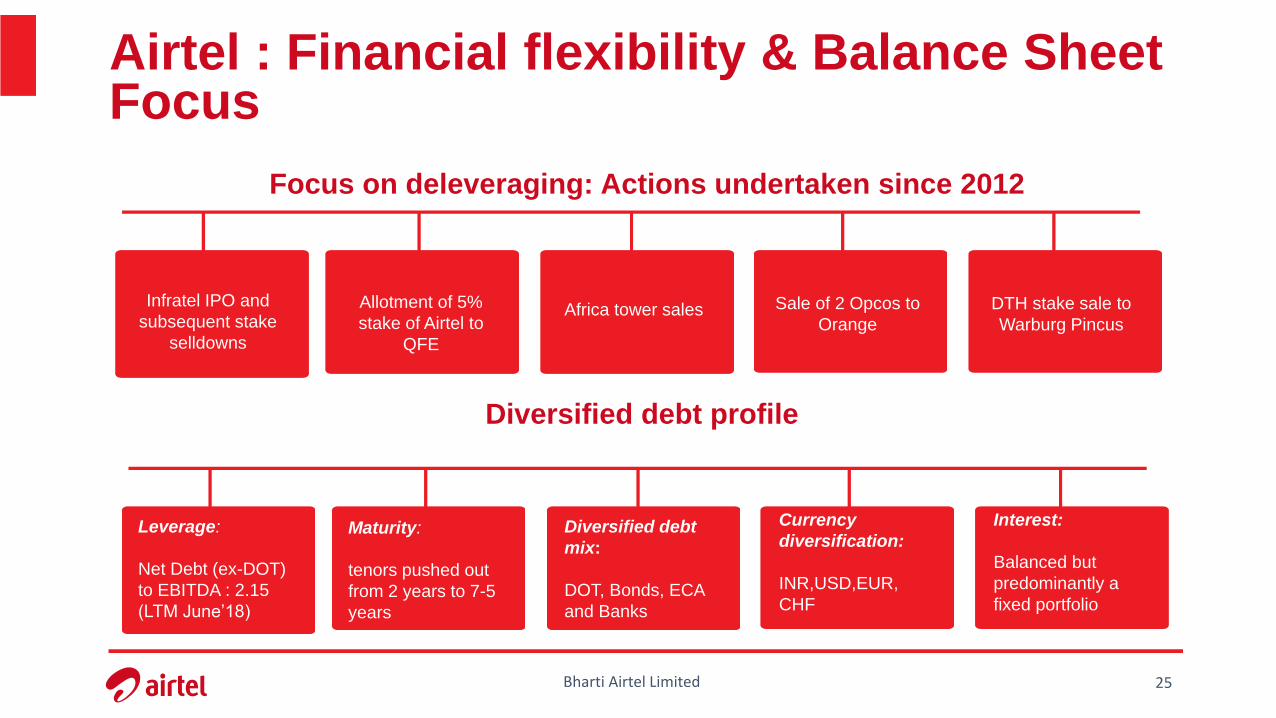
Airtel : Financial flexibility & Balance Sheet Focus
Focus on deleveraging: Actions undertaken since 2012
Leverage:
Net Debt (ex-DOT)
to EBITDA : 2.15
(LTM June’18)
Maturity:
tenors pushed out
from 2 years to 7-5
years
Diversified debt
mix:
DOT, Bonds, ECA
and Banks
Currency
diversification:
INR,USD,EUR,
CHF
Interest:
Balanced but
predominantly a
fixed portfolio
Diversified debt profile
Infratel IPO and
subsequent stake
selldowns
Allotment of 5%
stake of Airtel to
QFE
Africa tower sales Sale of 2 Opcos to
Orange
DTH stake sale to
Warburg Pincus

THANK YOU