Embed Size (px)
Citation preview
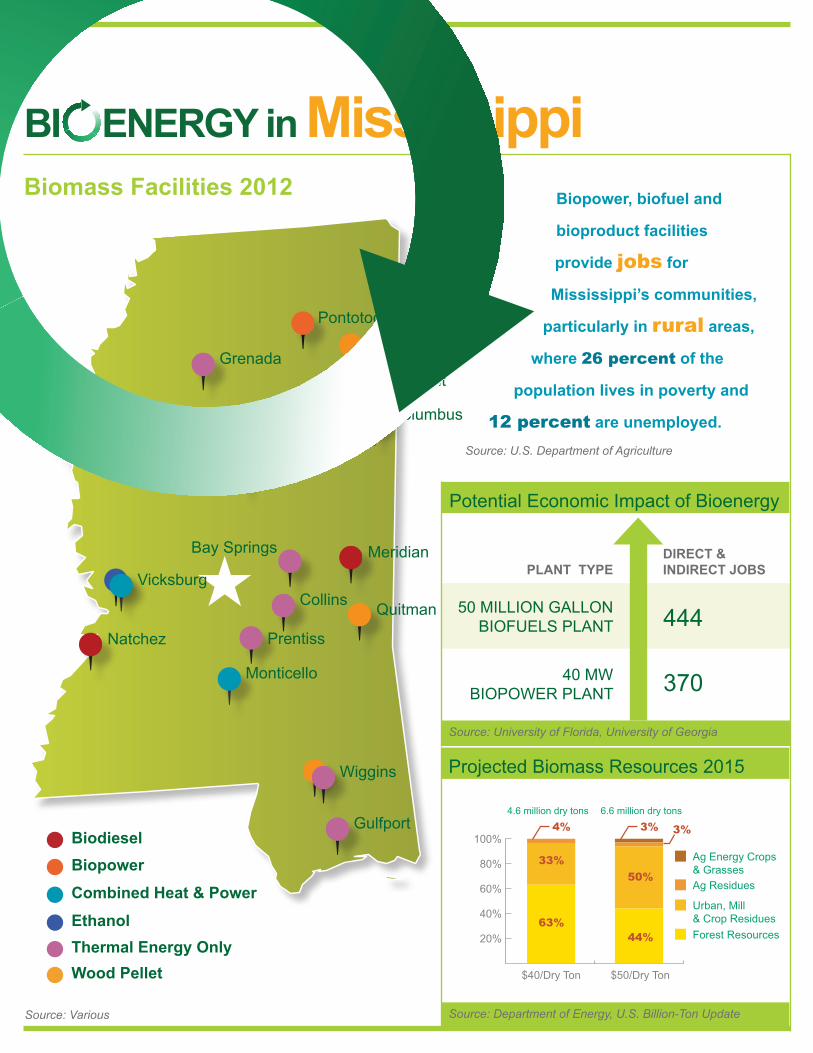
Biomass Facilities 2012
BI ENERGY in Mississippi
BiopowerBiodiesel
Combined Heat & Power
EthanolThermal Energy OnlyWood Pellet
Biopower, biofuel and
bioproduct facilities
provide jobs for
Mississippi’s communities,
particularly in rural areas,
where 26 percent of the
population lives in poverty and
12 percent are unemployed.
$50/Dry Ton
20%
40%
60%
80%
100%
33%
44%
50%
63%
Ag Energy Crops & GrassesAg Residues
Urban, Mill & Crop ResiduesForest Resources
$40/Dry Ton
4.6 million dry tons 6.6 million dry tons
3% 3%4%
Projected Biomass Resources 2015
Source: Department of Energy, U.S. Billion-Ton Update
DIRECT & INDIRECT JOBS
Potential Economic Impact of Bioenergy
40 MW BIOPOWER PLANT
PLANT TYPE
444
370
50 MILLION GALLONBIOFUELS PLANT
Source: University of Florida, University of Georgia
Source: Various
Source: U.S. Department of Agriculture
Natchez
Meridian
Greenville
West Point
Pontotoc
Columbus
Collins
Bay Springs
Gulfport
Wiggins
Kosciusko
GrenadaAmory
Quitman
Monticello
Prentiss
Vicksburg
Source: Energy Information Administration Source: U.S. Department of Agriculture
Source: Energy Information Administration, Lazard Levelized Cost Analysis
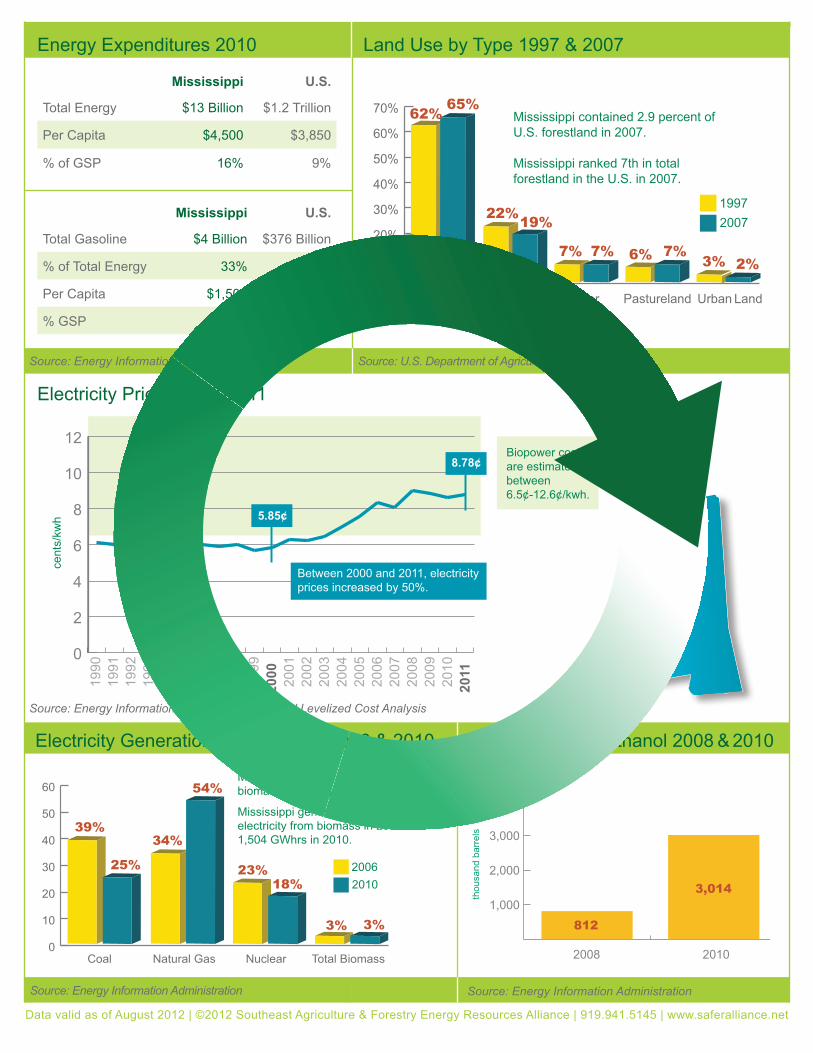
Energy Expenditures 2010
0
10
20
30
40
50
60
39%
25%
34%
54%
23%18%
3% 3%
Coal Natural Gas Nuclear Total Biomass
Mississippi ranked 17th in the U.S. for biomass electricity production in 2010.
Mississippi generated 1,541 GWhrs of electricity from biomass in 2006 and 1,504 GWhrs in 2010.
20062010
Source: Energy Information Administration
Electricity Generation by Fuel Type 2006 & 2010
Land Use by Type 1997 & 2007
Electricity Prices 1990-2011
0
2
4
6
8
10
12
1990
1991
1992
1993
1994
1996
1997
1998
1999
2001
2002
2003
2004
2006
2007
2008
2009
2011
1995
2000 2005
2010
Biopower costs are estimated between 6.5¢-12.6¢/kwh.
Between 2000 and 2011, electricity prices increased by 50%.
cent
s/kw
h 5.85¢
8.78¢
Source: Energy Information Administration
Consumption of Ethanol 2008 & 2010
2008 2010
1,000
2,000
3,000
4,000
812
3,014
thou
sand
bar
rels
Mississippi U.S.
Total Energy $13 Billion $1.2 Trillion
Per Capita $4,500 $3,850
% of GSP 16% 9%
Mississippi U.S.
Total Gasoline $4 Billion $376 Billion
% of Total Energy 33% 31%
Per Capita $1,500 $1,200
% GSP 5% 3%
Data valid as of August 2012 | ©2012 Southeast Agriculture & Forestry Energy Resources Alliance | 919.941.5145 | www.saferalliance.net
0%
10%
20%
30%
40%
50%
60%
70% 62% 65%
22%19%
7% 7% 6% 7%3% 2%
Forestland Cropland Other Pastureland Urban Land
1997
Mississippi contained 2.9 percent of U.S. forestland in 2007.
Mississippi ranked 7th in total forestland in the U.S. in 2007.
2007