Embed Size (px)
Citation preview
BI RationalizationBI RationalizationReduce Risk, Trim Costs and
Improve Your Decision-Making Ability
Presented By: Vincent Belanger Partner, BI & Data Mgmt. Rolta-TUSC 919-676-5312 [email protected]
Slide 2 / BI Rationalization
Presentation AgendaPresentation Agenda Current State of Business Intelligence
BI - A Business Imperative The Evolution. What Happened. Why Did It Happen?
Answering the Call BI Vendors Respond Why Isn’t Everyone “Rationalizing”?
The Methodology – BI Rationalization BI Rationalization Approach Overview Report Conversion Utility
BI Rationalization Cost Justification The Final Results
Case Studies
Slide 3 / BI Rationalization
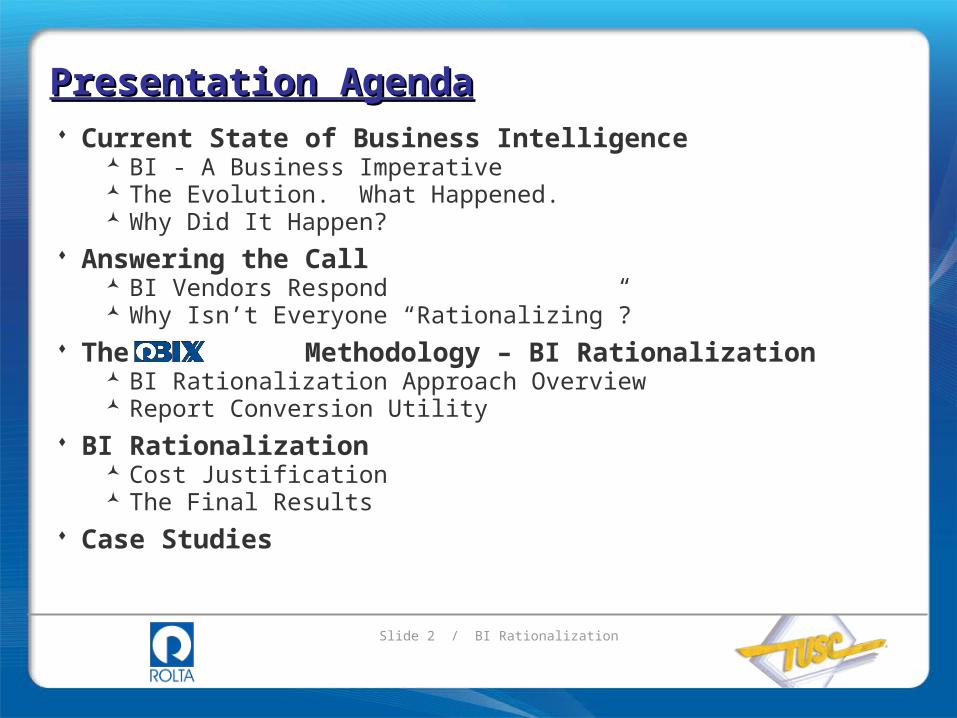
Current State of BI: Current State of BI: A Business ImperativeA Business Imperative
Base: 82 IT decision-makers(percentages do not total 100 because of rounding)
“How widespread is your organization’s adoption of BI, Data Warehousing, and Data Integration initiatives?”
Source: August 2008 Global BI And Data Management Online Survey
Slide 4 / BI Rationalization
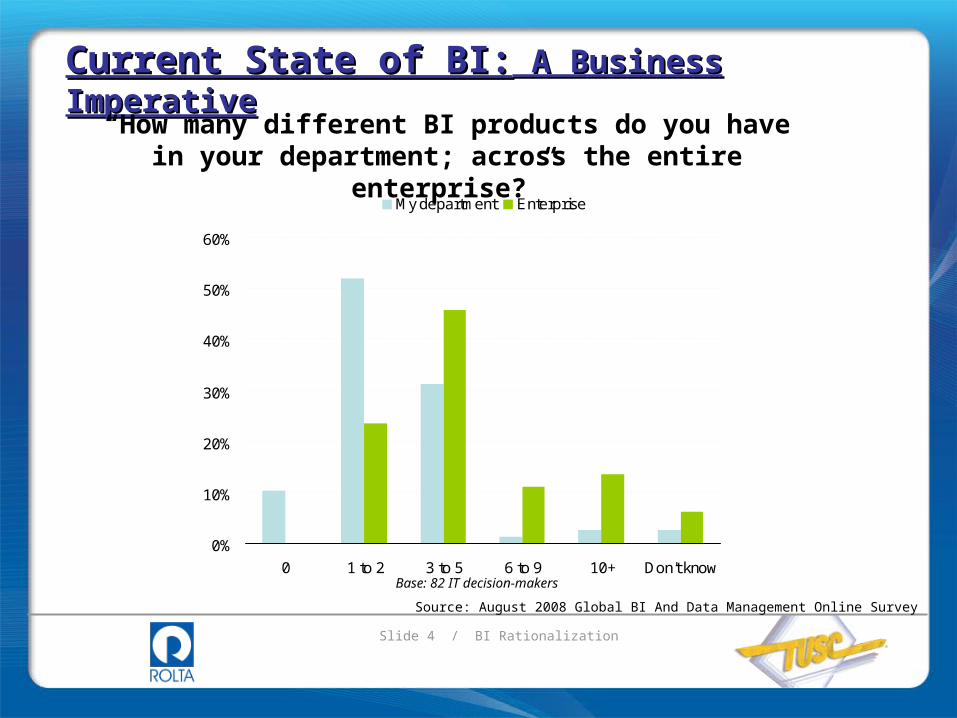
0%
10%
20%
30%
40%
50%
60%
0 1 to 2 3 to 5 6 to 9 10+ Don't know
My department Enterprise
Source: August 2008 Global BI And Data Management Online Survey
Base: 82 IT decision-makers
Current State of BI:Current State of BI: A Business Imperative A Business Imperative“How many different BI products do you have in your
department; across the entire enterprise?”
Slide 5 / BI Rationalization
Current State of BI:Current State of BI: A Business ImperativeA Business Imperative
From a Business Intelligence perspective, the primary focus for IT Directors and CIO’s is to reduce internal and overhead (I&O) cost through:
Unified BI solutions Collaboration between departments Reduction in BI shelf ware Leverage existing solutions Realize ROI; which was the original intent
- Gartner Group
Slide 6 / BI Rationalization
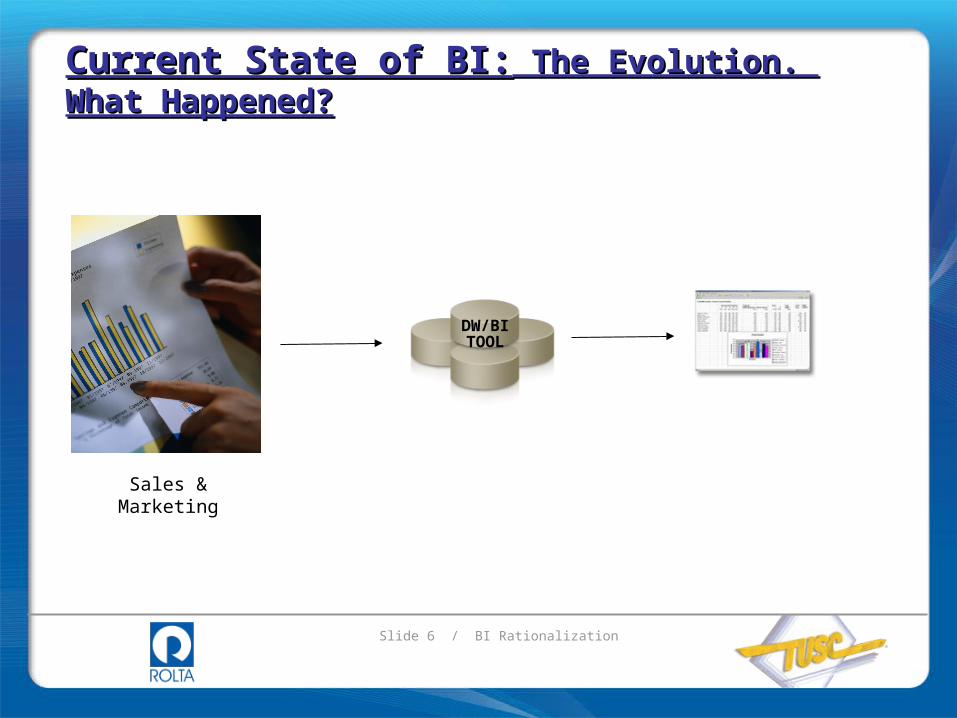
Current State of BI:Current State of BI: The Evolution. What The Evolution. What Happened?Happened?
Sales & Marketing
DW/BI TOOL
Slide 7 / BI Rationalization
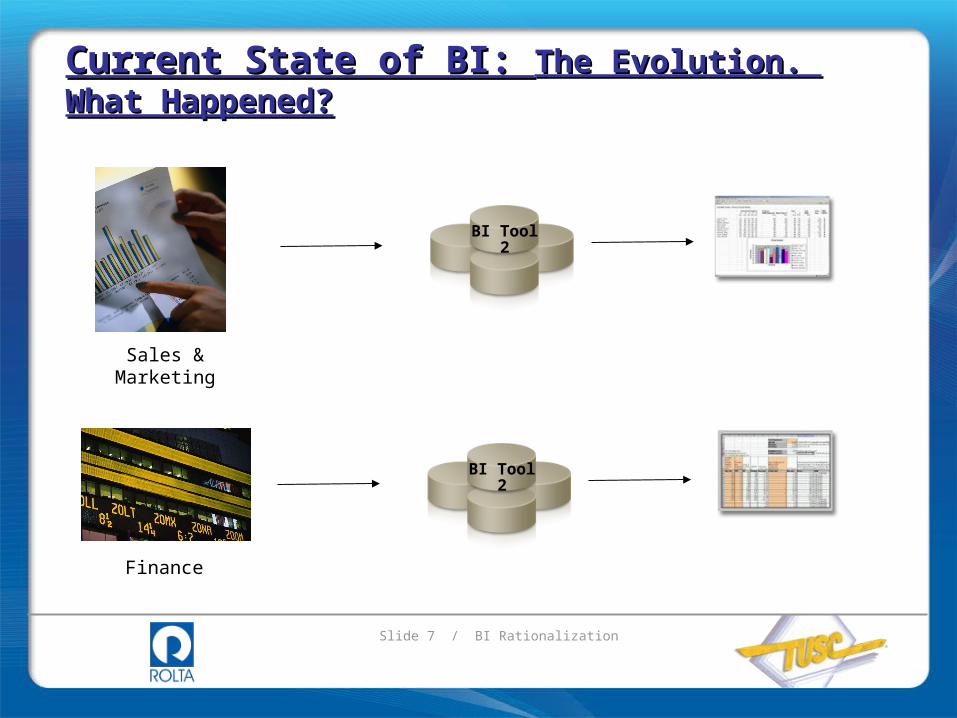
BI Tool 2
BI Tool 2
Sales & Marketing
Finance
Current State of BI: Current State of BI: The Evolution. What The Evolution. What Happened?Happened?
Slide 8 / BI Rationalization
Custom Built
Reporting Solution
BI Tool 2
Data Warehouse
BI Tool 1
BI Tool 3
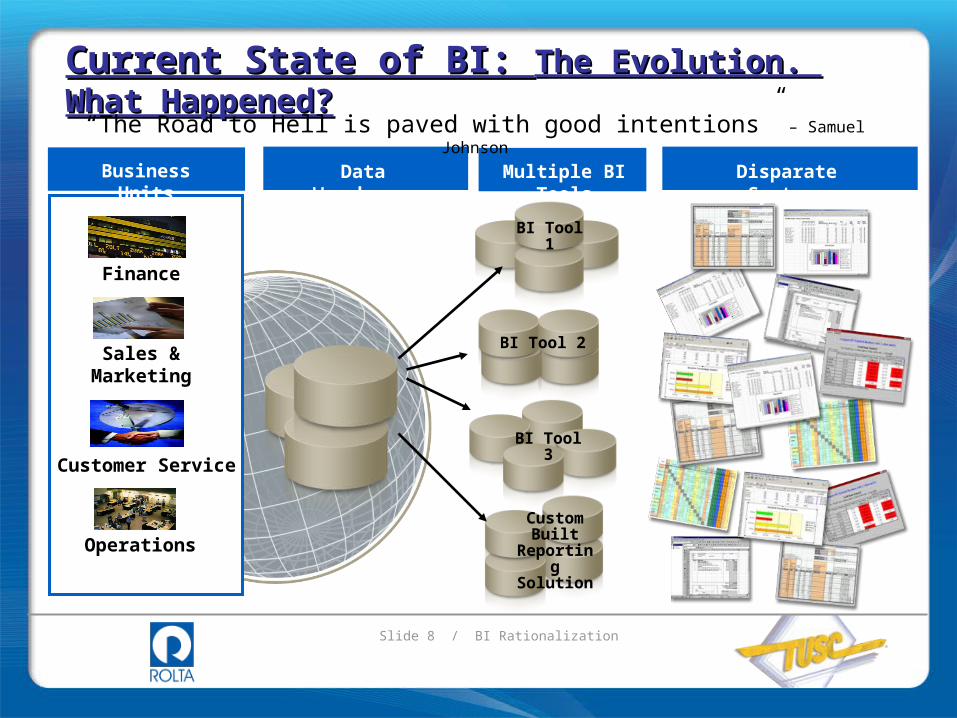
Multiple BI Tools Disparate SystemsData WarehouseBusiness Units
Finance
Sales & Marketing
Customer Service
Operations
Current State of BI: Current State of BI: The Evolution. What The Evolution. What Happened?Happened?
“The Road to Hell is paved with good intentions” – Samuel Johnson
Slide 9 / BI Rationalization
Custom Built
Reporting Solution
BI Tool 2
Data Warehouse
BI Tool 1
BI Tool 3
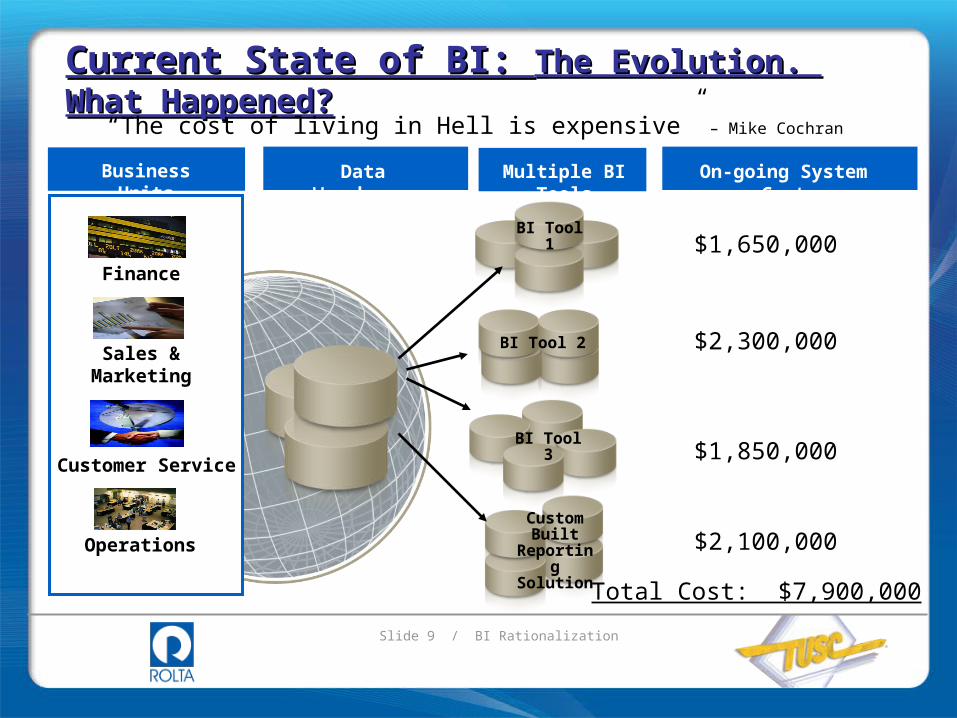
Multiple BI ToolsData WarehouseBusiness Units On-going System Cost
$1,650,000
$2,300,000
$1,850,000
$2,100,000
Total Cost: $7,900,000
Current State of BI: Current State of BI: The Evolution. What The Evolution. What Happened?Happened?
“The cost of living in Hell is expensive” – Mike Cochran
Finance
Sales & Marketing
Customer Service
Operations
Slide 10 / BI Rationalization
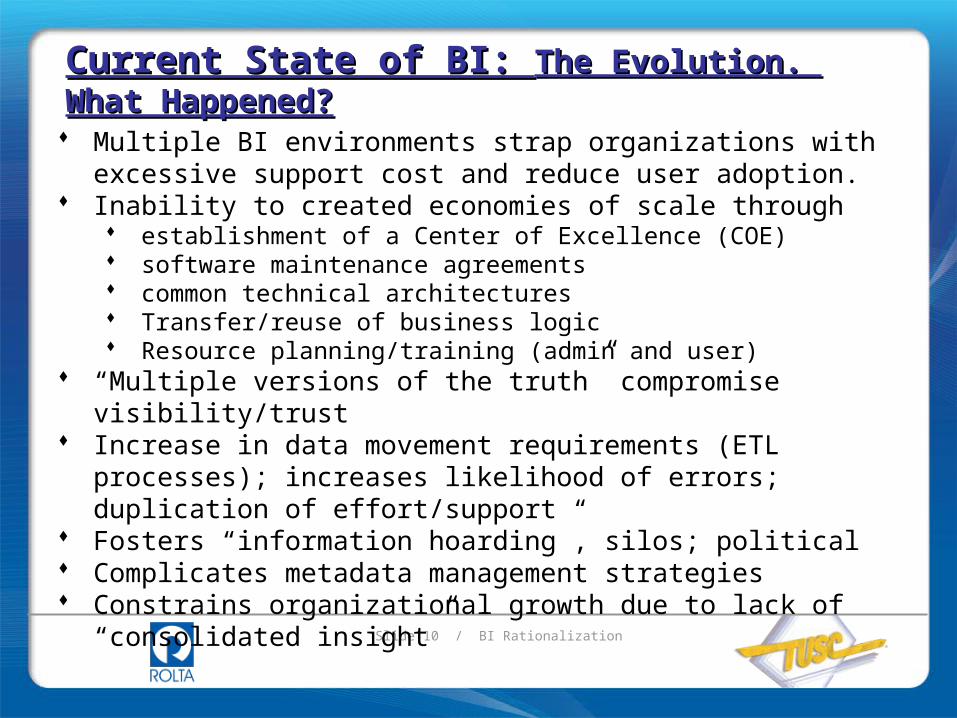
Multiple BI environments strap organizations with excessive support cost and reduce user adoption.
Inability to created economies of scale through establishment of a Center of Excellence (COE) software maintenance agreements common technical architectures Transfer/reuse of business logic Resource planning/training (admin and user)
“Multiple versions of the truth” compromise visibility/trust Increase in data movement requirements (ETL processes);
increases likelihood of errors; duplication of effort/support Fosters “information hoarding”, silos; political Complicates metadata management strategies Constrains organizational growth due to lack of “consolidated
insight”
Current State of BI: Current State of BI: The Evolution. What The Evolution. What Happened?Happened?
Slide 11 / BI Rationalization
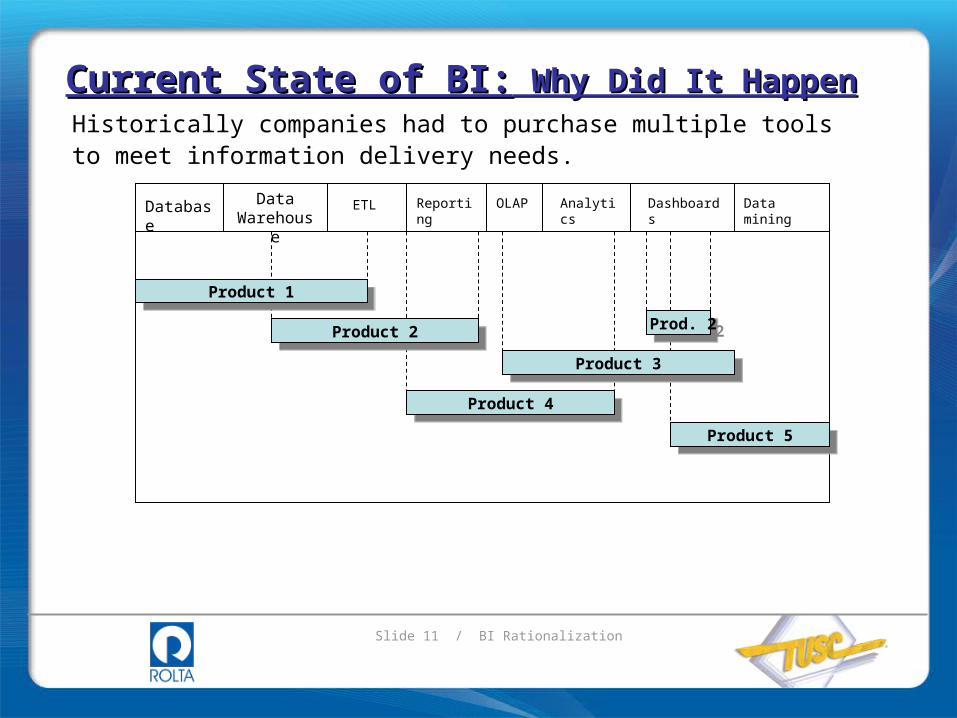
Historically companies had to purchase multiple tools to meet information delivery needs.
ETLData Warehouse
Database AnalyticsOLAPReporting Data miningDashboards
Product 1Product 1
Product 2Product 2
Product 4Product 4
Product 3Product 3
Prod. 2 Prod. 2
Product 5Product 5
Current State of BI:Current State of BI: Why Did It Happen Why Did It Happen
Slide 12 / BI Rationalization
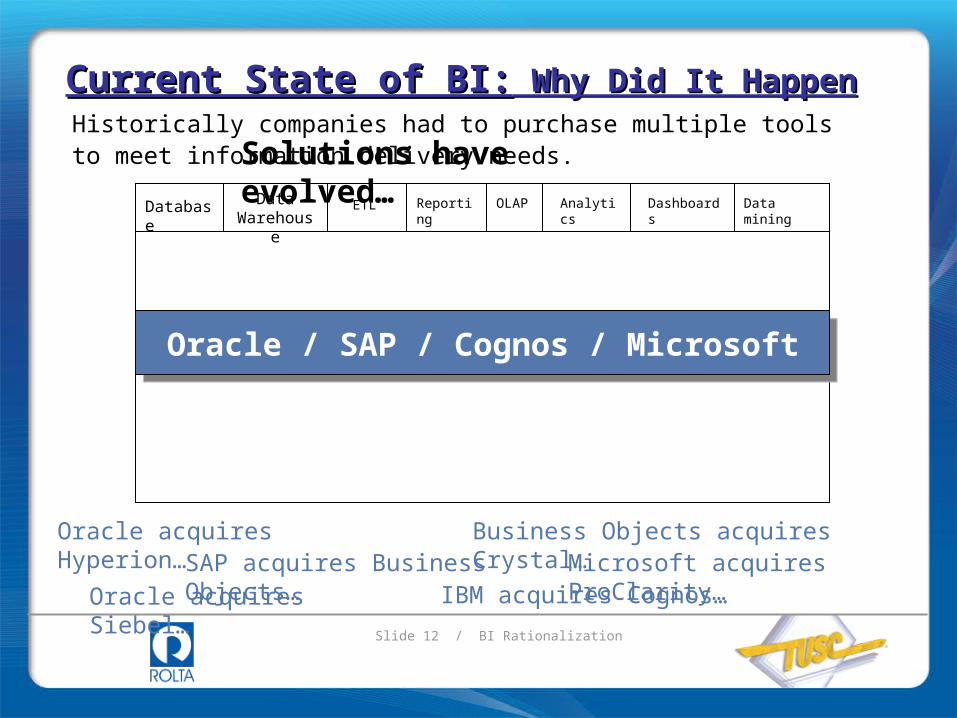
Historically companies had to purchase multiple tools to meet information delivery needs.
ETLData Warehouse
Database AnalyticsOLAPReporting Data miningDashboards
Current State of BI:Current State of BI: Why Did It Happen Why Did It Happen
Oracle / SAP / Cognos / MicrosoftOracle / SAP / Cognos / Microsoft
Solutions have evolved…
Oracle acquires Hyperion…SAP acquires Business Objects…
Business Objects acquires Crystal…
Oracle acquires Siebel…
Microsoft acquires ProClarity…IBM acquires Cognos…
Slide 13 / BI Rationalization
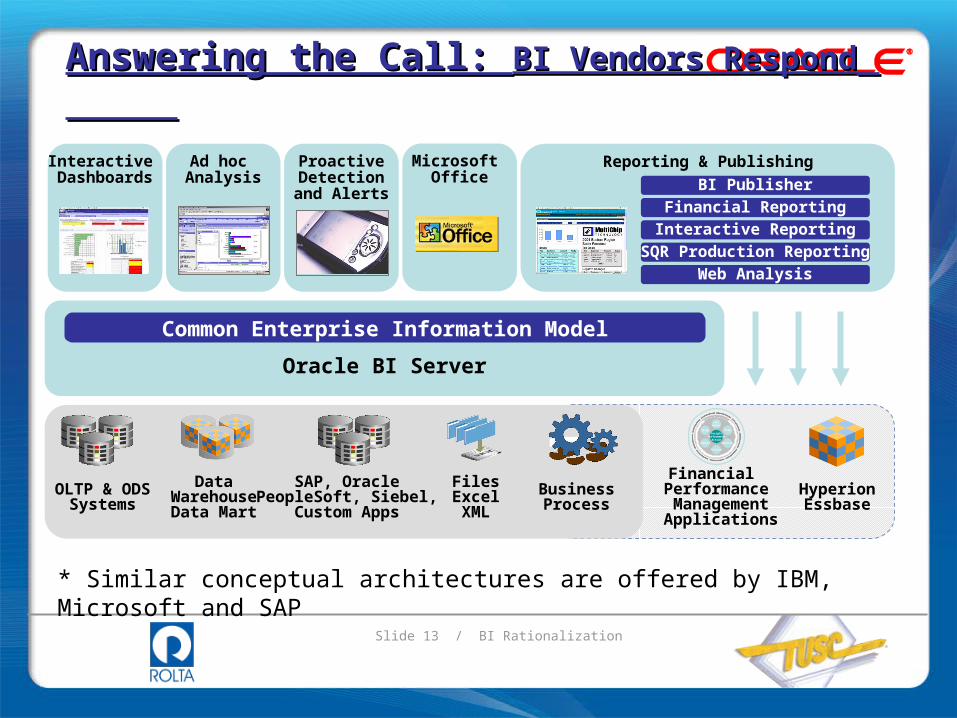
OLTP & ODSSystems
DataWarehouseData Mart
SAP, OraclePeopleSoft, Siebel,
Custom Apps
FilesExcelXML
BusinessProcess
Financial Performance Management Applications
InsightPerformance
Action
SetGoals
Plan
Monitor
Analyze
Report
Align
HyperionEssbase
Oracle BI Server
Common Enterprise Information Model
Reporting & Publishing
Financial ReportingBI Publisher
Interactive Reporting
SQR Production Reporting
Web Analysis
Ad hoc Analysis
ProactiveDetectionand Alerts
Microsoft Office
Interactive Dashboards
Answering the Call: Answering the Call: BI Vendors RespondBI Vendors Respond
* Similar conceptual architectures are offered by IBM, Microsoft and SAP
Slide 14 / BI Rationalization
Standardizing on a single Business Intelligence (BI) reporting and analysis solution is a good idea in theory . . . Companies can save money by standardizing but must plan for a long, slow migration that may not be practical.
- Forrester
Answering the Call: Answering the Call: Why Isn’t Everyone Why Isn’t Everyone “Rationalizing?“Rationalizing?
Slide 15 / BI Rationalization
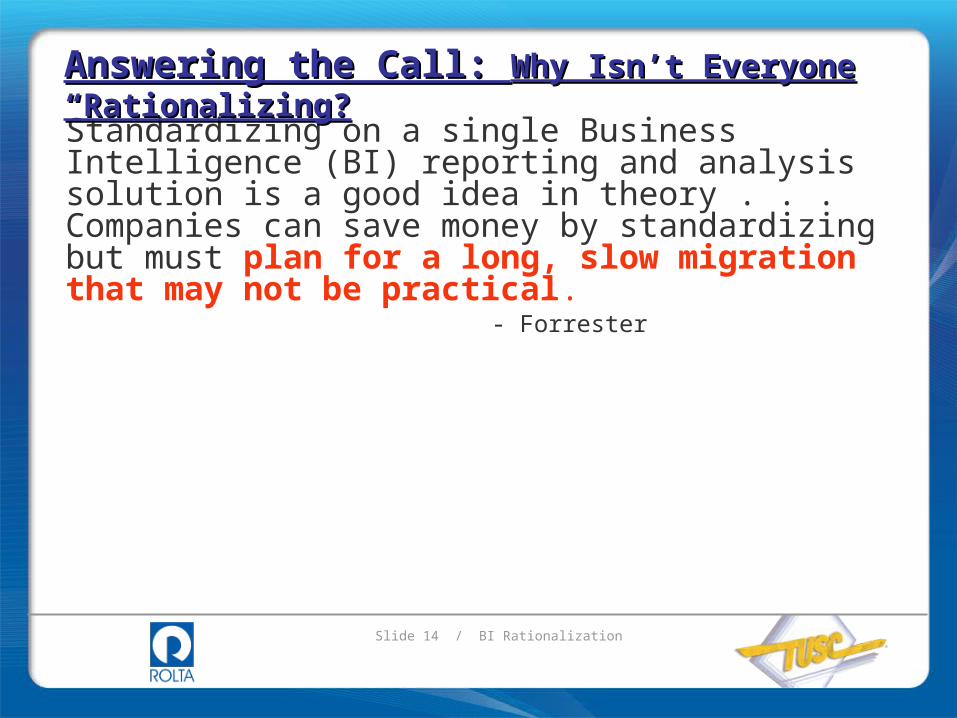
Standardizing on a single Business Intelligence (BI) reporting and analysis solution is a good idea in theory . . . Companies can save money by standardizing but must plan for a long, slow migration that may not be practical.
- Forrester
Answering the Call: Answering the Call: Why Isn’t Everyone Why Isn’t Everyone “Rationalizing?“Rationalizing?
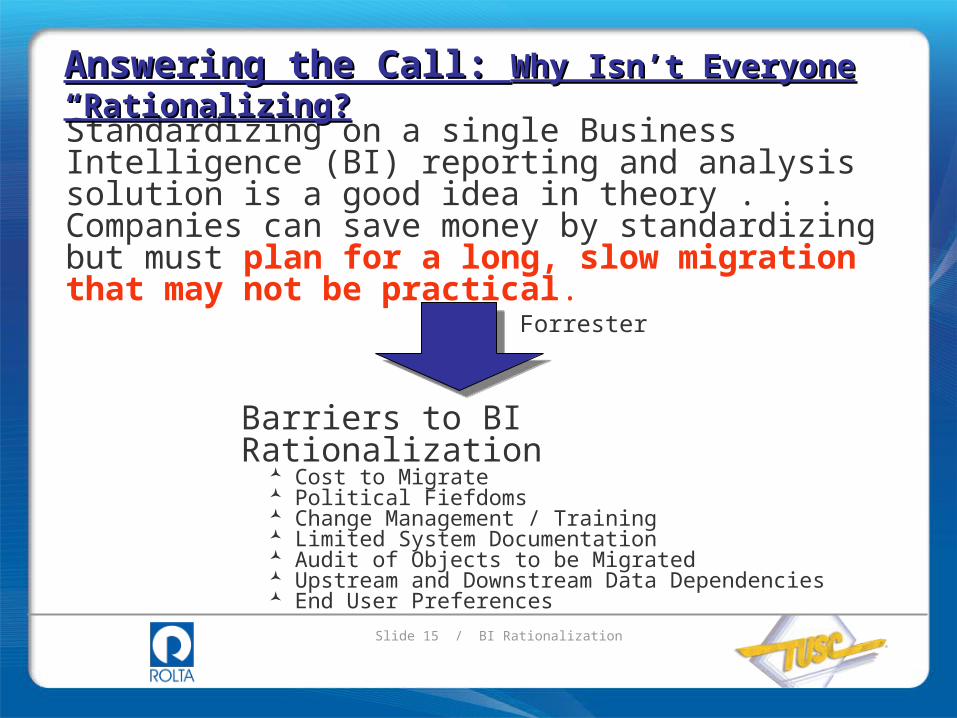
Barriers to BI Rationalization Cost to Migrate Political Fiefdoms Change Management / Training Limited System Documentation Audit of Objects to be Migrated Upstream and Downstream Data
Dependencies End User Preferences
Slide 16 / BI Rationalization
Standardizing on a single Business Intelligence (BI) reporting and analysis solution is a good idea in theory . . . Companies can save money by standardizing but must plan for a long, slow migration that may not be practical.
- Forrester
We Need A Plan
Answering the Call: Answering the Call: Why Isn’t Everyone Why Isn’t Everyone “Rationalizing?“Rationalizing?
Slide 17 / BI Rationalization
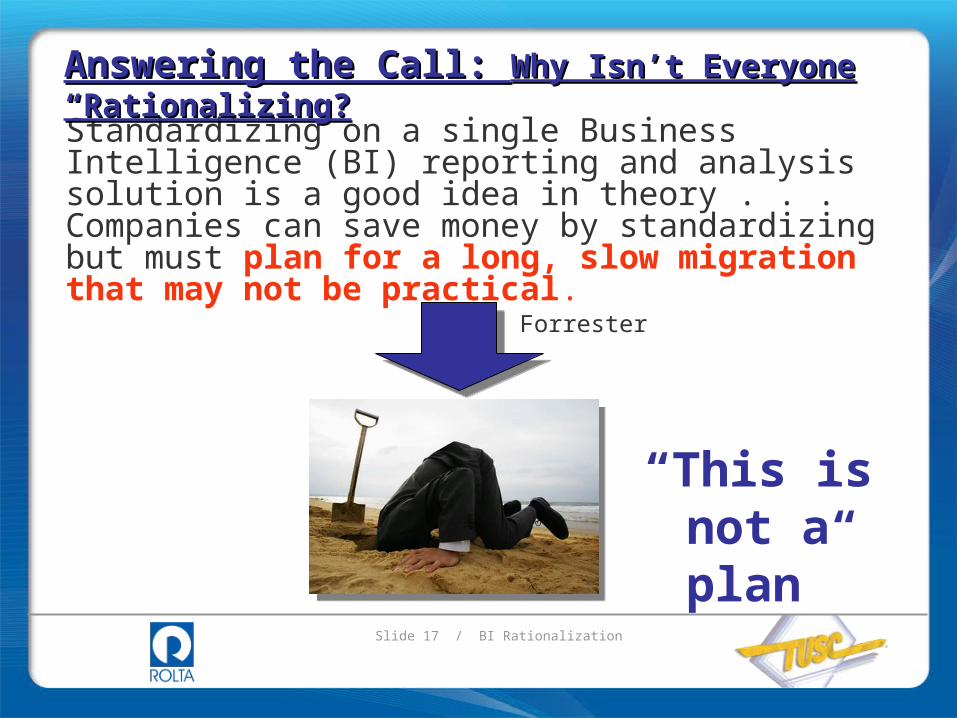
Standardizing on a single Business Intelligence (BI) reporting and analysis solution is a good idea in theory . . . Companies can save money by standardizing but must plan for a long, slow migration that may not be practical.
- Forrester
“This is not a plan”
Answering the Call: Answering the Call: Why Isn’t Everyone Why Isn’t Everyone “Rationalizing?“Rationalizing?
Slide 18 / BI Rationalization
Standardizing on a single Business Intelligence (BI) reporting and analysis solution is a good idea in theory . . . Companies can save money by standardizing but must plan for a long, slow migration that may not be practical.
- Forrester
Methodology, Migration Tools,
Report Conversion Utilities
Answering the Call: Answering the Call: Why Isn’t Everyone Why Isn’t Everyone “Rationalizing?“Rationalizing?
Slide 19 / BI Rationalization
Standardizing on a single Business Intelligence (BI) reporting and analysis solution is a good idea in theory . . . Companies can save money by standardizing but must plan for a long, slow migration that may not be practical.
- Forrester
Rolta Business Intelligence Exchange
A proven methodology w/ accelerators that saves 30% - 50% versus manual efforts.
TM
Answering the Call: Answering the Call: Why Isn’t Everyone Why Isn’t Everyone “Rationalizing?“Rationalizing?
Slide 20 / BI Rationalization
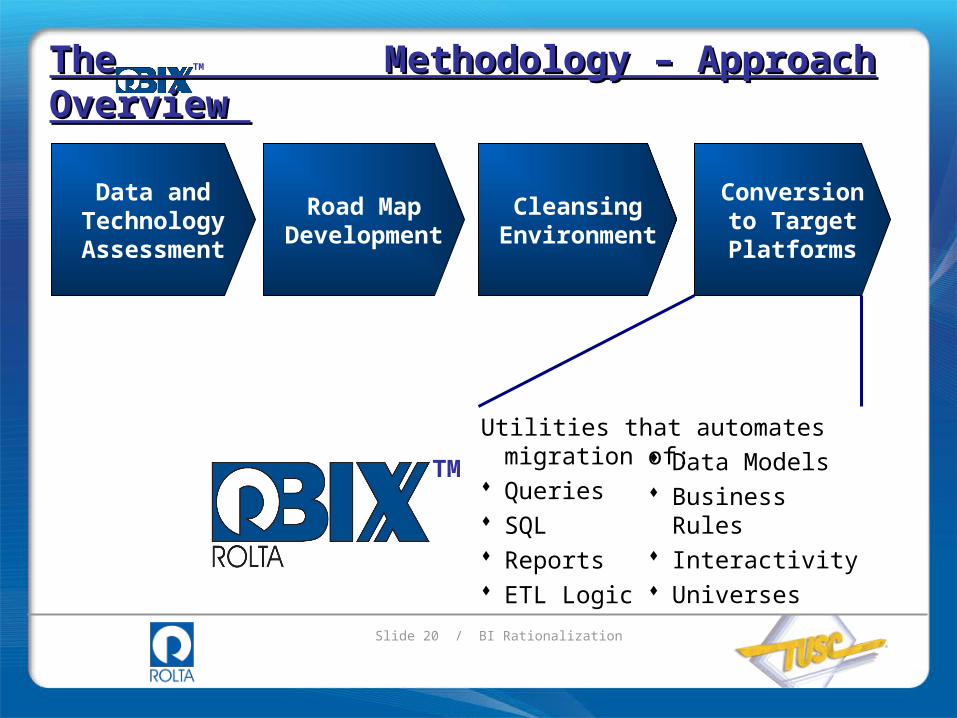
Data and Technology Assessment
Road Map Development
Cleansing Environment
Conversion to Target
Platforms
Utilities that automates migration of: Queries SQL Reports ETL Logic
Data Models Business Rules Interactivity Universes
TM
The Methodology – Approach The Methodology – Approach Overview Overview
TM
Slide 21 / BI Rationalization
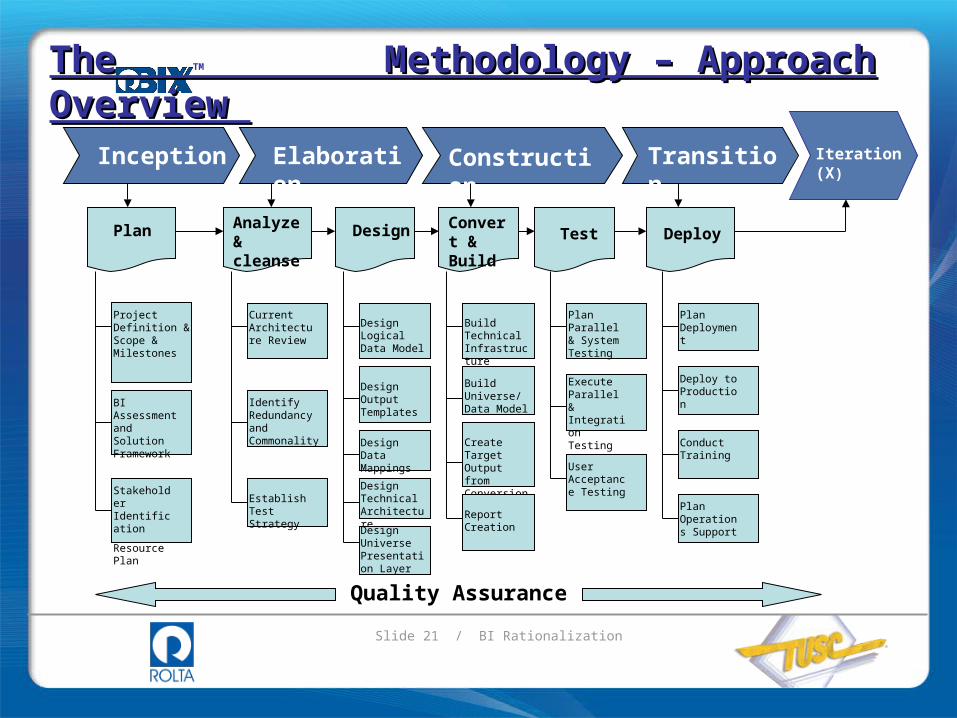
Transition
Inception Iteration (X) Elaboration Construction Transition
Plan Analyze & cleanse
Design
Convert & Build
Test Deploy
Project Definition & Scope & Milestones
BI Assessment and Solution Framework
Current Architecture Review
Identify Redundancy and Commonality
Design Logical Data Model
Design Output Templates
Design Data Mappings
Design Technical Architecture
Design Universe Presentation Layer
Build Technical Infrastructure
Create Target Output from Conversion
Report Creation
Plan Parallel & System Testing
Execute Parallel & Integration Testing
User Acceptance Testing
Plan Deployment
Deploy to Production
Conduct Training
Plan Operations Support
Build Universe/ Data Model
Establish Test Strategy
Stakeholder Identification
Resource Plan
Quality Assurance
The Methodology – Approach The Methodology – Approach Overview Overview
TM
Slide 22 / BI Rationalization
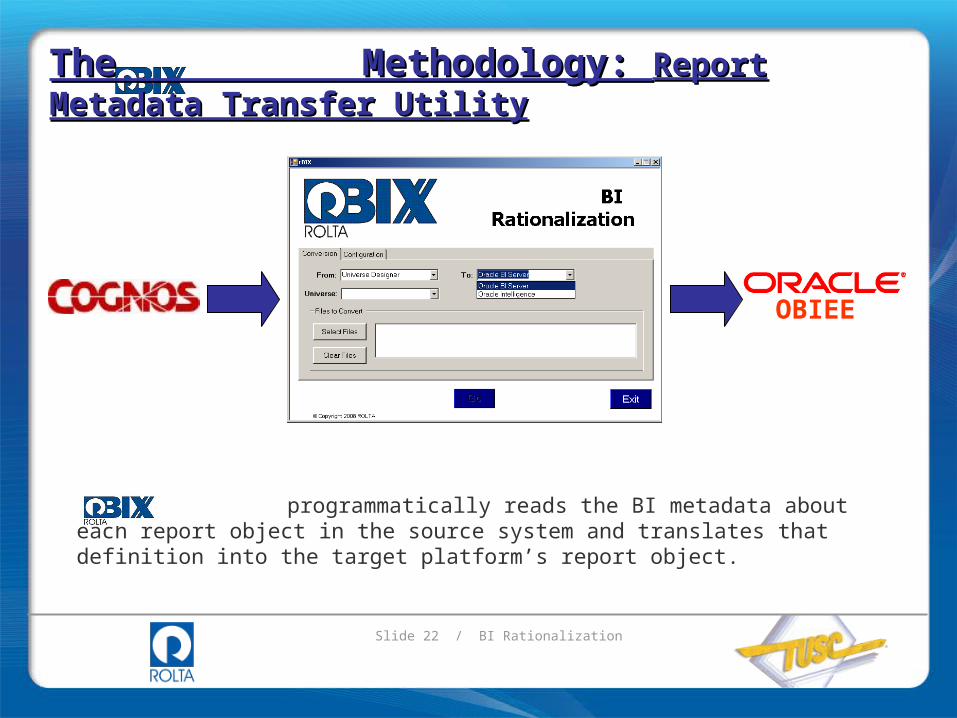
programmatically reads the BI metadata about each report object in the source system and translates that definition into the target platform’s report object.
The Methodology: The Methodology: Report Metadata Report Metadata Transfer UtilityTransfer Utility
OBIEE
Slide 23 / BI Rationalization
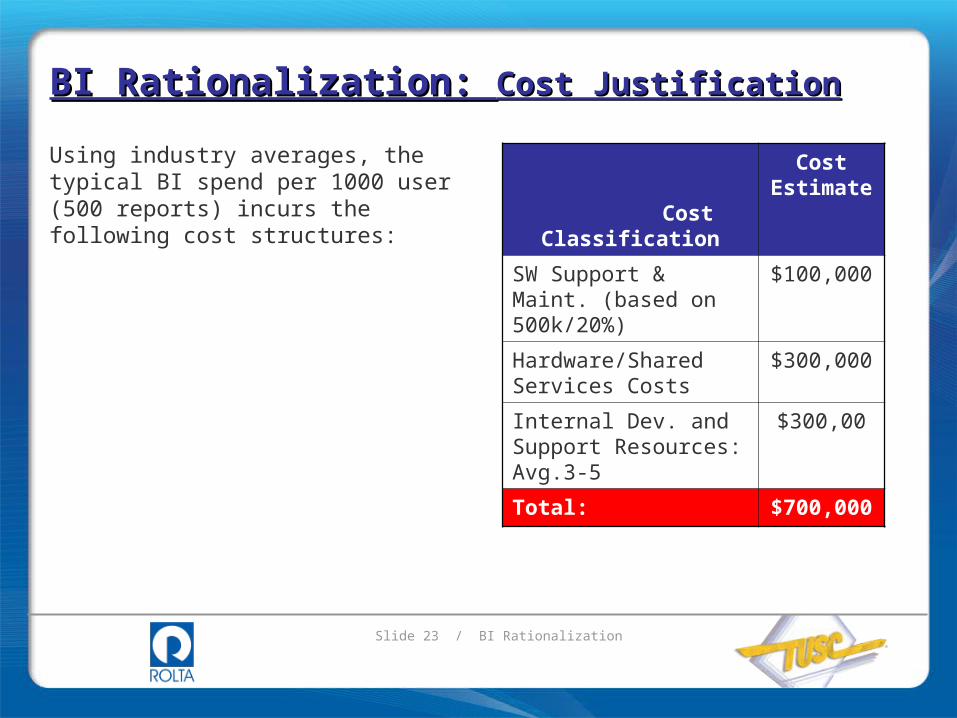
Using industry averages, the typical BI spend per 1000 user (500 reports) incurs the following cost structures:
Cost Classification
Cost Estimate
SW Support & Maint. (based on 500k/20%)
$100,000
Hardware/Shared Services Costs
$300,000
Internal Dev. and Support Resources: Avg.3-5
$300,00
Total: $700,000
BI Rationalization: BI Rationalization: Cost JustificationCost Justification

Slide 24 / BI Rationalization
Using industry averages, the typical BI spend per 1000 user (500 reports) incurs the following cost structures:
Cost Classification
Cost Estimate
SW Support & Maint. (based on 500k/20%)
$100,000
Hardware/Shared Services Costs
$300,000
Internal Dev. and Support Resources: Avg.3-5
$300,00
Total: $700,000
BI Rationalization: BI Rationalization: Cost JustificationCost Justification
Estimated effort w/o utilizing migration tools and metadata utilities: 5000 hours / $850,000.
…is an incremental spend of $150k ($850k-$700k). The BI Rationalization Project does not cost justify itself in the first year; but certainly would
over time
Slide 25 / BI Rationalization
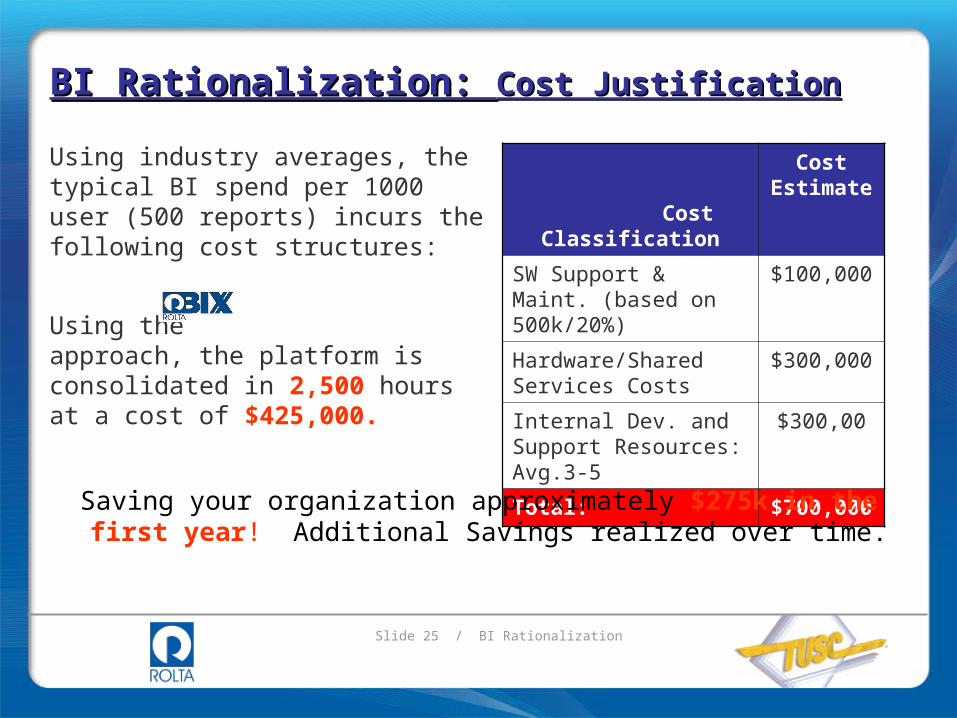
Using industry averages, the typical BI spend per 1000 user (500 reports) incurs the following cost structures:
Using the approach, the platform is consolidated in 2,500 hours at a cost of $425,000.
Cost Classification
Cost Estimate
SW Support & Maint. (based on 500k/20%)
$100,000
Hardware/Shared Services Costs
$300,000
Internal Dev. and Support Resources: Avg.3-5
$300,00
Total: $700,000
Saving your organization approximately $275k in the first year! Additional Savings realized over time.
BI Rationalization: BI Rationalization: Cost JustificationCost Justification
Slide 26 / BI Rationalization
BI Rationalization: BI Rationalization: Cost JustificationCost Justification
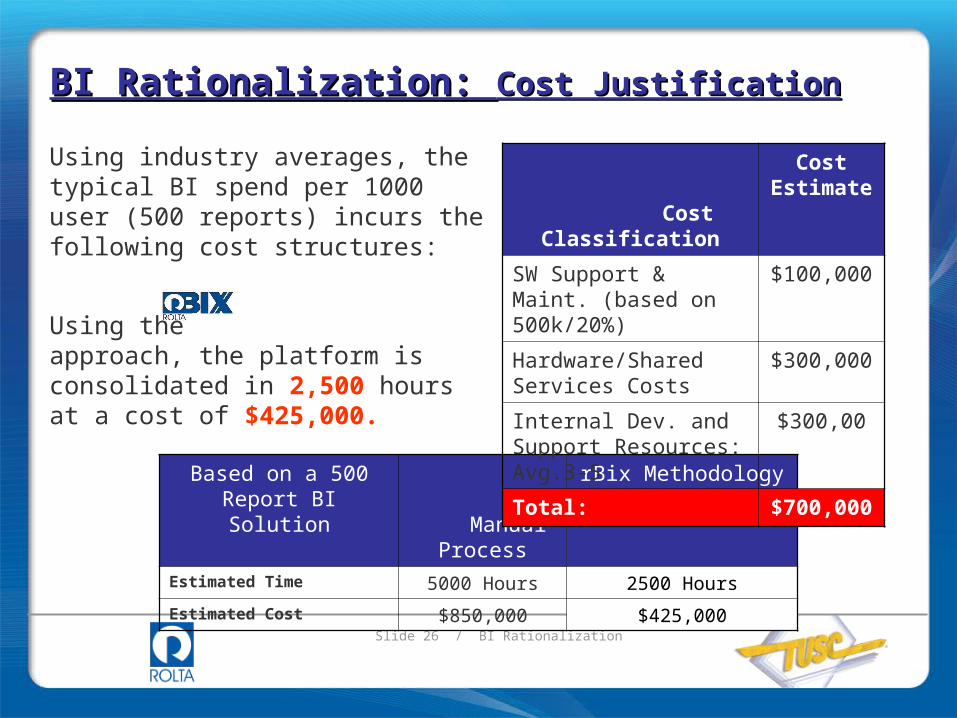
Based on a 500 Report BI Solution
Manual
Process
rBix Methodology w/ Accelerators
Estimated Time 5000 Hours 2500 Hours
Estimated Cost $850,000 $425,000
Cost Classification
Cost Estimate
SW Support & Maint. (based on 500k/20%)
$100,000
Hardware/Shared Services Costs
$300,000
Internal Dev. and Support Resources: Avg.3-5
$300,00
Total: $700,000
Using industry averages, the typical BI spend per 1000 user (500 reports) incurs the following cost structures:
Using the approach, the platform is consolidated in 2,500 hours at a cost of $425,000.
Slide 27 / BI Rationalization
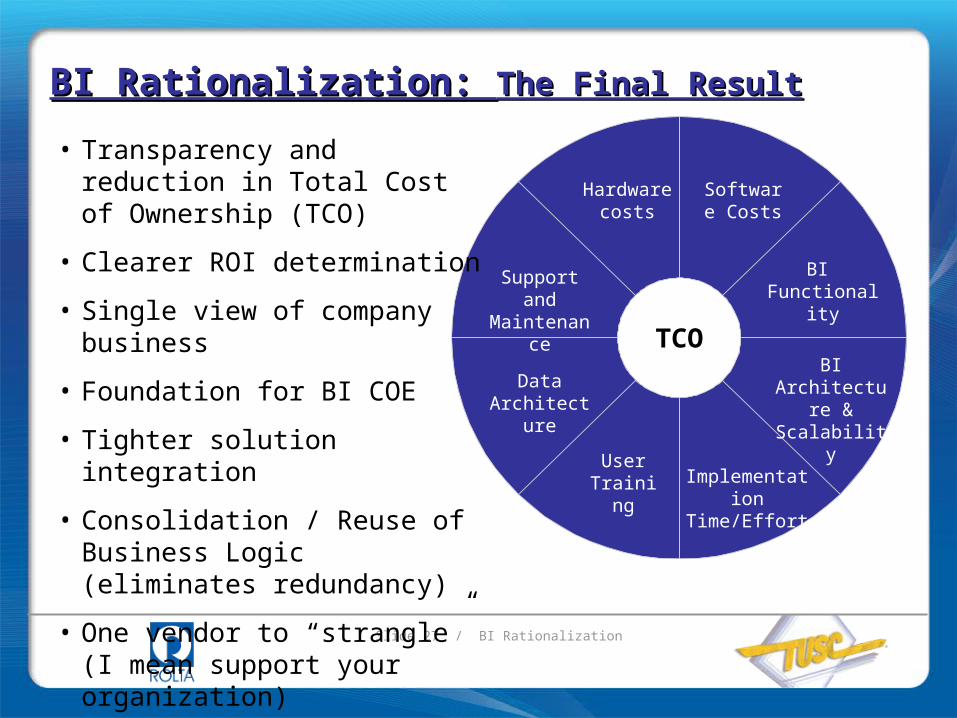
Hardware costs
BI Architecture & Scalability
BI Functionality
Software Costs
Implementation Time/Effort
Data Architecture
User Training
Support and Maintenance
TCO
• Transparency and reduction in Total Cost of Ownership (TCO)
• Clearer ROI determination
• Single view of company business
• Foundation for BI COE
• Tighter solution integration
• Consolidation / Reuse of Business Logic (eliminates redundancy)
• One vendor to “strangle” (I mean support your organization)
BI Rationalization: BI Rationalization: The Final ResultThe Final Result
Slide 28 / BI Rationalization
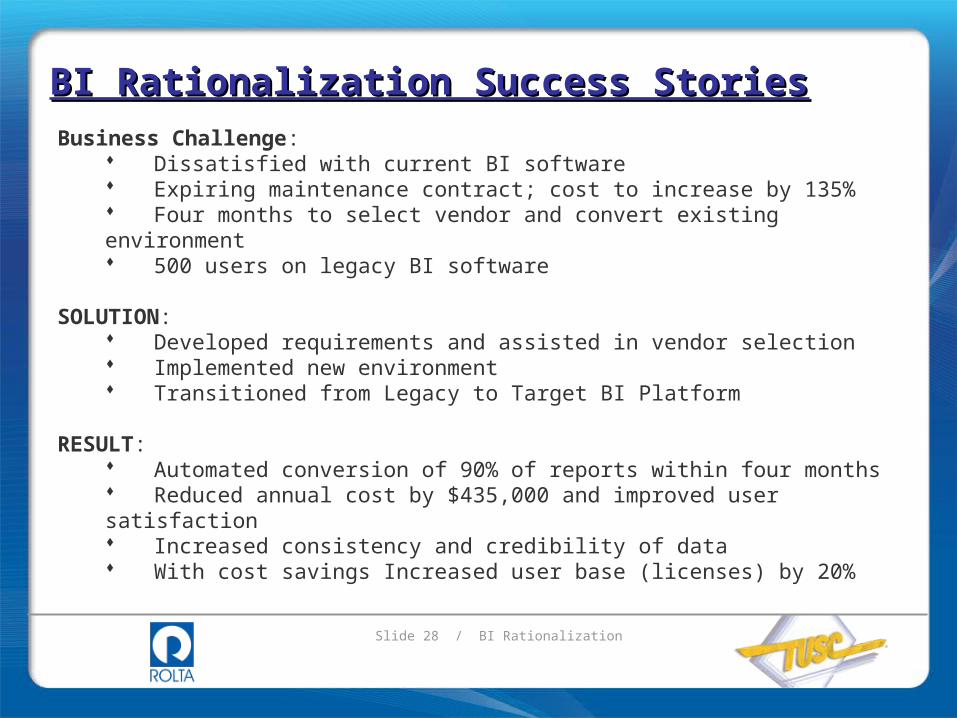
Business Challenge: Dissatisfied with current BI software Expiring maintenance contract; cost to increase by 135% Four months to select vendor and convert existing environment 500 users on legacy BI software
SOLUTION: Developed requirements and assisted in vendor selection Implemented new environment Transitioned from Legacy to Target BI Platform
RESULT: Automated conversion of 90% of reports within four months Reduced annual cost by $435,000 and improved user satisfaction Increased consistency and credibility of data With cost savings Increased user base (licenses) by 20%
BI Rationalization Success StoriesBI Rationalization Success Stories
Slide 29 / BI Rationalization
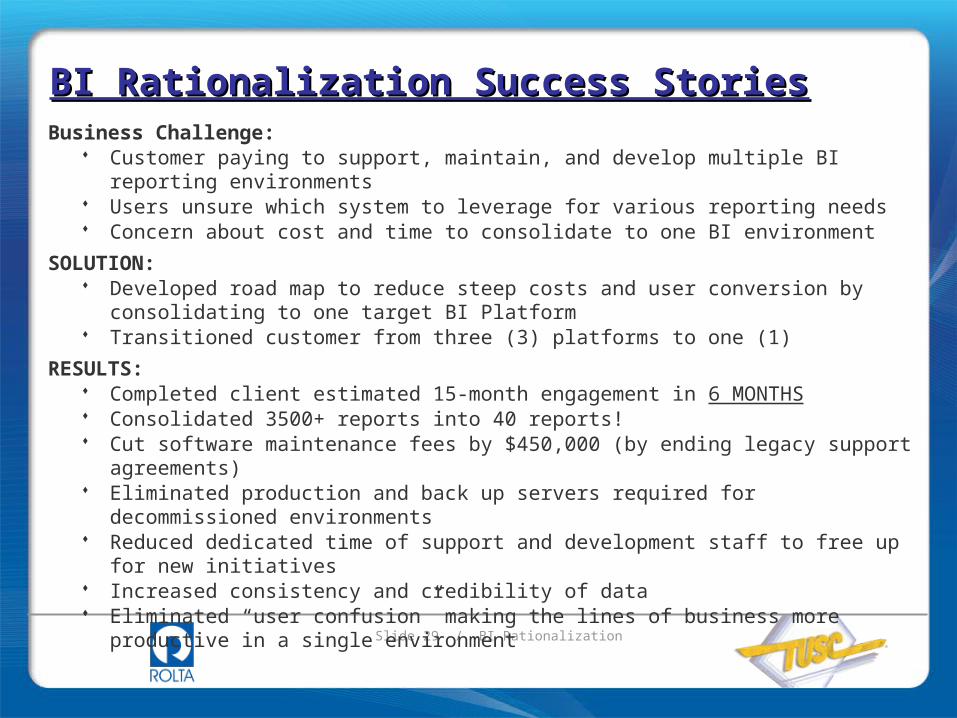
Business Challenge: Customer paying to support, maintain, and develop multiple BI reporting
environments Users unsure which system to leverage for various reporting needs Concern about cost and time to consolidate to one BI environment
SOLUTION: Developed road map to reduce steep costs and user conversion by
consolidating to one target BI Platform Transitioned customer from three (3) platforms to one (1)
RESULTS: Completed client estimated 15-month engagement in 6 MONTHS Consolidated 3500+ reports into 40 reports! Cut software maintenance fees by $450,000 (by ending legacy support
agreements) Eliminated production and back up servers required for decommissioned
environments Reduced dedicated time of support and development staff to free up for new
initiatives Increased consistency and credibility of data Eliminated “user confusion” making the lines of business more productive in
a single environment
BI Rationalization Success StoriesBI Rationalization Success Stories