Embed Size (px)
Citation preview

LJournal of Experimental Marine Biology and Ecology244 (2000) 161–180
www.elsevier.nl / locate / jembe
Bias associated with statolith-based methodologies for ageingsquid; a comparative study on illex illecebrosus
(Cephalopoda: Ommastrephidae)a b , b c*´A.F. Gonzalez , E.G. Dawe , P.C. Beck , J.A.A. Perez
aInstituto de Investigaciones Marinas (CSIC), Eduardo Cabello 6, 36208 Vigo, SpainbScience Branch, Department of Fisheries and Oceans, P.O. Box 5667, St. John’s, NF, Canada A1C 5X1
c ˆFACIMAR-Faculdade de Ciencias do Mar, UNIVALI-Universidade do Vale do Itajai, Rua Uruguai,458-Cx. Postal 360, CEP 88.302-202, Itajai-Santa Catarina, Brazil
Received 13 November 1997; received in revised form 2 September 1999; accepted 2 September 1999
Abstract
Estimates of ages for short-finned squid (Illex illecebrosus LeSueur) were derived from twodifferent methods for preparing statoliths and enumerating daily increments. Each pair of statolithswas divided between two experienced agers. One (Ager B) ground the statoliths on one side in thefrontal plane for examination by light microscopy with camera lucida. The other (Ager G) groundstatoliths on two sides in the sagittal plane for examination by light microscopy with an imageanalysis system. Mean counts of increments did not differ between the two agers reflecting similarpeak hatching periods and patterns of migration. Systematic differences were, however, evident inthat counts by Ager G were larger in young squid and smaller in old squid than those by Ager B.Crossing of methods suggested that estimated age was affected by the method of preparation ofstatoliths, but bias between agers was primarily due to differences in methods of interpreting andenumerating increments. This bias greatly affected estimates of growth rates. Rates of growth ofgroups obtained by the two agers based on the estimated month of hatching were compared withthose of individual gladii. Such comparisons failed to identify which method was the more reliablebecause of small sample sizes and poor fit of the growth model, as well as uncertainty regardingthe effects of time of hatching on growth rate. This uncertainty was related to unknown error inthe estimation, from statoliths, of age and time of hatching. Broad-scale collaborative studies arerecommended, involving exchange of unprocessed and processed statoliths among agers, toevaluate precision and maximize consistency among investigators. 2000 Elsevier Science B.V.All rights reserved.
Keywords: Squid; Statolith; Ageing methodology; Gladius; Bias
*Corresponding author. Tel.: 11-709-772-2076; fax: 11-709-772-4105.E-mail address: [email protected] (E.G. Dawe)
0022-0981/00/$ – see front matter 2000 Elsevier Science B.V. All rights reserved.PI I : S0022-0981( 99 )00136-7

´162 A.F. Gonzalez et al. / J. Exp. Mar. Biol. Ecol. 244 (2000) 161 –180
1. Introduction
The study of direct ageing methodology using increment-bearing hard structures is anew field in cephalopods (Jackson, 1994) relative to in fishes (Summerfelt and Hall,1987; Stevenson and Campana, 1992). Daily increment formation in cephalopodstatoliths has been validated for few species and it is of some concern that such studieshave been extended to many species, without accompanying validation studies (Jackson,1994). Even for those species for which daily statolith increment formation has beenvalidated, nothing is known of the error associated with detecting and enumerating dailyincrements.
It is appropriate to select Illex illecebrosus as the study species for an investigation oferror in age determination in cephalopods. This species was the subject of some of theearliest statolith-based ageing experiments (Lipinski, 1978; Hurley and Beck, 1979;Radtke, 1983; Morris and Aldrich, 1985). It is one of the few for which daily incrementformation in statoliths has been validated (Jackson, 1994), for hatchlings (Balch et al.,1988) as well as for maturing squid (Dawe et al., 1985; Hurley et al., 1985). Thisspecies is also one of the few for which a gladius-based method of estimating growthrate has been applied (Perez, 1994; Perez et al. 1996). Statolith-based ageing methodshave also been applied to other short-finned squid of the genus Illex (Rodhouse andHatfield, 1990; Arkhipkin, 1993; Uozumi and Shiba, 1993; Arkhipkin and Laptikhovsky,
´1994; Sanchez, 1995; Gonzalez et al. 1996).Dawe and Beck (1997) noted that although general demographic features such as age
structure and seasonal trends in growth were similar among Illex species, the accuracy ofestimated absolute ages and growth rates within any study remain unknown. Theystressed that differences in such population parameters among independent studies couldbe largely due to bias associated with differences in methods used for both preparingstatoliths and enumerating increments. They recommended that ‘The possible effects ofdifferences among methodologies should be investigated through comparative studies’.Independent studies on several other squid species (reviewed by Jackson, 1994) suggestthat such methodological effects may be great. Only one limited study to date hasdirectly compared two different methodologies by using matched statolith pairs(Lipinski and Durholtz, 1994). That study showed that there were great differencesbetween a method based on light microscopy and one based on scanning electron
´microscopy. Gonzalez et al. (1998) applied two relatively similar light microscopymethods involving image analysis to a common set of Illex coindetii statoliths. Theyfound considerable differences in estimated age between a manual method, whereby theinvestigator identified increments on the monitor, and a semi-automatic method, whichutilized image enhancement and editing of software-identified increments.
Investigating the accuracy of ageing methods would require availability of known-agespecimens. However, known-age specimens of pelagic squids are rarely obtainable, evenfrom culture, and statolith microstructure from the few successfully cultured has differedfrom that of wild specimens (Jackson et al., 1993), so interpretation of increments maynot be directly comparable. Campana et al. (1995) noted that in such circumstancesageing consistency may be the best that can be achieved. They advised that bias orsystematic differences such as may exist among agers should be addressed beforeprecision.

´A.F. Gonzalez et al. / J. Exp. Mar. Biol. Ecol. 244 (2000) 161 –180 163
The purpose of this study is to investigate the possible existence of bias associatedwith two very different methods used for both preparing statoliths and enumeratingincrements. The approach taken is to divide each statolith pair between two independentagers, each experienced in his own unique method. We also investigate sources of biasbetween ager-specific methodologies, based on one ager’s analysis of the other ager’sstatolith preparations. Effects of the different methods on estimated age, hatching timeand growth-rate are examined. Growth rates from both statolith-based ageing methodsare compared with those obtained independently from gladius analysis, toward inferringwhich ageing method is the more reliable.
2. Materials and methods
2.1. Sampling
Samples of whole squid were obtained from the Newfoundland inshore jig fishery atNew Bonaventure on August 31 and at LaScie on September 21 and 23, 1994.Specimens were immediately frozen and subsequently thawed for examination. Sex wasdetermined for each specimen and dorsal mantle length was measured to the nearest mm.Representative specimens of each sex were sub-sampled for age determination fromeach 5 mm mantle length group. The gladius was extracted from representativespecimens.
2.2. Statolith methodology
Statoliths of each pair were divided between independent agers. In instances whereone statolith of a pair was lost or destroyed in preparation, both statoliths were rejected.This resulted in a total of 128 statolith pairs available for this comparative study. One setof statoliths was analyzed by Ager B (PCB), according to methodology described byDawe and Beck (1997), whereas the other set was analyzed by Ager G (AFG),according to methodology described in Macy (1995). A brief review of these differentmethodologies follows.
Ager B. This method involves initially mounting the statolith on a microscope slide,using Protexx, with the rostrum removed and the dorsal dome uppermost. Grinding thestatolith then was on only one side, in the frontal plane. Ground surfaces prepared usingthis method were small in area, but problems of occulting crystals and numerous focalplanes were reduced in comparison with grinding one side in the sagittal plane (Lipinskiand Durholtz, 1994; Dawe and Beck, 1997).
Increments were enumerated using an optical microscope (200 3 magnification), withthe aid of a camera lucida. The drawing arm was used to produce a permanent record ofincrements from the focus to the lateral dome. It facilitates counting incrementswherever on the ground surface they were most clearly visible. It was frequentlynecessary to estimate number of unclear increments at the outer edge of the groundsurface based on the number of increments in an adjacent inner section of comparablewidth.
Ager G. This method involves mounting the statolith on a microscope slide, using

´164 A.F. Gonzalez et al. / J. Exp. Mar. Biol. Ecol. 244 (2000) 161 –180
Crystalbond, with the anterior concave side uppermost. The statolith is ground first onthe anterior surface, and then it is turned over and ground on the posterior surface. Thenthe statolith is again turned over so that the anterior surface is uppermost. This grindingof both surfaces in the sagittal plane results in the production of a relatively thin statolithsection.
Increments were enumerated along the axis of maximum statolith growth using anoptical microscope (400 3 magnification) with an image analysis system (Macy, 1995).Counts were obtained semi-automatically in that increments detected automatically bycomputer software from an enhanced image were subjectively modified, by addition ordeletion, by the ager. Increment counts in unclear regions near the outer margin of theground surface were estimated by extrapolation from the adjacent area.
2.3. Gladius methodology
Gladii were extracted and preserved in 15% formalin. For comparison of individualgladius growth rates with statolith-derived group growth rates 19 gladii were sub-sequently selected from the three peak hatching months, as estimated by both agers.They were subsequently prepared and analyzed according to Bizikov (1991). Eachgladius was measured for total length (GL) and marked at 10 mm intervals from theposterior (fins) to the anterior (head) end. The dorsal surface of the ostracum was thenexamined under a dissecting microscope at 20 to 30 3 magnification using a combina-tion of incident and transmitted light. Growth increments of the ostracum were countedin each 10 mm gladius length interval from the anterior toward the posterior end untilincrements were no longer visible (Perez et al., 1996). The mean spacing betweengrowth increments (mean growth increment in mm) was calculated by dividing 10 mmby the number of growth increments counted in each gladius length interval.
2.4. Treatment of data
Age difference and age bias plots were generated to illustrate the possible existence ofsystematic age differences between the two agers. Campana et al. (1995) recommendedusing only age bias plots, with confidence intervals to describe bias. However, weincluded age difference plots (Campana et al., 1995) rather than confidence intervals toreflect variability because of the great range of estimated ages and few observations atmany putative ages in our study.
To investigate the relative effects of method of preparation versus method ofinterpreting and enumerating increments, statoliths prepared by Ager G (for imageanalysis) were also examined by Ager B using his camera lucida method. The resultantincrement counts are designated as those of Ager B(G). Ager B(G) increment countswere compared with those Ager G (from the same set of prepared statoliths) using agedifference and age bias plots, as described above for Ager B versus Ager Gcomparisons.
Simple linear regression was used to model the relationship between increment count(estimated age) and dorsal mantle length for each ager. For that purpose, it wasappropriate to consider mantle length as the independent variable and increment count to

´A.F. Gonzalez et al. / J. Exp. Mar. Biol. Ecol. 244 (2000) 161 –180 165
be the dependent variable because mantle length is the more accurately measured andthe true age is unknown (Lipinski and Durholtz, 1994). The data for increment countregressed on mantle length were then examined using a general linear model describedas follows:
Y 5 m 1 a 1 b 1 (ab ) 1 b(Z ) 1 eijk i j ij ijK ijk
where Y is the response variable (i.e. age), Z is the continuous covariate (i.e. mantleijk ijk
length), a and b are discrete or class variables (i.e. ager and sex respectively), andi j
(ab ) is an optional interaction term.ij
This analysis was conducted using the general linear models (GLM) procedure ofSAS (SAS Institute Inc., North Carolina). The analysis initially tests for the mostappropriate model, i.e. common slope (b) or multiple slope (ab or b ). It thenij i
progressively eliminates non-significant (P.0.05) terms from the model until a finalmodel which includes only significant main effects and interactions is accepted.
These same increment count and mantle length data were also viewed by regressingmantle length on number of increments, by ager and sex. As noted above, number ofincrements is not an appropriate independent variable but it is of interest to view therelationships in this conventional form, without statistical comparison, because theregression slopes serve as a basis for comparing estimated growth rates, not onlybetween the statolith-based methodologies used in this study but with other publishedestimates derived from this approach. This also facilitates comparison with independentgladius-based individual growth rates. The data were also further partitioned amongestimated months of hatching and modelled separately for each of the three mostcommon hatching months for comparative purposes.
3. Results and discussion
3.1. Comparison of independent age estimates
The nature of the difference between agers is shown by age difference and age biasplots (Fig. 1). Each of those plots clearly reveals a systematic bias between Ager B andAger G. Ager G detected more increments in younger squid and fewer increments inolder squid than did Ager B. One implication is that Ager G detected more increments inthe inner portion of the ground statolith surface and fewer in the outer portion, relative toAger B. Detection of more fine inner increments by Ager G than by Ager B would beconsistent with the higher magnification used by Ager G with image analysis (400X)than by Ager B with the camera lucida (200X). Consistent age underestimation in larvalfishes and discrepancies among investigators have been attributed to the presence ofunresolvable increments around the nucleus, which become increasingly compressedwith decreases in growth or development rate (Campana and Moksness, 1991).
3.2. Investigation of sources of bias in age estimation
There was no difference in mean increment count when each ager used his own

´166 A.F. Gonzalez et al. / J. Exp. Mar. Biol. Ecol. 244 (2000) 161 –180
Fig. 1. Age difference plot showing the differences in number of increments counted between agers (AgerB2Ager G), with each point representing an individual squid or statolith pair (top) and age bias plot showingthe mean number of increments counted by Ager G for all squid assigned a given age or increment count byAger B; the 1:1 equivalence line is also shown (bottom).
´A.F. Gonzalez et al. / J. Exp. Mar. Biol. Ecol. 244 (2000) 161 –180 167
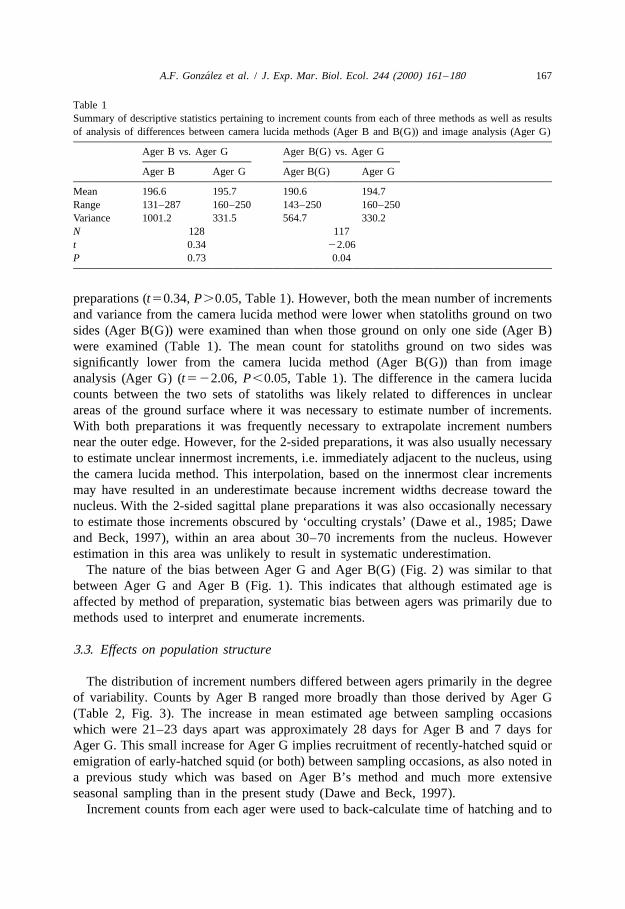
Table 1Summary of descriptive statistics pertaining to increment counts from each of three methods as well as resultsof analysis of differences between camera lucida methods (Ager B and B(G)) and image analysis (Ager G)
Ager B vs. Ager G Ager B(G) vs. Ager G
Ager B Ager G Ager B(G) Ager G
Mean 196.6 195.7 190.6 194.7Range 131–287 160–250 143–250 160–250Variance 1001.2 331.5 564.7 330.2N 128 117t 0.34 22.06P 0.73 0.04
preparations (t50.34, P.0.05, Table 1). However, both the mean number of incrementsand variance from the camera lucida method were lower when statoliths ground on twosides (Ager B(G)) were examined than when those ground on only one side (Ager B)were examined (Table 1). The mean count for statoliths ground on two sides wassignificantly lower from the camera lucida method (Ager B(G)) than from imageanalysis (Ager G) (t522.06, P,0.05, Table 1). The difference in the camera lucidacounts between the two sets of statoliths was likely related to differences in unclearareas of the ground surface where it was necessary to estimate number of increments.With both preparations it was frequently necessary to extrapolate increment numbersnear the outer edge. However, for the 2-sided preparations, it was also usually necessaryto estimate unclear innermost increments, i.e. immediately adjacent to the nucleus, usingthe camera lucida method. This interpolation, based on the innermost clear incrementsmay have resulted in an underestimate because increment widths decrease toward thenucleus. With the 2-sided sagittal plane preparations it was also occasionally necessaryto estimate those increments obscured by ‘occulting crystals’ (Dawe et al., 1985; Daweand Beck, 1997), within an area about 30–70 increments from the nucleus. Howeverestimation in this area was unlikely to result in systematic underestimation.
The nature of the bias between Ager G and Ager B(G) (Fig. 2) was similar to thatbetween Ager G and Ager B (Fig. 1). This indicates that although estimated age isaffected by method of preparation, systematic bias between agers was primarily due tomethods used to interpret and enumerate increments.
3.3. Effects on population structure
The distribution of increment numbers differed between agers primarily in the degreeof variability. Counts by Ager B ranged more broadly than those derived by Ager G(Table 2, Fig. 3). The increase in mean estimated age between sampling occasionswhich were 21–23 days apart was approximately 28 days for Ager B and 7 days forAger G. This small increase for Ager G implies recruitment of recently-hatched squid oremigration of early-hatched squid (or both) between sampling occasions, as also noted ina previous study which was based on Ager B’s method and much more extensiveseasonal sampling than in the present study (Dawe and Beck, 1997).
Increment counts from each ager were used to back-calculate time of hatching and to

´168 A.F. Gonzalez et al. / J. Exp. Mar. Biol. Ecol. 244 (2000) 161 –180
Fig. 2. Age difference plot showing the differences in number of increments counted between agers (AgerB(G)2Ager G), with each point representing an individual squid or statolith pair (top) and age bias plotshowing the mean number of increments counted by Ager G for all squid assigned a given age or incrementcount by Ager B(G); the 1:1 equivalence line is also shown (bottom).
´A.F. Gonzalez et al. / J. Exp. Mar. Biol. Ecol. 244 (2000) 161 –180 169
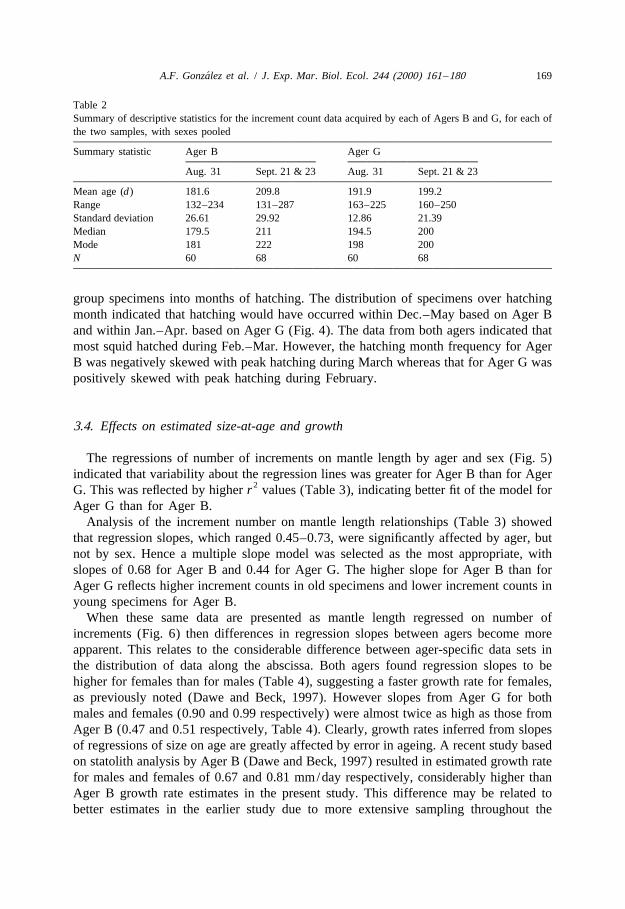
Table 2Summary of descriptive statistics for the increment count data acquired by each of Agers B and G, for each ofthe two samples, with sexes pooled
Summary statistic Ager B Ager G
Aug. 31 Sept. 21 & 23 Aug. 31 Sept. 21 & 23
Mean age (d) 181.6 209.8 191.9 199.2Range 132–234 131–287 163–225 160–250Standard deviation 26.61 29.92 12.86 21.39Median 179.5 211 194.5 200Mode 181 222 198 200N 60 68 60 68
group specimens into months of hatching. The distribution of specimens over hatchingmonth indicated that hatching would have occurred within Dec.–May based on Ager Band within Jan.–Apr. based on Ager G (Fig. 4). The data from both agers indicated thatmost squid hatched during Feb.–Mar. However, the hatching month frequency for AgerB was negatively skewed with peak hatching during March whereas that for Ager G waspositively skewed with peak hatching during February.
3.4. Effects on estimated size-at-age and growth
The regressions of number of increments on mantle length by ager and sex (Fig. 5)indicated that variability about the regression lines was greater for Ager B than for Ager
2G. This was reflected by higher r values (Table 3), indicating better fit of the model forAger G than for Ager B.
Analysis of the increment number on mantle length relationships (Table 3) showedthat regression slopes, which ranged 0.45–0.73, were significantly affected by ager, butnot by sex. Hence a multiple slope model was selected as the most appropriate, withslopes of 0.68 for Ager B and 0.44 for Ager G. The higher slope for Ager B than forAger G reflects higher increment counts in old specimens and lower increment counts inyoung specimens for Ager B.
When these same data are presented as mantle length regressed on number ofincrements (Fig. 6) then differences in regression slopes between agers become moreapparent. This relates to the considerable difference between ager-specific data sets inthe distribution of data along the abscissa. Both agers found regression slopes to behigher for females than for males (Table 4), suggesting a faster growth rate for females,as previously noted (Dawe and Beck, 1997). However slopes from Ager G for bothmales and females (0.90 and 0.99 respectively) were almost twice as high as those fromAger B (0.47 and 0.51 respectively, Table 4). Clearly, growth rates inferred from slopesof regressions of size on age are greatly affected by error in ageing. A recent study basedon statolith analysis by Ager B (Dawe and Beck, 1997) resulted in estimated growth ratefor males and females of 0.67 and 0.81 mm/day respectively, considerably higher thanAger B growth rate estimates in the present study. This difference may be related tobetter estimates in the earlier study due to more extensive sampling throughout the

´170 A.F. Gonzalez et al. / J. Exp. Mar. Biol. Ecol. 244 (2000) 161 –180
Fig. 3. Distribution of number of increments by sample for each ager; Sept. 21 and 23 are pooled to representa common sample, for convenience.
season and across the size range. However differences in annual growth rate may alsohave contributed to these differences.
There is no basis for directly evaluating the accuracy of these two ageing methodsbecause there are no data from known-age specimens. However some insight may begained by comparing these group growth rates, estimated from each method, toindependently estimated individual growth rates based on gladius analysis. To comparegrowth rates of individuals with overall group growth rates it is necessary first toconsider sources of variability among individuals within these groups. The possible

´A.F. Gonzalez et al. / J. Exp. Mar. Biol. Ecol. 244 (2000) 161 –180 171
Fig. 4. Distribution of projected month of hatching for all specimens, by Ager.
effect of time of hatching is particularly important since growth performance has beenfound to improve considerably with month of hatching, not only for this species (Daweand Beck, 1997), but for the two other Illex species as well (Rodhouse and Hatfield,
´1990; Arkhipkin and Laptikhovsky, 1994; Sanchez, 1995).Sample sizes were generally small, after grouping into hatching month by sex based
on increment counts from each ager. For each of the ager-specific data sets by sex, foreach of the three most common hatching months, sample size ranged 4–38. The fit of
2the regression model was also variable (Table 4) and generally better for Ager G (r2ranging 0.26–0.68) than for Ager B (r ranging 0.05–0.36). In fact, only for February-
2hatched males and females did r exceed 0.18 for Ager B (Table 4). Ager G regressionslopes increased considerably with hatching month, especially for males, ranging0.48–1.93 (Table 4, Fig. 7). Unfortunately, it is not possible to detect any such trend inregression slopes for Ager B, because of poor fits of the model (Table 4, Fig. 7).
The difference in slopes between January-hatched and March-hatched males of AgerG implies a four-fold difference in growth rate. An alternate explanation is that suchdifferences among slopes may be due to ageing error. The hatching month assigned toany individual is simply a function of the number of increments counted. If the totalnumber of increments for any squid of a given size is over-estimated, then the individualwill be assigned to an early hatching month and it will be of relatively small size-at-age.Conversely, individuals for which ages are underestimated would be assigned to a latehatching month and they would be of relatively large size-at-age.
3.5. Comparison with gladius growth rates
It is not currently possible to determine to what extent apparent effects of hatchingmonth are due to ageing error. Unfortunately, this complicates comparison of ager-specific group growth rates to individual growth rates based on gladius analysis. If

´172 A.F. Gonzalez et al. / J. Exp. Mar. Biol. Ecol. 244 (2000) 161 –180
Fig. 5. Plots of number of increments on mantle length with regression lines overlain by ager for each sex;dark triangles with fine line represent Ager B, whereas open circles with heavy line represent Ager G.
effects of hatching month are real, then the growth rate of any individual must becompared with that of the group (i.e. hatching month) to which it belongs. However ifhatching month effects represent an artefact then individual growth rates may becompared with the overall group growth rate for each sex.

´A.F. Gonzalez et al. / J. Exp. Mar. Biol. Ecol. 244 (2000) 161 –180 173
Table 3Summary of statistical output of the analysis of the age on mantle length data, including regression statistics byager and sex, as well as summary statistics for the effects retained in the final model. The resultant multipleslope model was Y 5 m 1 b (Z ) 1 a 1 e with overall slopes of 0.68 for Ager B and 0.44 for Ager Gijk i ijk i ijk
Ager Regression statistics2Sex b a r N
Ager BMale 0.73 43.67 0.34 59Female 0.67 48.31 0.34 69Ager GMale 0.45 100.05 0.41 59Female 0.44 99.22 0.44 69
Effects included in the model
Source df Type III SS F Pr.FLength 1 56998.0 128.46 0.0001Ager 1 2429.7 5.58 0.0189Length * Ager 1 2548.9 5.85 0.0162
Individual growth rates were not highly variable, ranging only 0.91–1.12 for the 19gladii examined (Table 5). Although sample sizes of gladii were small when assigned togroups based on sex and hatching month, according to each ager, it appeared thatindividual growth rates were not greatly affected by estimated month of hatching. Thissuggests that the highly variable group growth rates of Ager G represent an artefact ofageing error which would not be reflected in gladius-based individual growth ratesbecause early growth history cannot be reconstructed from the gladii of large squid. Italso suggests that it is valid to compare individual gladius growth rates with groupgrowth rates for all data pooled, by sex. In that comparison, Ager G group growth rates(0.91 and 0.99 mm/day) more closely approximate the gladius individual growth ratesthan do Ager B group growth rates (0.47 and 0.51 mm/day).
However, it is possible that there may be differences in size-at-age due to hatchingmonth effects on early growth, but this remains unknown because gladius analysiscannot be used to independently estimate age. Perez and O’Dor, (1994) showed that‘exponential’ growth of oceanic juveniles smaller than 30–40 mm GL varies con-siderably among individuals, perhaps due to feeding conditions.
Temperature is known to positively affect laboratory growth of several cephalopods(Forsythe and Van Heukelem, 1987; O’Dor and Wells, 1987; Forsythe and Hanlon,1988, 1989). Forsythe (1993) hypothesized that seasonal temperature increase wouldpromote early exponential growth in particular. Any seasonal effect on growth probablyinvolves interaction of temperature, size, feeding ratios, food quality, and conversionefficiency (Forsythe and Van Heukelem, 1987; O’Dor and Wells, 1987; Perez andO’Dor, 1994). An increase in growth performance with time of hatching has been widelyreported for northern short-finned squid, for both other species of the genus Illex(reviewed by Dawe and Beck, 1997), and for other squids (Jackson and Choat, 1992).However, all those studies were based on counting statolith increments using lightmicroscopy methods, so effects of ageing error are unknown. In two independent studies

´174 A.F. Gonzalez et al. / J. Exp. Mar. Biol. Ecol. 244 (2000) 161 –180
Fig. 6. Plots of mantle length on number of increments with regression lines overlain, by ager for each sex;dark triangles with fine line represent Ager B, whereas open circles with heavy line represent Ager G.
on Illex argentinus, involving different ageing methods, Rodhouse and Hatfield (1990)concluded that growth rate increased with month of hatching whereas Arkhipkin andLaptikhovsky (1994) found no such trend in growth rate but that size-at-age increasedwith month of hatching.

´A.F. Gonzalez et al. / J. Exp. Mar. Biol. Ecol. 244 (2000) 161 –180 175
Table 4Regression parameters by ager and sex for all data pooled, as well as for each of the three most commonhatching months, for the mantle length on number of increments relationships
Sex Hatching Regression parametersmonth
Ager B Ager G2 2b a r N b a r N
Male Jan. 0.31 143.88 0.06 13 0.48 109.62 0.67 5Feb. 0.74 72.69 0.22 17 1.38 262.79 0.46 25Mar. 0.35 139.27 0.06 21 1.93 2151.99 0.68 24
All data 0.47 117.87 0.34 59 0.90 34.95 0.41 59Female Jan. 0.63 82.66 0.18 11 1.01 18.20 0.61 4
Feb. 0.93 34.81 0.36 23 0.92 38.90 0.26 38Mar. 0.41 135.23 0.05 25 1.84 2137.23 0.58 22
All data 0.51 119.72 0.34 69 0.99 25.08 0.44 69
It remains uncertain which of the two ageing methods compared in this study wouldprovide the more reliable age estimates. This uncertainty is related to the lack ofknown-age specimens, or any other methods to validate increment counts, unknowneffects of hatching time on early growth rates, and great variability among results ofageing studies published to date. It does appear, however, that overall growth rate isapproximately 1 mm/day.
4. Summary and conclusions
The two independent statolith-based methods generally agreed with respect to suchdemographic features as age structure, peak hatching period, and migration. However,systematic bias between methods had a great effect on estimated growth rates. Crossingof methods indicated that age estimates were affected by method of statolith preparation,but bias was mostly attributable to differences between agers in method of interpretingand enumerating increments. Comparison of ager-specific growth rates with individualgladius growth rates was inconclusive in indicating which method was the more accuratebecause it was unclear whether apparent effects of time of hatching on statolith-basedgrowth rates represented an artefact of ageing error. Overall, the consistent individualgladius growth rates (0.91–1.12 mm/day) agreed best with the overall growth rates ofAger G.
The considerable differences we found between methods are not surprising. Only oneother study has compared statolith-based ageing methods by partitioning statolith pairsbetween two methods. Lipinski and Durholtz (1994) found significant differences inincrement counts for Loligo vulgaris reynaudii between a light microscopy method anda scanning electron microscopy method, based on 37 pairs of statoliths partitioned
´between methods. Gonzalez et al. (1998) found significant differences in mean age andestimated growth rates of Illex coindetii between two methods based on image analysis(manual versus semiautomatic counting), with comparisons based on common statolith

´176
A.F
.G
onzalezet
al./
J.E
xp.M
ar.B
iol.E
col.244
(2000)161
–180
Fig. 7. Plots of mantle length on number of increments with regression lines overlain, by projected hatching month, for each ager and sex; hatching months overlainare Jan. (open squares), Feb. (dark triangles), and Mar. (open circles).

´A.F. Gonzalez et al. / J. Exp. Mar. Biol. Ecol. 244 (2000) 161 –180 177
Table 5Comparison of gladius-based individual growth rates for selected specimens by hatching month as estimatedby each of Ager B and Ager G. Note that any individual gladius may be assigned to different hatching monthsby Agers B and G
Sex Hatching month Gladius growth rate (specimen)
Ager B Ager G
Male January 0.91 (226)1.07 (227)0.99 (228)0.95 (234)
February 1.07 (235) 1.07 (235)1.05 (243) 1.05 (243)1.05 (254) 0.95 (234)1.03 (256) 1.09 (248)
March 1.09 (248) 0.91 (226)1.07 (227)0.99 (228)1.05 (254)1.03 (256)
Female January 1.12 (246) 0.96 (245)1.01(239)
February 0.99 (233) 0.99 (233)1.01 (242) 1.01 (242)1.08 (252) 1.08 (252)0.96 (245) 1.12 (246)1.02 (231) 1.01 (239)1.02 (241)1.10 (249)1.03 (251)
March 1.02 (231)1.03 (241)1.10 (249)1.04 (251)
preparations by a single ager. Application of those methods to known-age Sepioteuthislessoniana showed that semiautomatic counting, as used by Ager G in our study, was themore accurate.
The much more extensive investigations to date on accuracy of ageing larval fish,based on daily growth increments in otoliths, indicate that underestimation of true age iscommon to most investigators (Geffen, 1982; Lough et al., 1982; Campana andMoksness, 1991; Campana et al., 1987). Campana and Moksness (1991) found thataccuracy varied considerably among investigators who aged larval herring which wereyounger than about 65 days of age. They found that accuracy was affected by equipmentused but there were no apparent differences between video systems and directmicroscopy.
A comprehensive, broad-scale, collaborative approach to investigating accuracy andprecision of statolith-based ageing methods is clearly needed, especially considering theproblems with acquiring known-age squid specimens. Such an investigation should

´178 A.F. Gonzalez et al. / J. Exp. Mar. Biol. Ecol. 244 (2000) 161 –180
feature division of unprocessed statolith pairs between different methods, exchange ofground statolith mounts among agers, and blind repeat counting to assess precision.Comparison with gladius growth rates may also be insightful. This approach could resultin recommendations regarding most suitable methods for mounting, grinding andanalyzing statoliths of a given species toward maximizing precision and achievingconsistency among investigators.
Acknowledgements
We thank J. Drew for processing squid samples and D. Stansbury for advice andassistance with statistical analysis. Comments provided by P. Pepin and K.S. Naidu, onan earlier version of this manuscript, were quite helpful. We also thank William K. Macy(G.S.O., Rhode Island, USA) for use of image analysis facilities. [AU]
References
Arkhipkin, A.I., 1993. Age, growth, stock-structure and migratory rate of pre-spawning short-finned squid Illexargentinus based on statolith ageing investigations. Fish. Res. 16, 313–338.
Arkhipkin, A.I., Laptikhovsky, V., 1994. Seasonal and interannual variability in growth and maturation ofwinter-spawning Illex argentinus (Cephalopoda: Ommastrephidae) in the South Atlantic. Aquat. LivingResou. 7, 221–232.
Balch, N., Sirois, A.S., Hurley, G.V., 1988. Growth increments in statoliths from paralarvae of theommastrephid squid Illex (Cephalopoda: Theuthoidea). Malacologia Vol. 29, 103–112.
Bizikov, V.A., 1991. A new method of squid age determination using the gladius. In: Jereb, P., Ragonese, S.,von Boletesky, S. (Eds.), Squid Age Determination Using Statoliths: Proceedings of the InternationalWorkshop, Mazara del Vallo, Italy, 9–14 October 1989. N.T.R.-I.T.P.P. Special Publication No. 1, Istituto diTecnologia della Pesca e del Pescato, Mazara del Vallo, Italy, pp. 39–51.
Campana, S.E., Annand, M.C., McMillan, J.I., 1995. Graphical and statistical methods for determining theconsistency of age determination. Trans. Amer. Fish. Soc. 124, 131–138.
Campana, S.E., Gagne, J.A., Munro, J., 1987. Otolith microstructure of larval herring (Clupea harengus):image or reality? Can. J. Fish. Aquat. Sci. 44, 1922–1929.
Campana, S.E., Moksness, E., 1991. Accuracy and precision of age and hatch date estimates from otolithmicrostructure examination. ICES. J. Mar. Sci. 48, 303–316.
Dawe, E.G., Beck, P.C., 1997. Population structure, growth, and sexual maturation of short-finned squid (Illexillecebrosus) at Newfoundland. Can. J. Fish. Aquat. Sci. 54, 137–146.
Dawe, E.G., O’Dor, R.K., Odense, P.H., Hurley, G.V., 1985. Validation and application of an ageing techniquefor short-finned squid (Illex illecebrosus). J. Northw. Atl. Fish. Sci. 6, 107–116.
Forsythe, J.W., 1993. A working hypothesis on how seasonal temperature change may impact the field growthof young cephalopods. In: Okutani, T., O’Dor, R.K., Kubodera, T. (Eds.), Recent Advances in CephalopodFisheries Biology: Contributed Papers to 1991 CIAC International Symposium and Proceedings of theWorkshop on Age, Growth and Population Structure, Tokai University Press, Tokyo, Japan, pp. 591–606.
Forsythe, J.W., Hanlon, R.T., 1988. Effect of temperature on laboratory growth, reproduction and life span ofOctopus bimaculoides. Marine Biology 98, 369–379.
Forsythe, J.W., Hanlon, R.T., 1989. Growth of the eastern Atlantic squid, Loligo forbesi Steenstrup (Mollusca:Cephalopoda). Aquaculture and Fisheries Management 20, 1–14.

´A.F. Gonzalez et al. / J. Exp. Mar. Biol. Ecol. 244 (2000) 161 –180 179
Forsythe, J.W., Van Heukelem, W.F., 1987. Growth. In: Boyle, P.R. (Ed.), Comparative reviews, Cephalopodlife cycles, Vol. II, Academic Press, London, pp. 135–156.
Geffen, A.J., 1982. Otolith ring deposition in relation to growth rate in herring (Clupea harengus) and turbot(Scophthalmus maximus) larvae. Mar. Biol. 71, 317–326.
´Gonzalez, A.F., Castro, B.G., Guerra, A., 1996. Age and growth of the short-finned squid Illex coindetii inGalician waters (NW Spain) based on statolith analysis. ICES J. Mar. Sci. 53, 802–810.
´Gonzalez, A.F., Macy, W.K., Guerra, A., 1998. Comparison of methods for squid age determination based onstatolith growth increment analysis. ICES J. Mar. Sci. 55, 535–554.
Hurley, G.V., Beck, P.C., 1979. The observation of growth rings in statoliths from the ommastrephid squid,Illex illecebrosus. Bull. Am. Malacol. Union Inc, 23–29.
Hurley, G.V., Odense, P.H., O’Dor, R.K., Dawe, E.G., 1985. Strontium labelling for verifying daily growthincrements in the statoliths of the short-finned squid (Illex illecebrosus). Can. J. Fish. Aquat. Sci. 42,380–383.
Jackson, G.D., 1994. Application and future potential of statolith increment analysis in squids and sepioids.Can. J. Fish. Aquat. Sci. 51, 2612–2625.
Jackson, G.D., Arkhipkin, A.I., Bizikov, V.A., Hanlon, R.T., 1993. Laboratory and field corroboration of ageand growth from statolith and gladii of the loliginid squid Sepioteuthis lessoniana. In: Okutani, T., O’Dor,R.K., Kubodera, T. (Eds.), Recent Advances in Cephalopod Fisheries Biology: Contributed Papers to 1991CIAC International Symposium and Proceedings of the Workshop on Age, Growth and PopulationStructure, Tokai University Press, Tokyo, Japan, pp. 591–606.
Jackson, G.D., Choat, J.H., 1992. Growth in tropical cephalopods: an analysis based on statolith micro-structure. Can. J. Fish. Aquat. Sci. 49, 218–228.
Lipinski, M.R., 1978. The age of the squid Illex illecebrosus (LeSueur, 1821) from their statoliths, ICNAF,Res. Doc. 78/ II /15.
Lipinski, M.R., Durholtz, M.D., 1994. Problems associated with ageing squid from their statoliths: towards amore structured approach. Antarct. Sci. 612 (2), 215–222.
Lough, R.G., Pennington, M., Boltz, G.R., Rosenberg, A.A., 1982. Age and growth of larval Atlantic herring,Clupea harengus, in the Gulf of Maine-Georges Bank region based on otolith growth increments. Fish.Bull. 80, 187–200.
Macy, W.K., 1995. The application of digital image processing to the ageing of long-finned squid Loligopealei, using the statolith. In: Secor, D.H., Dean, J.M., Campana, S.E. (Eds.), Recent Developments in FishOtolith Research. Belle W. Baruch Library in Marine Science, Vol. No. 19, University of South CarolinaPress, Columbia, pp. 283–302.
Morris, C.C., Aldrich, F.A., 1985. Statolith length and increment number for age determination in squid, Illexillecebrosus (LeSueur, 1821) (Cephalopoda: Ommastrephidae). NAFO Sci. Coun. Studies 9, 101–106.
O’Dor, R.K., Wells, M.J., 1987. Energy and nutrient flow. In: Boyle, P.R. (Ed.), Cepahlopod life cycles,Vol. II,Academic Press, London, pp. 109–134.
Perez, J.A.A., 1994. The early life history of the short-finned squid, Illex illecebrosus (Cephalopoda:Ommastrephidae), as reconstructed from the gladius structure, Ph.D. thesis, Dalhousie University, Halifax,N.S.
Perez, J.A.A., O’Dor, R.K., 1994. Critical transitions in gladius reconstructed early growth histories of theshort-finned squid, Illex illecebrosus. ICES C.M.1994/K:36, International Council for the Exploration ofthe Sea, Copenhagen, Denmark.
Perez, J.A.A., O’Dor, R.K., Beck, P., Dawe, E.G., 1996. Evaluation of gladius dorsal surface structure for ageand growth studies of the short-finned squid, Illex illecebrosus (Teuthoidea: Ommastrephidae). Can. J. Fish.Aquat. Sci. 53, 2837–2846.
Radtke, R.L., 1983. Chemical and structural characteristics of statoliths from the short-finned squid, Illexillecebrosus. Mar. Biol. 76, 47–54.
Rodhouse, P.G., Hatfield, E.M.C., 1990. Dynamics of growth and maturation in the cephalopod Illexargentinus de Castellanos, 1960 (Teuthoidea: Ommastrephidae). Phil. Trans. R. Soc. Lond. B 329,229–241.
´Sanchez, P., 1995. Age and growth of Illex coindetii. ICES Mar. Sci. Symp. 199, 441–444.

´180 A.F. Gonzalez et al. / J. Exp. Mar. Biol. Ecol. 244 (2000) 161 –180
Stevenson, D.K., Campana, S.E., 1992. Otolith microstructure examination and analysis. Can. Spec. Publ. Fish.Aquat. Sci. 117, 1–126.
Summerfelt, R.C., Hall, G.E., 1987. Age and growth of fish, Iowa State University Press, Ames, vxi1544 p.Uozumi, Y., Shiba, C., 1993. Growth and age composition of Illex argentinus (Cephalopoda: Oegopsida) based
on daily increment counts in statoliths. In: Okutani, T., O’Dor, R.K., Kubodera, T. (Eds.), Recent Advancesin Cephalopod Fisheries Biology: Contributed Papers to 1991 CIAC International Symposium andProceedings of the Workshop on Age, Growth and Population Structure, Tokai University Press, Tokyo,Japan, pp. 591–606.