Embed Size (px)
Citation preview
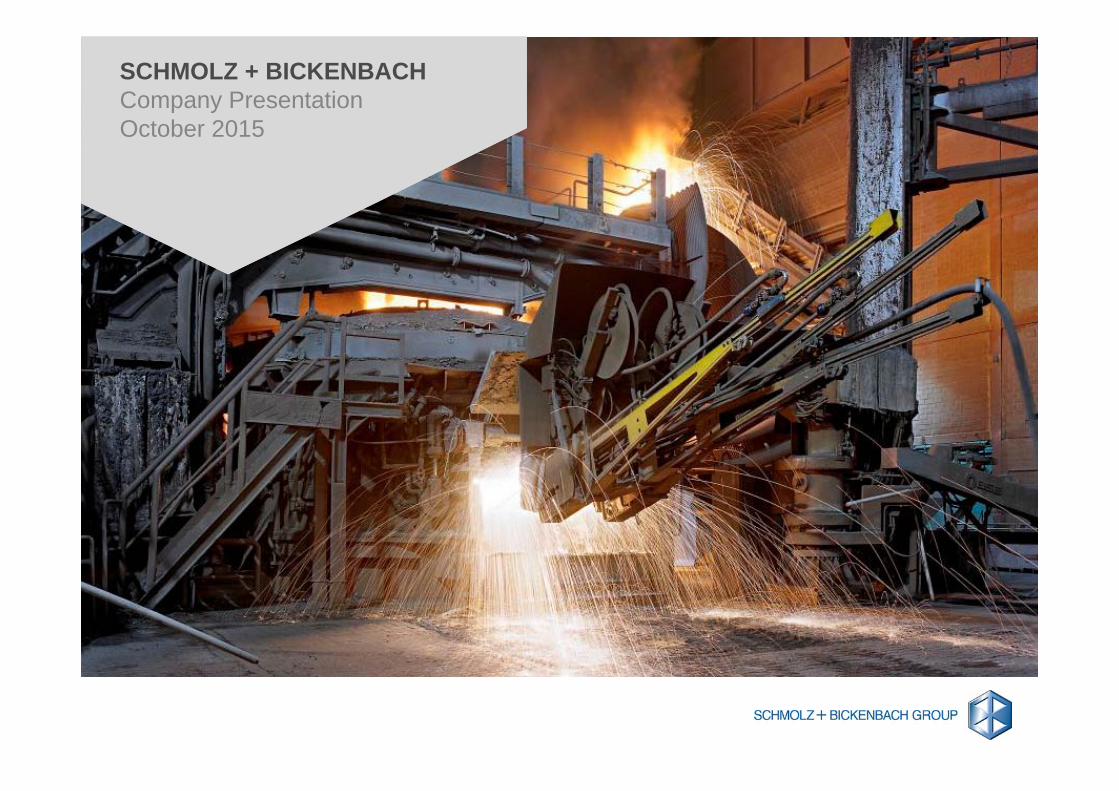
SCHMOLZ + BICKENBACHCompany PresentationOctober 2015
2
DisclaimerThis publication constitutes neither a prospectus within the meaning of article 652a and/or 1156 of the Swiss Code of Obligations nor a listing prospectus within the meaning of the listing rules of the SIX Swiss Exchange. This publication constitutes neither an offer to sell nor a solicitation to buy securities of SCHMOLZ + BICKENBACH. The securities have already been sold.
This document shall not constitute an offer to sell or the solicitation of an offer to buy, nor shall there be any sale of securities referred to herein in any jurisdiction in which such offer, solicitation or sale would be unlawful prior to registration, exemption from registration or qualification under the securities laws of any such jurisdiction. The securities referred to herein have not been and will not be registered under the United States Securities Act of 1933, as amended (the "Securities Act"), and may not be offered or sold in the United States or to U.S. persons (as such term is defined in Regulation S under the Securities Act) absent registration or an exemption from registration under the Securities Act. The issuer of the securities has not registered, and does not intend to register, any portion of the offering in the United States, and does not intend to conduct a public offering of securities in the United States.
3
1
32
456
KEY INVESTMENT HIGHLIGHTSSTRATEGIC REALIGNMENT AND MID-TERM TARGETS
FINANCIAL OVERVIEW
OUTLOOK AND GUIDANCE 2015
KEY TAKEAWAYS
APPENDIX
4
KEY INVESTMENT HIGHLIGHTS1
5
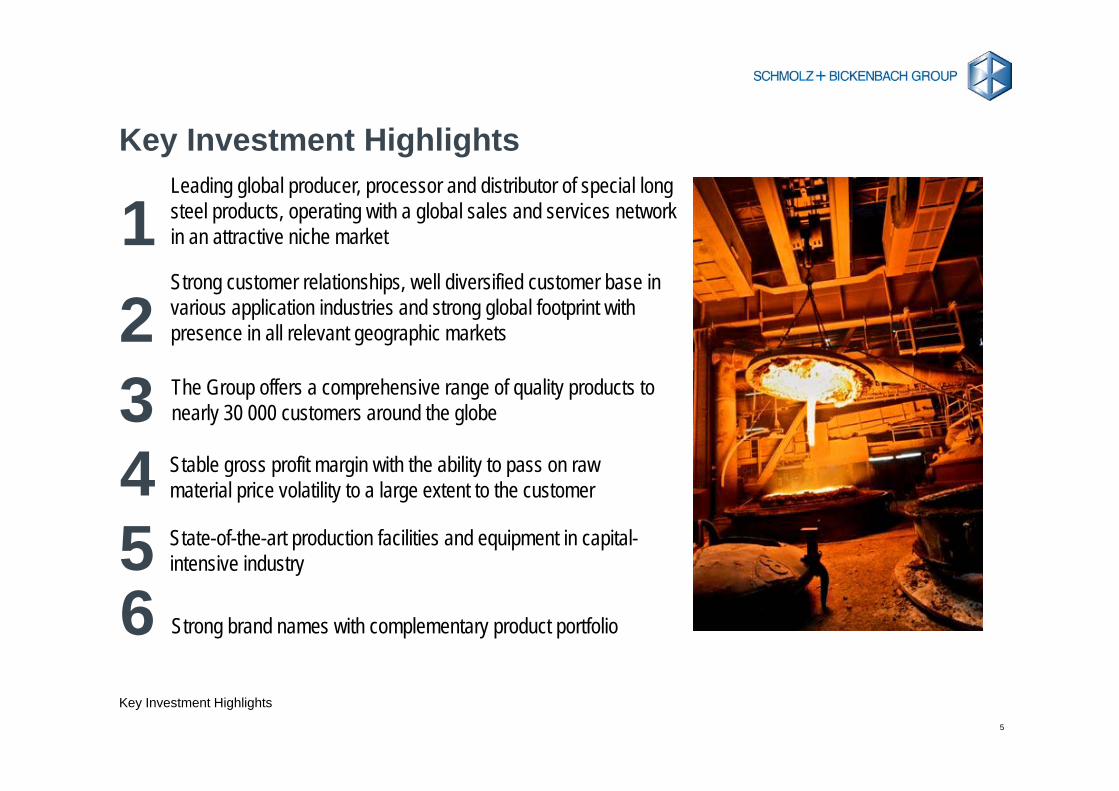
Key Investment Highlights
Key Investment Highlights
Leading global producer, processor and distributor of special long steel products, operating with a global sales and services network in an attractive niche market1Strong customer relationships, well diversified customer base in various application industries and strong global footprint with presence in all relevant geographic markets
Strong brand names with complementary product portfolio
5
34
2
6
The Group offers a comprehensive range of quality products to nearly 30 000 customers around the globe
Stable gross profit margin with the ability to pass on raw material price volatility to a large extent to the customer
State-of-the-art production facilities and equipment in capital-intensive industry
6
1 Attractive niche market
Key Investment Highlights
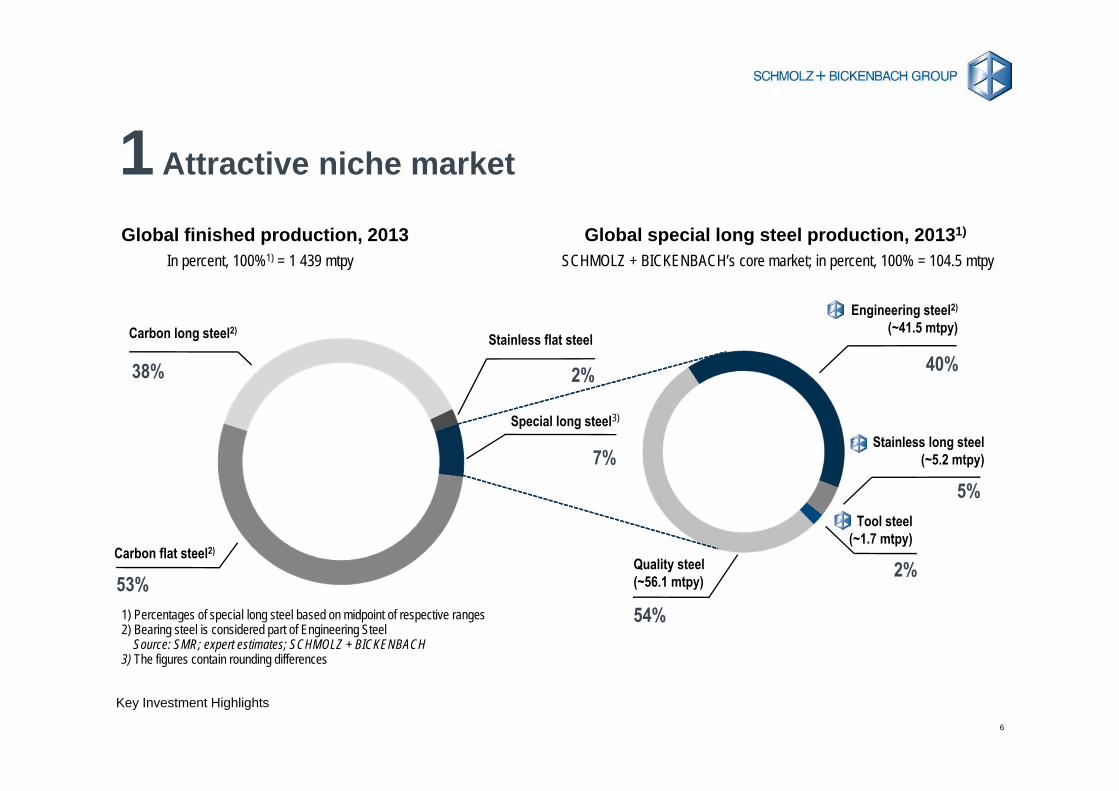
Global finished production, 2013 Global special long steel production, 20131)
1) Percentages of special long steel based on midpoint of respective ranges2) Bearing steel is considered part of Engineering Steel
Source: SMR; expert estimates; SCHMOLZ + BICKENBACH3) The figures contain rounding differences
In percent, 100%1) = 1 439 mtpy SCHMOLZ + BICKENBACH’s core market; in percent, 100% = 104.5 mtpy
Stainless long steel(~5.2 mtpy)
5%Tool steel
(~1.7 mtpy)
2%
Engineering steel2)
(~41.5 mtpy)
40%
Quality steel (~56.1 mtpy)
54%
Stainless flat steel
2%
Carbon long steel2)
38%
Carbon flat steel2)
53%
Special long steel3)
7%
7
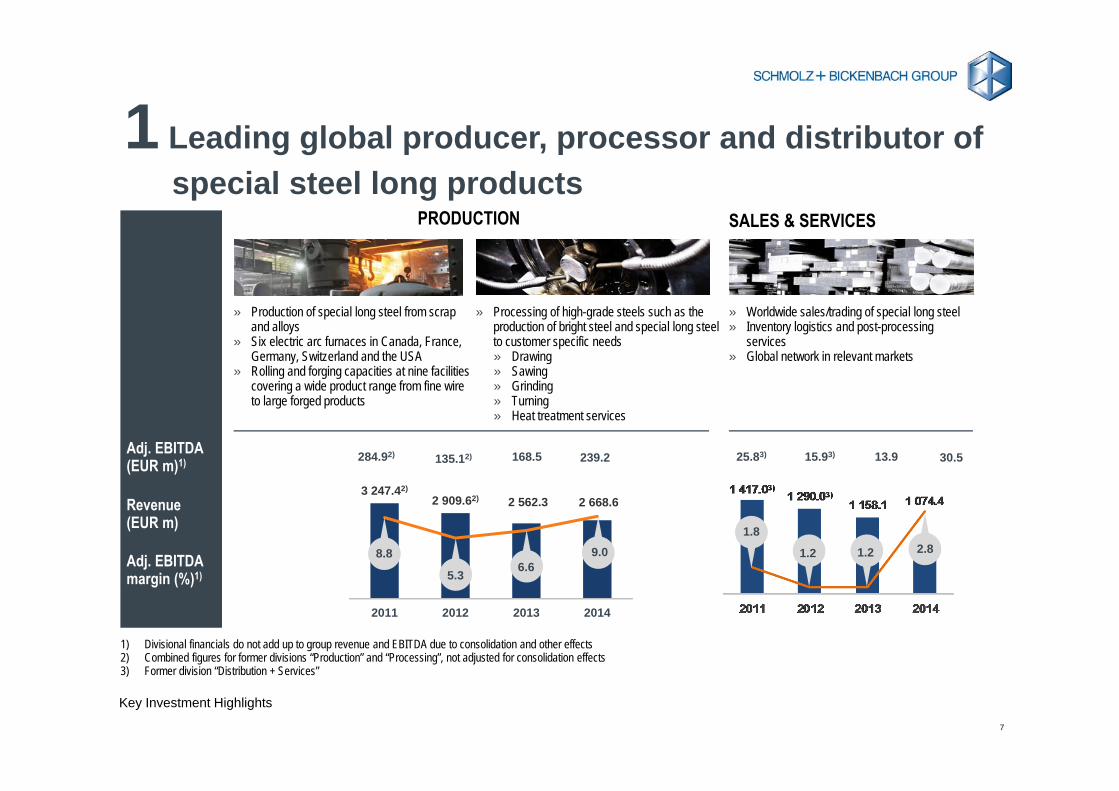
1 Leading global producer, processor and distributor of special steel long products
Key Investment Highlights
3 247.42)2 909.62) 2 562.3 2 668.6
2011 2012 2013 2014
SALES & SERVICESPRODUCTION
Revenue (EUR m)
Adj. EBITDA margin (%)1)
1) Divisional financials do not add up to group revenue and EBITDA due to consolidation and other effects2) Combined figures for former divisions “Production” and “Processing”, not adjusted for consolidation effects3) Former division “Distribution + Services”
Adj. EBITDA (EUR m)1)
» Production of special long steel from scrap and alloys
» Six electric arc furnaces in Canada, France, Germany, Switzerland and the USA
» Rolling and forging capacities at nine facilities covering a wide product range from fine wire to large forged products
» Processing of high-grade steels such as the production of bright steel and special long steel to customer specific needs» Drawing» Sawing» Grinding» Turning» Heat treatment services
» Worldwide sales/trading of special long steel » Inventory logistics and post-processing
services» Global network in relevant markets
284.92) 135.12) 168.5
8.8
5.3 6.69.0
239.2 25.83) 15.93) 13.9
1.8
1.2 1.2
30.5
2.8
8
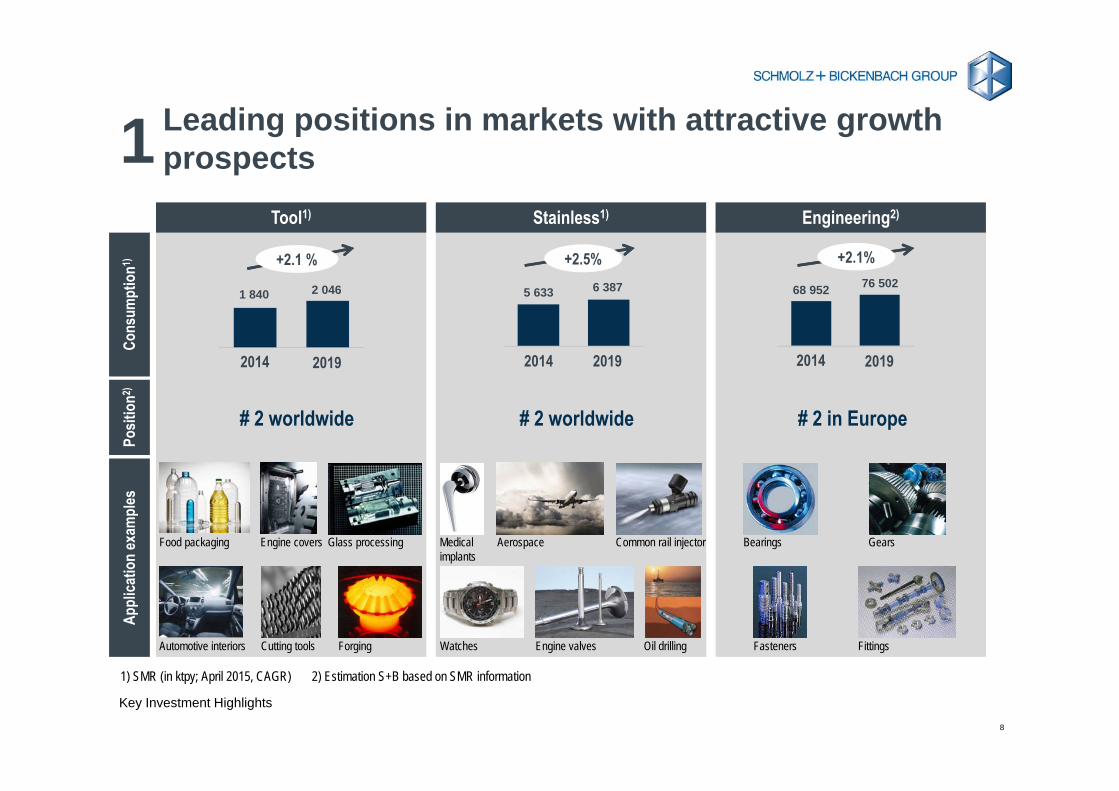
Leading positions in markets with attractive growth prospects1
Cons
umpt
ion1)
# 2 worldwide # 2 worldwide # 2 in Europe
Tool1)
Posit
ion2)
Stainless1) Engineering2)
Appl
icatio
n ex
ampl
es
Food packaging Engine covers Glass processing
Cutting toolsAutomotive interiors Forging Oil drilling
Aerospace
Watches Engine valves
Common rail injectorMedical implants
Bearings Gears
Fasteners Fittings
Key Investment Highlights
2 0461 840 6 3875 63376 50268 952
2014 20192014 20192014 2019
+2.1 % +2.5% +2.1%
1) SMR (in ktpy; April 2015, CAGR) 2) Estimation S+B based on SMR information
9
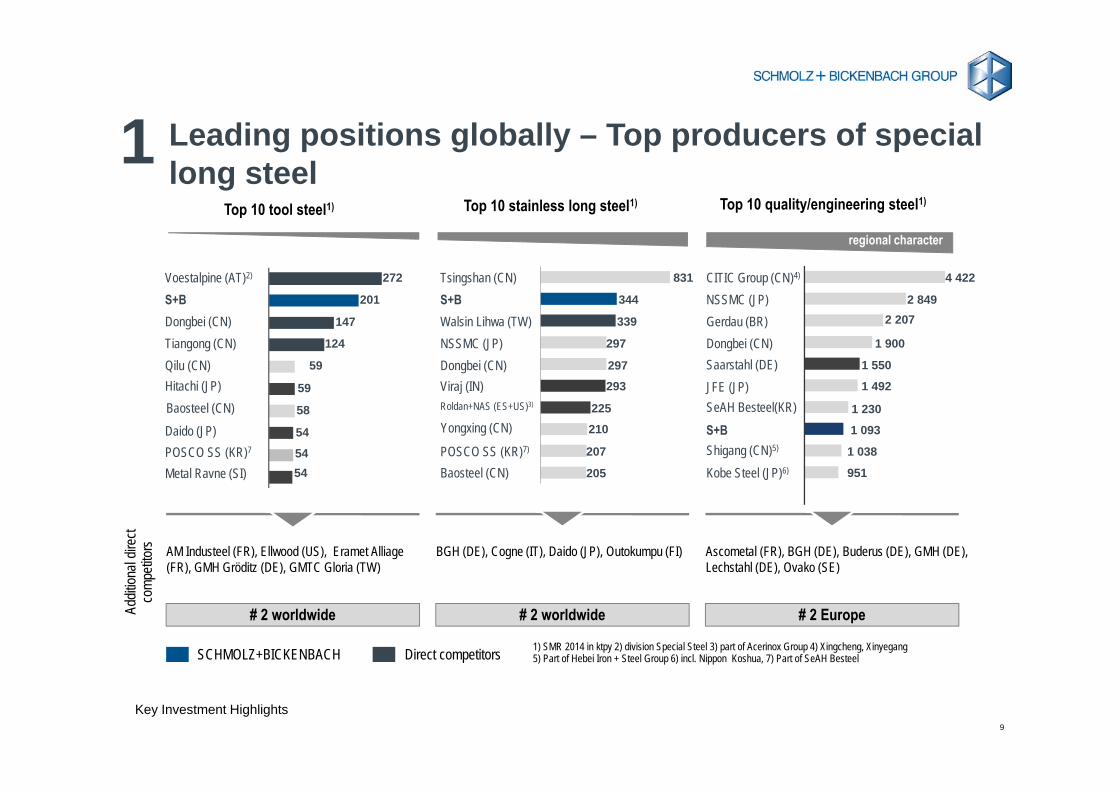
Leading positions globally – Top producers of special long steel
Top 10 tool steel1) Top 10 stainless long steel1) Top 10 quality/engineering steel1)
regional character
# 2 Europe# 2 worldwide# 2 worldwideAddit
ional
direc
t co
mpeti
tors
SCHMOLZ+BICKENBACH Direct competitors
regional character
1
Key Investment Highlights
BGH (DE), Cogne (IT), Daido (JP), Outokumpu (FI) Ascometal (FR), BGH (DE), Buderus (DE), GMH (DE), Lechstahl (DE), Ovako (SE)
AM Industeel (FR), Ellwood (US), Eramet Alliage(FR), GMH Gröditz (DE), GMTC Gloria (TW)
4 422
951
1 038
1 492
1 550
1 900
2 2072 849
1 093
1 230
831
344
339
297
297293
225210
207
205
272
201
147
124
59
59
58
54
5454
Voestalpine (AT)2)
S+BDongbei (CN)Tiangong (CN)Qilu (CN)
Baosteel (CN)Hitachi (JP)
Metal Ravne (SI)
Daido (JP)POSCO SS (KR)7
Tsingshan (CN)S+BWalsin Lihwa (TW)NSSMC (JP)Dongbei (CN)Viraj (IN)
Yongxing (CN)Roldan+NAS (ES+US)3)
POSCO SS (KR)7)
Baosteel (CN)
CITIC Group (CN)4)
NSSMC (JP)Gerdau (BR)Dongbei (CN)
JFE (JP)Saarstahl (DE)
Shigang (CN)5)
S+B
Kobe Steel (JP)6)
SeAH Besteel(KR)
1) SMR 2014 in ktpy 2) division Special Steel 3) part of Acerinox Group 4) Xingcheng, Xinyegang5) Part of Hebei Iron + Steel Group 6) incl. Nippon Koshua, 7) Part of SeAH Besteel
10
18.6%1.4%2.5%3.0%
5.1%9.7%
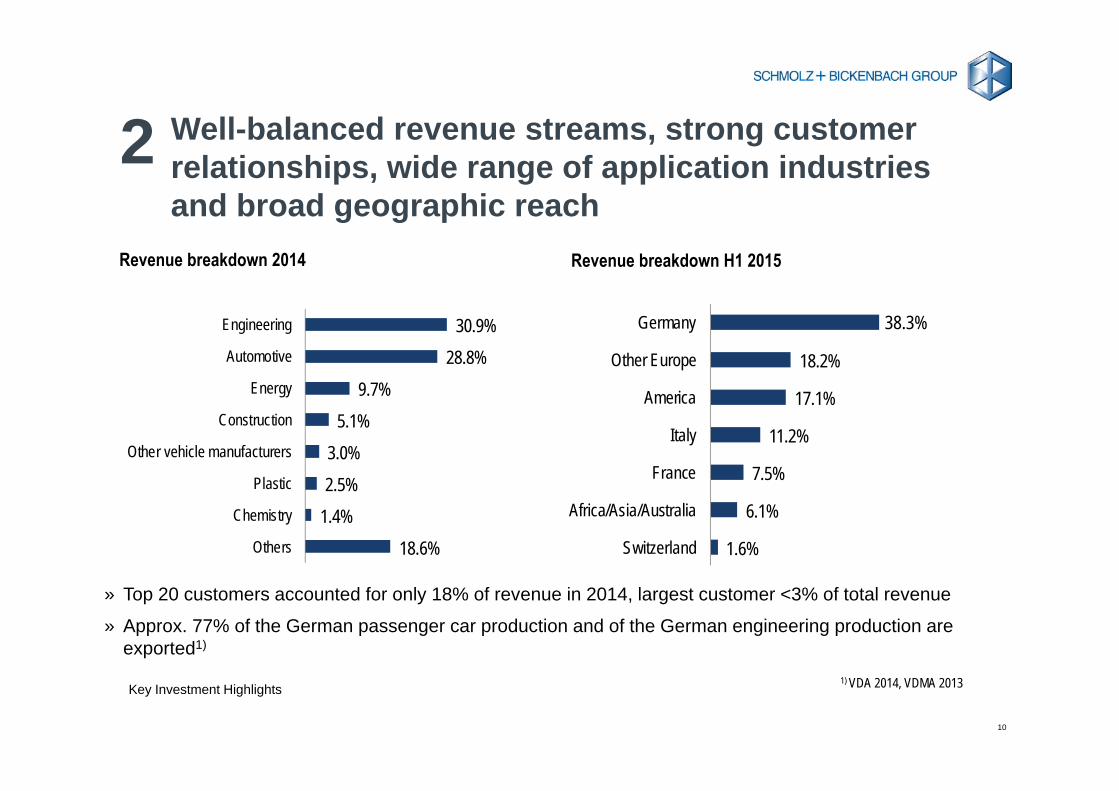
28.8%30.9%
Others
Chemistry
Plastic
Other vehicle manufacturers
Construction
Energy
Automotive
Engineering
Well-balanced revenue streams, strong customer relationships, wide range of application industries and broad geographic reach
1.6%
6.1%
7.5%
11.2%
17.1%
18.2%
Switzerland
Africa/Asia/Australia
France
Italy
America
Other Europe
Germany
Revenue breakdown 2014
2
38.3%
Key Investment Highlights
» Top 20 customers accounted for only 18% of revenue in 2014, largest customer <3% of total revenue
» Approx. 77% of the German passenger car production and of the German engineering production are exported1)
1) VDA 2014, VDMA 2013
Revenue breakdown H1 2015
11
Key Investment Highlights
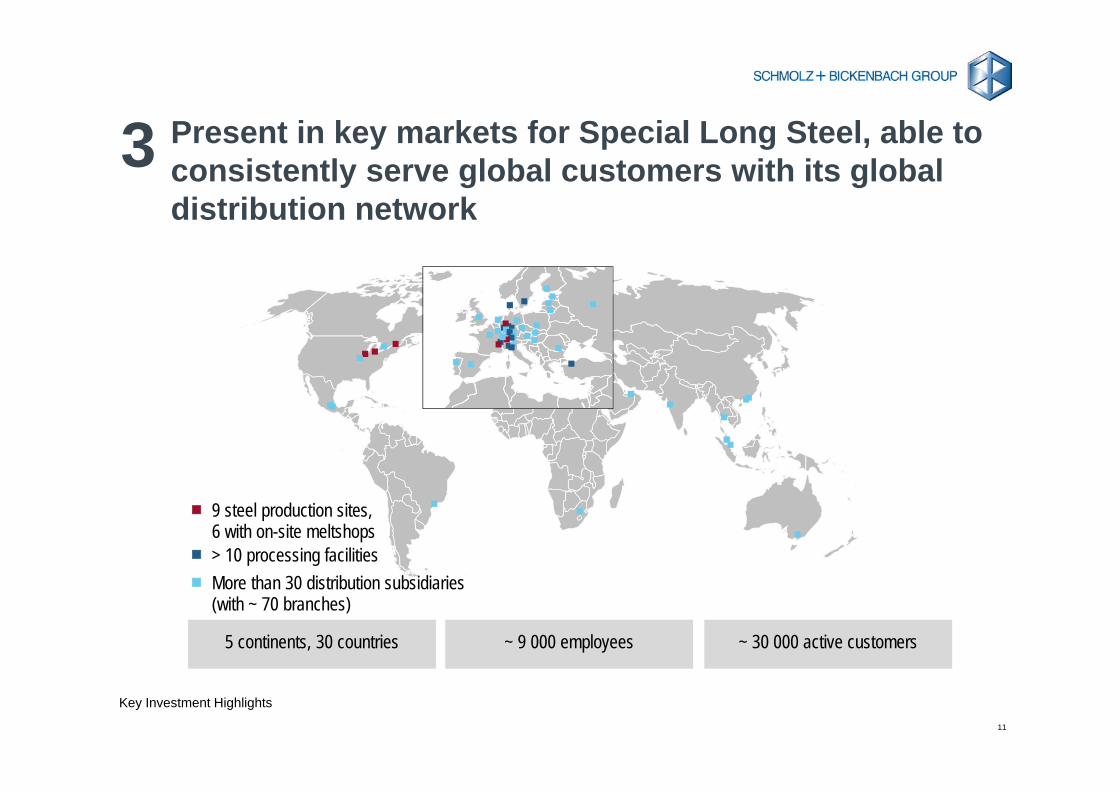
5 continents, 30 countries ~ 9 000 employees ~ 30 000 active customers
9 steel production sites, 6 with on-site meltshops> 10 processing facilitiesMore than 30 distribution subsidiaries(with ~ 70 branches)
Present in key markets for Special Long Steel, able to consistently serve global customers with its global distribution network
3
12
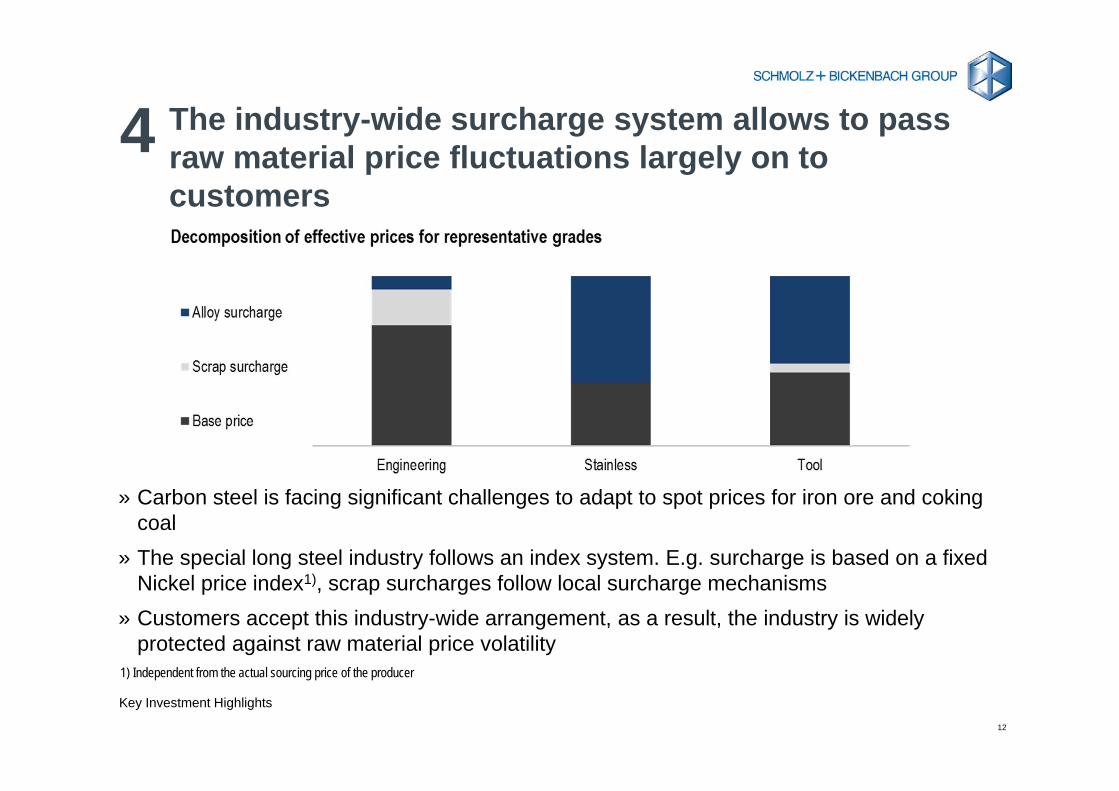
» Carbon steel is facing significant challenges to adapt to spot prices for iron ore and coking coal
» The special long steel industry follows an index system. E.g. surcharge is based on a fixed Nickel price index1), scrap surcharges follow local surcharge mechanisms
» Customers accept this industry-wide arrangement, as a result, the industry is widely protected against raw material price volatility
1) Independent from the actual sourcing price of the producer
The industry-wide surcharge system allows to pass raw material price fluctuations largely on to customers
Key Investment Highlights
4
13
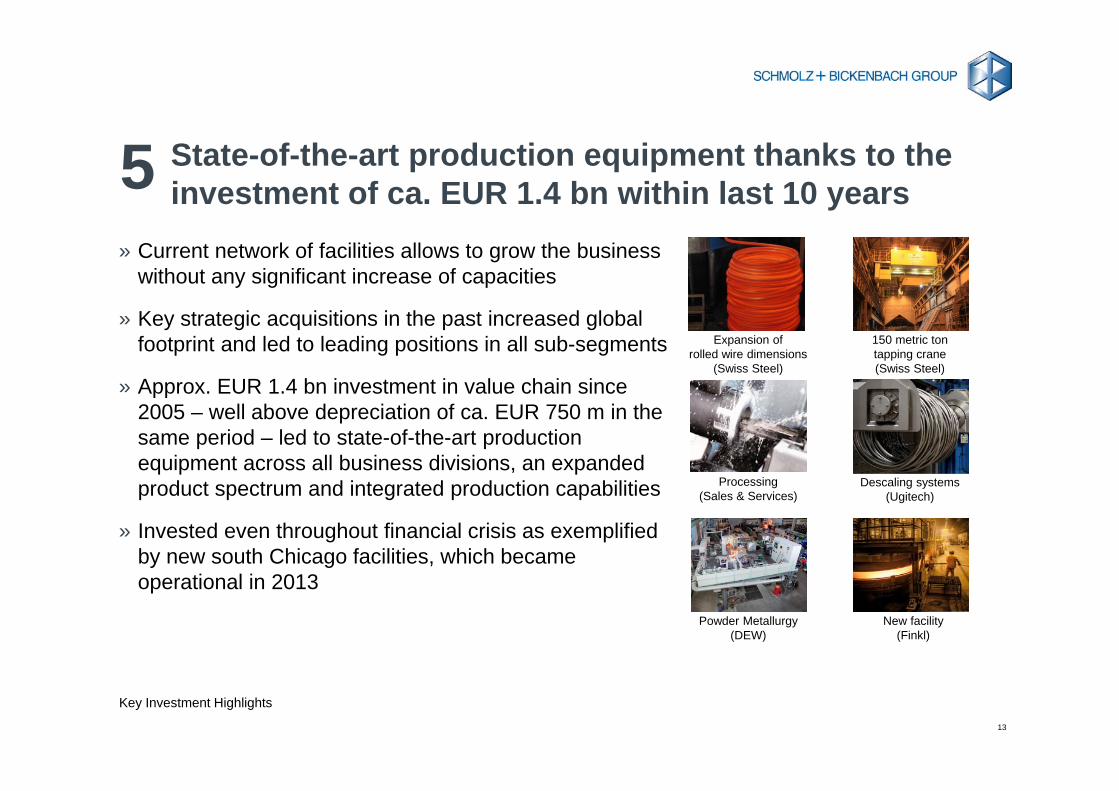
State-of-the-art production equipment thanks to the investment of ca. EUR 1.4 bn within last 10 years
» Current network of facilities allows to grow the business without any significant increase of capacities
» Key strategic acquisitions in the past increased global footprint and led to leading positions in all sub-segments
» Approx. EUR 1.4 bn investment in value chain since 2005 – well above depreciation of ca. EUR 750 m in the same period – led to state-of-the-art production equipment across all business divisions, an expanded product spectrum and integrated production capabilities
» Invested even throughout financial crisis as exemplified by new south Chicago facilities, which became operational in 2013
Expansion of rolled wire dimensions
(Swiss Steel)
Powder Metallurgy (DEW)
150 metric ton tapping crane (Swiss Steel)
Descaling systems (Ugitech)
New facility(Finkl)
5
Key Investment Highlights
Processing(Sales & Services)
14
Key Investment Highlights
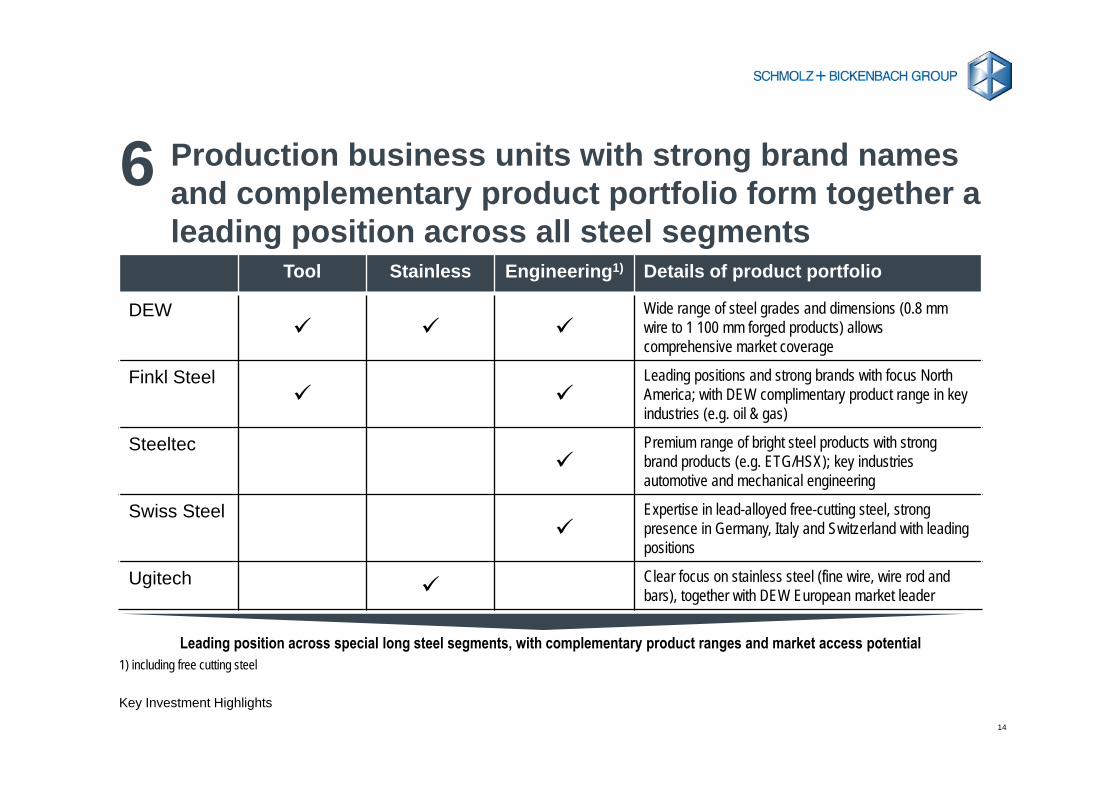
Production business units with strong brand names and complementary product portfolio form together a leading position across all steel segments
1) including free cutting steel
Tool Stainless Engineering1) Details of product portfolio
DEW
Wide range of steel grades and dimensions (0.8 mm wire to 1 100 mm forged products) allows comprehensive market coverage
Finkl Steel
Leading positions and strong brands with focus North America; with DEW complimentary product range in key industries (e.g. oil & gas)
Steeltec
Premium range of bright steel products with strong brand products (e.g. ETG/HSX); key industries automotive and mechanical engineering
Swiss Steel
Expertise in lead-alloyed free-cutting steel, strong presence in Germany, Italy and Switzerland with leading positions
Ugitech Clear focus on stainless steel (fine wire, wire rod and bars), together with DEW European market leader
Leading position across special long steel segments, with complementary product ranges and market access potential
6
15
Key Investment Highlights
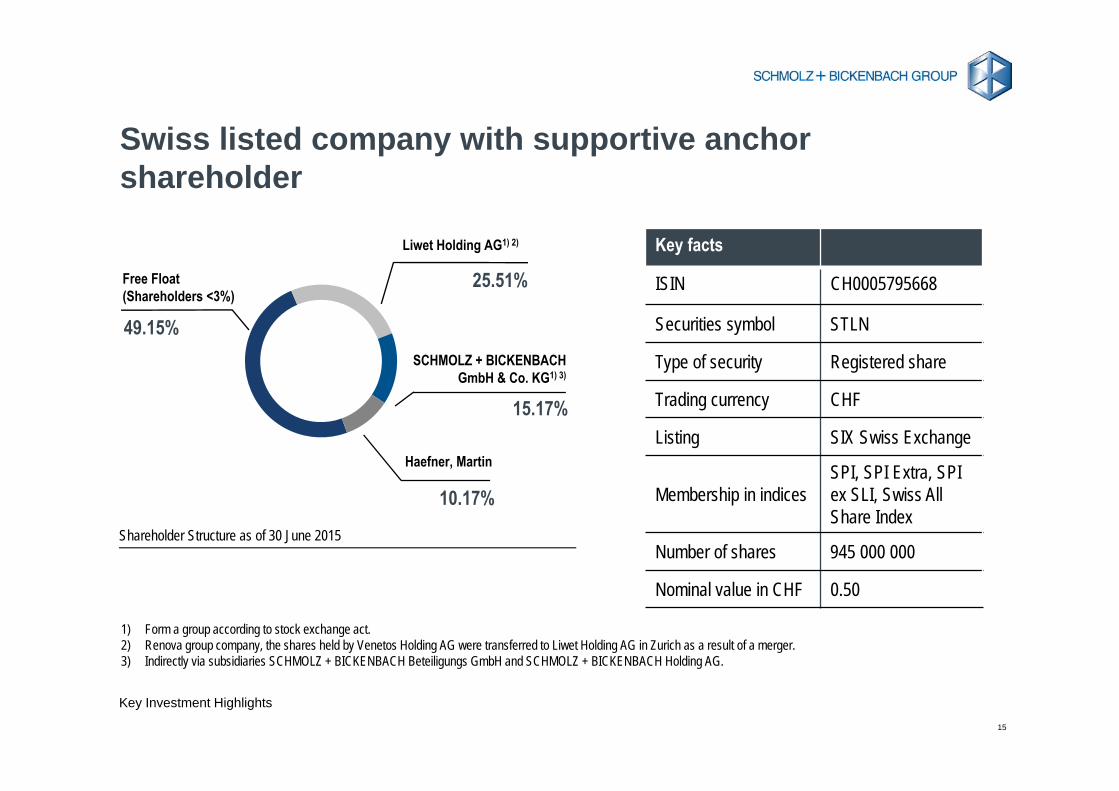
Swiss listed company with supportive anchor shareholder
Haefner, Martin
10.17%
Free Float(Shareholders <3%)
15.17%
49.15%SCHMOLZ + BICKENBACH
GmbH & Co. KG1) 3)
Liwet Holding AG1) 2)
25.51%
Key facts
ISIN CH0005795668
Securities symbol STLN
Type of security Registered share
Trading currency CHF
Listing SIX Swiss Exchange
Membership in indicesSPI, SPI Extra, SPI ex SLI, Swiss All Share Index
Number of shares 945 000 000
Nominal value in CHF 0.50
1) Form a group according to stock exchange act.2) Renova group company, the shares held by Venetos Holding AG were transferred to Liwet Holding AG in Zurich as a result of a merger.3) Indirectly via subsidiaries SCHMOLZ + BICKENBACH Beteiligungs GmbH and SCHMOLZ + BICKENBACH Holding AG.
Shareholder Structure as of 30 June 2015
16
STRATEGIC REALIGNMENT AND MID-TERM TARGETS2
17
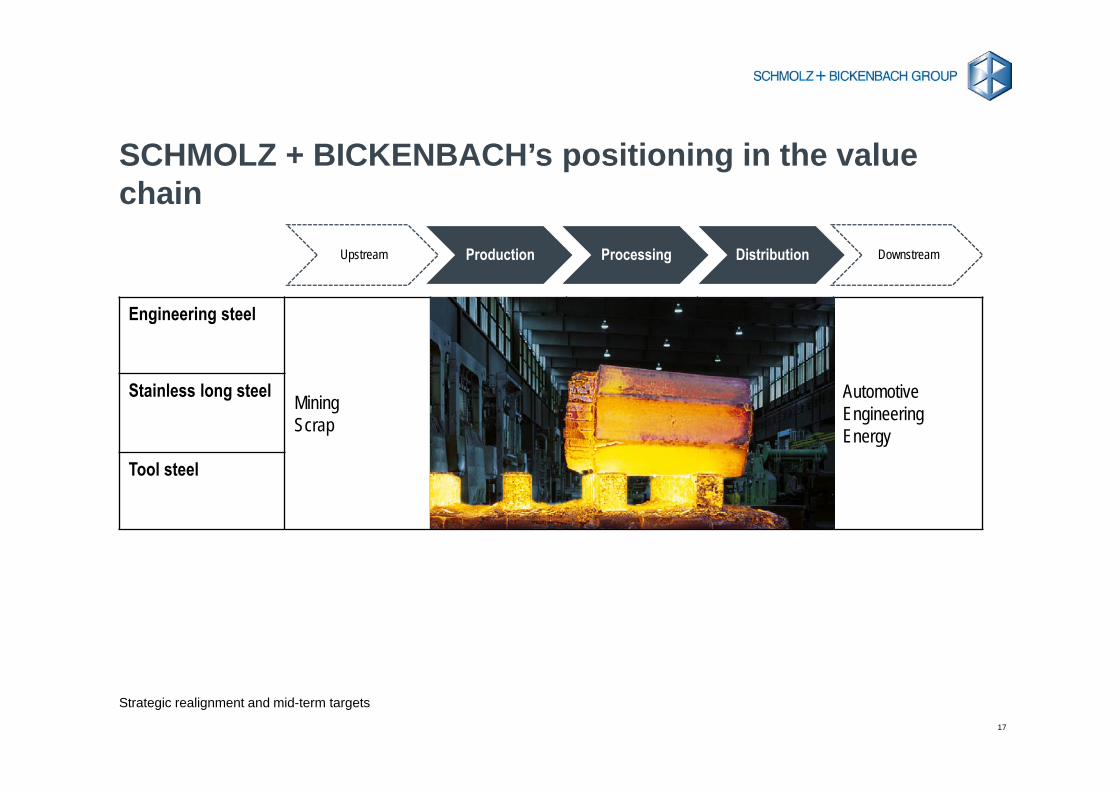
Upstream Production Processing Distribution Downstream
SCHMOLZ + BICKENBACH’s positioning in the value chain
Engineering steel
Mining Scrap
AutomotiveEngineeringEnergy
Stainless long steel
Tool steel
Strategic realignment and mid-term targets
18
Strategic realignment and mid-term targets
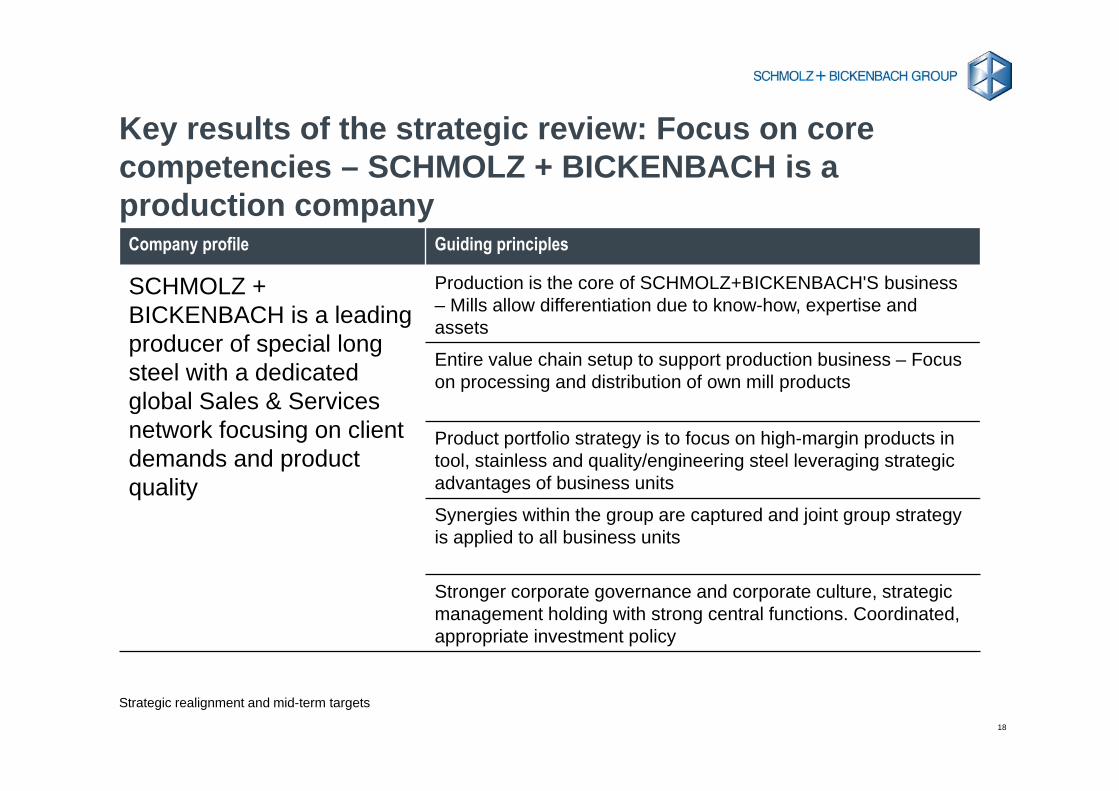
Key results of the strategic review: Focus on core competencies – SCHMOLZ + BICKENBACH is a production company
Company profile Guiding principles
SCHMOLZ + BICKENBACH is a leading producer of special long steel with a dedicated global Sales & Services network focusing on client demands and product quality
Production is the core of SCHMOLZ+BICKENBACH'S business – Mills allow differentiation due to know-how, expertise and assets
Entire value chain setup to support production business – Focus on processing and distribution of own mill products
Product portfolio strategy is to focus on high-margin products in tool, stainless and quality/engineering steel leveraging strategic advantages of business units
Synergies within the group are captured and joint group strategy is applied to all business units
Stronger corporate governance and corporate culture, strategic management holding with strong central functions. Coordinated, appropriate investment policy
19
Strategic realignment and mid-term targets
» Closing on 22 July 2015
» The transaction obtained full clearance (without conditions) of the European anti-trust authorities
» In 2014, the divested activities achieved revenues of ca. EUR 600 million, EBITDA of ca. EUR 7 million, and employed around 1 000 professionals
» The agreed enterprise value for the steel distribution units was EUR 88.6 million. The preliminary purchase price (equity value) amounts to EUR 56.6 million (max. amount) and will be finally known after discussion between the two parties
» On 22 July 2015, JACQUET METAL SERVICE paid an amount of EUR 48.6 million
» The closing implies that from now on SCHMOLZ + BICKENBACH and the specific distribution units are operationally and legally independent although they are allowed to use the trademark SCHMOLZ + BICKENBACH for a limited time period
Sale of specific distribution units
20
FINANCIAL OVERVIEW3
21
Financial Overview
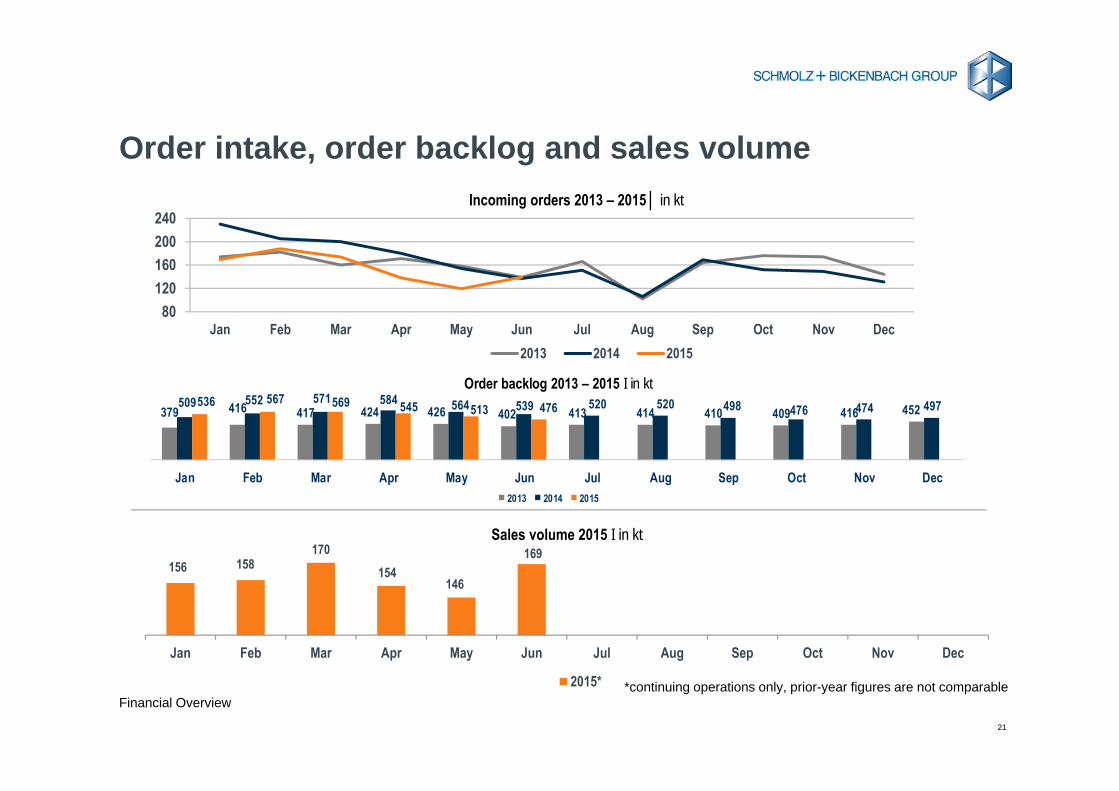
Order intake, order backlog and sales volume
379 416 417 424 426 402 413 414 410 409 416 452509 552 571 584 564 539 520 520 498 476 474 497536 567 569 545 513 476
Jan Feb Mar Apr May Jun Jul Aug Sep Oct Nov Dec
Order backlog 2013 – 2015 I in kt
2013 2014 2015
156 158170
154146
169
Jan Feb Mar Apr May Jun Jul Aug Sep Oct Nov Dec
Sales volume 2015 I in kt
2015*
80120160200240
Jan Feb Mar Apr May Jun Jul Aug Sep Oct Nov Dec
Incoming orders 2013 – 2015│ in kt
2013 2014 2015
*continuing operations only, prior-year figures are not comparable
22
Financial Overview
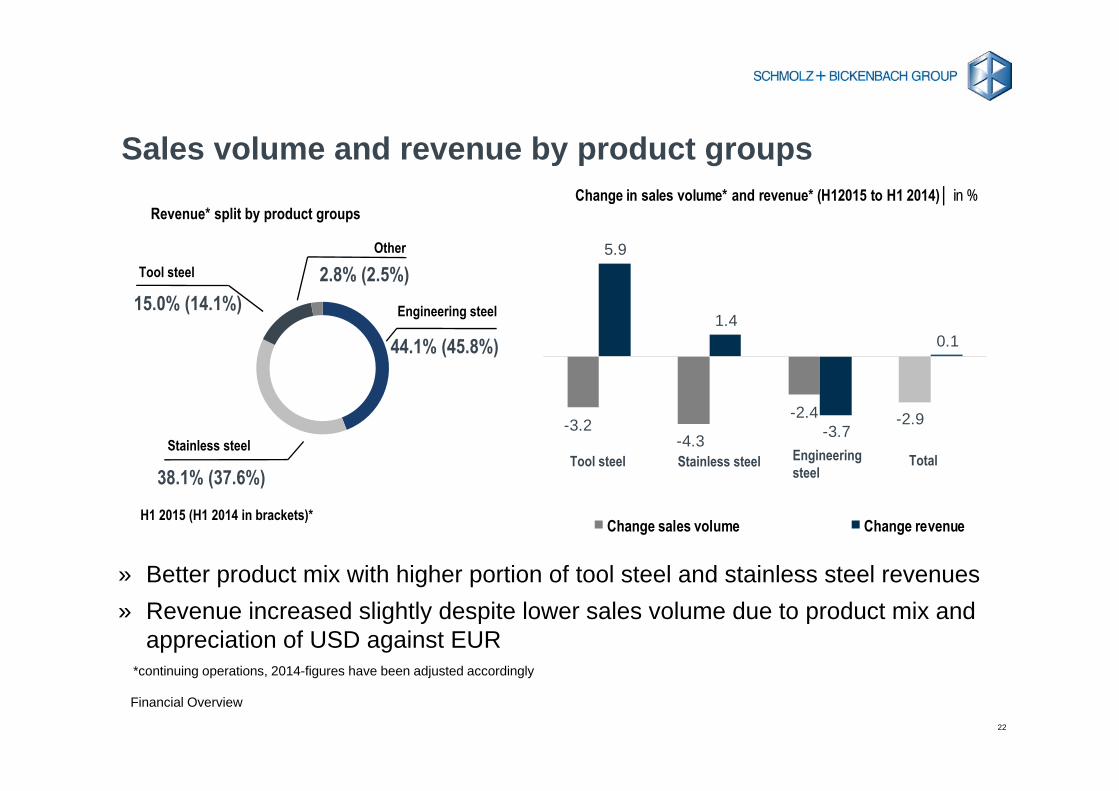
Sales volume and revenue by product groups
Tool steel Stainless steel Engineering steel
Total
» Better product mix with higher portion of tool steel and stainless steel revenues» Revenue increased slightly despite lower sales volume due to product mix and
appreciation of USD against EUR
Revenue* split by product groups
38.1% (37.6%)
Engineering steel
44.1% (45.8%)
Stainless steel
Tool steel
15.0% (14.1%)
Other
2.8% (2.5%)
H1 2015 (H1 2014 in brackets)*
*continuing operations, 2014-figures have been adjusted accordingly
-3.2-4.3
-2.4 -2.9
5.9
1.4
-3.7
0.1
Change in sales volume* and revenue* (H12015 to H1 2014)│ in %
Change sales volume Change revenue
23
Financial Overview
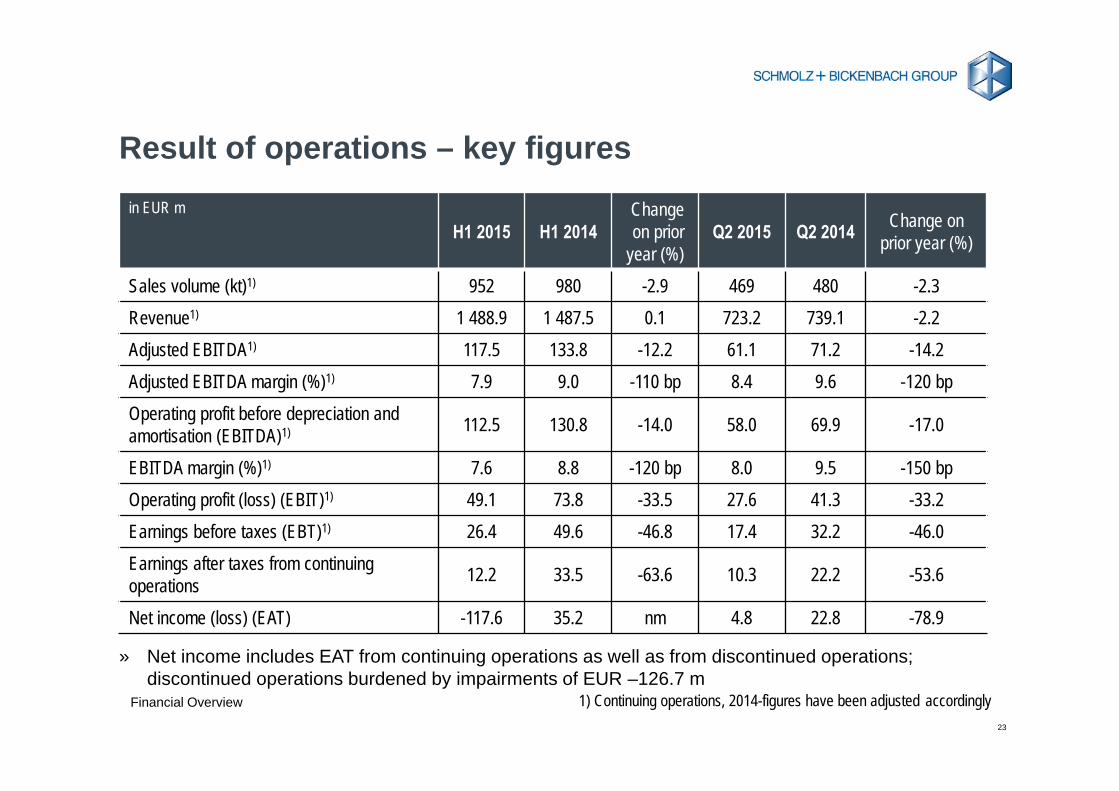
Result of operations – key figuresin EUR m
H1 2015 H1 2014Change on prior
year (%)Q2 2015 Q2 2014 Change on
prior year (%)
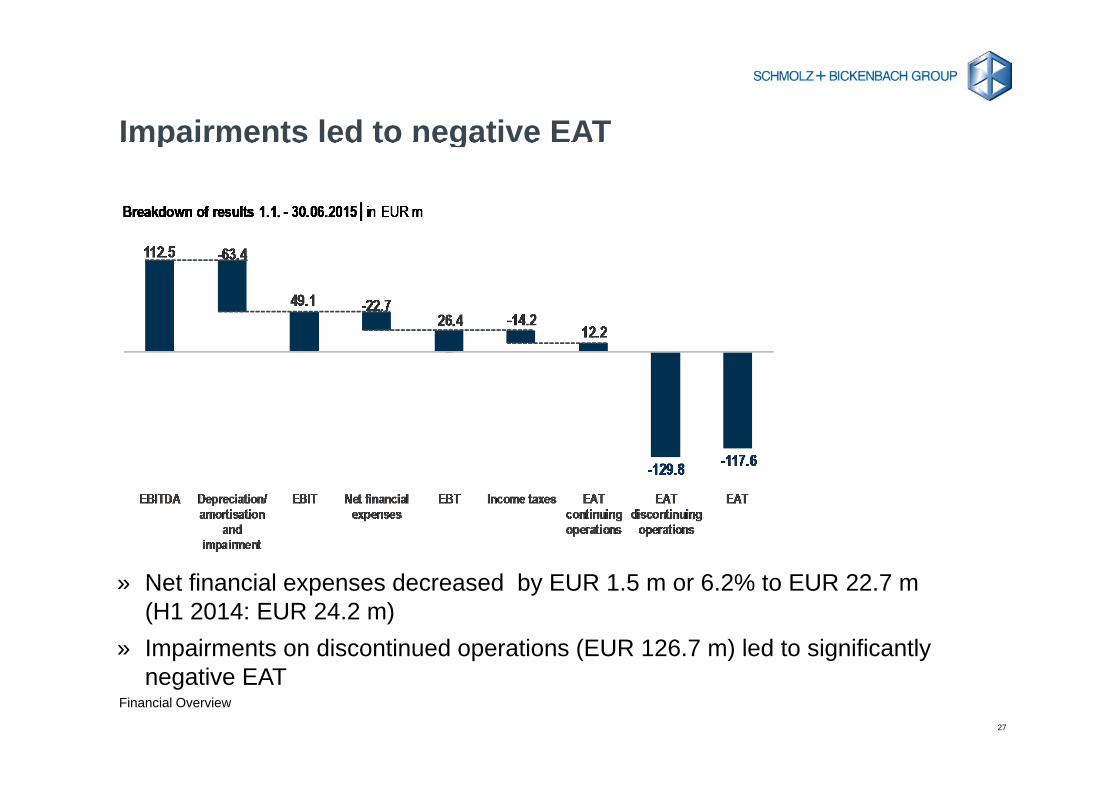
Sales volume (kt)1) 952 980 -2.9 469 480 -2.3Revenue1) 1 488.9 1 487.5 0.1 723.2 739.1 -2.2Adjusted EBITDA1) 117.5 133.8 -12.2 61.1 71.2 -14.2Adjusted EBITDA margin (%)1) 7.9 9.0 -110 bp 8.4 9.6 -120 bpOperating profit before depreciation and amortisation (EBITDA)1) 112.5 130.8 -14.0 58.0 69.9 -17.0
EBITDA margin (%)1) 7.6 8.8 -120 bp 8.0 9.5 -150 bpOperating profit (loss) (EBIT)1) 49.1 73.8 -33.5 27.6 41.3 -33.2Earnings before taxes (EBT)1) 26.4 49.6 -46.8 17.4 32.2 -46.0Earnings after taxes from continuing operations 12.2 33.5 -63.6 10.3 22.2 -53.6
Net income (loss) (EAT) -117.6 35.2 nm 4.8 22.8 -78.9
» Net income includes EAT from continuing operations as well as from discontinued operations; discontinued operations burdened by impairments of EUR –126.7 m
1) Continuing operations, 2014-figures have been adjusted accordingly
24
Financial Overview
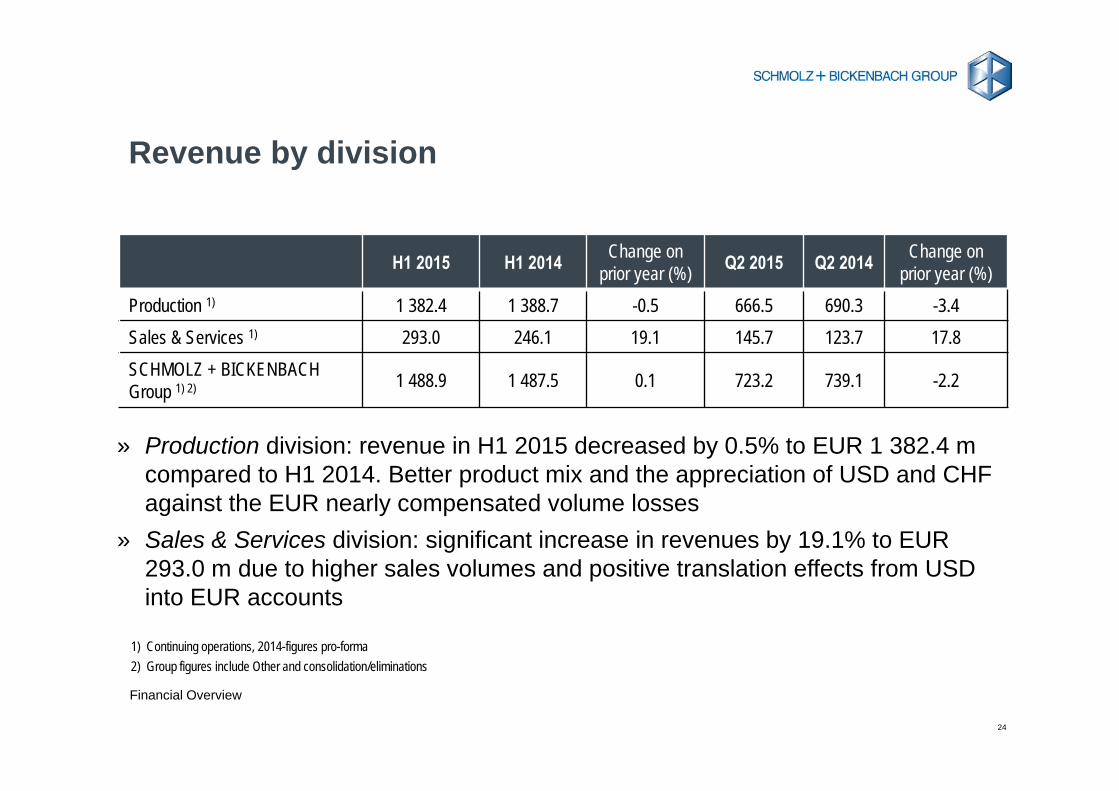
Revenue by division
» Production division: revenue in H1 2015 decreased by 0.5% to EUR 1 382.4 m compared to H1 2014. Better product mix and the appreciation of USD and CHF against the EUR nearly compensated volume losses
» Sales & Services division: significant increase in revenues by 19.1% to EUR 293.0 m due to higher sales volumes and positive translation effects from USD into EUR accounts
H1 2015 H1 2014 Change on prior year (%) Q2 2015 Q2 2014 Change on
prior year (%)Production 1) 1 382.4 1 388.7 -0.5 666.5 690.3 -3.4Sales & Services 1) 293.0 246.1 19.1 145.7 123.7 17.8SCHMOLZ + BICKENBACH Group 1) 2) 1 488.9 1 487.5 0.1 723.2 739.1 -2.2
1) Continuing operations, 2014-figures pro-forma2) Group figures include Other and consolidation/eliminations
25
Financial Overview
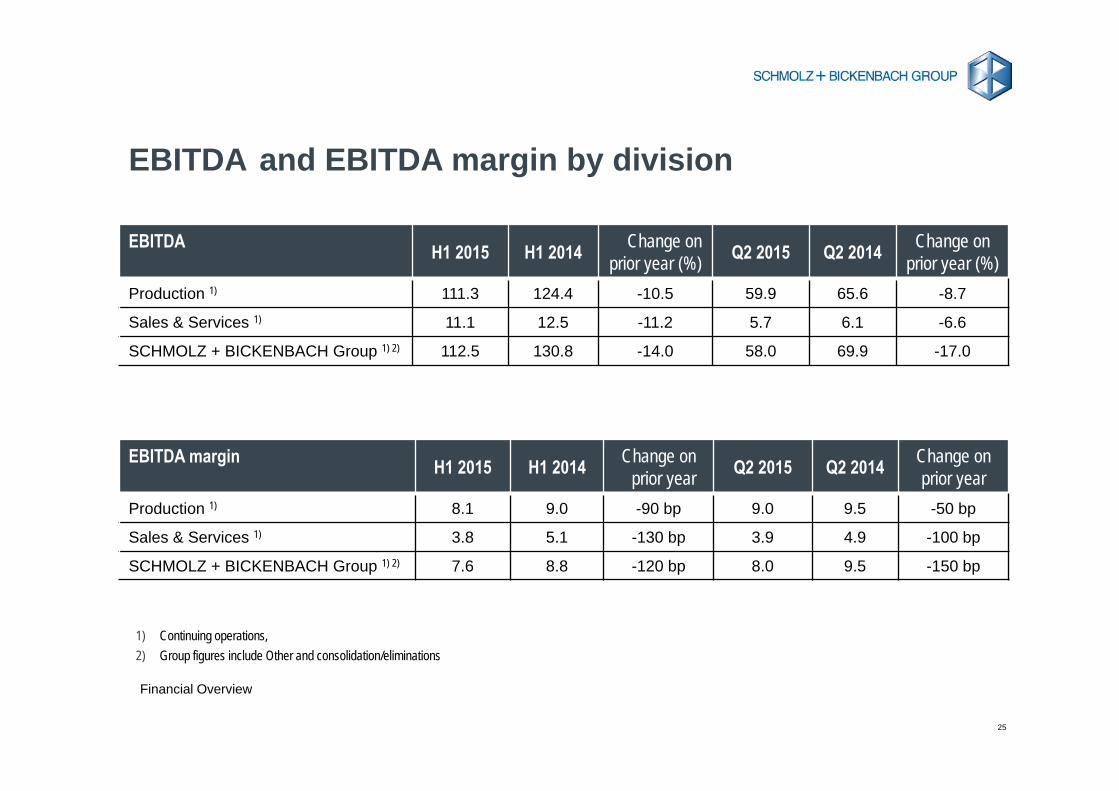
EBITDA and EBITDA margin by division
1) Continuing operations,2) Group figures include Other and consolidation/eliminations
EBITDA H1 2015 H1 2014 Change on prior year (%) Q2 2015 Q2 2014 Change on
prior year (%)Production 1) 111.3 124.4 -10.5 59.9 65.6 -8.7
Sales & Services 1) 11.1 12.5 -11.2 5.7 6.1 -6.6
SCHMOLZ + BICKENBACH Group 1) 2) 112.5 130.8 -14.0 58.0 69.9 -17.0
EBITDA margin H1 2015 H1 2014 Change on prior year Q2 2015 Q2 2014 Change on
prior year Production 1) 8.1 9.0 -90 bp 9.0 9.5 -50 bp
Sales & Services 1) 3.8 5.1 -130 bp 3.9 4.9 -100 bp
SCHMOLZ + BICKENBACH Group 1) 2) 7.6 8.8 -120 bp 8.0 9.5 -150 bp
26
Financial Overview
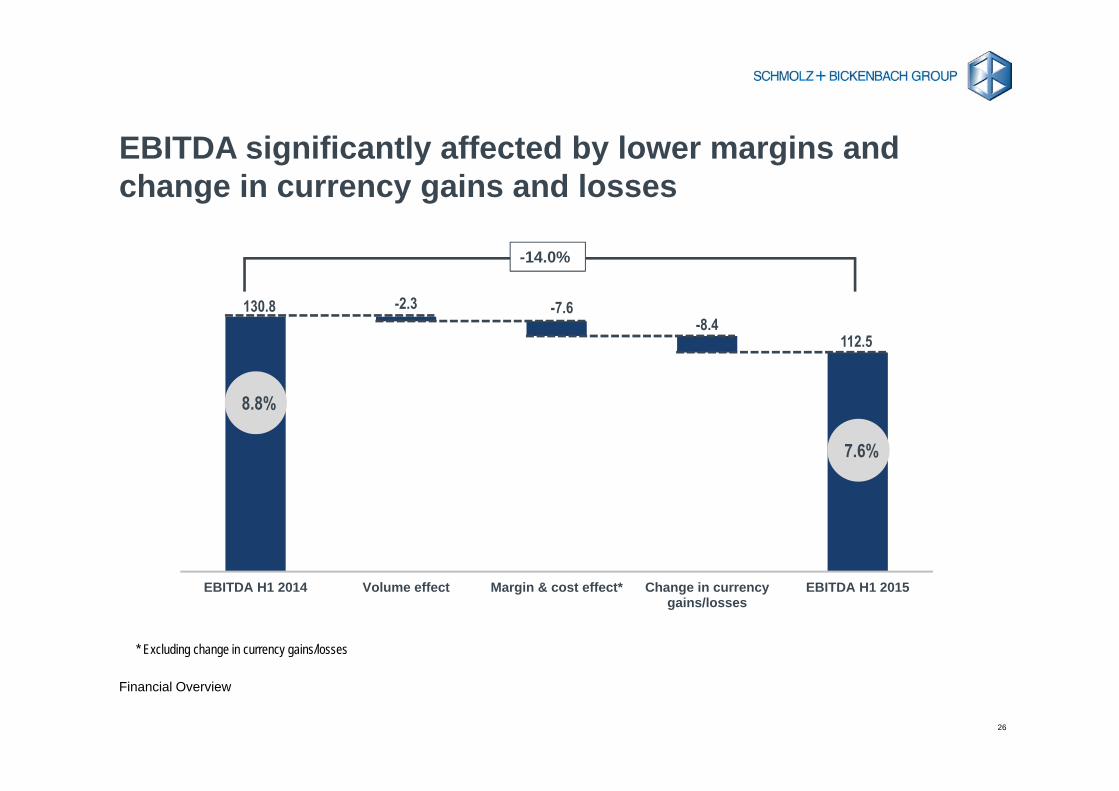
EBITDA significantly affected by lower margins and change in currency gains and losses
130.8 -2.3 -7.6-8.4
112.5
020406080
100120140
EBITDA H1 2014 Volume effect Margin & cost effect* Change in currencygains/losses
EBITDA H1 2015
-14.0%
* Excluding change in currency gains/losses
8.8%
7.6%
27
Financial Overview
Impairments led to negative EAT
» Net financial expenses decreased by EUR 1.5 m or 6.2% to EUR 22.7 m (H1 2014: EUR 24.2 m)
» Impairments on discontinued operations (EUR 126.7 m) led to significantly negative EAT
28
Financial Overview
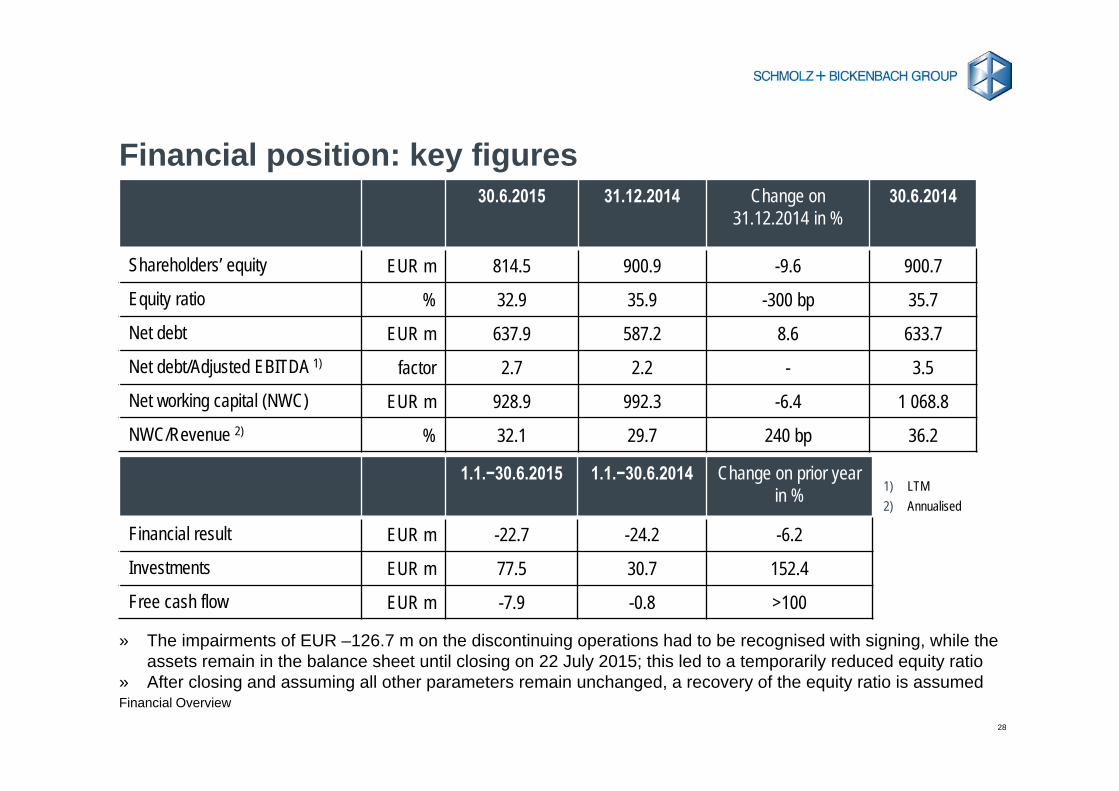
Financial position: key figures30.6.2015 31.12.2014 Change on
31.12.2014 in %30.6.2014
Shareholders’ equity EUR m 814.5 900.9 -9.6 900.7
Equity ratio % 32.9 35.9 -300 bp 35.7
Net debt EUR m 637.9 587.2 8.6 633.7
Net debt/Adjusted EBITDA 1) factor 2.7 2.2 - 3.5
Net working capital (NWC) EUR m 928.9 992.3 -6.4 1 068.8
NWC/Revenue 2) % 32.1 29.7 240 bp 36.2
1.1.−30.6.2015 1.1.−30.6.2014 Change on prior year in %
Financial result EUR m -22.7 -24.2 -6.2
Investments EUR m 77.5 30.7 152.4
Free cash flow EUR m -7.9 -0.8 >100
1) LTM2) Annualised
» The impairments of EUR –126.7 m on the discontinuing operations had to be recognised with signing, while the assets remain in the balance sheet until closing on 22 July 2015; this led to a temporarily reduced equity ratio
» After closing and assuming all other parameters remain unchanged, a recovery of the equity ratio is assumed
29
Financial Overview
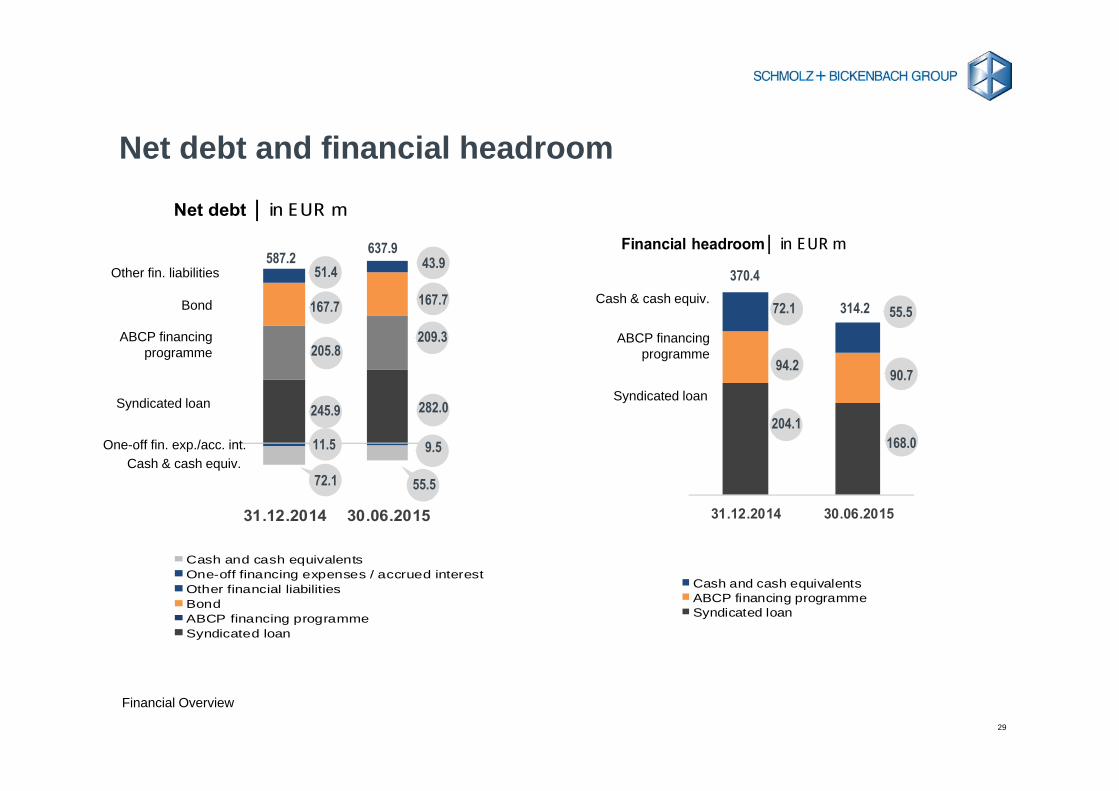
Net debt and financial headroom
31.12.2014 30.06.2015
Net debt │ in EUR m
Cash and cash equivalentsOne-off financing expenses / accrued interestOther financial liabilitiesBondABCP financing programmeSyndicated loan
587.2 637.9Other fin. liabilities
Bond
ABCP financing programme
Syndicated loan
Cash & cash equiv.
51.4
205.8
245.9
72.1
31.12.2014 30.06.2015
Financial headroom│ in EUR m
Cash and cash equivalentsABCP financing programmeSyndicated loan
370.4
314.2
Syndicated loan
ABCP financing programme
Cash & cash equiv. 72.1 55.5
94.2
204.1
90.7
168.0
43.9
167.7
209.3
282.0
One-off fin. exp./acc. int. 11.5 9.5
55.5
167.7
30
OUTLOOK AND GUIDANCE 20154
31
Outlook and Guidance 2015
Outlook 2015
» Global economic growth expectations* lowered to between 2.8% and 3.5% expected, USA 2.0% – 3.1%, but Eurozone only 1.4% – 1.5%
» World Steel Association significantly lowered expectations, general steel consumption expected to grow by only 0.5% (previously 2.0%), most important steel consumers with partially significantly lower growth rates than 2014 (Asia 0.6%, Europe 2.1%, NAFTA -0.9%)
» Economic environment for SCHMOLZ + BICKENBACH with mixed signals, steel demand in the relevant markets raises concerns
» Customer industries: global automotive industry expected to grow by ca. 2%, engineering lowered expectations to no-growth-scenario
» Oil price unlikely to reach previous levels, on average only USD 50 per barrel expected; constant decline in fracking business with significant impact on North American business units
» Experts do not expect the Swiss franc to weaken significantly against the Euro
* Source: IMF, OECD and World Bank
32
Outlook and Guidance 2015
Measures in response to current challenges
» Impacts from the Swiss franc appreciation: SCHMOLZ + BICKENBACH’s Swiss entities are currently implementing mitigation actions: adjustments in the personnel area, stretching/shifting of capex, negotiating purchasing conditions, enlargement of already existing cost measures, increase of cost awareness
» Impacts of declining fracking business due to low oil price: Finkl Steel is evaluating and implementing mitigation actions: lowering costs by further improving efficiency (sales network, warehouses, headcount, insourcing of maintenance), approaching new customer industries
» Improvement of net working capital management: concrete reduction measures identified by all business units; improvement target rolled-out to the business units to improve NWC by EUR 100 m* (based on 2014 figure) with target mid-2016; new KPI concept to be implemented in reporting tools; training of involved employees to start in September
* Assuming stable raw material prices and exchange rates
33
Outlook and Guidance 2015
Guidance 2015
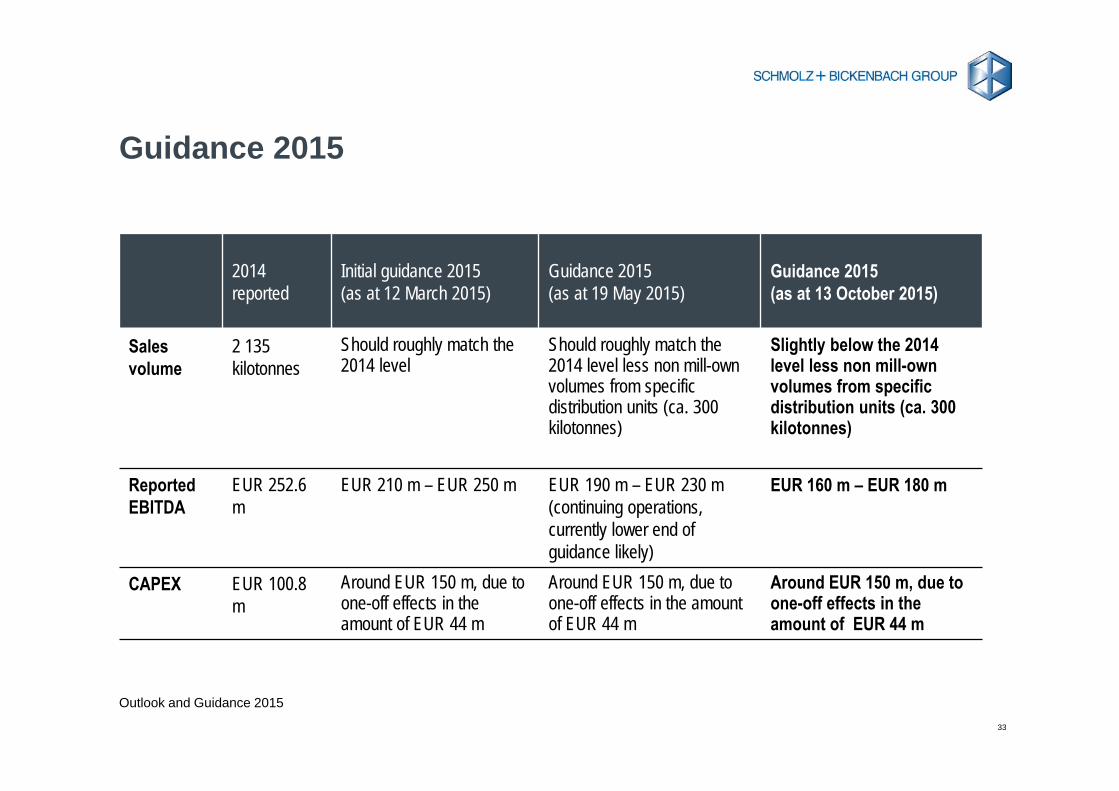
2014 reported
Initial guidance 2015 (as at 12 March 2015)
Guidance 2015(as at 19 May 2015)
Guidance 2015(as at 13 October 2015)
Sales volume
2 135 kilotonnes
Should roughly match the 2014 level
Should roughly match the 2014 level less non mill-own volumes from specific distribution units (ca. 300 kilotonnes)
Slightly below the 2014 level less non mill-own volumes from specific distribution units (ca. 300 kilotonnes)
Reported EBITDA
EUR 252.6 m
EUR 210 m – EUR 250 m EUR 190 m – EUR 230 m (continuing operations, currently lower end of guidance likely)
EUR 160 m – EUR 180 m
CAPEX EUR 100.8 m
Around EUR 150 m, due to one-off effects in the amount of EUR 44 m
Around EUR 150 m, due to one-off effects in the amount of EUR 44 m
Around EUR 150 m, due to one-off effects in the amount of EUR 44 m

34
KEY TAKE-AWAYS5
35
Key Take-aways
Key take-aways» Fundamentally attractive investment case despite
challenging market environment» Leading global provider of special long steel solutions
in an attractive niche market» Strong customer relationships, well diversified
customer base in various application industries and strong global footprint with presence in all relevant geographic markets
» Stable gross profit margin with the ability to pass on raw material price volatility to the customer
» State-of-the-art production facilities and equipment in capital-intensive industry
» Strong brand names with complementary product portfolio
» Implementation of strategic realignment to address strategic and operational weaknesses and reduce cost base well under way

36
APPENDIX6
37
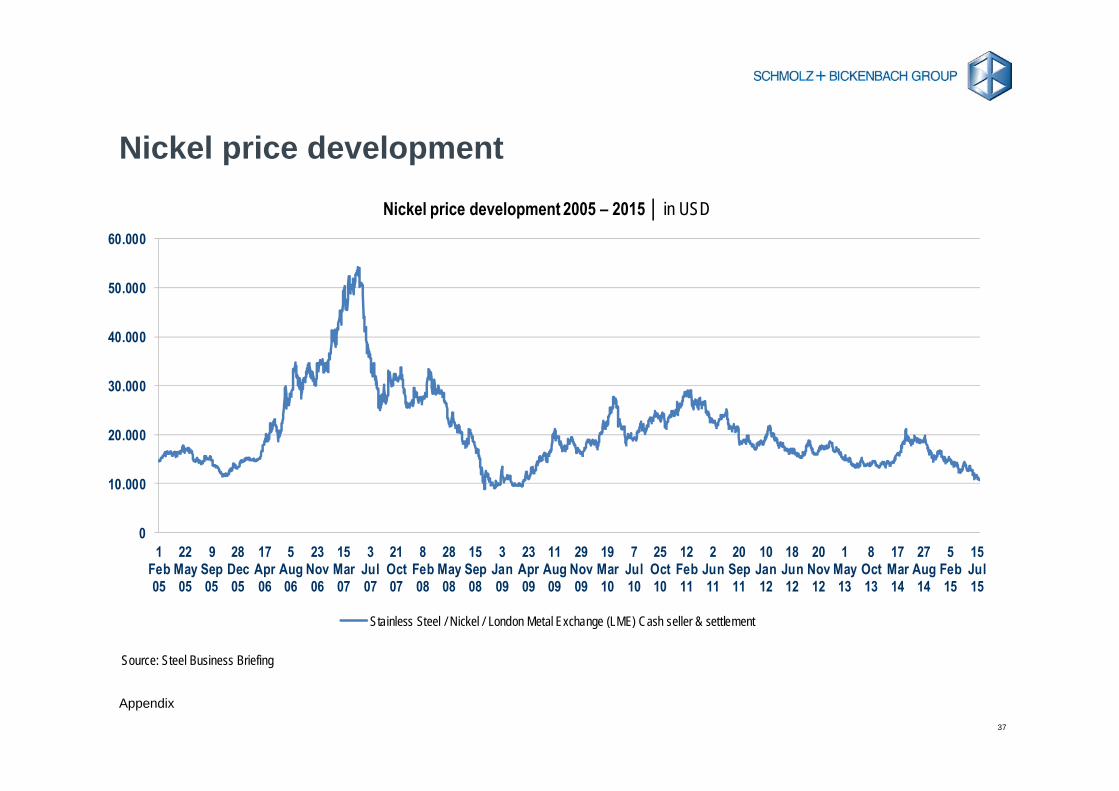
Appendix
Nickel price development
Source: Steel Business Briefing
0
10.000
20.000
30.000
40.000
50.000
60.000
1Feb05
22May05
9Sep05
28Dec05
17Apr06
5Aug06
23Nov06
15Mar07
3Jul07
21Oct07
8Feb08
28May08
15Sep08
3Jan09
23Apr09
11Aug09
29Nov09
19Mar10
7Jul10
25Oct10
12Feb11
2Jun11
20Sep11
10Jan12
18Jun12
20Nov12
1May13
8Oct13
17Mar14
27Aug14
5Feb15
15Jul15
Nickel price development 2005 – 2015 │ in USD
Stainless Steel / Nickel / London Metal Exchange (LME) Cash seller & settlement
38
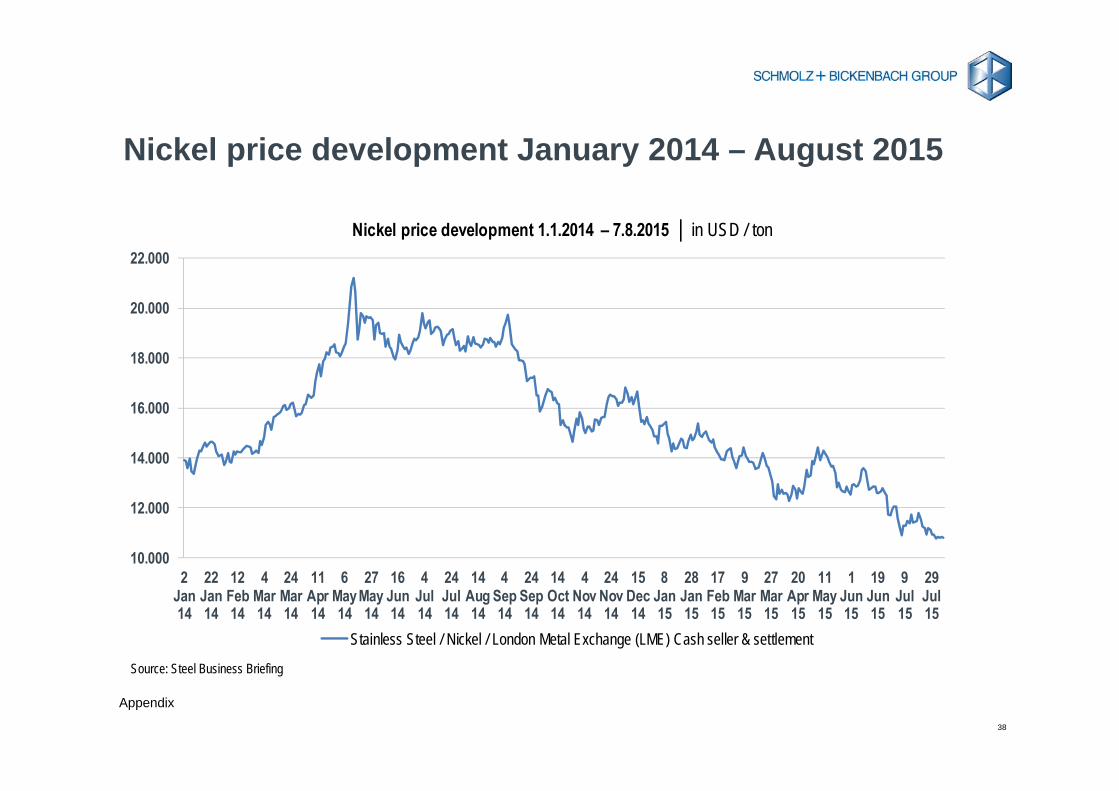
Appendix
Nickel price development January 2014 – August 2015
Source: Steel Business Briefing
10.000
12.000
14.000
16.000
18.000
20.000
22.000
2Jan14
22Jan14
12Feb14
4Mar14
24Mar14
11Apr14
6May14
27May14
16Jun14
4Jul14
24Jul14
14Aug14
4Sep14
24Sep14
14Oct14
4Nov14
24Nov14
15Dec14
8Jan15
28Jan15
17Feb15
9Mar15
27Mar15
20Apr15
11May15
1Jun15
19Jun15
9Jul15
29Jul15
Nickel price development 1.1.2014 – 7.8.2015 │ in USD / ton
Stainless Steel / Nickel / London Metal Exchange (LME) Cash seller & settlement
39
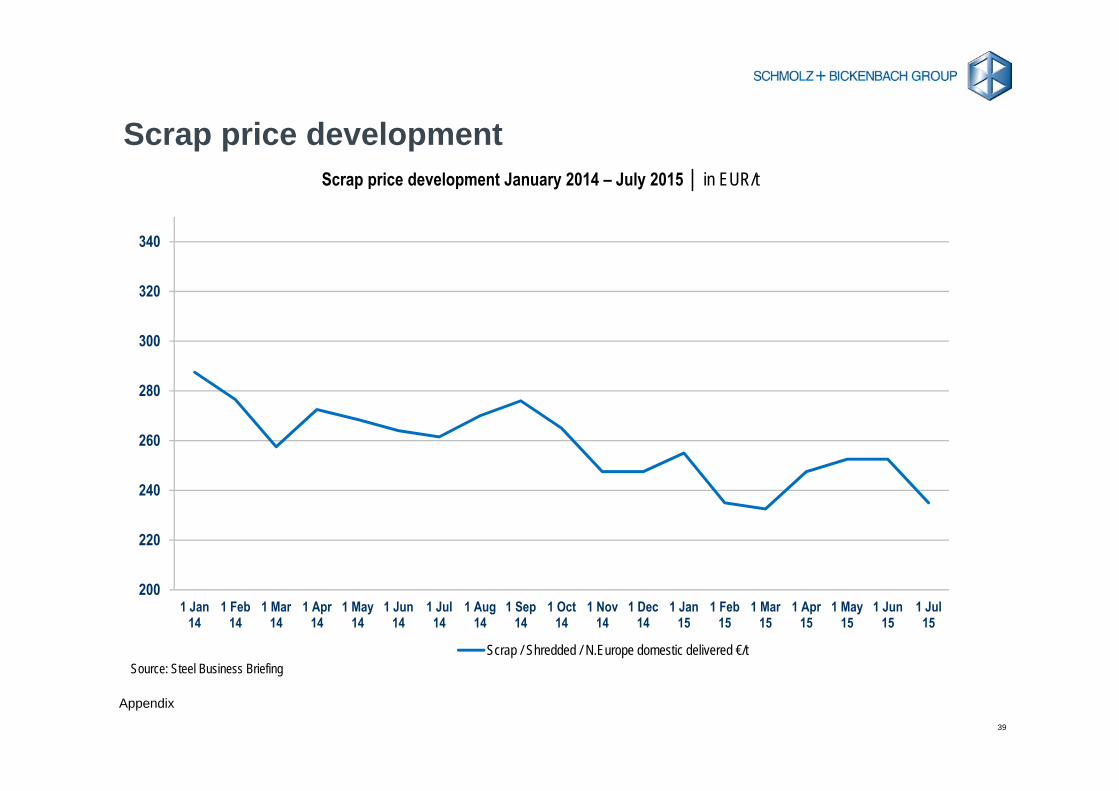
Appendix
Scrap price development
Source: Steel Business Briefing
200
220
240
260
280
300
320
340
1 Jan14
1 Feb14
1 Mar14
1 Apr14
1 May14
1 Jun14
1 Jul14
1 Aug14
1 Sep14
1 Oct14
1 Nov14
1 Dec14
1 Jan15
1 Feb15
1 Mar15
1 Apr15
1 May15
1 Jun15
1 Jul15
Scrap price development January 2014 – July 2015 │ in EUR/t
Scrap / Shredded / N.Europe domestic delivered €/t
40
Appendix
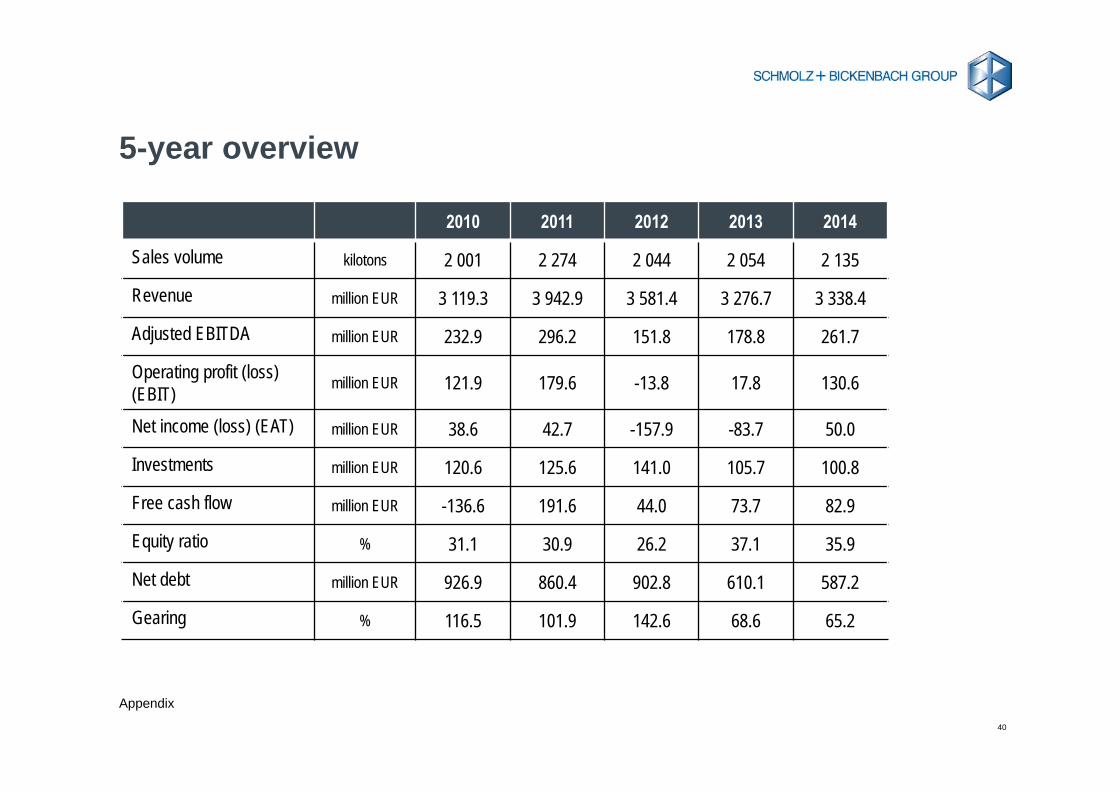
5-year overview
2010 2011 2012 2013 2014
Sales volume kilotons 2 001 2 274 2 044 2 054 2 135
Revenue million EUR 3 119.3 3 942.9 3 581.4 3 276.7 3 338.4
Adjusted EBITDA million EUR 232.9 296.2 151.8 178.8 261.7
Operating profit (loss) (EBIT) million EUR 121.9 179.6 -13.8 17.8 130.6
Net income (loss) (EAT) million EUR 38.6 42.7 -157.9 -83.7 50.0
Investments million EUR 120.6 125.6 141.0 105.7 100.8
Free cash flow million EUR -136.6 191.6 44.0 73.7 82.9
Equity ratio % 31.1 30.9 26.2 37.1 35.9
Net debt million EUR 926.9 860.4 902.8 610.1 587.2
Gearing % 116.5 101.9 142.6 68.6 65.2
41
Appendix
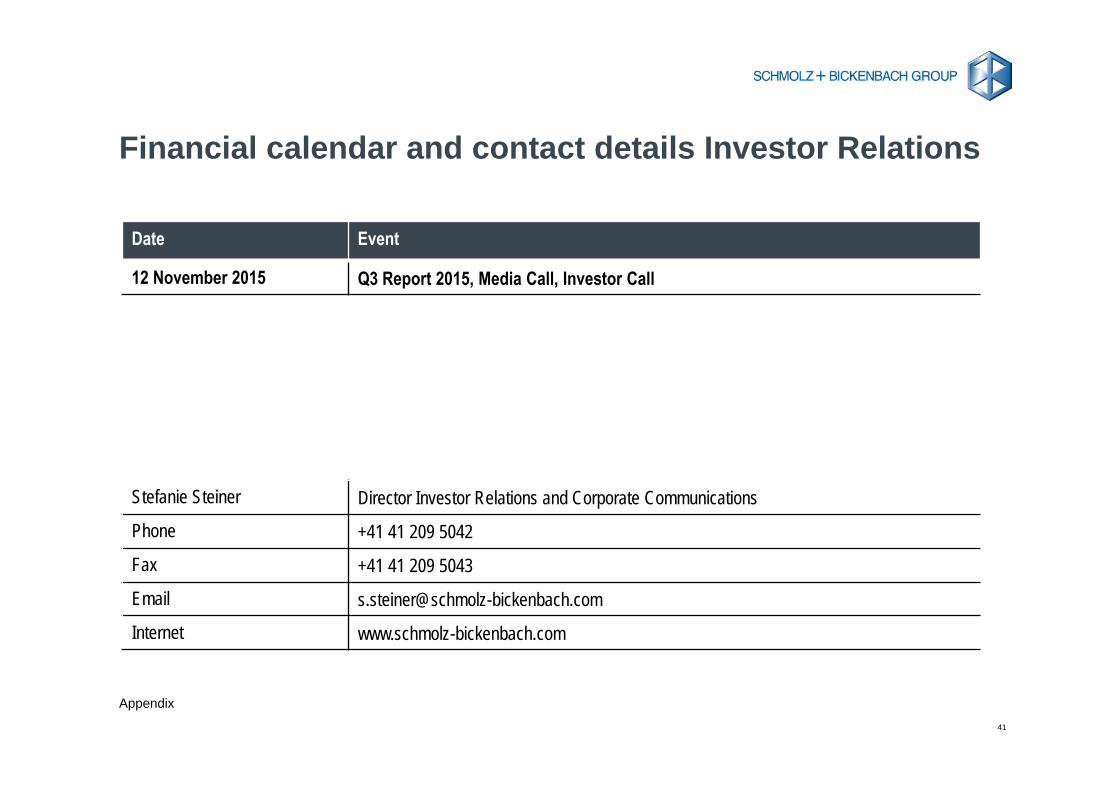
Financial calendar and contact details Investor Relations
Date Event
12 November 2015 Q3 Report 2015, Media Call, Investor Call
Stefanie Steiner Director Investor Relations and Corporate Communications
Phone +41 41 209 5042
Fax +41 41 209 5043
Email [email protected]
Internet www.schmolz-bickenbach.com
Thank you for your attention