Embed Size (px)
Citation preview

Bicycle and Pedestrian Annual Operations Budget Recommendations
BETHLEHEM, NEW YORK
Bicycle and Pedestrian Program


Table of Contents
Bicycle and Pedestrian Annual Operations Budget Recommendations ....................................................................1
Introduction ..............................................................................5
Bicycle and Pedestrian Infrastructure Inventory: Proposed and Existing Facilities ..............................................6
New Construction Costs and Lifespan Estimates ....................8
Operations and Maintenance Costs ........................................8
Funding ...................................................................................10


BETHLEHEM, NEW YORK
Bicycle and Pedestrian Program
IntroductionThis report provides recommendations for a budget to drive bicycle
and pedestrian programs based on research from communities
around the country. In order to estimate a budget for Bethlehem,
this work will present cost estimates for maintenance and new
construction in terms of cost per mile or linear foot. These
recommendations aim to be useful for the Town’s present and
future bicycle and pedestrian planning and development efforts.

6BETHLEHEM, NEW YORKBicycle and Pedestrian Program
Bicycle and Pedestrian Infrastructure Inventory: Proposed and Existing Facilities
An effective bicycle and pedestrian (bike/ped) budget should be formulated based on a bike/ped infrastructure inventory that identifies existing conditions and proposed expansions of bicycle lanes, routes, multi-use trails and sidewalks. The table below describes Bethlehem’s current and proposed bicycle and pedestrian infrastructure as of 2012. The Bicycle and Pedes-trian Priority Network Map could be used to complete the 2030 (or other long-term goal year) Goal column.
Table 1: Bethlehem Bicycle and Pedestrian Facilities
TYPE EXISTING (MILES) PROPOSED AS OF JAN. 2012 2030 GOAL
Bike Lane 0 0
Bike Route 5 8
Multi-Use Trail 6 3
Sidewalk 40 5.5
The eight miles of proposed bicycle routes are represented by the Delmar Bicycle Route to be installed by May of 2012, and the Glenmont Bicycle Route, which is currently not planned for installation but has been designed by VHB, Inc. The three miles of multi-use trail are repre-sented by the County’s conversion of the rail right-of-way in Bethlehem to a rail trail (funding is unavailable at this time). The five and a half miles of sidewalk are represented by the following proposed projects identified by the PaTHs 4 Bethlehem Committee:
Bike Route A roadway that has been designated with directional and informational route markers. These routes should provide for continuous routing between logical termini.
Bike Lane A portion of the roadway, typically 5 feet wide, designated by striping, pavement markings and signing for the preferential use of bicyclists.
Multi–Use Trail Typically 10 -12 feet wide, these trails are separate from roadways and may be used by both bicyclists and pedestrians.
Sidewalk Typically 5 feet wide with a concrete surface.

7BETHLEHEM, NEW YORKBicycle and Pedestrian Program
Table 2: Bethlehem Proposed Sidewalk Projects
ROAD NAME FROM TO
Adams Street Kenwood Avenue Hudson Avenue
Feura Bush Road Bayberry Road Route 9W
Delmar Place Kenwood Avenue Fernbank Avenue
Murray Avenue Delmar Bypass (NYS Rt 32) Feura Bush Road
Brockley Drive/Orchard Street Delaware Avenue Crestwood Lane
Route 9W Bethlehem Town Center II Town Squire
Blessing Road/Krumkill Road NYS Rt 85 Russell Road
Kenwood Avenue Pine Tree Drive Delmar Bypass (NYS Rt 32)
Examples of more detailed infrastructure inventories are provided from the City of College Station, TX and the City of Folsom, CA. An infrastructure inventory with the level of detail shown by these examples would enable Bethlehem to assess the cost of maintaining the existing bike/ped infrastructure as well as the cost of expanding the network.
Bicycle and Pedestrian Infrastructure
Inventory Example: City of College
Station Facility Miles chart from the
Bicycle, Pedestrian, and Greenways
Master Plan
Bicycle and Pedestrian Infrastructure
Inventory Example: City of Folsom
Parks & Recreation Department, Urban
Bike Trail Maintenance, How Much
Will That Trail Cost? Trails and
Greenways Conference, May 11, 2007

8BETHLEHEM, NEW YORKBicycle and Pedestrian Program
New Construction Costs and Lifespan Estimates
The Town of Bethlehem must be knowledgeable of the cost and lifespan of its bicycle and pedestrian infrastructure in order to create a detailed bike/ped inventory. While costs can vary significantly, VHB has put together estimates based on research of other municipal bike/ped budgets as well as our own experience constructing such facilities. Generally speaking, for bicycle lanes, routes and other on-road facilities, maintenance would be the same as for the roadway with the addition of replacing the markings on the same schedule as the replacement of the roadway markings/striping (approximately every two to three years depending on wear from traffic volume). For bicycle routes and lane signs, maintenance would be the same as the replacement of other traffic sings (stop signs, speed signs, etcetera). Appendix I lists many of the elements of bike/ped facilities ranging from pavement materials, to fencing, to benches with the associated cost and lifespan estimates.
Operations and Maintenance Costs
In addition to construction costs, there are significant maintenance and program costs associated with a strong municipal bike/ped initiative. Maintenance activities include:
■■ Maintaining pavement quality through spot repairs, regular overlays and longer-term repaving
■■ Maintaining trail up to ADA standards
■■ Sweeping and removal of litter on a regular basis (daily or weekly)
■■ Vegetation trimming to provide clear access (Spring/Fall)
■■ Restriping paths as needed (usually annually)
■■ Landscaping maintenance (weekly/monthly), including irrigation costs
■■ Lighting feature maintenance, including electricity costs
■■ Repair of damage due to storms, floods, collisions and other unforeseen events
■■ Repair and replacement of way finding or other signage
■■ Sidewalk replacement
Multi-use path maintenance costs can range anywhere from $1,000 to $14,000 per mile, depending on landscaping, snow removal and materials. For example, Tahoe City Public Utilities District spends $11,000 per mile each year to maintain, repair, restripe and plow (once in the spring) their multi-use paths. This amounts to an annual expenditure of $5,000 to $6,000 for snow removal and $25,000 to $30,000 for repairing cracks on the entire path system. The City of South Lake Tahoe on the other hand, spends $1,050 per mile per year for basic maintenance of their multi-use paths.1
Certain strategies can reduce maintenance costs. For example, utilizing native plants for landscaping will reduce maintenance needs and the need for irrigation. Also, minimizing the planting of grassy lawns will reduce the need for regularly scheduled mowing. Lighting fixtures should use cost-effective LED bulbs and solar power as suitable to reduce mainte-nance and electricity costs. Bethlehem should consider solar-powered outdoor lighting to reduce electricity costs. Lastly, solar-compactor trash bins reduce the frequency of trash collection and help keep paths free of litter.
1 2010 Lake Tahoe Region Bicycle and Pedestrian Plan, Maintenance Memo. http://www.tahoempo.org/documents/bpp/Appendices_Web_Only_100609/Appendix%20H%20Maintenance%20Memo.pdf

9BETHLEHEM, NEW YORKBicycle and Pedestrian Program
A successful new bike/ped program must also have an education and outreach component. The City of Long Beach, CA, which has recently tagged itself as the most bicycle friendly urban city in the nation, has budgeted approximately $265,000 for bicycle education and promotion. This includes $120,000 for staff, $2,500 for bicycle fairs or events, another $2,500 for bike to work promotion, and $125,000 for general education. A more modest budget of $20,000 for such programs is presented by San Luis Obispo County with $15,000 going towards promotional and educational activities and $5,000 to the administration of the program. San Luis Obispo County’s Costs and Funding Chapter of their Bikeways Plan is located in Appendix IV. Furthermore, Appendix II–IV provide other national examples of bike/ped municipal budgets.
College Station Bike/Ped Construction & Maintenance Costs
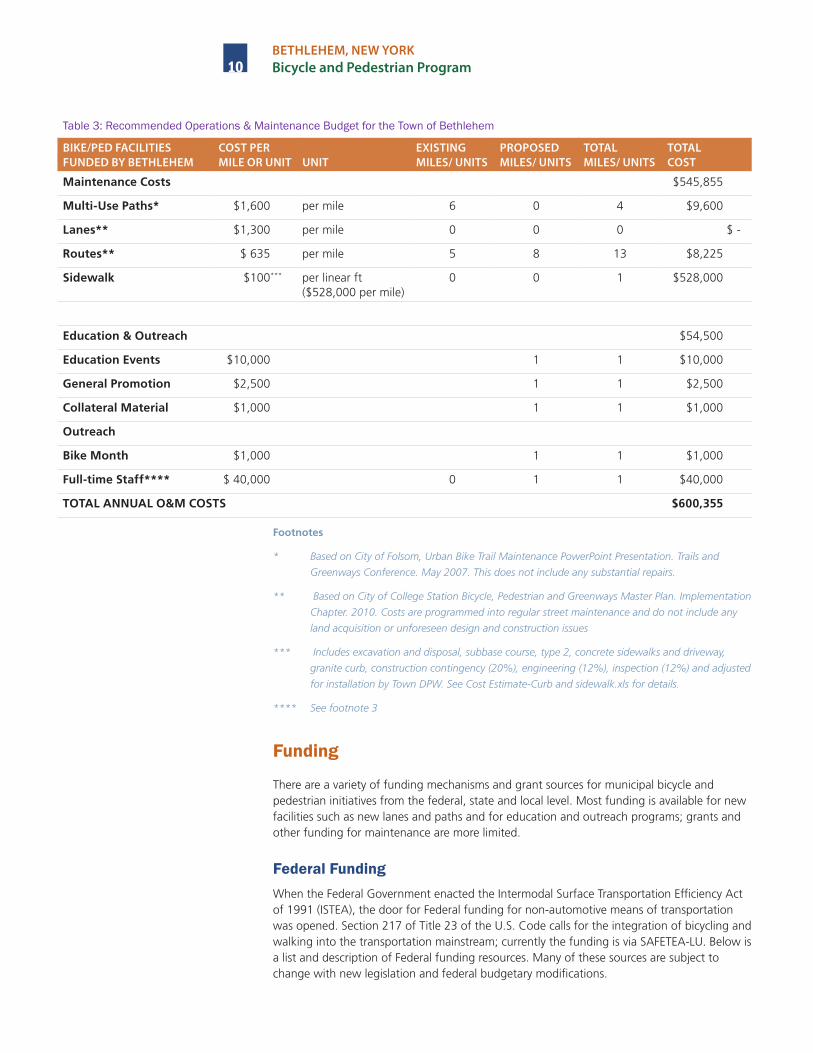
Based on Bethlehem’s infrastructure inventory, and the need for a strong education and promotion program, the Town should have an operations and maintenance budget of at least $600,3552. Of this budget, $54,500 is for education and outreach, including $40,0003 for a full-time bike/ped coordinator. The remaining $545,855 is for maintenance of all sidewalks (replacement of one mile per year), and bicycle paths, lanes and routes. Table 2 outlines this budget, which was calculated based on research from other municipal bike/ped programs. These costs are considered “planning-level” estimates and should only be used as a prelim-inary guide. A Microsoft Excel copy of the spreadsheet has been delivered to the Town as a tool that can continue to be used to calculate a maintenance budget.
2 This does not include the cost of new construction.
3 $40,000 would be for a full time position without benefits. This figure is reflective of the average amount of time allocated by current Town Staff (Planning, DPW and Parks and Recreation) over the past three years. If reduced to a part time position the amount should be $20,000.
10BETHLEHEM, NEW YORKBicycle and Pedestrian Program
Table 3: Recommended Operations & Maintenance Budget for the Town of Bethlehem
BIKE/PED FACILITIES FUNDED BY BETHLEHEM
COST PER MILE OR UNIT UNIT
EXISTING MILES/ UNITS
PROPOSED MILES/ UNITS
TOTAL MILES/ UNITS
TOTAL COST
Maintenance Costs $545,855
Multi-Use Paths* $1,600 per mile 6 0 4 $9,600
Lanes** $1,300 per mile 0 0 0 $ -
Routes** $ 635 per mile 5 8 13 $8,225
Sidewalk $100*** per linear ft ($528,000 per mile)
0 0 1 $528,000
Education & Outreach $54,500
Education Events $10,000 1 1 $10,000
General Promotion $2,500 1 1 $2,500
Collateral Material $1,000 1 1 $1,000
Outreach
Bike Month $1,000 1 1 $1,000
Full-time Staff**** $ 40,000 0 1 1 $40,000
TOTAL ANNUAL O&M COSTS $600,355
Footnotes
* Based on City of Folsom, Urban Bike Trail Maintenance PowerPoint Presentation. Trails and
Greenways Conference. May 2007. This does not include any substantial repairs.
** Based on City of College Station Bicycle, Pedestrian and Greenways Master Plan. Implementation
Chapter. 2010. Costs are programmed into regular street maintenance and do not include any
land acquisition or unforeseen design and construction issues
*** Includes excavation and disposal, subbase course, type 2, concrete sidewalks and driveway,
granite curb, construction contingency (20%), engineering (12%), inspection (12%) and adjusted
for installation by Town DPW. See Cost Estimate-Curb and sidewalk.xls for details.
**** See footnote 3
Funding
There are a variety of funding mechanisms and grant sources for municipal bicycle and pedestrian initiatives from the federal, state and local level. Most funding is available for new facilities such as new lanes and paths and for education and outreach programs; grants and other funding for maintenance are more limited.
Federal FundingWhen the Federal Government enacted the Intermodal Surface Transportation Efficiency Act of 1991 (ISTEA), the door for Federal funding for non-automotive means of transportation was opened. Section 217 of Title 23 of the U.S. Code calls for the integration of bicycling and walking into the transportation mainstream; currently the funding is via SAFETEA-LU. Below is a list and description of Federal funding resources. Many of these sources are subject to change with new legislation and federal budgetary modifications.
11BETHLEHEM, NEW YORKBicycle and Pedestrian Program
Congestion Mitigation and Air Quality Program (CMAQ)
CMAQ funds may be used for the construction of pedestrian walkways and bicycle transportation facilities and for carrying out non-construction projects related to safe bicycle use. Applications are due December 1st each year. Funds are available for a 20 percent non-federal match.
Surface Transportation Program (STP)
STP funds may be used for either the construction of bicycle transportation facilities and pedestrian walkways, or non-construction projects (such as maps, brochures, and public service announcements) related to safe bicycle use and walking. TEA-21 added “the modifi-cation of public sidewalks to comply with the Americans with Disabilities Act” as an activity that is specifically eligible for the use of these funds. The match percent may vary but the overall federal share of each State’s Transportation Enhancement Program must be 80 percent. Applications are typically due in the beginning of the year.
Transportation Enhancement Activities (TEAs)
Ten percent of each State’s annual STP funds are set-aside for TEAs. The law provides a specific list of activities that are eligible TEAs and this includes “provision of facilities for pedestrians and bicycles, provision of safety and educational activities for pedestrians and bicyclists,” and the “preservation of abandoned railway corridors (including the conversion and use thereof for pedestrian and bicycle trails).”
National Scenic Byways Program
These funds may be used for the construction of pedestrian and bicycle facilities along a scenic byway.
National Highway System
National Highway System funds may be used to construct bicycle transportation facilities and pedestrian walkways on land adjacent to any highway on the National Highway System, including Interstate highways.
Job Access and Reverse Commute Grants
Job Access and Reverse Commute Grants are available to support projects, including bicycle-related services, designed to transport welfare recipients and eligible low-income individuals to and from employment.
Urbanized Area Formula Grants, Capital Investment Grants and Loans, and
Formula Program for Other than Urbanized Area transit funds
Title 49 U.S.C. (as amended by TEA-21) allows the Urbanized Area Formula Grants, Capital Investment Grants and Loans, and Formula Program for Other than Urbanized Area transit funds to be used for improving bicycle and pedestrian access to transit facilities and vehicles. Eligible activities include investments in “pedestrian and bicycle access to a mass transpor-tation facility” that establishes or enhances coordination between mass transportation and other transportation.
Transit Enhancement Activity Program
TEA-21 also created a Transit Enhancement Activity program with a one percent set-aside of Urbanized Area Formula Grant funds designated for, among other things, pedestrian access and walkways, and “bicycle access, including bicycle storage facilities and installing equipment for transporting bicycles on mass transportation vehicles.”

12BETHLEHEM, NEW YORKBicycle and Pedestrian Program
State Funding Sources
Recreational Trails Program
Recreational Trails Program funding may be used for all kinds of trail projects. Of the funds apportioned to a State, 30 percent must be used for motorized trail uses, 30 percent for non-motorized trail uses, and 40 percent for diverse trail uses (any combination). For recre-ational trails to benefit bicyclists, pedestrians, and other users; contact State Dept. of Parks & Rec., Statewide Trails Coordinator (916) 653-8803.
Consolidated Local Street and Highway Improvement Program (CHIPS)
CHIPS is a New York State-funded program administered through the NYSDOT to assist local-ities in financing the construction, reconstruction or improvement of local highways, bridges, highway-railroad crossings and other local facilities. Bethlehem’s regional contact is Wilson Moore 518-485-9959.
Smart Growth Initiative
The Smart Growth Public Infrastructure Act went into effect in New York on September 29, 2010 and requires most state agencies and all state authorities, prior to approving of funding any public infrastructure projects, to prepare and file a Smart Growth Impact Statement finding that the project is consistent with 10 Smart Growth Criteria or justifying why it is not practicable to do so. Federal and state grant may be available to assist local communities to implement Smart Growth principles.
Local Waterfront Revitalization Programs
This is a locally prepared, comprehensive land and water use program for a community’s natural, public, working waterfront, and developed costal area. It provides a comprehensive structure within which critical coastal issues can be addressed. This program is administered by the Department of State and provides fifty-fifty matching grants to local communities from the New York State Environmental Protection Fund’s.
Architecture, Planning and Design Program
The Program supports work in the fields of contemporary and restoration architecture, landscape architecture, urban and rural planning, urban design, historic preservation, graphic and industrial design, and architectural theory and history. First time applicants must contact staff directly http://www.nysca.org/public/guidelines/architecture/index.htm
Safe Routes to School
This is a reimbursement program so the sponsor/applicant will pay the full cost of eligible work and SRTS funds will then be used to reimburse 100 percent of the grand total. All SRTS projects must have a minimum cost of $25,000. Funding may not be used for the acquisition of Right-of-Way, the relocation of public or private utilities, or the remediation of wetlands. The maximum project cost for non-infrastructure projects is $150,000 and for infrastructure projects $400,000. The maximum combined project cost is $550,000. The application process begins in early 2012.
New York Main Street Program
New York Main Street provides financial resources and technical assistance to communities to strengthen the economic vitality of the State’s traditional Main Streets and neighborhoods. The NY Main Street grant program provides funds from the New York State Housing Trust Fund Corporation (HTFC) to units of local government, business improvement districts, and other not-for-profit organizations that are committed to revitalizing historic downtowns, mixed-use neighborhood commercial districts, and village centers.

13BETHLEHEM, NEW YORKBicycle and Pedestrian Program
The Community Development Block Grant (CDBG)
CDBG Program is a federally funded program authorized by Title I of the Housing and Community Development Act of 1974. The CDBG Program provides grants to smaller communities in order to: ensure decent, affordable housing for all; provide services to the most vulnerable in our communities; create jobs and expand business opportunities for imple-menting a variety of community and economic development activities directed toward neigh-borhood revitalization and economic development; and to provide improved community facil-ities and services. For more info visit http://nysdhcr.gov/Programs/NYS-CDBG/ProgramGuidelines.htm
Local Funding StrategiesDespite tight budgets and limited resources, many municipalities have discovered creative ways of generating revenue to fund their bicycle and pedestrian programs. Much of the funding for bicycle lane and routes construction and maintenance can be incorporated into existing public works budgets and capital improvement plans. As roads undergo routine maintenance, provisions can be made for proposed or potential new routes and bike lanes. Along those lines, on-street bike lanes and routes would be surfaced and re-surfaced, swept, and painted in concert with the regular road maintenance, adding minimal costs. Local governments can take advantage of opportunities to add bicycle lanes and other markings upon resurfacing and repaving of streets. This requires coordination with the planning and public works departments but it is a low-cost way of implementing bicycle upgrades.
Multi-use paths separate from the roads, can incur significant additional maintenance costs. In addition, education and outreach programs, bike lockers and other bike-related facilities such as lighting and landscaping can be significant.
Bike Licensing
Bike licensing can provide funding for enhanced bike infrastructure; however it can also be seen as a potential barrier to promote cycling. Cities that have bike licensing programs include Madison, WI, Davis, CA, Salt Lake City Utah and Milwaukee WI. Fees range from $0 to $10 dollars and cyclists register every 3 or 4 years or as with some, on an annual basis. Opponents to such a fee claim that roads are maintained by property taxes which cyclists already contribute to. Proponents point out that motorists help pay for roads with gas taxes, tolls and license tabs; boaters subsidize maritime programs with vessel registration and boat launch fees; cyclists should contribute to their infrastructure. Implementing a bike licensing program should be done with caution—the motives must be well define, whether the program is to raise revenue or to provide structure and accountability for cyclists. These types of licensing programs may cost more to administer than they bring in revenue.
Adopt-A-Path
Under Adopt-A-Path programs, maintenance of bicycle paths and recreational trails would be paid for from private funds in exchange for recognition, such as signs along the path saying “Maintained by (name)”. In order for such a program to consistently work, it is recommended that a special account could be set up for donors to pay into. Adopt-A-Path is also a great way to build community partners and facilitate relationships.
User Fees
User fees can be implemented through bike lockers and bike parking fees. Automated parking systems can be implemented to help pay for such facilities.

14BETHLEHEM, NEW YORKBicycle and Pedestrian Program
Parking Meter Revenues
Local governments can specifies bicycle or pedestrian facilities or programs as an eligible expenditure of parking meter revenues. This may require the town to pass a special ordinance.
Volunteer Programs and Service Groups
Volunteers and service groups can be utilized for tree, shrub and other plantings, trash pick-up, and mulching.