Embed Size (px)
Citation preview

© Stuart Burge 2015 Version 1.1
Tel: 01788 550015 | E-Mail: [email protected] | Web: www.burgehugheswalsh.co.uk Burge Hughes Walsh - Suite 13b Davy Court - Castle Mound Way - Central Park - Rugby - Warwickshire - CV23 0UZ
Page 1 of 8
The Systems Thinking Tool Box
Dr Stuart Burge
“.. bump, bump, bump, on the back of his head. It is, as far as he knows the only way
of coming downstairs, but sometimes he feels that there really is another way, if only
he could stop bumping for a moment and think of it.”
Winnie the Pooh - A. A. Milne
Tree Diagram (TD) Alias Hierarchy Chart
What is it and what does it do?
Often used in conjunction with a Divergent Thinking tool, such as Brainstorming or
an Affinity Diagram, a Tree Diagram is a tool that allows a team to organize a large
number of ideas, opinions and issues into a meaningful structure that permits the
communication their ideas in a simple but powerful hierarchical representation.
Figure 1 shows an example Tree Diagram for the breakdown of a bicycle.
Figure 1: A Tree Diagram breakdown of the components of a bicycle
Tree Diagrams are either drawn horizontally like in Figure 1 or more commonly
vertically as shown in Figure 2.
Bicycle
Frame
Body Frame
Forks
Seat
Saddle
Seat Post
Handle-bars
Headstock
Stem
Bars
Wheels
Rim
Tyre
spokes
Hub
Brakes
Gears
ETC.
© Stuart Burge 2015 Version 1.1
Tel: 01788 550015 | E-Mail: [email protected] | Web: www.burgehugheswalsh.co.uk Burge Hughes Walsh - Suite 13b Davy Court - Castle Mound Way - Central Park - Rugby - Warwickshire - CV23 0UZ
Page 2 of 8
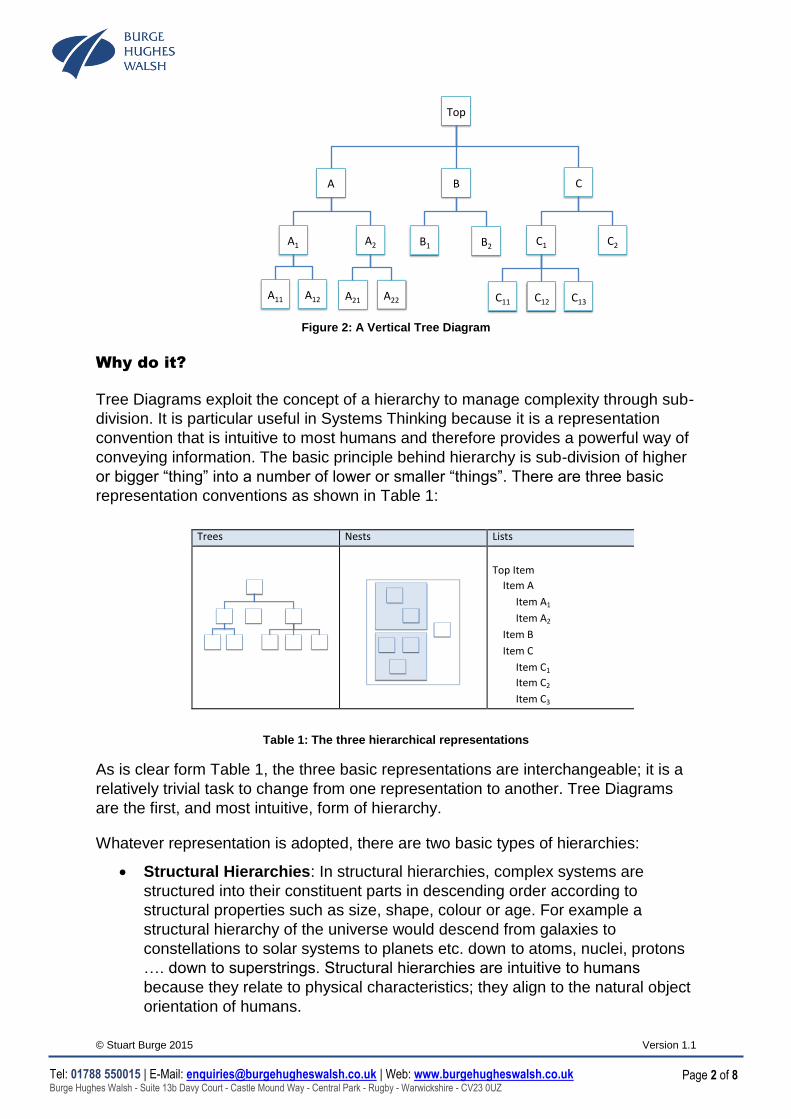
Figure 2: A Vertical Tree Diagram
Why do it?
Tree Diagrams exploit the concept of a hierarchy to manage complexity through sub-
division. It is particular useful in Systems Thinking because it is a representation
convention that is intuitive to most humans and therefore provides a powerful way of
conveying information. The basic principle behind hierarchy is sub-division of higher
or bigger “thing” into a number of lower or smaller “things”. There are three basic
representation conventions as shown in Table 1:
Table 1: The three hierarchical representations
As is clear form Table 1, the three basic representations are interchangeable; it is a
relatively trivial task to change from one representation to another. Tree Diagrams
are the first, and most intuitive, form of hierarchy.
Whatever representation is adopted, there are two basic types of hierarchies:
Structural Hierarchies: In structural hierarchies, complex systems are
structured into their constituent parts in descending order according to
structural properties such as size, shape, colour or age. For example a
structural hierarchy of the universe would descend from galaxies to
constellations to solar systems to planets etc. down to atoms, nuclei, protons
…. down to superstrings. Structural hierarchies are intuitive to humans
because they relate to physical characteristics; they align to the natural object
orientation of humans.
A22
A
A21A12
CB
A2
A11
A1 B2B1 C2C1
C13C12
Top
C11
Trees Nests Lists
TopItem
ItemA
ItemA1
ItemA2
ItemB
ItemC
ItemC1
ItemC2
ItemC3

© Stuart Burge 2015 Version 1.1
Tel: 01788 550015 | E-Mail: [email protected] | Web: www.burgehugheswalsh.co.uk Burge Hughes Walsh - Suite 13b Davy Court - Castle Mound Way - Central Park - Rugby - Warwickshire - CV23 0UZ
Page 3 of 8
Functional Hierarchies decompose complex systems into constituent parts
according to their essential relationships. For example in a washing machine
all the parts relating to managing the water temperature would be structured
together. Functional hierarchies logically group together parts that collectively
accomplish a purpose or sub-purpose of a system. Structural hierarchies,
while highly logical, are not intuitive to humans. A group of parts in a
functional hierarchy will comprise parts that have different structural
properties.
Systems Thinking uses both types, but Tree Diagrams are particularly useful and
powerful to capture Functional Hierarchies because they are purposed based and
provide a logical and rational basis for sub-division in which the relationships are
essential to the operation of the system. Many Systems Thinking and Systems
Engineering tools exploit Functional Hierarchies in their methodology. To name but a
few; Viewpoint Analysis, Use Case Diagrams, Conceptual Models, Functional Flow
Diagrams, and Sequence Diagrams all fundamentally rely on Functional Hierarchies.
In Reductionist Thinking we make more use of Structural Hierarchies because it is
observable (we can see the sub-division) but the essence of the relationship
between components is ignored. It is important to remember when attempting to do
some Systems Thinking, a group of humans will naturally, will intuitively, resort to
constructing Structural Hierarchies. In such cases the group will require strong
guidance to avoid the reductionist trap.
Where and when to use it?
Tree Diagrams are used wherever we wish to manage a complex situation. They can
be used to organize and manage:
Purpose
Goal or objective
Task or activity
Thing or product
Need or requirement
Problem or Issue
Who does it?
Tree Diagrams can be created by an individual or, more usefully, by a team. It is
important that a team comprises members who have knowledge about the situation
or problem. There is, however, no reason why this core team cannot be
supplemented with additional members who have limited experience of the situation
or problem. This can help ensure that “obvious” or “basic” information is not
excluded; experts often mentally “self-censor” ideas non-experts do not.
There is great benefit in terms of quality of output and time efficiency if people, who
are familiar with the tool and its use, facilitate the sessions.
© Stuart Burge 2015 Version 1.1
Tel: 01788 550015 | E-Mail: [email protected] | Web: www.burgehugheswalsh.co.uk Burge Hughes Walsh - Suite 13b Davy Court - Castle Mound Way - Central Park - Rugby - Warwickshire - CV23 0UZ
Page 4 of 8
How to do it?
There are several approaches that are based upon the use of a “pre-tool” to
generate the items in the tree hierarchy. These include:
WHAT-HOW relationship
Cause and Effect Diagram
Affinity Diagram.
The following provides a brief summary of these approaches, but the recommended
approach is via an Affinity Diagram - for which there is a full tool description.
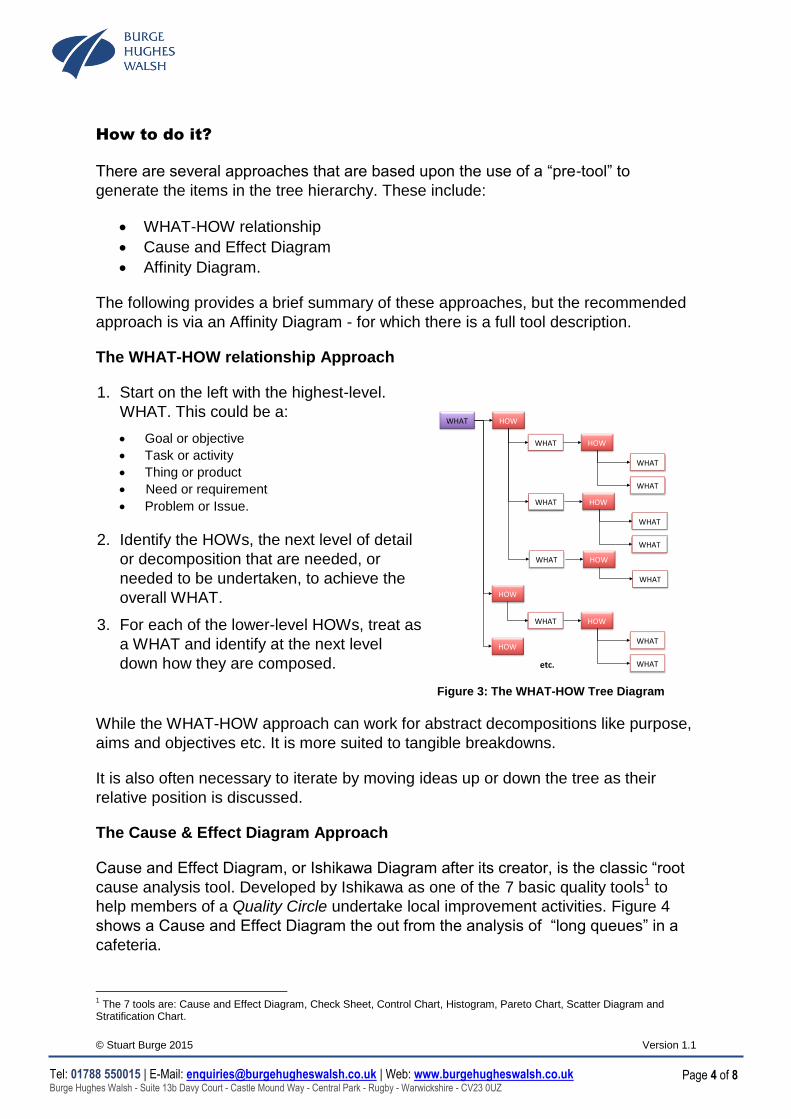
The WHAT-HOW relationship Approach
1. Start on the left with the highest-level.
WHAT. This could be a:
Goal or objective
Task or activity
Thing or product
Need or requirement
Problem or Issue.
2. Identify the HOWs, the next level of detail
or decomposition that are needed, or
needed to be undertaken, to achieve the
overall WHAT.
3. For each of the lower-level HOWs, treat as
a WHAT and identify at the next level
down how they are composed.
Figure 3: The WHAT-HOW Tree Diagram
While the WHAT-HOW approach can work for abstract decompositions like purpose,
aims and objectives etc. It is more suited to tangible breakdowns.
It is also often necessary to iterate by moving ideas up or down the tree as their
relative position is discussed.
The Cause & Effect Diagram Approach
Cause and Effect Diagram, or Ishikawa Diagram after its creator, is the classic “root
cause analysis tool. Developed by Ishikawa as one of the 7 basic quality tools1 to
help members of a Quality Circle undertake local improvement activities. Figure 4
shows a Cause and Effect Diagram the out from the analysis of “long queues” in a
cafeteria.
1 The 7 tools are: Cause and Effect Diagram, Check Sheet, Control Chart, Histogram, Pareto Chart, Scatter Diagram and
Stratification Chart.
WHAT HOW
WHAT HOW
WHAT
HOW
HOW
WHAT HOW
WHAT
WHAT
WHAT
WHAT HOW
WHAT
WHAT HOW
WHAT
WHATetc.
© Stuart Burge 2015 Version 1.1
Tel: 01788 550015 | E-Mail: [email protected] | Web: www.burgehugheswalsh.co.uk Burge Hughes Walsh - Suite 13b Davy Court - Castle Mound Way - Central Park - Rugby - Warwickshire - CV23 0UZ
Page 5 of 8
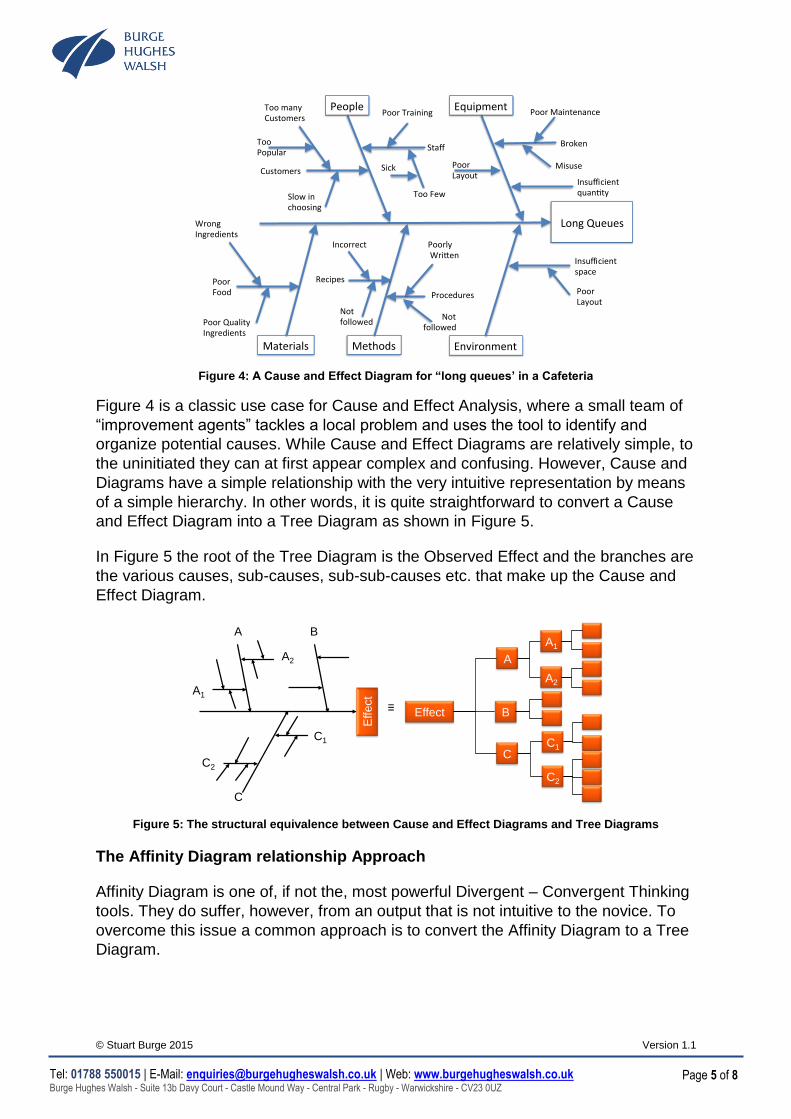
Figure 4: A Cause and Effect Diagram for “long queues’ in a Cafeteria
Figure 4 is a classic use case for Cause and Effect Analysis, where a small team of
“improvement agents” tackles a local problem and uses the tool to identify and
organize potential causes. While Cause and Effect Diagrams are relatively simple, to
the uninitiated they can at first appear complex and confusing. However, Cause and
Diagrams have a simple relationship with the very intuitive representation by means
of a simple hierarchy. In other words, it is quite straightforward to convert a Cause
and Effect Diagram into a Tree Diagram as shown in Figure 5.
In Figure 5 the root of the Tree Diagram is the Observed Effect and the branches are
the various causes, sub-causes, sub-sub-causes etc. that make up the Cause and
Effect Diagram.
Figure 5: The structural equivalence between Cause and Effect Diagrams and Tree Diagrams
The Affinity Diagram relationship Approach
Affinity Diagram is one of, if not the, most powerful Divergent – Convergent Thinking
tools. They do suffer, however, from an output that is not intuitive to the novice. To
overcome this issue a common approach is to convert the Affinity Diagram to a Tree
Diagram.
LongQueues
People Equipment
Materials Methods Environment
Customers
ToomanyCustomers
TooPopular
Slowinchoosing
Staff
PoorTraining
TooFew
Sick PoorLayout
Broken
PoorMaintenance
Misuse
Insufficientquan ty
PoorFood
WrongIngredients
PoorQualityIngredients
Recipes
Notfollowed
Incorrect
Procedures
PoorlyWri en
Notfollowed
Insufficientspace
PoorLayout
A
B
C
A1
A2
C2
C1
Effect
Effect
A B
C
A1
C2
C1
A2
≡
© Stuart Burge 2015 Version 1.1
Tel: 01788 550015 | E-Mail: [email protected] | Web: www.burgehugheswalsh.co.uk Burge Hughes Walsh - Suite 13b Davy Court - Castle Mound Way - Central Park - Rugby - Warwickshire - CV23 0UZ
Page 6 of 8
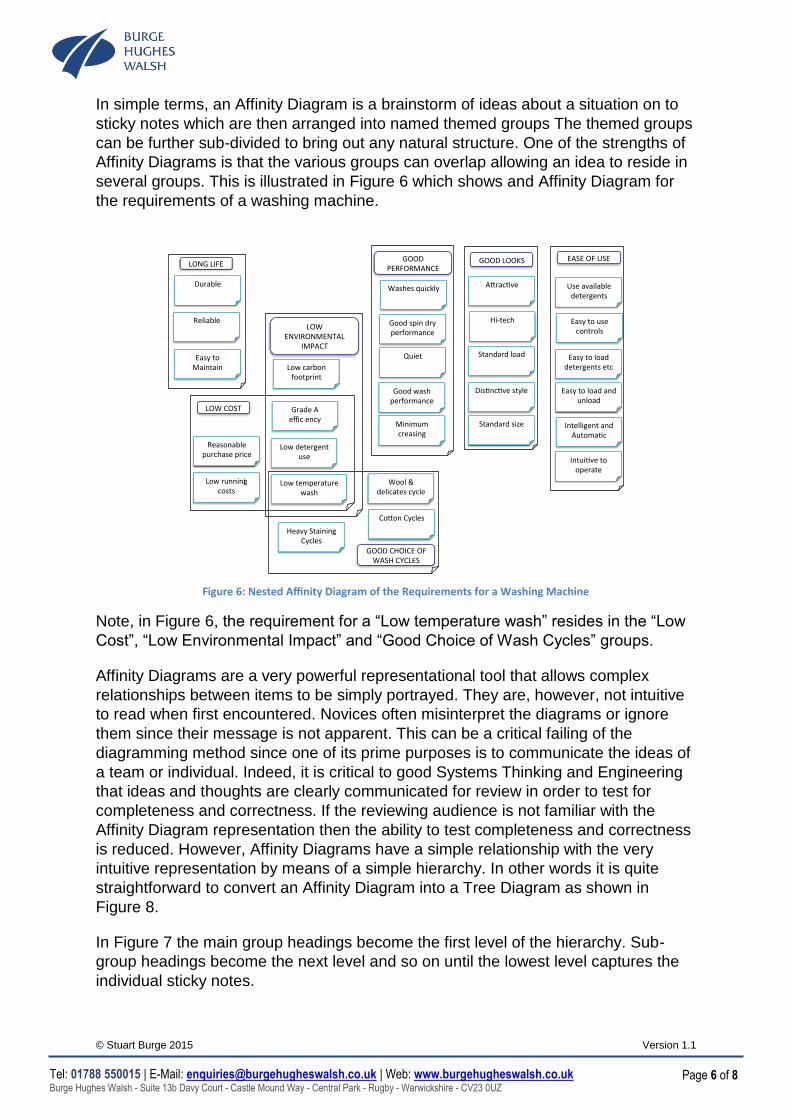
In simple terms, an Affinity Diagram is a brainstorm of ideas about a situation on to
sticky notes which are then arranged into named themed groups The themed groups
can be further sub-divided to bring out any natural structure. One of the strengths of
Affinity Diagrams is that the various groups can overlap allowing an idea to reside in
several groups. This is illustrated in Figure 6 which shows and Affinity Diagram for
the requirements of a washing machine.
Figure 6: Nested Affinity Diagram of the Requirements for a Washing Machine
Note, in Figure 6, the requirement for a “Low temperature wash” resides in the “Low
Cost”, “Low Environmental Impact” and “Good Choice of Wash Cycles” groups.
Affinity Diagrams are a very powerful representational tool that allows complex
relationships between items to be simply portrayed. They are, however, not intuitive
to read when first encountered. Novices often misinterpret the diagrams or ignore
them since their message is not apparent. This can be a critical failing of the
diagramming method since one of its prime purposes is to communicate the ideas of
a team or individual. Indeed, it is critical to good Systems Thinking and Engineering
that ideas and thoughts are clearly communicated for review in order to test for
completeness and correctness. If the reviewing audience is not familiar with the
Affinity Diagram representation then the ability to test completeness and correctness
is reduced. However, Affinity Diagrams have a simple relationship with the very
intuitive representation by means of a simple hierarchy. In other words it is quite
straightforward to convert an Affinity Diagram into a Tree Diagram as shown in
Figure 8.
In Figure 7 the main group headings become the first level of the hierarchy. Sub-
group headings become the next level and so on until the lowest level captures the
individual sticky notes.
Reasonablepurchaseprice
Lowrunningcosts
GradeAeffic
i
ency
Lowdetergentuse
Goodwashperformance
Goodspindryperformance
Minimumcreasing
Easytousecontrols
Easytoloadandunload
Easytoloaddetergentsetc
Standardsize
Reliable
Durable A rac ve
Dis nc vestyle
Hi-tech
Quiet
IntelligentandAutoma c
Washesquickly
Lowcarbonfootprint
Standardload
Useavailabledetergents
Wool&delicatescycle
Lowtemperaturewash
EasytoMaintain
Intui vetooperate
Co onCycles
HeavyStainingCycles
LOWCOST
LONGLIFEEASEOFUSE
LOWENVIRONMENTAL
IMPACT
GOODPERFORMANCE
GOODLOOKS
GOODCHOICEOFWASHCYCLES
© Stuart Burge 2015 Version 1.1
Tel: 01788 550015 | E-Mail: [email protected] | Web: www.burgehugheswalsh.co.uk Burge Hughes Walsh - Suite 13b Davy Court - Castle Mound Way - Central Park - Rugby - Warwickshire - CV23 0UZ
Page 7 of 8
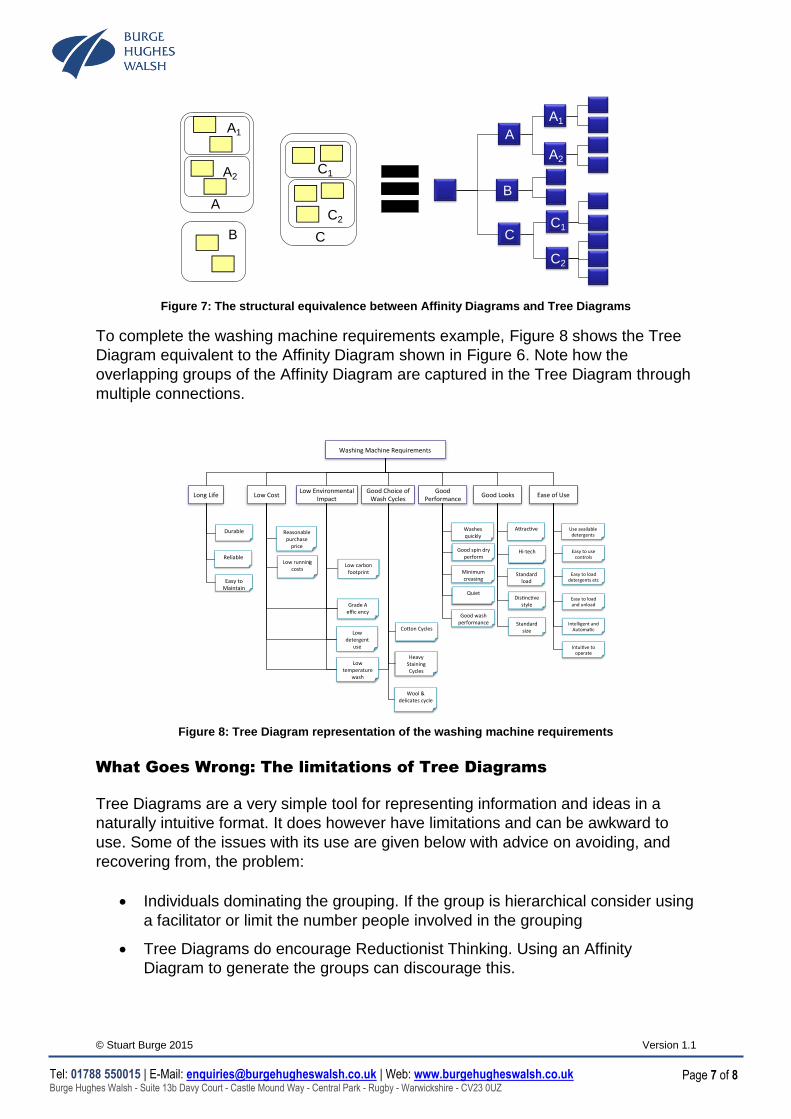
Figure 7: The structural equivalence between Affinity Diagrams and Tree Diagrams
To complete the washing machine requirements example, Figure 8 shows the Tree
Diagram equivalent to the Affinity Diagram shown in Figure 6. Note how the
overlapping groups of the Affinity Diagram are captured in the Tree Diagram through
multiple connections.
Figure 8: Tree Diagram representation of the washing machine requirements
What Goes Wrong: The limitations of Tree Diagrams
Tree Diagrams are a very simple tool for representing information and ideas in a
naturally intuitive format. It does however have limitations and can be awkward to
use. Some of the issues with its use are given below with advice on avoiding, and
recovering from, the problem:
Individuals dominating the grouping. If the group is hierarchical consider using
a facilitator or limit the number people involved in the grouping
Tree Diagrams do encourage Reductionist Thinking. Using an Affinity
Diagram to generate the groups can discourage this.
A
A1
CB
A2C1
C2
A
B
C
A1
A2
C2
C1
WashingMachineRequirements
LongLife LowCostLowEnvironmental
ImpactGoodLooks
GoodPerformance
GoodChoiceofWashCycles
EaseofUse
Reliable
Durable
EasytoMaintain
Reasonablepurchaseprice
Lowrunningcosts
GradeAeffic
i
ency
Lowdetergent
use
Lowcarbonfootprint
Lowtemperature
wash
Wool&delicatescycle
Co onCycles
HeavyStainingCycles
Goodwashperformance
Goodspindryperform
Minimumcreasing
Quiet
Washesquickly
Standardsize
A rac ve
Dis nc vestyle
Hi-tech
Standardload
Easytousecontrols
Easytoloadandunload
Easytoloaddetergentsetc
IntelligentandAutoma c
Useavailabledetergents
Intui vetooperate

© Stuart Burge 2015 Version 1.1
Tel: 01788 550015 | E-Mail: [email protected] | Web: www.burgehugheswalsh.co.uk Burge Hughes Walsh - Suite 13b Davy Court - Castle Mound Way - Central Park - Rugby - Warwickshire - CV23 0UZ
Page 8 of 8
Often find levels of generality misaligned with the tree hierarchy. In other
words detailed components too high in the tree structure. Should always
review the Tree Diagram for alternative groupings
Success Criteria
The following list represents a set of criteria that have been found to be useful when
constructing a Tree Diagram. Ignore them at your peril!
Team size between three and six.
Team constitution covers system life cycle and potential technology.
Use an experienced independent facilitator, particularly when attempting to
combine individual’s efforts.
If using an Affinity Diagram to generate ideas:
o check out duplication fully.
o Headers need to reflect the context of the diagram. e.g. If using to
generate requirements, headers must be requirements etc.
Three levels of hierarchy are usually sufficient. If more is needed consider a
series of top-down Tree Diagrams.
Keep the structure simple – consider different groupings.
At each level/group go for seven or fewer components.