Embed Size (px)
Citation preview

Big Bath and Impairment of Goodwill
A study of the European telecommunication industry
MASTER THESIS WITHIN: Business Administration
NUMBER OF CREDITS: 30 ETCS
PROGRAMME OF STUDY: Civilekonomprogrammet
AUTHORS: Caroline Karlsson & Amalia Reimbert
TUTOR: Gunnar Rimmel
JÖNKÖPING May 2015

Acknowledgement We would like to thank our tutor Professor Gunnar Rimmel for his contribution and help-ful guidance in the process of completing this thesis. His feedback and support has been of
great value.
Further we want to thank our opponents who have contributed with invaluable feedback during the course of writing.
………………............................................ ………………............................................
Caroline Karlsson Amalia Reimbert
Jönköping International Business School May 2016

Master Thesis within Business Administration Title: Big Bath and Impairment of Goodwill – A study of the European
telecommunication industry
Authors: Caroline Karlsson
Amalia Reimbert
Date: [2016-05-23]
Subject terms: Big bath, Impairment of goodwill, Earning management, Europe,
Telecommunication industry
Abstract Income decreasing strategies conducted by management could be harmful for various stakeholders. One example is big bath accounting, which could be accomplished in numer-ous ways. This study focus on big baths achieved by recognising impairments of goodwill. Purpose - The purpose of this study is to examine patterns of association between big bath accounting and impairment of goodwill within the telecommunication service industry in Europe. Further, this study aim at contributing to the discussion regarding utilisation of big baths through impairments of goodwill, and takes the perspective of an external stakehold-er. Delimitations - The study is restricted to European telecommunication entities comprised in STOXX Europe 600 Index. Method - This study was conducted using a hybrid of qualitative and quantitative research strategy with a deductive approach. The five indicators used to identify various big bath behaviours were inspired and derived from theory and previous research. Data from 2009 to 2015 was collected from the companies’ annual reports and websites, and analysed by the help of codification of each fulfilled indicator where 2009 merely served as a compara-tive year for 2010. By the use of a scoreboard the collected data was summarised on an ag-gregated yearly basis as the industry, not the specific companies, were analysed. Empirical findings - The results of this study suggests that big baths are executed among tele-communication companies within Europe. These are conducted simultaneously as impair-ments of goodwill are present, facilitated by earning management. A possible explanation is considered to be the room for interpretation inherent in IAS 36, enabling goodwill impair-ments to be recognised on managers’ command. Thereby an impairment could be “saved” for better or worse circumstances, or recognised when there exist an opportunity to max-imise (the manager's) wealth in the future. This study reveal the co-occurrence of goodwill impairments and big bath-indications, however a review of causal relationships are not en-abled by the limitations of the chosen method.

i
Definitions CEO - Chief Executive Officer
EBIT - Earnings Before Interest and Tax
EU - European Union
FASB - Financial Accounting Standards Board
GAAP - Generally Accepted Accounting Principles
GWI - Goodwill Impairment (Impairment of Goodwill)
GWIs - Goodwill Impairments (Impairments of Goodwill)
IAS - International Accounting Standard
IAS 36 - International Accounting Standard 36 Impairment of Assets
IASB - International Accounting Standards Board
IASC - International Accounting Standards Committee
IFRS - International Financial Reporting Standard
IFRS 3 - International Financial Reporting Standard 3 Business Combinations

ii
Table of Contents 1 Introduction ............................................................................. 5
1.1 Problem Discussion ......................................................................... 6 1.2 Research Questions ......................................................................... 7
1.2.1 Sub-question 1 .................................................................... 7 1.2.2 Sub-question 2 .................................................................... 7
1.3 Purpose ............................................................................................ 7 1.4 Delimitations ..................................................................................... 7 1.5 Outline .............................................................................................. 8
2 Frame of Reference ................................................................ 9 2.1 Characteristics of an Asset .............................................................. 9 2.2 What is Goodwill? ............................................................................ 9 2.3 Development of Treatment of Goodwill .......................................... 10 2.4 IFRS 3 Business Combinations ..................................................... 11 2.5 IAS 36 Impairment of Assets .......................................................... 12 2.6 Goodwill Impairments in Europe .................................................... 13 2.7 Theories ......................................................................................... 14
2.7.1 Stakeholder Theory ........................................................... 14 2.7.2 Agency Theory .................................................................. 14 2.7.3 Positive Accounting Theory ............................................... 14 2.7.4 Disclosure Theory .............................................................. 15
2.8 Designed Accounting ..................................................................... 15 2.8.1 Accounting Fraud .............................................................. 15 2.8.2 Earning Management ........................................................ 16 2.8.3 Big Bath Accounting .......................................................... 16 2.8.4 Defining Non-recurring Items ............................................. 18
3 Methodology .......................................................................... 20 3.1 Research Strategy and Design ...................................................... 20 3.2 Research Method ........................................................................... 21
3.2.1 Sample Selection ............................................................... 21 3.2.2 Collection of Data .............................................................. 22
3.3 Data Analysis ................................................................................. 24 3.3.1 Codification ........................................................................ 24 3.3.2 Indicator 1 - Bad Result ..................................................... 24 3.3.3 Indicator 2 - High Gain and High Cost ............................... 25 3.3.4 Indicator 3 - Replacement of CEO ..................................... 25 3.3.5 Indicator 4 - (GWI÷Total Assets)>1% ................................ 26 3.3.6 Indicator 5 - Negative Result ............................................. 26 3.3.7 Currency Translation ......................................................... 27 3.3.8 Quality of Method .............................................................. 27 3.3.9 Reliability ........................................................................... 27 3.3.10 Validity ............................................................................... 28 3.3.11 Critique of References ....................................................... 28
4 Empirical Findings ................................................................ 30 4.1 How has Big Bath Accounting Changed over Time? ..................... 30
4.1.1 Non-recurring Cost ............................................................ 30

iii
4.1.2 Indicator 1 - Bad Result ..................................................... 31 4.1.3 Indicator 2 - High Gain and High Cost ............................... 32 4.1.4 Indicator 3 - Replacement of CEO ..................................... 32 4.1.5 Indicator 4 - (GWI ÷ Total Assets)>1% .............................. 32 4.1.6 Indicator 5 - Negative Result ............................................. 33
4.2 How has Impairment of Goodwill Changed over Time? ................. 33 4.3 How Do Companies Utilise Big Bath Accounting When Recognising Impairment of Goodwill? .................................................... 36
5 Analysis ................................................................................. 37 5.1 Analysis of the Big Bath-Indicators ................................................ 37
5.1.1 Non-recurring Costs .......................................................... 37 5.1.2 Indicator 1 - Bad Result ..................................................... 38 5.1.3 Indicator 2 - High Gain and High Cost ............................... 39 5.1.4 Indicator 3 - Replacement of CEO ..................................... 40 5.1.5 Indicator 4 - (GWI÷Total Assets)>1% ................................ 40 5.1.6 Indicator 5 - Negative Result ............................................. 41 5.1.7 Concluding Remarks ......................................................... 41
5.2 Analysis of Impairments of Goodwill .............................................. 42 5.3 Analysis of How Companies Utilise Big Bath Accounting When Recognising Impairment of Goodwill ............................................ 44
6 Conclusion ............................................................................ 46 6.1 How has Big Bath Accounting Changed over Time? ..................... 46 6.2 How has Impairment of Goodwill Changed over Time? ................. 46 6.3 How do Companies Utilise Big Bath Accounting when Recognising Impairment of Goodwill? .................................................... 47 6.4 Discussion ...................................................................................... 47 6.5 Ethical Issues ................................................................................. 49 6.6 Societal Impact ............................................................................... 49 6.7 Future Research ............................................................................ 50
List of References ...................................................................... 51

iv
Figures Figure 2.1 Own illustration of IAS 36 impairment test process ..................... 12
Graphs Graph 4.1 Fulfilled big bath-indicators over time ........................................... 30 Graph 4.2 Total big bath-indicators per year ................................................. 33 Graph 4.3 Summarised impairment of goodwill over time ............................ 35 Graph 4.4 Change over time, big bath-indicators and impairment of goodwill36
Tables Table 2.1 List of non-recurring items ............................................................. 19 Table 3.1 Table of the fall offs of the sample ................................................ 21 Table 3.2 Table of companies included in the final sample .......................... 22 Table 4.1 Percentage of GWI included in non-recurring costs ...................... 31 Table 4.2 Overview mean percentages of impairments ................................ 33 Table 4.3 Three highest percentages of GWI (Max Mean) ........................... 34 Table 4.4 Three lowest percentages of GWI (Min Mean) ............................. 34 Table 4.5 Aggregated amounts of goodwill ................................................... 35
Appendix Appendix 1 .................................................................................................... 58 Appendix 2 .................................................................................................... 59 Appendix 3 .................................................................................................... 62 Appendix 4 .................................................................................................... 63

5
1 Introduction Telia Company is one of the top ten telecommunication operators in Europe and has for the last three years recognised impairments of goodwill [GWI] worth some 10,2 billion SEK (€1 billion1) (Statista, 2016; Telia Company, 2015, 2016). Historically Vodafone, an-other grand telecommunication operator in Europe, recognised GWIs of £23,5 billion (€33,9 billion2) in 2006 and in 2014 another impairment of £6,6 billion (€8 billion3) was recognised by the company (Duff & Phelps, 2015). These amounts may in comparison to these companies turnover seem as pennies, but the complexity of goodwill makes it a pos-sible item of manipulation. The definition of goodwill has been studied by Giuliani and Brännström (2011) where the results show that there is no unanimous definition, neither in literature nor in practice. There are complex treatments regarding goodwill and there is a risk of investors being obscured regarding this matter. Furthermore, managers may have incentives to use creativity in accounting, to portray fi-nancial situations more or less optimistic than reality. One form of such creativity is big bath accounting where management use income-decreasing procedures to lower current earnings per share in order to increase earnings per share in the future (Riahi-Belkaoui, 2004). Realising greater costs is one way of achieving a big bath as managers are able to e.g. accelerate write-offs (Healy, 1985) and increase impairments. A study conducted by the advisory firm Duff & Phelps (2015) reveal that components of STOXX Europe 600 Index4 impaired goodwill worth €29,4 billion in 2014. Furthermore, the study shows that the average percentage of goodwill per total assets in Europe is 3,5% during 2014, but that it varies among industries. The telecommunication industry in Eu-rope is a goodwill intense industry where, in 2014, 20% of total assets were made up by goodwill (Duff & Phelps, 2015), compared to the average of 3,5%. Many telecommunica-tion companies’ high rates of goodwill are dating back to the 1990’s boom when numerous companies expanded by acquisitions, which were further facilitated by cheap financing (As-carelli, 2002; Atlas & Romero, 2002; Romero, 2003). Many companies that joined the boom have suffered from large goodwill write-offs due to the overpriced acquisitions (Romero, 2003). Goodwill is an item that has become a larger part of companies’ assets (Duff & Phelps, 2015), and is also one of those assets which are harder to evaluate. Myddelton (2010) is dis-cussing the difficulties with appraising goodwill, and conclude that the techniques for eval-uating goodwill are vague. The complex accounting treatment of goodwill further makes it a possible item of inappropriate treatment, e.g. improper impairment tests. The large
1 Conversion rate at the time of closing of accounts 2013, 2014, 2015, see Appendix 1, table 1. 2 Conversion rate at the time of closing of accounts 2006, see Appendix 1, table 2. 3 Conversion rate at the time of closing of accounts 2014, see Appendix 1, table 2. 2 Conversion rate at the time of closing of accounts 2006, see Appendix 1, table 2. 3 Conversion rate at the time of closing of accounts 2014, see Appendix 1, table 2. 4 An index comprising a mix of 600 large, mid and small capitalization companies across 18 countries in Eu-
rope.

6
amounts of goodwill, along with large GWIs could indicate increasing risks of the occur-rence of big baths. The two telecommunication companies referred to above, merely represent a selection of organisations in the telecommunication industry that have recognised GWIs. Investors and financial analysts use accounting as a basis for their investment decisions (Watts & Zim-merman, 1986), and since the treatment of goodwill is considered vague and complex, stakeholders might be misled by the impairments. Therefore, this kind of activity might lead to less confidence among current and potential investors, hence less money in the cap-ital market.
1.1 Problem Discussion One incentive to conduct accounting is that “it shapes preferences, organisational routines, and the forms of visibility, which support and give meaning to decision making” (Power, 2003, p. 379). This is a view of accounting which could benefit stakeholders but also in-trigue managers to further control and restrict the information provided. Rosen (2007) ar-gues that many investors do not pay attention to accounting manipulation as they rely more on cash flows. Further he states that this is a dangerous misconception, since cash flows may also be a subject of manipulation. So, what happens if (potential) investors start to get suspicious? Levitt (1998) is questioning the creative accounting, and ask how many accounting scandals the investors will accept before they leave the capital market. He points to earning man-agement and claims it as being a game among the market participants, a game that might lead to erosion in the quality of earnings (Levitt, 1998). Which is something that would harm the quality of financial reporting. Furthermore, he calls for the capital market partici-pants to “reenergize the touchstone of our financial reporting system: transparency and comparability” (Levitt, 1998, p. 14). He continue by exemplify that showing a true and fair view, after restructuring a company, is not to be equalised with realising all the related costs to that specific period, or even adding a little extra (Levitt, 1998). In the wake of this prob-lem Nelson, Elliott, and Tarpleythe (2003) behold the regulators difficultness to solve the problem of earnings management. Further, they state that the concerns have intensified as a result of improper accounting by Enron, WorldCom, and other major organisations. A severe problem arise when stakeholders no longer have confidence in companies’ financial statements, eventually also losing faith in the capital market. This could result in less money in the capital market and thereby less money to fund the organisations. One part of earning management is the phenomenon called big bath accounting, which could be associated with GWI (AbuGhazaleh, Al-Hares, & Roberts, 2011). Since GWIs is recorded as an expense in the income statement, and that big bath is achieved by realising greater costs, there is a risk that the impairment losses are used to achieve a big bath. Ac-cording to Jordan and Clark (2004) the incentives for such treatment is to be able to face

7
lower cost in the future and thereby experience better results. This opportunity arose when IFRS updated IAS 36 Impairment of Assets, where the amendments no longer accept amorti-sation of goodwill. Instead the recoverable amount is the basis for the value in the books (IAS 36.90, 2010a). To decide the recoverable amount one need to take several different parameters into consideration, for example an estimation of the asset’s future cash flow, and the cost for bearing the uncertainty inherent in the asset (IAS 36.30, 2010a). Since the-se parameters are based on estimations, the human influences of these estimates are of in-terest. In other words, the weight and amount of the parameters might depend on the judgement of central characters, such as the board or the CEO of the organisation. The circumstances leading to GWI could be based on other than the best interest of the company. Two of these could be incentives such as big bath accounting and presenting oneself in better daylight. Therefore we find the review of GWI in combination with big bath accounting interesting. Several studies have investigated GWIs and statistical indica-tions of big baths in the U.S. and thereby investigated the treatment under FASB (Jordan & Clark, 2004; Ramanna & Watts, 2012; Sevin & Schroeder, 2011; Zang, 2008). However, similar research conducted within Europe are not as elaborated, therefore this study ad-dress that issue.
1.2 Research Questions How do companies utilise big bath accounting when recognising impairment of goodwill?
1.2.1 Sub-question 1
How has big bath accounting changed over time?
1.2.2 Sub-question 2
How has impairment of goodwill changed over time?
1.3 Purpose The purpose of this study is to examine patterns of association of big bath accounting and GWI within the telecommunication service industry in Europe, where the findings will be used as generalised information on this industry at large. Further, this study aim at contrib-uting to the discussion regarding GWI and big baths in the European telecommunication service industry. The perspective of the study is from the view of a stakeholder in general, particularly an external stakeholder, which refers to the users of financial reports.
1.4 Delimitations The study is restricted to European telecommunication entities comprised in STOXX Eu-rope 600 Index. The number of companies have further been restricted to those who have

8
provided all annual reports during the time frame of financial years 2009 to 2015. Internally generated goodwill and negative goodwill is not included, hence the focus is on goodwill arising in business combinations. The data is restricted to the annual reports of the entities and publicly available information on their websites.
1.5 Outline Chapter 1 introduce current events of goodwill and studies concerning GWI. This falls into a problem discussion followed by the research questions. Lastly, the purpose and delimita-tions of the study are presented. Chapter 2 introduce the frame of reference and define the fundamental concepts of this study. Further, treatment of goodwill, related theories and previous research are intro-duced. Chapter 3 give an introduction to methodological issues as well as a presentation of the re-search method used to fulfill the purpose of this study. The indicators and related variables used to answer the research questions are described together with their assigned codifica-tions. Chapter 4 present the empirical findings together with graphs, tables and descriptions of da-ta collected from the sample of companies. Chapter 5 include the analysis of the data where the empirical findings are connected to the-ories and previous research presented in chapter 2. Chapter 6 provide the conclusion of the study as well as a discussion regarding the impres-sions received during the course of writing this thesis. The chapter ends with a presentation of ethical issues, the societal impact and suggestions for future research.
9
2 Frame of Reference This section introduce concepts, theories and research in connection to the topic of this study. It starts by presenting the basis of accounting for goodwill, followed by theories and previous research.
2.1 Characteristics of an Asset In order for a company to recognise an asset, certain criteria need to be met. These are that the resource needs to be controlled by the company as an effect of past transactions or events, and that the company expects future benefits from the resource (IASB, 2010, para 4.4). An asset can be of two different types; the first one is the physical form, e.g. property, plant or equipment, hence called tangible assets. The other category is of non-physical form and therefore called intangible assets, examples of these are patents, copyrights and goodwill (IASB, 2010, para 4.11).
2.2 What is Goodwill? The objective of IFRS 3 Business Combinations is inter alia to regulate how to recognise and measure goodwill that arise in a business combination (IFRS 3.1b, 2011), internally gener-ated goodwill should not be recognised as an asset (IAS 38.48, 2010b). IFRS 3 states that goodwill arise at the time of a business acquisition, when the price paid for the acquired business exceeds the fair value of the net identifiable assets (IFRS 3.32, 2011). Further, it defines goodwill as “an asset representing the future economic benefits arising from other assets acquired in a business combination that are not individually identified and separately recognised” (IFRS 3, 2011, p. 13). According to Giuliani and Brännström (2011) the IFRS concept of goodwill does not re-flect the image of goodwill in practice, suggesting a gap between theory and practice. Fur-ther they state that this gap might be a consequence of IFRS’s attempt to combine two general perspectives, the top-down perspective and the bottom-up perspective (Giuliani & Brännström, 2011; Johnson & Petrone, 1998). The top-down perspective explains goodwill as a leftover from larger assets, representing the acquirer's expectations about future earn-ings pertaining to the acquisition (Johnson & Petrone, 1998). Within this approach good-will is either a group of assets, which the accountant cannot accurately identify and correct-ly measure, or simply a residual (Giuliani & Brännström, 2011). From the bottom-up per-spective, goodwill is seen as several assets that the acquiring company receive but which have not been part of the acquired company's balance sheet (Colley & Volkan, 1988), in other words, a form of hidden assets.

10
Johnson and Petrone (1998) as well as Detzen and Zülch (2012) summarise how goodwill can arise in accordance with the bottom-up perspective, these possible components of goodwill are:
• The difference between the fair value and the book value of the acquiree's recog-nised net assets.
• Fair values of other net assets that have not been recognised by the acquiree. In other words recognition criteria were not met, or rules prohibit their recognition. E.g. research and development in process included in a purchase.
• Fair value of the "going concern" element of the acquiree's existing business. E.g. the start-up-, “get-going-” and risk of failure costs that the acquirer do not need to invest.
• Fair value of the acquirer's ability to enjoy the synergy effect of combining assets and businesses. These synergies are unique to each business combination, since each combination creates different synergies and therefore different values.
• Overvalued consideration paid because of overvaluation of the acquiree. • Overpayment by the acquirer. This might be the case if the price is driven up by
bidding and therefore a difference between acquisition price and book value arise or with other words, goodwill.
• Errors in fair value measurements of either the cost of the business combination or the acquiree's identifiable assets or liabilities (IFRS 3.46, 2011).
Detzen and Zülch (2012) argues that this variety of events which might result in goodwill in a company’s balance sheet makes it hard for an investor to interpret the potential posi-tive outcome of goodwill. Some stakeholders may welcome some of these events, while other stakeholders could reject those same events. Further, Detzen and Zülch (2012) state that the definition of goodwill is vague which in turn might tempt managers to manipulate the accounts.
2.3 Development of Treatment of Goodwill The phenomenon of accounting for goodwill has been around since the 1940’s when the Accounting Research Bulletin (ARB), in the U.S, recommended acquired goodwill to be carried as an asset at cost (Rees & Janes, 2012). Their guidance provided two methods for treatment of goodwill, one where it was systematically amortised and the other where it remained at cost until there existed evidence of its limited life or a loss. Later on, a new treatment was issues thus only allowed goodwill to be amortised over an arbitrary period of maximum 40 years (APB, 1970, para. 18-20 & 29). In 1973 the current standard setter was replaced by Financial Accounting Standards Board (FASB) and also the International Ac-counting Standards Committee (IASC) was formed (FASB, n.d; IASPlus, 2015a). FASB is-sue so called Generally Accepted Accounting Principles (GAAP) for the U.S market, whereas IASC issued International Accounting Standards (IAS). These two issue separate standards and concern different markets, although the substance is similar.

11
In 2000 IASC was renamed International Accounting Standards Board (IASB) and the standards they develop are named International Financial Reporting Standards (IFRS) (IASPlus, 2015a, 2015b). FASB introduced Statement of Financial Accounting Standards (SFAS) 142 Goodwill and Other Intangible Assets in 2001, which disallowed amortisation of goodwill and introduced annual impairment tests where the goodwill was to be carried at cost less any impairment (Rees & Janes, 2012; SFAS 142, 2001). The impact of the new standard has been studied and reported by Huefner and Largay III (2004). They found that during the transition to SFAS 142 in 2001-2002 the accumulated impairments made by 100 companies amounted to 135 billion dollars. Of the 100 compa-nies studied, 33 of them recognised impairments and write-offs in the first half of 2002 whereas 67 companies had neither impairments nor any write-offs. They found one possi-ble reason for the large amount of impairments, counted in dollars, to be the acquisitions made during the 1990’s boom years would now seem to be overpriced. The impairment tests conducted after the effective date of SFAS 142 revealed this issue, hence contributed to the grand amount of impairments (Huefner & Largay III, 2004). The new standard forced companies to assess their goodwill, whereas previous rules did not encourage clear treatment of the phenomenon. There had previous to the implementation of SFAS 142 emerged concerns of whether the transition would bring big baths in goodwill write-offs. These concerns were not realised since the majority of companies’ goodwill remained un-touched post implementation (Huefner & Largay III, 2004).
2.4 IFRS 3 Business Combinations IASB and FASB started a convergence project in order to minimise discrepancies among accounting standards (FASB, 2002). IFRS 3 Business Combinations superseded IAS 22 Ac-counting for Business Combinations in 2004, now only allowing the acquisition method. In 2008, FASB and IASB converged standards regarding business combinations and is currently named SFAS 141R and IFRS 3 respectively (IASPlus, 2015c; IFRS, n.d.). This means that initial recognition of acquired goodwill is calculated using the acquisition method, both ac-cording to FASB and IASB. Using this method imply that goodwill arise when the acquisi-tion price is greater than the fair value of assets acquired (IFRS 3.18, 2011). Hamberg and Beisland (2014) argues that IFRS 3 practice fair value-based measures instead of historical cost-based measures, which makes the managements’ own expectations to dominate the assets’ values in the statements. Fair value include estimates of e.g. future cash flows as well as the cost for bearing the uncertainty inherent in the asset (IAS 36.30, 2010a), estimations which might vary from different persons’ expectations compared to historical cost were the acquisitions price is used. By reason of allowing the management to decide how to estimate these parameters, there is a risk for opportunistic behaviour. In line with this, Giner and Pardo (2015) states that the consequences might be big bath account-ing and income smoothing strategies. Further, the study by Ramanna and Watts (2012) concern SFAS 142, FASB’s counterpart to IFRS 3, and found evidence of CEO compensa-

12
tion and reputation prevailing GWIs, which imply opportunistic behaviour. Moreover, Vic-tor, Tinta, Elena, and Ionel (2012), highlights the problem caused by the effect of impair-ments on the financial result as well as the balance sheet rates, as these might be the foun-dation of a CEO’s compensation and reputation.
2.5 IAS 36 Impairment of Assets IAS 36 was first issued in 1998 but revised in 2004 in order to apply to goodwill and intan-gible assets acquired in business combinations as by IFRS 3, and has further been amended several times since then. The IAS 36 impairment test require the company to determine the recoverable amount, which is the highest of fair value and value in use, further comparing that amount to the carrying amount of the asset. If the recoverable amount is less than the carrying amount, the asset is impaired. The impairment loss is then recognised as an ex-pense in the financial statements. IAS 36 include impairment test of goodwill, as goodwill is recorded as an asset in the bal-ance sheet. The GWI test requires at least annual implementation, where the asset’s carry-ing amount is compared to its recoverable amount (IAS 36.96-105). As shown in Figure 2.1, the recoverable amount is the highest of fair value less cost to sell and value in use. Avallone and Quagli (2015) studied managers influence on the factors present in impair-ment tests of goodwill and found that some are affected by subjective estimates made by managers, e.g. budgeted cash flows and long-term growth rate estimates. These factors are used in determining value in use as it represents the value an asset is estimated at bringing the company, consequently it is shown that impairment tests are not necessarily a true re-flection of real economic forces (Avallone & Quagli, 2015).
Figure 2.1 Own illustration of IAS 36 impairment test process
Devalle and Rizzato (2012) made an empirical analysis of GWI tests in European listed companies and concluded that the mandatory disclosures required by IAS 36, such as dis-count rates and the basis for determining the recoverable amount, are vague and of poor quality.

13
Combining the findings from Avallone and Quagli (2015) with the findings from Devalle and Rizzato’s (2012) analysis, there is a risk of managers’ subjective estimations being con-cealed in vague explanations. The estimates used, and its disclosures, could be difficult for investors to fully understand in normal cases where good quality disclosures are present, hence the incentive by managers to hide subjective measurements brings further aggravat-ing circumstances.
2.6 Goodwill Impairments in Europe The global investment bank Houlihan Lokey (2012) conducted a study of GWIs among the companies comprised in STOXX Europe 600 Index. Their study showed that 2011 re-vealed the highest amounts of GWIs since 2007 which were five times higher than in 2010. Further they discovered that the profitability, when excluding GWI, increased more than 60% from 2009 to 2011, mainly between 2009 and 2010. While, the profitability including GWI decrease in 2011 compared 2010, which implies great impairments. Houlihan Lokey (2012) argues that management uses the increased profitability either to recognise inevitable GWIs that has been saved, or that they predict future challenging periods. The advisory firm Duff & Phelps (2016) also published a study involving all companies comprised in STOXX Europe 600 Index and reviewed GWIs among these companies. Duff & Phelps found the same observation as Houlihan Lokey (2012). They saw an in-crease in amounts of GWI between 2010 and 2011, as well as a decrease from 2011 to 2012 (Duff & Phelps, 2013). Further, they observed a 25% decrease in aggregated amounts of GWI in 2013 compared to 2012, which is in line with the finding that during 2012 almost two thirds (62%) of the companies made impairments of 20%-50%, while 78% of the companies made impairments less than 20% during 2013 (Duff & Phelps, 2014). Moreo-ver, a decrease of 41% in aggregated amounts of impairment between 2013 and 2014 was observed, but during the same timespan the number of impairment-events made a relative-ly small decrease, from 162 to 160 (Duff & Phelps, 2015). Despite the yearly decrease in amount of GWIs, the impairments in 2014 are double the amount of impairments in 2010. Furthermore, the study found a trend in the European market of a net increase in goodwill, implying more added goodwill than impaired, through 2010 until 2014 (Duff & Phelps, 2015). Another interesting point Duff & Phelps (2015) found was that the European tele-communication companies has a 20% share of goodwill in their total assets, while the over-all European mean is 3,5%. Furthermore, both Houlihan Lokey (2012) and Duff & Phelps (2014, 2015) argues that GWIs follow the market by increased impairments during economic uncertainties, and de-creased impairments during economic recovery. This is exemplified through Houlihan Lokey’s (2012) findings in 2011, compared to 2010, where companies comprised in STOXX Europe 600 Index had worsen their profitability ratios, while also recognising higher GWI. Furthermore, Duff & Phelps (2014) revealed a strong performance of the in-

14
dex during 2013, where the companies comprised in that same index achieved a growth of total return of 22% compared to 2012. It is thereby shown that 2011 and 2012 experience economic uncertainties due to acceleration in the European sovereign debt crisis, hereafter the market show signs of recovery (Duff & Phelps, 2014, 2015; Houlihan Lokey, 2012).
2.7 Theories The following section present theories and concepts which later will be used for interpreta-tion of the empirical data.
2.7.1 Stakeholder Theory
Stakeholder theory is a theory that emphasise relevance of more parties than solely the shareholders. Freeman and Reed (1983), state that other more traditional theories focuses on the top management’s binding fiduciary duty which force them to put the shareholders needs first, hence increasing the value of the shares. Another approach is instead that there are other parties just as important. However, the stakeholder theory includes interest groups such as financiers, employees, communities, and governmental bodies (Freeman & Reed, 1983). The theory suggests that organisations that have effective and caring stake-holder-relationships will perform better and survive longer than organizations that do not.
2.7.2 Agency Theory
The agency theory involves two parties, the principal and the agent, and explains their rela-tionship. In contrast to stakeholder theory, agency theory concern only the relationship where one is the owner (the principal) and the other is in control (the agent). This implies separation of ownership and control, which often is the case when a company is publicly traded. The principal is considered to be the shareholder whereas the agent is the manage-ment of a company. The separation of ownership and control bring an information asym-metry, known as the agency problem, which is considered developed by Coase (1937), Fama and Jensen (1983a, 1983b), as well as Jensen and Meckling (1976). Further they de-scribe the contractual view where the interests of the shareholder and the managers may, or may not, be aligned. The shareholders provide funds and needs the expertise and human capital of the manager to enable return on their investment but the management (agent) might not act in the best interest of the shareholder (principal) (Shleifer & Vishny, 1997).
2.7.3 Positive Accounting Theory
Watts and Zimmerman (1986) are considered advocates of the positive accounting theory which main assumption is that every individual is economically rational and strive to max-imise one’s wealth. This theory is based on two pillars; the efficient market hypothesis, as-suming that markets are efficient thus all available information is reflected in the prices, and the agency theory presented above. Positive accounting theory aims at answering which ac-counting methods are being used and why those choices were made. Watts and Zimmer-man (1986) presents three hypotheses which all explains and suggests why and how the management choose the accounting policies. These are the Bonus plan hypothesis, the

15
Debt/equity ratio hypothesis and the Size hypothesis, all of them describing potential in-centives for the CEO and top management. Such incentives are in line with Riahi-Belkaoui’s (2004) opinion about earning management; that the incentive of obtaining some private gain is fundamental of earning management, which is including big bath accounting. Therefore, the positive accounting theory could clarify and describe why big bath account-ing arise, which could occur when the CEO or top management has an incentive for max-imizing one’s wealth.
2.7.4 Disclosure Theory
Disclosure theory involve various components, and all are connected to accounting infor-mation provided by corporations, denoted disclosures (Rimmel, 2016). Furthermore, vol-untary disclosure is publication of information that the companies disclose in excess of what is legally required in accordance with different standards such as GAAP or IFRS (FASB, 2001). According to Ho and Wong (2001), those voluntary disclosures are an im-portant complement, and FASB states its purpose as; “improved disclosures makes the capital allocation process more efficient and reduces the average cost of capital” (FASB, 2001, p.7). These voluntary disclosures cover everything from narrative of numbers in the books to sustainability reports (Rimmel, 2016). There are different studies which argues that both accounting- and disclosure practises dif-fers due to influences of e.g. social, economic, cultural, political factors, and size (Meek, Roberts, & Gray, 1995; Rimmel, 2016). Further, the disclosure theory together with various theories concerning motivation explains the relation between the user’s need for corporate information and the management’s incentives (Rimmel, 2016).
2.8 Designed Accounting According to Riahi-Belkaoui (2004) designed accounting can be explained as a way of “choosing accounting techniques and solutions that fit a pre-established goal” (Riahi-Belkaoui, 2004, p. 54). This phenomenon contains different sub-headings and the next sec-tion present an assortment considered as relevant for the study.
2.8.1 Accounting Fraud
Riahi-Belkaoui (2004) present fraudulent financial reporting as intentional and criminal, as it may involve the use of an accounting system to illustrate an incorrect image of the com-pany. The entities that conduct accounting fraud are those who are facing economic dis-tress as well as those motivated to exercise opportunism. Riahi-Belkaoui (2004) further state common types of fraudulent financial reporting in five points:
• Manipulation, altering or falsification of documents or records • Omission or suppression of the effects of completed transactions • Recording transactions with no substance • Misapplication of accounting policies • Failing to disclose important information
16
The starting point of accounting fraud is not always criminal intentions since managers tend to choose accounting methods based on its economic consequences. However, the re-sult of bad choices made by managers might be what is intended to be hidden when ac-counting fraud is implemented (Riahi-Belkaoui, 2004). This imply, in combination with the findings of Avallone and Quagli (2015) and Devalle and Rizzato (2012), that bad choices regarding estimates used in the impairment tests might be intended to be hidden which then turns into accounting fraud.
2.8.2 Earning Management
Earning management occurs as managers have the flexibility to choose accounting treat-ments as well as options within the accounting treatments. The flexibility is intended to give the managers tools to correctly portray economic circumstances and transactions, since companies are composed and affected variously, but the intentions of managers af-fect how this flexibility is used. The effect of earning management is the ability to manipu-late, using available choices of treatment and options to obtain desirable results (Riahi-Belkaoui, 2004). Healy and Wahlen (1999) define earning management as: “Earning man-agement occurs when manager use judgement in financial reporting and in structuring transactions to alter financial reports to either mislead some stakeholders about the under-lying economic performance of the company or to influence contractual outcomes that de-pend on reported accounting numbers.” (Healy & Wahlen, 1999, p. 368). When earning management is used with the incentive to e.g. manipulate or present false records, it is clas-sified as accounting fraud and therefore no longer considered an accepted practise of earn-ing management (Riahi-Belkaoui, 2004).
2.8.3 Big Bath Accounting
Big bath accounting is a form of creativity in accounting and according to Riahi-Belkaoui (2004) it is further distinguished by three sets of circumstances. Jordan and Clark (2004) denote the first one as when a company is struggling, and decide to reduce the period’s earnings even further. They claim that the motive for this strategy is the management’s be-lief that they, nor the company, will suffer proportionately more by a greater hit since it al-ready experience depressed earnings. By recognising expenses at this time, instead of later, these expenses will not affect the upcoming year’s profit. This is a way of manipulating the financials, which makes the following year seem more positive. Hence, the big bath makes it easier to recognize higher profits during the following periods since the costs have al-ready been recognised during the previous year (Jordan & Clark, 2004). Other studies, such as those published by Chao, Kelsey, Horng and Chiu (2004) and Giner and Pardo (2015), also observed that depressed or low earnings correlate with stronger incentives for big bath or impairments of assets. On the other hand, the study by Dai, Mao and Deng (2007) found significant evidence of managers use of earnings management when making GWIs, yet the difference in impairments recognised during non-profitable years and profitable years is insignificant.

17
The second scenario is when a company is making a large non-recurring gain and therefore decides to lower the future cost by experiencing some expenses now, to be able to recog-nise less costs during upcoming times of difficulty (Riahi-Belkaoui, 2004). In line with that scenario, Hepworth (1953) and Kirshenheiter and Melumad’s (2002) argue that the market reward management for smoother earnings by increase confidence in the corporate man-agement as well as affecting income tax paid. These are also motivations for applying in-come smoothing such as carry-forward and carry-back income and losses. The economy as a whole is also affected by the presence of income smoothing, as fluctuating income affects expectations of companies future performance and might have a cumulative effect which further affect or magnify businesses up- and down swings (Hepworth, 1953). The last big bath-scenario presented by Riahi-Belkaoui (2004) occurs when a company re-place their CEO, as a motive might be to clear the decks to improve future earnings. In this scenario the description of the phenomenon of big bath accounting made by Sikora’s (1999) correspond: it (big bath) is significant non-recurring losses or expenses that cumber the current period. Further, it might be desirable for a new CEO to start with a bad result, as if caused by the predecessor, to later appear as to have saved a sinking ship. This can be explained as the anchor effect, which states that an earlier result will be used as a point of reference for later results (Kahneman, 2011). According to Healy (1985), this last case acts as a financial incitement if there is e.g. a bonus program based on the increase in profit that year. A number of studies have been conducted regarding the occurrence of big bath account-ing. Many of them investigate the positive correlation between the change of CEO and GWI (Iatridis & Senftlechner, 2014; Masters-Stout, Costigan, & Lovata, 2008). The results of the studies show disagreement to the assertion that the correlation is positive. Iatridis and Senftlechner (2014) investigates if a CEO with tenure of no more than three years per-form more impairments than a CEO with longer tenure, and concluded that there is no significant evidence for this. They also found that the positive correlation between a nega-tive result and GWI is found to be statistically insignificant, the study included Austrian companies. On the other hand, Pourciau (1993) found evidence that suggests that a new CEO record accruals and write-offs during the year of CEO rotation, in a way that de-creases the earnings of that year and increases earnings the following year. Further, Mas-ters-Stout et al. (2008) examine if GWI follows the same hypothesis. They conclude that one reason for a CEO, in its early tenure, to recognise GWI is to make the prior CEO ap-pear incompetent in its position. Moreover, to blame the previous CEO for that year’s bad result can also be seen as an opportunity for the new CEO to improve future earnings since less expenses need to be made (Masters-Stout et al., 2008). Their result states that there is evidence of that a new CEOs, with a tenure less than three years, impair more goodwill than their senior counterparts (Masters-Stout et al., 2008). A study conducted by Giner and Pardo (2015) reviewed if the GWI test is used to manage earnings and opportunistic behaviour. In line with their purpose, they highlight the man-ager's decision regarding when to record GWIs and that this is an ethical issue within the

18
accounting profession. The conclusion of their study suggests that GWI is conducted in order to achieve the desired net income, for example when the company face a bad year (Giner & Pardo, 2015). In contrast to the three defined big baths presented by Riahi-Belkaoui (2004), Elliott and Shaw (1988) use another one. They define a big bath as a write off reported as a special item, meaning unusual or infrequent and separately disclosed, and exceeding 1% of the book value of total assets. Elliott and Shaw (1988) used this definition since the decision to recognise a write off is a result of an act by corporate management, where subjective esti-mates and the ability to affect the timing of recognition are acknowledged. In line with their argument, this study will use a modified version of the definition created by Elliott and Shaw (1988) as a benchmark for detecting a potential big bath. As this study aims at examining any interplay between big bath and GWI, and as management may possibly use subjective estimates in the GWI test, its impact on total assets will be studied. The defini-tion used in the study, further influenced by Elliott and Shaw (1988), is as follows:
𝐼𝑚𝑝𝑎𝑖𝑟𝑚𝑒𝑛𝑡 𝑜𝑓 𝐺𝑜𝑜𝑑𝑤𝑖𝑙𝑙𝑇𝑜𝑡𝑎𝑙 𝐴𝑠𝑠𝑒𝑡𝑠 > 1% = 𝐵𝑖𝑔 𝑏𝑎𝑡ℎ
Furthermore, Chao et al. (2004) conducted another strategy to review big bath. They based their definition of a potential big bath on the big bath hypothesis, which suggest that com-panies “save” losses and accruals and recognise several of these when the entity is experi-encing below normal earnings. Chao et al. (2004) defined the targeted level of earnings as the prior year reported earnings. Further, they compared current period operating earnings to prior year’s operating earnings and indicated when these were negative and lower in the current period. When they found negative or lower earnings in the current period they as-sumed a potential big bath strategy, in accordance with the big bath hypothesis. Further-more, their study suggest that companies more frequently perform big baths during bad times instead of making income smoothing during good years (Chao et al. 2004). Moreo-ver, this study will use this definition as an indicator defining a potential big bath.
2.8.4 Defining Non-recurring Items
There is no clear definition of what comprise non-recurring items but it can be described as items that are infrequent, unusual or not expected to recur. A problem recognised by FASB is that these items may vary among entities as their normal operating activities differ (FASB, 2015). Previously, items which are both of unusual nature and of infrequent occur-rence has been classified as extraordinary items, meaning they are not part of companies’ normal course of business and therefore should be recognised separately in the income statement (FASB, 2015). IASB has already banned the concept of extraordinary items (IAS 1.87) but still recognise the problem of companies disclosing the isolated effect of unusual and exceptional items. In January 2015, FASB issued a proposal of also prohibiting the concept extraordinary items as a procedure of simplifying financial statements as it was considered unclear when an item was to be considered both unusual and infrequent (FASB, 2015).

19
The difference between extraordinary items and non-recurring items is not straightforward. Extraordinary items require criteria to be fulfilled and are about to be prohibited by both IASB and FASB, hence will not be discussed further. Based on the list of non-recurring items used in the study by Elliott and Shaw (1988) one could describe non-recurring items as events that depart from core operating activities of a company. Moreover, IAS 1.97-98 requires companies to disclose material income and expenses separately, which involve non-recurring items. IAS 1.98 also provides circumstances when separate disclosure of items’ nature and amounts are needed. Based on IAS 1.98 and the list of items used by El-liott and Shaw (1988), the list of non-recurring items in Table 2.1 is used in this study.
Table 2.1 List of non-recurring items
List of non-‐recurring items
Gain/loss on sale of subsidiaries
Gain/loss on sales of assets (e.g. PPE, investments)
Gain/loss on discontinued operations
Litigation settlements
Impairment loss and reversals of impairment losses
Write-‐off / write-‐down investments, inventory, PPE, intangible assets
Restructure costs (utilised restructure provisions)
Expense due to natural disaster (storm, fire etc.)
Any significant non-‐recurring items
The items in the list above are income and expenses, which inter alia are not considered usual or recurring in the normal course of business of telecommunication companies. Alt-hough these items are recognised in many telecommunication companies more often than seldom, they are still classified as non-recurring based on their nature. As explained earlier, it is no longer allowed to amortise goodwill over a period of time hence any write-downs of goodwill is not a result of amortisation but a permanent decline in its recorded amounts.

20
3 Methodology Bryman (2012) write about methodological issues and differentiate between quantitative and qualitative research strategies. The choice between these two strategies is dependent on the nature of the research question, and during some circumstances a combination of the two is preferred (Bryman, 2012).
3.1 Research Strategy and Design The basic difference between a quantitative and a qualitative research strategy is that the quantitative strategy transforms information into numbers and other measurements, while the qualitative strategy is focusing on interpretation of the information (Bryman, 2012). This study is a combination of these two strategies, where the two sub-questions will be answered using a quantitative strategy and the main question will be answered using a quali-tative strategy. This study is a hybrid of qualitative and quantitative research strategy with a deductive ap-proach, as it is conducted with reference to theories. To answer the research questions there was a need for different strategies since they contain both qualitative and quantitative characteristics. The study aimed at finding empirical evidence of whether the European tel-ecommunication industry utilise big bath accounting when recognising GWIs. This denotes the main research question of this study and has been answered using a qualitative strategy based on the findings from the sub-questions. Sub-question 1, “How has big bath accounting changed over time?”, has been answered using a quantitative research strategy and compose, together with the main research question, a focus on qualitative data. Sub-question 2, “How has impairment of goodwill changed over time?”, has also been answered using a quantitative re-search strategy since the nature of the question implies that the emphasis lies on quantita-tive data rather than qualitative data. The strategies for each question has been selected with the intention to best answer the research questions. This study has a cross-sectional design since the aim is to look at GWI and big baths in more than one case. A cross-sectional design entails collection of data on more than one case, in connection to at least two variables, which are examined to detect patterns of asso-ciation (Bryman, 2012). In this study, several cases equal the years 2010-2015 where the aim of this study is to review variations and patterns of association of two variables; indications of big bath accounting behaviour and GWI.

21
3.2 Research Method The technique for collecting data is referred to as research method (Bryman, 2012). The re-search method used in this study is content analysis where the content and disclosure in companies’ annual reports serve as a main source of information.
3.2.1 Sample Selection
The study focuses on the telecommunication industry in Europe. The telecommunication operators mentioned in the introduction, Telia Company and Vodafone, are both com-prised in the STOXX Europe 600 Index, which was a delimitation in this study. The popu-lation is the telecommunication industry companies comprised in the index as of March 2016 and in order to provide a representative result this industry census was used as the sample. In order to present a result based on a uniform basis, some of the companies would need to be excluded from the sample as they are considered unsuitable e.g. if they apply different accounting standards. Companies that do not apply the IFRS framework have been omit-ted from the study since the application of other accounting standards such as U.K GAAP or Swiss GAAP do not allow identical treatments. Further, solely companies that have pro-vided annual reports including data for all years within the studied time frame have been included. Additionally, telecommunication companies comprised in the index that are sub-sidiaries to other telecommunication companies in the index have been omitted to reduce the amount of repetitive data since this study use consolidated statements. These proce-dures were conducted to reduce the sample to become homogeneous, and to reduce sam-pling errors. No exceptions have been made regarding appliance of financial years as four companies apply broken financial year, ending March 31 every year, and constitute 25% of the final sample. These companies have been regarded as a noteworthy part of the sample, hence are not excluded. The table below illustrate the fall offs of the sample as well as the size of the final sample:
Table 3.1 Table of the fall offs of the sample
Telecommunication companies in the index (March, 2016) 23 Companies which do not apply IFRS 0 Companies which do not provide data for the entire time span -‐ 5 Subsidiaries to another company in the index -‐ 2 Final sample = 16 The seven companies that did not fulfill the criteria above, thus have been omitted, are Al-tice N.V., Proximus, TDC, Telefonica Deutschland, Cellnex Telecom, Sunrise, and OTE. The final sample contains 16 telecommunication companies, which are listed in Table 3.2.

22
Table 3.2 Table of companies included in the final sample
Company Country Vodafone GRP GB Deutsche Telekom DE BT GRP GB Telefonica ES Orange FR Telia Company SE Swisscom CH KPN NL
Telecom Italia IT
Telenor NO
Inmarsat GB
Elisa Corporation FI
Freenet DE
Cable & Wireless Communication GB
Tele2 B SE
Talktalk Telecom GRP GB
The sample has not been extended nor have fall offs been replaced by companies com-prised in STOXX Europe 1800 Index. The fall offs of this sample have primarily been smaller companies, where adding more companies not necessarily imply a larger sample since the smaller firms still tend to fall out. The final sample of 16 is considered to reflect a generalised picture of the industry as a whole.
3.2.2 Collection of Data
Answers from the sub-questions, “How has big bath accounting changed over time?” and “How has impairment of goodwill changed over time?”, form the basis for answering the main research ques-tion of how companies utilise big bath accounting when recognising GWI. The infor-mation sources used were the empirical findings of the sub-questions. To answer the sub-questions the main sources of data have been the annual reports and corporate web pages published by the companies. Those companies that did not provide annual reports online have been contacted via e-mail and subsequently provided infor-mation regarding the absence of their annual reports. The main cause of not providing re-ports online was that the companies had not been public during the entire time frame, which resulted in omitting those companies. Some companies provide both consolidated reports and separate parent company reports but this study has merely used information and data from the consolidated reports provided by the companies in the sample. By using the consolidated annual reports a broader collection of data of the industry is obtained.

23
When the financial statements provide restated or reviewed amounts in the comparative years, these amounts have been used to the extent that the restatement is due to amend-ments in accounting standards which need to be retrospectively adjusted. However, restat-ed amounts purely provided as comparative numbers, for example after a disposal of a sub-sidiary, have not been considered applicable. In such cases, the amounts stated in the fi-nancial statements of the concerned year have been applied. By doing so, the appropriate true and fair view has been attained as restatements imply revision of accounts and correc-tion of the information given. The first sub-question concerns indications of big bath accounting over time. The infor-mation from the annual reports and corporate web pages have provided data whereas indi-cators, influenced by theories and previous research, has been used as tools to analyse the collected data. The second sub-question is centred on the GWI activities over the time pe-riod, again using the annual reports as the source of data. These sub-questions then posed as tools when answering the main research question as they provide information on the sta-tus in the industry. The data collection method used in this study is inspired by Duff & Phelps (2015), which conducted a study of GWIs trends across countries and industries, involving all companies comprised in STOXX Europe 600 Index. The procedures used in their studies regarding the arrival at a final dataset has inspired the same procedures in this study, for example not to include subsidiaries. Their study concerned GWIs made across the European market where differences between countries as well as industries were distinguished. They made an extensive exploration of the behaviour in Europe by using data from Standard & Poor’s S&P Capital IQ database and individual company annual and interim financial reports (Duff & Phelps, 2015). Their study elaborated on the conditions across countries and in-dustries whereas this study target the telecommunication industry and do not differentiate between the countries. Their study merely included GWIs while this study combines such information with indications of big bath accounting. Furthermore, this study has not used a database when collecting data hence the empirical findings are retrieved from annual re-ports published by the companies. To answer the research questions, a series of consecutive years was studied. Annual reports published from 2009 to 2015 were the sources of data. Due to the financial uncertainties in 2008, data from that year might provide misleading information due to irregular economic forces. An earlier starting point was not considered appropriate due to the possible effects following the transition period of introducing IAS 36 in the European Union. On the basis of this, 2009 was chosen as the starting point of this study’s time frame to enable tracking of the development after the crisis. 2015 was selected as the endpoint of the time frame since that is the latest calendar year-end at the time of conducting this study. The analysis begins with 2010 since 2009 is the starting point for collection of data and is further used as a point of reference and comparison for the analysis of 2010. By starting the analysis in 2010 instead of 2009, the final sample was prevented from decreasing due to non-applicable annual reports from 2008.

24
3.3 Data Analysis The following sections describe how the collected data has been managed and further ex-plain the examined variables and the codification used when analysing. However, quantita-tive data has been summarised in graphs and tables to enable interpretation, and included components and structure are explained further in the late part of this section.
3.3.1 Codification
This section describe the five indicators used to identify big bath accounting behaviour, which have been used for answering the first sub-question, “How has big bath accounting changed over time?”. The following five subheadings represent each indicator and which quali-fications needed to fulfill them. All indicators have been retrieved from theory or previous research and some are modified to fit the purpose of this study. Bad Result, Replacement of CEO, and High Gain and High Cost include two variables where the first variable represent the characteristic of the indicator and the second variable represent subsequent higher costs. (GWI ÷Total Assets) >1% and Negative Result each include solely one variable, both are further explained in their specific section below. Each indicator has been evaluated on an individual basis and later used to recognise aggregate amounts over the time frame of this study. A high number of fulfilled indicators are not to be interpreted as a definite case of big bath but rather as a fulfillment of different measurements of big baths, hence an increased risk of such behaviour. By introducing several definitions there is a higher possibility of detect-ing big baths than if relying on a single measurement. Consequently, a low number of, or no, fulfilled indicators are not to be interpreted as non-occurrence of big baths as there are several definitions, incentives, and measurements to identify big bath accounting. This case is to be interpreted on the basis of the indicators presented below, no consideration has been paid to other definitions of big baths.
3.3.2 Indicator 1 - Bad Result
Bad result is defined as lower earnings, in other words; lower operating profit than the pri-or year when excluding non-recurring items. Jordan and Clark (2004) as well as Giner and Pardo (2015) tested the hypothesis stating that lower earnings create incentives for big bath where both studies observed that depressed or low earnings correlate with stronger incen-tives for big baths. On the basis of this Indicator 1, Bad Result, is introduced to this study as a way to identify a potential big bath. Moreover, this indicator has been influenced by Chao et al. (2004) in order to define a bad result. They define a desirable result to be at the same level as the prior year, which therefore define a bad result to be lower than the prior year. Further, this study focus on the “core earnings” and therefore the non-recurring costs are excluded. This was made in order to reach a higher level of comparable results since non-recurring cost is varying from year to year, therefore can make great impacts of the result. When collecting data on the first variable of this indicator, the consolidated annual report was used to identify the profit from the normal course of business. In cases where adjusted
25
EBIT5 has been provided in the annual reports, this metric was used. In other cases when adjusted EBIT was not provided, the stated operating profit when excluding the non-recurring items was calculated and applied. When locating and using the profit from core operations of a business, the comparison of performances by various companies is facilitat-ed since special factors and exceptional are disregarded. As described earlier, all companies that comply with the IFRS-framework are required to separately disclose any material non-recurring costs, which further is the base for this indi-cator’s second variable. Consequently, the second variable is whether the company has rec-ognised non-recurring costs, and if these were higher than the preceding year, in absolute numbers. Collecting this data has been accomplished by reviewing the information provid-ed in annual reports on the basis of the list of non-recurring items stated earlier. Reviewing the recognised non-recurring costs provides information on the amounts of unusual and infrequent costs that the management has chosen to recognise during a specific financial year. As explained previously, such costs could be used to achieve a big bath. When both variables were fulfilled, this was denoted with “1”, and when none of them or merely one were fulfilled it was indicated by “0”. This grading is also applicable for Indica-tor 2, High Gain and High Cost, and Indicator 3, Replacement of CEO.
3.3.3 Indicator 2 - High Gain and High Cost
Riahi-Belkaoui (2004) present a description of big bath as when a company experience non-recurring gains and recognise expenses to charge against these gains. In this study high gains are defined as non-recurring gains which are larger than the prior year, an interpreta-tion influenced by Chao et al. (2004) on the basis of the description by Riahi-Belkaoui (2004), and is the first of two variables in this indicator. This study has reviewed non-recurring gains, and excluded any non-recurring cost based on the list of non-recurring items provided earlier. The second variable is the same as in Indicator 1, namely higher non-recurring costs than prior year. When both these variables had been achieved, it was denoted by “1” and when none or merely one variable was fulfilled the denotation “0” was used.
3.3.4 Indicator 3 - Replacement of CEO
This indicator is inspired by the studies conducted by Iatridis and Senftlechner (2014) and Masters-Stout et al. (2008) regarding whether CEOs carry out GWIs more intensively dur-ing their first three years of tenure. Both studies reviewed replacements of CEO and GWIs, whereas this study look at replacement of CEO and non-recurring costs. By using non-recurring costs instead of merely GWIs a wider set of costs are exposed and examined, further capturing more areas of possible use of a big bath strategy.
5 Adjusted EBIT denotes earnings before interest and taxes where non-recurring and special factors have
been excluded. In other words; operating profit excluding non-recurring items.

26
Further, Iatridis and Senftlechner (2014) as well as Masters-Stout et al. (2008) analysed data for three years following a CEO replacement while this study review solely the year of re-placement. In the wake of this, this indicator’s first variable is considering the replacement of a CEO. This study has reviewed whom the annual reports or corporate web pages refer to as the CEO and if there was a change from the prior year. However, no attention has been paid to why the replacement occurred or whether the replacement was an inside or outside recruitment. The second variable in this indicator is the same as the second variable in Indicator 1 and Indicator 2; higher non-recurring cost than prior year. As with the two previous indicators, when both variables has been fulfilled it has been denoted “1” and when none or merely one variable had been fulfilled it was denoted by “0”.
3.3.5 Indicator 4 - (GWI÷Total Assets)>1%
Elliott and Shaw’s (1988) study is defining a big bath as a write-off, reported as a non-recurring or special item in the financial statements, which is representing more than 1% of the book value of assets. The modification made earlier imply that the GWI, as stated in the consolidated financial statements, is used to identify companies that have made im-pairments influencing the total assets by more than one percent. This one percent thresh-old is used by Elliott and Shaw (1988) and implies a considerable effect on total assets. The amount of GWI has been divided by the amount of total assets, as stated in the con-solidated statement of financial position. When the quotient of this division is more than one percent, this indicator is considered fulfilled and denoted by “1”. When the quotient is less than one percent, this indicator is assigned “0” and considered not fulfilled.
3.3.6 Indicator 5 - Negative Result
Chao et al. (2004) proceeded from the big bath hypothesis and defined a potential big bath as when a company experience below normal earnings. Since below normal earnings was defined as negative earnings or lower than prior year’s earnings, and Indicator 1 concerns lower earnings than prior year, this indicator will identify negative operating earnings as a potential big bath strategy. To identify the year end result the study used the reported profit or loss before taxation as stated in the consolidated income statement. Using profit or loss before taxation decrease the risk of using data that has been influenced by various taxation rules and laws in the dif-ferent countries, as they may vary. When a company reported a loss before taxation the indicator was considered fulfilled and denoted “1”. Consequently, when there was a reported profit before taxation, the indicator has not been considered fulfilled and thereby assigned “0”.

27
3.3.7 Currency Translation
All non-euro currencies have been translated into euros using the exchange rate assump-tions in Appendix 1.
3.3.8 Quality of Method
This section present the reliability and validity of the technique used in this study as it is considered important to assess the degree of faithfulness of the collected data (Burn, 2000).
3.3.9 Reliability
In order to achieve a higher level of reliability, the study contains data from more than one year. The desirable outcome of the time frame was to observe more than one occasion and thereby find indications of the industry as a group. The purpose of analysing the industry instead of each company individually will give a higher degree of reliability since each goodwill-treatment will cause a smaller effect on the result.
3.3.9.1 Critique of Method
Using a cross-sectional design gives the opportunity to review the pattern of association of the chosen variables. However, to review a causal relationship, does “A” cause “B” or vice versa, is not feasible through a cross-sectional design. Nor is it possible to examine if the investigated variables relationship is caused by an outside variable. According to Bryman (2012), the reason for this is the lack of the qualities that an experimental design has, which use one independent variable and thereafter add dependent variables to examine causal re-lationship.
This study did not utilise a database when collecting data, as the perspective of this study allowed solely publicly available information whereas access to databases are often restrict-ed by the use of passwords and the need to pay for such service. A database include data that has been retrieved in a homogeneous manner hence are including the same type of da-ta for different companies. That could make the data more unified and comparable, as of now there is a risk of omitting relevant data unintentionally. In order to reduce the risk of non-comparability, the list of non-recurring items presented in Table 2.1 has been used as reference.
Furthermore, this study did not differentiate between companies based on their financial year and therefore also include companies with broken financial year. The disadvantage of mixing companies with different financial year is that circumstances in the surroundings, e.g. a financial crisis, might then affect annual reports differently. Hence, the comparative-ness within the sample might decrease. Moreover, one of the study’s main objectives was to include companies from different European countries, which also could interfere the com-parativeness. One example could be that an e.g. financial crisis might affect different coun-tries at different points in time or of varying severity. Nevertheless, to include a representa-tive picture of the European telecommunication service industry, all companies regardless of financial year end were included.

28
When collecting data on Indicator 3, Replacement of CEO, this study paid no attention to whether the new CEO were an inside or outside recruitment, merely if a replacement took place. Further, the study solely focused on the year of replacement and made no reviews regarding if the new CEO recognised higher non-recurring costs during the preceding years. In comparison to previous studies, which included the three preceding years, there is a risk of missing a big bath performed in the years following a replacement.
3.3.10 Validity
In order to reach a high level of validity, meaning how well the results capture the reality, the industry census was used. Therefore, all 23 telecommunication companies comprised in the index were the starting-point for reviewing potential big bath behaviour. The study has applied the audited annual reports in order to assure a higher level of accuracy and thereby validity. Another reason for using the audited annual reports was to presuppose the per-spective of external stakeholders and hence the study is based on publicly available infor-mation. In order to find big baths, all indicators used in this study were derived from theories and previous research and used as benchmarks. The explanation for the use of more than one measurement was to increase the validity, since further probability of revealing big bath was obtained thereby. Moreover, to combine modified definitions by Elliott and Shaw (1988) and Chao et al. (2004) with the characteristic variable of each indicator gives an opportunity to an explicit indication since all of them results in a distinct affirmative or rejection of big bath accounting. The data in the study is collected within the timeframe of 2009-2015. However, there is awareness of that the year of 2009 might not be representative due to the financial crises during 2007-2008. This is an example of affection of the external validity, which according to Bryman (2012) is how well the sampled data comport with in the long run. Since the economic regression might affect the overall performance of the companies and thereby do not give a fair view of the industry. However, this timeframe gives an opportunity to ob-serve trend changes. Since the data collection for the main research question is based on the answers of the sub-questions, what is mention above concerning their validity applies for the main research question as well.
3.3.11 Critique of References
The annual reports used in this study have been prepared by the companies themselves and are therefore not considered objective. However, several external parties such as auditors, tax agencies, shareholders, and governmental bodies are involved in the monitoring of an-nual reports in one way or the other. This puts pressure on companies to prepare proper reports and since the quality of the reports need to be assured by external auditors, these reports are in general considered reliable.

29
Bryman (2012) write about methodological issues and differentiate between quantitative and qualitative research strategies. The choice between these two strategies is dependent on the nature of the research question, and during some circumstances a combination of the two is preferred (Bryman, 2012).

30
4 Empirical Findings This section summarise the empirical findings of the study. For more data, please see Ap-pendix 2 and 4 for sub-question 1, “How has big bath accounting changed over time?”. For sub-question 2, “How has impairment of goodwill changed over time?”, see Appendix 3 and 4.
4.1 How has Big Bath Accounting Changed over Time? Graph 4.1 and Graph 4.2 show different graphics of how the fulfillment of the study’s dif-ferent big bath-indicators has changed over time, and will therefore be used in answering the first sub-question of how big bath accounting has changed over time. As can be seen in Graph 4.1 the lowest number of fulfilled events is 0, scored in 2010, 2013 and 2015, while the highest is 8, scored in 2012. Furthermore, the maximum number of fulfilled events, meaning if all possible big bath events were achieved, is 480. In this study, there exist evi-dence for fulfilling 79 out of them, which represents 16% out of the maximum number.
Graph 4.1 Fulfilled big bath-indicators over time
Graph 4.1 shows the number of fulfillments by each indicator over the time frame of 2010 to 2015. This graph is used as a reference when presenting the findings on each indicator as presented in its respective section below. The x-axis represent the years from 2010 to 2015 and the y-axis represent the number of fulfillments of the indicators. To illustrate how to interpret the graph; Indicator 4 has been fulfilled 8 times in 2012 whereas in 2014 and 2015 it has been fulfilled 1 time respectively.
4.1.1 Non-recurring Cost
Indicator 1, 2, and 3 all share the same second variable; namely higher non-recurring cost than the prior year, meanwhile Indicator 4 and 5 compose other measurements. However,
0
1
2
3
4
5
6
7
8
9
2010 2011 2012 2013 2014 2015
NO. O
F FU
LFILLED INDICA
TORS
Big Bath-‐Indicators over Time
Indicator 1 Indicator 2 Indicator 3 Indicator 4 Indicator 5

31
focusing on Indicator 1, 2, and 3 in Graph 4.1 one can observe that even though they share the same second variable they render various patterns. Indicator 1, Bad Result, increases be-tween 2011 and 2012, as well as 2013 to 2014 and decreases the other years. Meanwhile, Indicator 2, High Gain and High Cost, increases between 2010 and 2011, as well as 2013 and 2014 and decreases the other years. These two indicators share the same number of ful-filled events in 2014 and 2015, and therefore show unified lines in that timespan. The third indicator, Replacement of CEO, share almost the same pattern as the second indicator regard-ing decreases and increases but scores overall lower numbers of fulfillments than the other two indicators. Table 4.1 show the percentage of how much of the non-recurring costs are represented by GWIs. In 2011, the percentage of GWI represented in non-recurring costs has its peak by 73,84%, implying that almost three quarters of the non-recurring costs recognised in 2011 is due to GWIs.
Table 4.1 Percentage of GWI included in non-recurring costs
2010 2011 2012 2013 2014 2015 Percentage of GWI in non-‐recurring cost 23,10% 73,84% 55,02% 66,67% 50,63% 6,16%
Aggregated amount of non-‐recurring cost (Million €) 15 401 26 845 28 700 19 024 16 514 12 982
Regarding the aggregated amounts of non-recurring costs, there is a yearly increase from 2010 until the peak in 2012. However, the percentage of GWI included in non-recurring costs in 2012 is lower than both the preceding and subsequent year, implying that the com-panies recognise a larger part of other non-recurring costs this year. Moreover, 2015 has the lowest amount of non-recurring costs as well as lowest percentage of GWI. The de-crease in non-recurring costs from 2014 to 2015 are not proportionate to the decrease in percentage of GWI, hence implying that the non-recurring costs in 2015 are to a greater ex-tent made up by other non-recurring costs. Comparing the two rows of each year in Table 4.1, gives an idea about a pattern; when rec-ognising lower amounts of non-recurring costs, the percentage represented by goodwill al-so decrease. This is visualised through e.g. 2010, which shows the second lowest amount of non-recurring cost and the second lowest percentage of GWI. The same pattern is present-ed in 2014 as well as 2015. On the other hand, the three highest amounts of non-recurring costs bring the three highest percentages of GWI but the peak in percentage do not corre-spond to the greatest amount of non-recurring costs.
4.1.2 Indicator 1 - Bad Result
This indicator is quite stable concerning the spread of fulfilled events and reach a mean of 4 fulfillments per year. During the time span, the score varied from 3 fulfilled events in 2011 and 2013, up to 5 fulfilled events during 2012 and 2014. Hence, the indicator is expe-riencing an increase in number of fulfilments every second year, as well as a decrease every

32
second year. Furthermore, during 2010 and 2011 when all other indicators increase Indica-tor 1 decrease. Disregarding the second variable, higher non-recurring cost than prior year, this indicator showed 47 events where lower operating profit than prior year was present. This implies that not all bad results are represented in the number of fulfillments of Indicator 1, Bad Re-sult. Out of the total of 47 events facing a lower operating profit, 24 of them also shown higher non-recurring cost, representing 51,06%.
4.1.3 Indicator 2 - High Gain and High Cost
This indicator is experiencing a spread in number of fulfilled events between 2 in 2013, up to 6 in 2011. This qualifies this indicator to be the one with the biggest range between the highest and lowest scores, both in numbers and percent. Furthermore, the indicator’s mean of fulfilled events is 3,8 per year, slightly less than Indicator 1, Bad Result. Leaving the second variable, higher non-recurring cost than prior year, out of account the indicator’s first variable, higher non-recurring gains than prior year, is achieved 50 times during the time span. Furthermore, 23 events, out of these 50, also fulfill the higher non-recurring cost variable, representing 46% of the events. This demonstrates that all compa-nies with higher non-recurring gains do not recognise higher non-recurring costs.
4.1.4 Indicator 3 - Replacement of CEO
The third indicator is the one with second lowest number of fulfillments, only 7 during the entire time span, which results in a mean of 1,2 fulfilled events per year. Its lowest point was in 2013 with 0 fulfillments, and its peaks were in 2011 and 2014 with 2 fulfillments re-spectively. When the non-recurring cost variable is disregarded a replacement of CEO is carried out 13 times during time frame, which reveals that 53,85% of these replacements fulfill the se-cond variable. During 2013, the studied companies made the highest aggregated numbers in change of CEO, but none of them fulfilled the non-recurring cost variable why the score for this year is 0.
4.1.5 Indicator 4 - (GWI ÷ Total Assets)>1%
This indicator is fulfilled 19 times in total, and the number of fulfilled events differs from 1 during 2010, 2014 and 2015, up to 8 during 2012. Furthermore, from its peak in 2012 it de-clined the following years.

33
4.1.6 Indicator 5 - Negative Result
This indicator has the lowest number of fulfilled events overall, namely 5 in total. During the time span, the minimum number of fulfillment is 0 both in 2010 and 2015, while the maximum is 2 in 2012.
Graph 4.2 Total big bath-indicators per year
Graph 4.2 show the number of fulfilled indicators on an aggregated level as well as on indi-vidual level. This enables a presentation of the individual indicator’s effect on the aggregat-ed number of fulfillments. Overall, the study’s investigated companies reached as least 9 fulfilled events during 2010, where two indicators scores their lowest result, and 2013 where the other three indicators scores their lowest result. The maximum number of ful-filled events is found during 2012, were the number is 19. Hence, the difference between minimum and maximum numbers of fulfillments is 10. The aggregated mean number of fulfillments is 13 per year. Graph 4.2 also shows that the majority of indicators increase from 2010 to 2011, and 2013 to 2014. Furthermore, majority of the indicators decrease from 2014 to 2015.
4.2 How has Impairment of Goodwill Changed over Time? Table 4.2 show the percentage of GWIs over total goodwill, where total goodwill is the amount of goodwill recorded at financial year end before the impairment is deducted. The percentages are presented as per year and categorized Max Mean, Mean, and Min Mean.
Table 4.2 Overview mean percentages of impairments
2010 2011 2012 2013 2014 2015 Max Mean 3,91% 19,12% 16,67% 19,00% 8,01% 3,02% Mean 0,87% 6,15% 6,31% 4,07% 1,57% 0,66%
Min Mean 0,00% 0,00% 0,00% 0,00% 0,00% 0,00%
4 3 5
3 5 4
3 6 3
2
5 4
1
2 1
0
2
1 1
5 8
3
1
1 0
1 2
1
1
0
0 2 4 6 8
10 12 14 16 18 20
2010 2011 2012 2013 2014 2015
NO. O
F FU
LFILLED INDICA
TORS
Total Big Bath-‐Indicators per Year
Indicator 1 Indicator 2 Indicator 3 Indicator 4 Indicator 5

34
The min mean represents the mean percentage of the three lowest GWI percentages from each year respectively. This min mean is consistently 0% throughout the time frame as each year has had at least three companies not recognising any GWI. Mean represents the mean percentage of all percentages of GWIs. The mean percentage of GWIs increased from 2010 to 2011, followed by a slight increase in 2012 beyond which a decrease continued until 2015. The max mean correspond to the mean percentage of the three highest percentages of GWIs. This max mean equalled 3,91% in 2010 followed by an increase to 19,12% in 2011. The increase continued until 2013, then followed two consecutive years of decline in 2014 and 2015. The data in Table 4.3 and Table 4.4 provide information on the development of the highest rates, and lowest rates of GWIs compared to the amount of goodwill being impaired. To-gether the two graphs show that the amount of GWIs vary from 0% up to 26,18% during the time frame.
Table 4.3 Three highest percentages of GWI (Max Mean)
2010 2011 2012 2013 2014 2015 Max top 3 5,58% 25,00% 18,30% 26,18% 22,06% 6,03%
4,25% 16,62% 17,04% 24,00% 1,05% 2,21% 1,89% 15,74% 14,67% 6,81% 0,92% 0,81%
Max Mean 3,91% 19,12% 16,67% 19,00% 8,01% 3,02% By reading Table 4.3, one can see differences between the highest and the second highest percentages of impairment. The largest variance between the highest and the second high-est percentage is in 2014 from 22,06% to 1,05% respectively. This extreme value of 22,06% in 2014 increases that year’s max mean and mean whereas the most common impairment was 0%, see Appendix 3. Furthermore, there are variances between the years as well. In 2010 the highest impairment was 5,58% of total goodwill and the next year this number was 25,00%, further implying a large variance between the studied years and their highest per-centage.
Table 4.4 Three lowest percentages of GWI (Min Mean)
2010 2011 2012 2013 2014 2015 Min top 3 0,00% 0,00% 0,00% 0,00% 0,00% 0,00%
0,00% 0,00% 0,00% 0,00% 0,00% 0,00%
0,00% 0,00% 0,00% 0,00% 0,00% 0,00% Min Mean 0,00% 0,00% 0,00% 0,00% 0,00% 0,00%
Table 4.4 show the three lowest percentages of GWIs from 2010 to 2015, all which are 0,00%. This implies that there are companies that do not recognise GWIs. Due to this, the mean of the lowest rates of GWI is 0,00%, named min mean.

35
Graph 4.3 Summarised impairment of goodwill over time
The graph above, Graph 4.3, shows the different means of percentage of goodwill over time where the x-axis presents the years and where the y-axis present the percentage of GWI. This provides a summarised overview of the changes in GWI over the time period of 2010 to 2015. Since 2009 is used as a comparative year for 2010, the data collected for 2009 will not be analysed further and is not included in the presentation of the data collection.
Table 4.5 Aggregated amounts of goodwill
2010 2011 2012 2013 2014 2015
Amount of GWI (Million €) 3 557 19 822 15 791 12 683 8 360 799
Amount of Goodwill (Million €) 211 850 208 523 174 848 155 475 152 231 147 108
GWI (% of total Goodwill) 1,68% 9,51% 9,03% 8,16% 5,49% 0,54% No. of Impairments 9 9 11 7 6 6
Table 4.5 summarise the aggregated amount of GWIs, aggregated amount of goodwill prior to recognised GWIs, and the percentage of GWIs of the total goodwill. All observations are shown on a yearly basis as well as aggregated amount for the time span and the amounts are presented in million €. No consideration has been paid to neither exchange rate gains/losses nor to other adjustments of the closing balance of goodwill except for impairments. The aggregated amount of GWIs has its peak in 2011 and its lowest amount in 2015. The largest increase occurred from 2010 to 2011 with an increase of 459%, from €3 557 million to €19 882 million. The total goodwill prior to impairment started at €211 850 million and declined every year thereafter. The percentage of impairment over total goodwill shows the impairment’s effect on goodwill, for example when about 9,5% of total goodwill was impaired in 2011. That is the highest portion of GWI shown in the sample. Furthermore, the number of impairments shows a peak in 2012 with 11 impairments, fol-lowed by declining numbers for the two subsequent years and stabile numbers from 2014 to 2015. In total, 48 GWIs were recognised from 2010-2015. The percentage of GWI has its peak in 2011, which is not the same year as the highest number of impairments. Alt-hough the first two years has the same number of impairments, the total amount of GWI varies. Moreover, all companies within the sample carry goodwill in their financial state-ments throughout the time frame.
0%
5%
10%
15%
20%
25%
2010 2011 2012 2013 2014 2015
IMPA
IRMEN
T OF GO
ODW
ILL
Percentage Impairment of Goodwill over Time
Max Mean Mean Min Mean

36
4.3 How Do Companies Utilise Big Bath Accounting When Recognising Impairment of Goodwill?
Graph 4.4 visualise how big bath-indicators as well as GWIs has change over time, where the number of fulfilled events is measured at the left axis and the impairment in percentage is shown at the right axis. Furthermore, this graph is used when answering the main re-search question; “How do companies utilise big bath accounting when recognising impairment of good-will?”.
Graph 4.4 Change over time, big bath-indicators and impairment of goodwill
Graph 4.4 shows that the year of 2010 achieves a low score in fulfilled big bath events, as well as a low mean value concerning percentage of GWI. Additionally, the max mean is low which signals that no company recognised great GWIs during this year. There is a fairly large increase in all parameters from 2010 to 2011. As can be seen in Graph 4.4, all parameters increases except for the indicator including operating earnings, namely Indicator 1, Bad Result. Thereafter, between 2011 and 2012, the mean show a slightly increases from 6,15% to 6,31% while the max mean decrease and the big bath-parameter in-creases to its maximum level. From 2012 to 2013, the aggregated amount of fulfilled big bath-indicators decrease to one of its lowest levels, while the mean of impairments decreas-es slightly. Further, the max mean increases to a level almost as high as its peak year of 2011. In 2014, both mean impairment-parameters decrease while the big bath-indicators increas-es. This is caused by the increase of the three first indicators since Indicator 4, (GWI÷Total Assets)>1%, decreases to one of its lowest point and Indicator 5, Negative Result, stay steady and low. The following year, 2015, the two mean impairment-parameters reach their overall lowest points, while the big bath-indicators reach their second lowest aggregated number of fulfillments. In comparison to the year of 2014, all indicators decrease except from Indica-tor 4, (GWI÷Total Assets)>1%, which stay equal.
0%
5%
10%
15%
20%
25%
0
5
10
15
20
2010 2011 2012 2013 2014 2015
IMPA
IRMEN
T OF GO
ODW
ILL
NO. O
F FU
LFILLED INDICA
TORS
Change over Time, Big Bath-‐Indicators and Impairment of Goodwill
Indicator 1 Indicator 2
Indicator 3 Indicator 4
Indicator 5 Max Mean of Impairment of Goodwill
Mean of Impairment of Goodwill

37
5 Analysis The following section present an analysis of the data collected in this study, and is based on theories, studies, and research presented in chapter 2. The outline of the analysis is as fol-lows: it starts by analysing the findings connected to sub-question 1, “How has big bath ac-counting changes over time?”, followed by an analysis of the findings concerning sub-question 2, “How has impairment of goodwill changes over time?”, and lastly the analysis of the main research question, “How do companies utilise big bath accounting when recognising impairment of goodwill?”, is presented.
5.1 Analysis of the Big Bath-Indicators The big bath-indicators of this study will be analysed separately in its respective section be-low. Starting with the non-recurring costs, followed by each indicator, and ending with concluding remarks regarding the analysis of the big bath fulfillments.
5.1.1 Non-recurring Costs
Non-recurring costs has been retrieved on the basis of the list provided by Elliott and Shaw (1988) as well as IAS 1.97-98, listed in Table 2.1. As Table 4.1 show, there is a range from 6,16% to 73,84% of GWI included in non-recurring costs, implying a yearly variance. Its peak is found in 2011, which also shows the second highest aggregated amount of ful-filled big bath-indicators. The simultaneous high amounts of GWI and big bath fulfillments would imply that the GWI has contributed to the fulfillments as the indicators’ second var-iable include non-recurring costs thus also GWI. Indicator 4, (GWI÷Total Assets)>1%, in-clude the GWI as a vital part of its definition hence are not affected by the non-recurring cost merely the impairments as such. Whereas the GWIs are present throughout the time frame it has influenced the fulfillments of Indicator 4. The non-recurring costs are not af-fecting Indicator 5, Negative Result, as this indicator is based on the big bath hypothesis used by Chao et al. (2004). Further, the non-recurring costs are affecting the fulfillments of the majority of indicators as the second variable of Indicator 1, 2 and 3 indicate higher non-recurring costs than prior year, and also Indicator 4 since it comprise GWI. Sikora (1999) describe big bath as non-recurring costs that cumber the current period. Likewise, this study has found that non-recurring costs are present and could be used as tools to manage profits thus also big baths, and these costs are further subjective as to what should be classified as non-recurring. The problem of defining non-recurring items has been recognised by FASB (2015), which could have impacted the non-recurring costs rec-ognised by the companies in the sample. Non-recurring costs consist of several different components, explaining why the share rep-resented by GWIs varies through the time span. The highest amount of non-recurring costs is found in 2012, which also comprise the highest number of fulfilled big bath-

38
indicators. Therefore, the high amount of non-recurring costs in 2012 could explain the low big bath score in 2013. These high costs in 2012 interfere fulfillment of the second var-iable, higher non-recurring costs than prior year, in 2013 resulting in lower fulfillments of the indicators using that second variable. This makes 2013 seem as a year where less big baths were achieved whereas it is most likely due to obstruction of fulfillments due to the definitions used in this study. Furthermore, the findings shows that years with a larger share of GWI in non-recurring cost, also has a higher aggregated amount of goodwill, and vice versa. This implies that other components of non-recurring cost are kept stable through the time span. The possi-ble explanation for this could be that GWIs are used to adjust a result, and thereby conduct a possible big bath. However, the sections below present elaborated analyses of non-recurring costs in connection to the respective indicator.
5.1.2 Indicator 1 - Bad Result
Looking at the data on Indicator 1, Bad Result, there are at least some fulfillments each year indicating the occurrence of higher non-recurring costs in connection to lower operating profit. In accordance with prior studies proving big baths as practiced methods outside of Europe, e.g. Jordan and Clarke (2004), this study show that big bath also exist in the Euro-pean telecommunication industry. This would imply that there is no difference in the big bath behaviour based on the use of e.g. US GAAP or IFRS. The operating profit used as one of the variables in this indicator could be assumed to be stable as the core activities do not materially fluctuate. As this indicator is based on two variables, its fulfillment imply that companies in the sample have recognised higher non-recurring costs while also experienc-ing lower core earnings. However, both variables have been applied in absolute numbers, meaning that differences may or may not be material. A slightly lower level of operating profit does not necessarily promote a big bath, but in this study, that aspect has not been elaborated further since the definition of the indicator do not account for such aspects. The mean amount of fulfillments of this indicator is 4, which is higher than the other two indicators using two variables. This implies that the occurrence of realising more non-recurring costs than prior year is more often accomplished together with a lower operating result. An explanation for this behaviour might be the management's belief that they, nor the company, will suffer proportionately more by the extra cost added, as Jordan and Clark (2004) suggests. By realising expenses in the current year, the effect could be lower costs in the following years, which might contribute to fulfillment of a bonus plan or debt covenant (Watts & Zimmerman, 1986). Further, this argumentation complies with earning manage-ment, which imply that there exist incentives for private gains (Riahi-Belkaoui, 2004). As the empirical findings show, the sample of companies experienced lower operating earnings than prior year 47 times from 2010 to 2015. Furthermore, 24 of these also fulfilled higher non-recurring cost, hence resulting in fulfilling Indicator 1. This implies that more than 50 percent of the events with lower operating earnings are associated with higher non-
39
recurring cost. This indicates that lower operating earnings could trigger a company to conduct a big bath by recognising higher non-recurring costs.
5.1.3 Indicator 2 - High Gain and High Cost
Riahi-Belkaoui (2004) states that companies may pursue strategies where they recognise higher amounts of costs when they experience higher non-recurring gains. This can be seen as an income smoothing strategy and tendencies of these can be found in some cases in this study. The non-recurring gains are in various degrees offset by non-recurring costs and thereby lower the reported result, hence also affect tax paid. Hepworth (1953) studied mo-tivations for income smoothing and stated the most compelling motivation to be the exist-ence of tax levies based on income. The motives behind the recognition or offsetting of non-recurring gains in the sample of companies have not been studied further but the ful-fillments of this indicator imply that there are patterns of such behaviour. Further, Kirshenheiter and Melumad’s (2002) study suggest that smoother earnings is favourable for the management as it could inter alia create stability and trustworthiness. Hence, that cre-ates incentives for pursuing such strategies. A consequence of smoother income caused by the big bath-scenario portrayed by Indicator 2, High Gain and High Cost, could be lower tax payments since the gains are offset. Since Hepworth (1953) argues that this is the primary motive of big bath, it is feasible that this is an existing motive among the telecommunication industry. This could imply a deviation from the stakeholder theory which emphasis relevance of all parties with an interest in the company, including the government (Freeman & Reed, 1983). Further, this indicator holds the largest difference in number of fulfilled events from year to year, both in absolute numbers and percentage. This indicator is based on non-recurring gains, in contrast to operating profit, why its infrequent nature contributes to the variety of fulfillment. Furthermore, the high number of fulfilled events in 2011 might be connected to the high amount of GWI conducted that year (Graph 4.4), hence higher amounts of GWI increases the non-recurring cost and therefore fulfilling the second variable. On the other hand, this assumption does not comply with the year of 2014, since the GWI-parameters shows one of its lower scores. The data from 2014 would instead imply a larger share of other non-recurring cost or higher non-recurring gains. The suggestions men-tioned above find support in Table 4.1, since the share of GWIs in non-recurring cost are 74% in 2011 and lower, 51%, in 2014. Isolating the variable of higher non-recurring gains than prior year, show an amount of 50 events during the time span of 2010 to 2015. On the other hand, merely 23 of these 50 events are represented in the fulfillments of Indicator 2, High Gain and High Cost. This is due to the second variable, higher non-recurring costs than prior year, restrict all high gains to be shown. This indicates that the non-recurring cost has a restricting impact on the ful-fillment of this indicator. Conclusively, the findings connected to this indicator shows that 46% of higher non-recurring gains are recorded simultaneously as a company record higher

40
non-recurring costs than prior year. This can be seen as an income smoothing strategy ap-plied by slightly less than half of the companies with non-recurring gains.
5.1.4 Indicator 3 - Replacement of CEO
Indicator 3 includes replacement of CEO followed by higher non-recurring cost. The data retrieved from the sample denote that this indicator is the second least fulfilled indicator throughout the time frame. During the studied time frame, 13 CEO replacements took place implying that this phenomenon does not occur on a frequent basis as the maximum possible replacements equals the 96 observations. Since its fulfillment depends on two vari-ables, replacement of CEO and higher non-recurring cost than prior year, not all replace-ments are represented in the number of fulfillments. Out of the 13 CEO replacements 7 are followed by higher non-recurring costs, thus representing the number of fulfillments of Indicator 3. This study thus finds that 53,85% of the CEO replacements are connected to higher costs, which could indicate the occurrence of a big bath. That makes this indicator the most fulfilled in connection to the fulfillment of the first variable since indicator 1 and 2 both score lower percentages, 51,06% and 46,00% respectively. The findings concerning this indicator are in line with the findings by Pourciau (1993), which found connections of recognition of certain non-recurring costs and replacement of CEO. However, in absolute numbers, this indicator is far from the most represented indi-cation of big bath among the studied companies. One possible explanation for this could be, as mentioned earlier, that replacement of CEO is not a recurring phenomenon and that the second variable hinder the full amount of CEO replacements to be represented. How-ever the variables are in line with the definition of Indicator 3 thus compose the rightful representation of a big bath. Motives behind the recognition of higher non-recurring cost during the first year of tenure are not part of this study. However, possible motives are presented by Watts and Zim-merman (1986), providing hypotheses of involvement of bonus plans, effects on the debt-equity ratio, and that size of the firms affects the management’s choice of accounting poli-cies. Further, Masters-Stout, et al (2008) state that managers in their early years as CEO recognise more impairments than their predecessor in order to present themselves in better daylight, to blame the predecessor of bad management and as from that point seem as they have improved the earnings of the company. This study find indications of this behaviour whereas mentioned above, the motives are not studied further.
5.1.5 Indicator 4 - (GWI÷Total Assets)>1%
Indicator 4 is the most frequently fulfilled indicator when looking at its fulfillments in abso-lute numbers. One possible explanation is that this indicator, in comparison to Indicator 1, 2, and 3, does not depend on the fulfillment of two variables. The previous indicators could in this sense be hindered from fulfillment in a different way than this indicator. Fur-thermore, Elliott and Shaw (1988) designed their definition to measure write-offs as 1% of

41
assets to be indication on a big bath, whereas this study utilise GWI as 1% of total assets. This measurement indicated that when managers decide to recognise an impairment that is at least one percent of total assets, it is considered a big bath. The highest amount in fulfillment of Indicator 4 is found in 2012, the same year as the mean percentage of GWI peaks. Showing that increases in GWI cause the fulfillment of this indicator as the numerator increase in proportion of the denominator used in the defi-nition of indicator 4. Furthermore, a reason for these relatively high numbers of fulfill-ments could be an industry specific feature. Telecommunication companies are known to be goodwill intensive (Duff & Phelps, 2015), and their 20% goodwill ratio to total assets compared to the European average of 3,5% confirm the statement above.
5.1.6 Indicator 5 - Negative Result
Lastly, Indicator 5 concerns a reported negative result and is the least fulfilled indicator due to the low number of events where the companies reported a loss. During the time frame, solely 5 fulfillments took place. This indicator is to some extent related to Indicator 1, Bad Result, as they are both influenced by the study made by Chao et al. (2004). However, Indi-cator 1 and 5 measure different variables and should not be seen as similar. The negative results presented are not by themselves an indicator of big bath behaviour. This indicator is, in line with the definition used by Chao et al. (2004), based on the big bath hypothesis stating that corporations recognise costs when they already experience below normal earn-ings. Furthermore looking at negative earnings as an indication of below normal earnings, where normal earnings are considered to be at the same level as the prior year, this indica-tor does not provide more information on actions taken to utilise a big bath. Solely based on the big bath hypothesis there are indications that this definition of big bath occur.
5.1.7 Concluding Remarks
The agency theory suggests that different incentives from the principal (owner) and the agent (manager) could exist. This is the example of the agency problem since the two par-ties might have different goals and incentives for the company. In this case, the agent strive for maximizing one’s wealth by e.g. reaching a future bonus plan, while the principal might strive for maximum distributed profits this year and there by maximizing one’s wealth. This agency problem could explain how it is possible for managers to utilise big baths. This is facilitated by the information asymmetry that arise due to the separation of ownership and control as the control lies with the management, thus they possess the largest amount of in-formation in connection to their expertise (Coase, 1937; Fama & Jensen, 1983a, 1983b; Jensen & Meckling, 1976). Shleifer and Vishny (1997) explain that there might exist differ-ent interests from the owners and the managers, where the managers’ interests sometimes prevail the interests of the owners. The positive accounting theory assumes that individuals’ incentives are to maximise one's wealth, which in some cases are the wealth of managers. Furthermore, if there exists other incentives to conduct big baths, such as future achieve-ment of bonus plans schemes, there are additional possibilities for a big bath to be exer-
42
cised (Watts & Zimmerman, 1986). However, the years with peaks of fulfilled indicators suggest that these are years when big baths have been accomplished, which could indicate the existence of previously presented incentives. When a big bath is conducted, the incentives might not always be intentionally criminal but as Riahi-Belkaoui (2004) state, misapplication of accounting policies and hiding the result of bad choices by management could be classified as accounting fraud. It is possible that managers could commit accounting fraud in the pursuit of a big bath, meaning that they could present an incorrect image of the company. Recognising large amounts of costs in order to achieve goals of self-interest should not be tolerated in corporations, still they exist and could therefore not be eliminated as incentives of the big baths conducted in this study. Moreover, Chao et al. (2004) study suggest that management more frequently conduct big baths during bad times than income smoothing during good times. This is confirmed as Indicator 1, Bad Result, is more often fulfilled than Indicator 2, High Gain and High Cost. However, the difference is marginal which questions the statement by Chao et al. (2004). Houlihan Lokey (2012) and Duff & Phelps (2014, 2015) showed that the economic forces in the European market affected the result of their studies as uncertainties caused larger amounts of impairments. As GWI affect the fulfillments of the majority of indicators, due to its contribution to the amount of non-recurring costs, it is possible that its trends have an effect on the pattern of indicator fulfillments. This indicates that increases in aggregate amounts of fulfillments should increase when economic uncertainties prevail, namely 2011-2012 (Duff & Phelps, 2014, 2015; Houlihan Lokey, 2012). Contradictory, the aggregate amount of fulfilled indicators should decrease as the economy is stabilised, namely 2013-2015 (Duff & Phelps, 2014, 2015; Houlihan Lokey, 2012). Since this is in line with the re-sult of this study, see Graph 4.2, it is reasonable to interpret big bath behaviour as follow-ing the economic trend in Europe.
5.2 Analysis of Impairments of Goodwill Previous research has shown that GWI tests are subjectively performed as managers’ own expectations influence components of the test. Avallone and Quagli (2015) found evidence of this, which further could have influenced the tests carried out in the sample of this study as well as explaining the variation in GWI. However, the purpose of this study does not re-volve around the actual impairment test, hence the underlying assumptions of impairment tests have not been studied, but nevertheless it could have had influence on the GWIs. The amount of GWIs vary greatly within the time frame, from €799 million up to €19 822 million, which indicate that certain years provide additional circumstances which trigger impairment tests. The variation in company size within the sample is also seen affecting the amount of GWIs as the major companies, e.g. Vodafone, impair much higher amounts compared to the smaller corporations. Hence when the major companies does not recog-

43
nise impairments the total amount of GWI decrease, as seen in 2015 which is the only year when Vodafone did not recognise any impairment. When the market is experiencing periods of economic uncertainty, the expectations regard-ing assets future cash flows are likely to decrease, which increase the possibility of impair-ments to be made (Duff & Phelps, 2015). The study conducted by Duff & Phelps (2015) suggest that a decrease in the European market aggregated amounts of GWIs in 2014 is consistent with the economic growth in Europe at that time. This is in line with the find-ings of this study as there is a decrease in aggregated amounts of GWIs from €12 683 mil-lion in 2013 to €8 360 million in 2014. This economic trend could further explain the low amount of GWIs in 2015, €799 million, suggesting that the economy is becoming more stable. This study shows the two years of greatest aggregated amounts of GWIs to be 2011 and 2012, which is also consistent with the findings by Duff & Phelps (2015). In 2011, the aggregated amount of GWI increased by 459% from 2010, a distinct increase which can be explained by an acceleration in the European sovereign debt crisis (Duff & Phelps, 2015). Duff & Phelps (2015) argue that the effect of such crisis is reflected in the amount of im-pairments due to the worsened future prospects, which also affect components in the im-pairment test resulting in impairment losses. When GWIs are executed the corporation must disclose information about the impairment test and the estimations used (IAS 36.134-135). The requirements for disclosed information is not as detailed as to incorporating the calculations or explicit reasoning for ending up with the estimations used in the test. Since there is no specific need for managers to dis-close detailed information regarding their line of reasoning, merely the estimations and pa-rameters used, they are able to justify their impairments by following the standard. This could trigger further incentive to recognise great GWIs as the real motives could be con-cealed. Devalle and Rizzato (2012) concluded that the mandatory disclosures required by IAS 36 are vague and of poor quality among European companies. This strengthens the risk of concealed motives within the sample of companies in this study whereas there is no clear evidence of its occurrence. Since Detzen and Zülch (2012) state that the definition of goodwill is vague, and likewise as Johnson and Petrone (1998) recognise various components of goodwill, there is head-room for managers to make the decision to impair without clearly expressing their motive. The complexity of goodwill makes it harder for external parties to grasp its full context, which is a problem in large companies as their goodwill possibly include a greater variety of elements than in smaller companies. The strategy to disclose information to the extent that it satisfies stakeholders without revealing doubtful parameters is a way for companies to at-tract cheaper funding (Ho & Wong, 2001). By disclosing information the companies are able to portray themselves as more transparent and trustworthy, hence receive the trust from external stakeholders. The efficient market hypothesis included in positive accounting theory (Watts & Zimmer-man, 1986) assumes markets to be efficient and that prices reflect all available information.

44
On the basis of this, information provided regarding the impairment tests is reflected in the market price of the company's shares. However, if information is vague and subjective es-timates have been used then such information is not available for external parties thus not reflected in the share price. This indicate a risk of a different share price if all information were available, which provide incentives for managers to carefully select which information to disclose since the share price thereby could be improved.
5.3 Analysis of How Companies Utilise Big Bath Accounting When Recognising Impairment of Goodwill
There is an increase in all parameters from 2010 to 2011, with the exception of the indica-tor for operating income as represented by Indicator 1, Bad Result. The reason for the in-crease could be the distinct increase in GWIs, since the impairments is a part of the second variable; non-recurring cost. Moreover, a high amount of non-recurring cost is also found in 2012 and could explain the low number of fulfilled indicators in 2013 since non-recurring costs did not exceed this peak in 2012, hence do not fulfill the second variable. The percentage of GWI comprised in non-recurring cost of this year suggest that it has af-fected the fulfillment of those indicators, where this effect could be what is desired by the management in order to utilise a big bath (Dai, Mao & Deng, 2007; Giner & Pardo, 2015; Masters-Stout et al., 2008). As shown in Table 4.1, the amount of GWI included in non-recurring costs varies from 6,16% to 73,84%, implying that the impact of GWI on the in-dustry’s reported profits also varies. The peak of fulfilled indicators in 2012, as shown in Graph 4.4, does not coincide with the peak of the amount of GWI included in non-recurring cost neither with the max mean percentage of GWI. This implies that the largest number of fulfilled big bath-indicators does not bring the highest recognition of GWI. However, the mean GWI follows the increases and decreases of aggregated big bath-indicators with the exemption of 2014. If this is due to a correlation between GWI and big baths cannot be assessed from the graph, only the pattern of the collected data is present-ed. As the pattern of GWI more or less follow the pattern of big baths, one can assume that big baths are accomplished at the same time as GWI is recognised. Furthermore, GWI has in previous studies been positively correlated with big baths (AbuGhazaleh et al., 2011; Giner & Pardo, 2015), further suggesting that both these parameters increase simultaneous-ly. The managers possess control and extensive information regarding the company, its assets and the economic limitations and potential. Since both GWI and big baths are a result of actions taken by managers there is a possibility for them to utilise both simultaneously. Both GWIs and big baths could be exercised in connection to the information asymmetry, created by the separation of control and ownership as stated in the agency theory (Coase, 1937; Fama & Jensen, 1983a, 1983b; Jensen & Meckling, 1976). Giner and Pardo (2015) concluded that managers use GWIs to accomplish a desired level of income, as the deci-sion to impair goodwill brings greater costs, which could be used to accomplish a big bath. Managers’ controlling position prevail the owners’ effect on the decision-making process,

45
which could result in the owners’ interests being neglected. The finding of this study pro-vides information of increases in the mean amount of impairments during the same years as the amount of fulfilled indicators is the greatest. This provides indications that when rel-atively high amounts of GWI are present, indicators of big bath are prominently featured. On the basis of the study by Giner and Pardo (2015) this could indicate that the companies use a strategy of utilising GWI as a way to accomplish a big bath. When comparing the mean percentage of GWI over total goodwill to the big bath-parameters, they follow the same increases and decreases in three instances (2010-2011, 2012-2013, and 2014-2015), and have a contrary effect once (2013-2014) where the im-pairment-parameters decrease and the big bath-parameter increase. To what extent their conformed pattern is a coincidence or caused by management's incentive to conduct big bath through GWI, cannot be stated.

46
6 Conclusion This study aimed at examining the pattern of association of big bath accounting and GWI, hence contributing to the discussion of the topic. To properly fulfill the purpose of this study, a hybrid of qualitative and quantitative research strategy was used. Data was collect-ed by reviewing annual reports and corporate websites, and used to answer two sub-questions. These findings were then the basis for interpretations regarding how companies utilise big bath accounting when recognising GWIs.
6.1 How has Big Bath Accounting Changed over Time? The indicators used in this study are based on different measurements and therefore indi-cate various ways of conducting a big bath, and show presence in more or less every year from 2010 to 2015. For example, it is shown that in about 50% of the cases where compa-nies experience bad results, high non-recurring gains, or replacement of CEO, they also recognise higher non-recurring cost than prior year. If this is a coincidence or a conscious choice made by the management cannot be distinguished but the fact that these circum-stances coincide is an indication of a big bath. However, big bath accounting behaviour is, on the basis of this study, following the economic trends in Europe. When economic un-certainty is reigning the indications of big baths increase, as they are lower when there is a sense of economic stability. The years 2011 and 2012 show the largest amounts of fulfilled indicators, after which the market, and thereby also the amount of fulfilled indicators, are reflecting times of less uncertainty. Based on the analysis of the empirical findings, it appears relatively more likely that big bath accounting is exercised in the European telecommunication industry than not.
6.2 How has Impairment of Goodwill Changed over Time? The variations in GWIs is most reasonably interpreted as also following the economic trends in Europe, showing that the surroundings of an entity is most likely to have an im-pact on the impairment test. When the economy experience uncertainties the aggregated amounts of GWI increase, consequently it decrease when the economy is more stable. An additional factor known as influencing the amount of recognised GWIs are the problems of complexity and vague treatment of goodwill, which further add the risk of subjective es-timates. Nevertheless, there exists a major increase in aggregated amount of GWI, from €3 557 million in 2010 to €19 822 million in 2011, corresponding to the European sovereign debt crisis Thereafter the aggregated amounts continuously decrease to its lowest amount in 2015 of €799 million. Furthermore, the GWIs has been shown to be comprised in non-recurring costs to such extent that its impact on the result is apparent, which contribute to the interpretation of its use to lower the operating income.
47
6.3 How do Companies Utilise Big Bath Accounting when Recognising Impairment of Goodwill?
The GWIs are more likely to occur during economic uncertainties as it is affected by the expected cash flows to be generated from the asset. This reflection can also be revealed through some of the study’s big bath-indicators, since an unfavourable result have been seen to trigger a big bath. Furthermore, the mutual features of both GWIs and big baths are that they both follow the economic trends and are results of decisions by managers, which increases the possibility of simultaneous occurrence. Weighing the evidence of this study, it appears most likely that the European telecommu-nication industry is utilising big bath accounting through GWIs, as they are shown to con-stitute large parts of non-recurring costs. As presented in the earlier section, the mean of GWIs and the big bath-parameters shows a similar pattern regarding increases and decreas-es. Moreover, this study together with other studies, found that impairments are conducted during economic uncertainties. In line with this, the most reasonable interpretation derived from this study is that big bath is a result of GWIs, managed through the practice of earn-ing management. The underlying incentives why managers choose to conduct a GWI is not part of this research but can be explained through theory. It might be to show a more true and fair view, in line with the purpose of IAS 36, or as the agency- and positive accounting theory suggests; to maximise one’s wealth.
6.4 Discussion Concerning the data collection and its interpretation, some potential weaknesses have been revealed. The list of unusual or infrequent items that has been used during the data collec-tion is not fully exhaustive, with respect to hidden costs. The consequences of missed items could have contributed to exclusion of some non-recurring costs. Furthermore, the defini-tions used for the big bath-indications include marginal differences in e.g. operating profit and result. Therefore quite small differences might have led to a fulfillment of an indicator, hence affected the result of the study. Regarding the findings of this study it is found that the result-based indicators namely Indi-cator 1, Bad Result, and Indicator 2, High Gain and High Cost, are the most fulfilled of the five indicators used. This could indicate that the result is an important triggering factor when performing a big bath. If this is to be interpreted as if the result is so important that extensive actions are taken in order to present a desired result, is an interesting topic for further discussions. Furthermore, something worth to comment is the context of the two least fulfilled big bath-indicators, namely Indicator 3, Replacement of CEO and Indicator 5, Negative Result. To argue that these are the most infrequent might be misleading since replacing a CEO or

48
showing a negative result do not occur as frequently as positive operating results or recog-nise a non-recurring gain. The nature behind Indicator 3 and 5 therefore hinder a high number of fulfillments. Since it is known that these variables are not as frequent, it was predicted that these two indicators would hold low number of fulfillments. Something that has been revealed through the study is the substantial impact GWIs has on non-recurring cost, which might be an industry distinction. According to Duff & Phelps (2015), the companies within the telecommunication industry has total assets consistent of more than 20% of goodwill, which is high compared to the average ratio of goodwill in to-tal assets (3,5%) among European companies. This is interesting since this could imply that the telecommunication industry might more frequently recognise GWIs than other indus-tries, thus this study could show different results if applied to another industry. Furthermore, some companies, which showed relatively large GWIs, influenced the pattern of impairments, and therefore might have contributed to a biased pattern. In this study, it was enough with just a few larger impairments to reach an overall high amount of impair-ments. The impairments made are a correct portrait of the impairments in the sample, still the amounts are not divided equally between the companies since the size of the companies are seen as affecting the amounts and number of impairments. The larger corporations comprise more complex and larger goodwill accounts than the smaller corporations, which could influence the recognition of impairment losses. It has become apparent during this study that there exists great variation in the practices used by companies when presenting information in their annual reports. This has rendered difficulties during the collection of data in the sense that similar information has been pre-sented in variously named line items and various notes. In connection to this, it has be-come evident that one need background information and economic understanding in order to comprehend the information provided by firms, and also in order to interpret and pin-point requested info. This might be a problem for the individual potential investors as the complexity of financial statements makes it more difficult to perform an adequate compari-son. Moreover, concerns regarding manipulation arose during the course of this study. Previous research has shown a concern regarding the possibilities of opportunistic behaviour that is given by the updated version of IAS 36. These concerns arise on the basis of the fact that an impairment test includes estimates regarding e.g. expected cash flows, which is deter-mined by the management. This implies that managers’ own expectations dominate the as-sets’ value in the financial statement, and therefore could be based on subjective judge-ments. On the other hand, earning management is to some extent allowed when applying account-ing standards, as it is intended to enable presentation of the actual true and fair view of the company’s economic health. This creates space for liberal interpretations and applications, which can be exploited by managers’ motives and ethical, or unethical, standing to the ex-

49
tent that an untruthful and distorted picture is provided. There still exists good earning management which has nothing to do with fraudulent accounting but when such practices become manipulative and used to deceive the users of provided information, there is great risk of harming the firm. An argumentation against the idea that IAS 36 enable GWI to be recognised in order to conduct opportunistic behaviour, is that its new version improved the quality of goodwill accounting owing to the impairment test. Support for this statement is that GWI is moti-vated by e.g. lower market values and reflecting the actual economic trends surrounding the entity. Therefore the impairments help companies to show a more true and fair view. However it is a possibility to denote such argumentation as a utopia since it disregard oth-er, more or less manipulative, motives as presented throughout this study.
6.5 Ethical Issues This study is performed with awareness of possible ethical issues, hence actions were taken in order to avoid these. All information used in this study is publicly available and conse-quently, company specific data do not contain confidential information. Company names and information are disclosed without codification since, again, this information is publicly available. Further, the study does not differentiate companies as the focus is on the indus-try as a whole. The data included in calculations and interpretations are collected by the re-searchers themselves in honesty, hence are not manipulated and can be recalled from the annual reports of each company. The viewpoint of this study, including the problem and findings, is objective since the data are not provided by another party. Furthermore, plagia-rism has not been conducted in the process of this study. Moreover, there exist ethical issues in connection to the topic of this study. As presented, the decision to conduct a big bath lies with the management of a corporation and their in-centives may vary. There is also a risk of manipulation of the accounts, which is not an ac-cepted behaviour in the world of business. Fraudulent behaviour affects many more than merely the manager in charge as there is a spillover effect onto the society surrounding the entity. The room for creativity inherent in the accounting standards is another issue in need of awareness. As of now there is no clear sanction for using this opportunity of creative ac-counting unless the standards and laws are actually violated. Managers own ethical and moral standpoint is of essence when interpreting the accounting standards, which is a risk for other stakeholders as their effect on decision-making is limited.
6.6 Societal Impact This study addresses the issue of big baths and GWI and finds that GWIs can be used as a tool to accomplish a big bath. Performing a big bath is an income decreasing strategy and when such strategies are conducted by corporations there are several parties being affected. Shareholders are affected since the dividend is lower than if the big bath did not occur. The
50
government is affected as the company is paying lower taxes. Employees are affected since it creates volatility in earnings, which could contribute to uncertainties about the perfor-mance of the company, thus the future of their employment may seem uncertain. These are not the only parties affected, merely some examples, but the impact of companies actions is still evident. Further, the complexity of goodwill enables managers to hide the real motives in vague explanation of estimates used in the impairment test. This obstructs the possibility for external stakeholder to evaluate the business since the company does not apply trans-parency. However, awareness of the issue is an initial step in the process of attending such corporate strategies. This study extends previous research on the topic of big baths in the area of the U.S to the European market, which shows that the problems arising in connec-tion to big baths found outside of Europe are possibly also present within Europe as well. Furthermore, standard setters need to be aware of the enabled of bad earning management inherit in the accounting standards.
6.7 Future Research A suggestion for further research is to conduct a similar study as this one, but to focus on another interesting industry. Areas this study did not take into consideration but neverthe-less are found to be interesting are Energy, where almost 60% of the companies recognise GWIs, and Information Technology, where 96% of the companies carry goodwill in their bal-ance sheets but merely 11% recognised impairments during 2015 (Duff & Phelps, 2015). Another interesting area would be compare different countries to each other, or even con-tinents. Is there a difference among countries in Europe concerning big baths and GWI? Is the European way of achieving big baths using GWIs handled in the same way in e.g. Aus-tralia or Asia? A further aspect could be to study if the company size has an impact on how GWIs are recognised. Do smaller companies more frequently realise GWIs as a way to achieve a big bath than larger companies? Another approach to this is to use statistical tests and measures. The advantage of this ap-proach is a minimized risk of results based on coincidence. A statistical test would also in-crease the weight of the findings, since it significance could be tested. Further, a review of which factors that influences the manager’s decision to utilise a big bath is an interesting topic for further research. For example, if a bad result has a stronger impact in the deci-sion-making process or perhaps lower tax payment is the most influential feature. Such re-search would contribute to the knowledge of potential investors regarding these ambiguous behaviours utilised by managers. A deeper research into the respective big bath-indicators and its existence on the European market would be interesting as to show the effects of such behaviour on the market. Do stakeholders react and question management? Is there an effect on the stock market? Furthermore, a possible topic for future research is how various accounting standards with-in Europe differentiate. Do companies recognise impairments to a larger extent under e.g. German GAAP than Swiss GAAP?

List of References
51
List of References AbuGhazaleh, N., Al-Hares, O., & Roberts, C. (2011). Accounting discretion in goodwill
impairments: UK evidence. Journal of International Financial Management & Ac-counting, 22(3), 165-204. doi: 10.1111/j.1467-646X.2011.01049.x
Avallone, F., & Quagli, A. (2015). Insight into the variables used to manage the goodwill
impairment test under IAS 36. Advances in Accounting, incorporating Advances in In-ternational Accounting 31(1), 107-114. doi:10.1016/j.adiac.2015.03.011
[APB] Accounting Principles Board. (1970). APB 17: Intangible Assets. United States: APB.
Retrieved February, 2, 2016 from http://www.fasb.org/cs/BlobServer?blobkey=id&blobnocache=true&blobwhere=1175820195241&blobheader=application/pdf&blobcol=urldata&blobtable=MungoBlobs
Ascarelli, S. (2002, February 18). Investors Show Little Goodwill To Telecom Firms' Write-
Offs. The Wall Street Journal. Retrieved February 5, 2016, from http://www.wsj.com/articles/SB1013975739491388080
Atlas, R. D., & Romero, S. (2002, July 22). Worldcom’s Collapse: The Overview; World-
com Files For Bankruptcy; Largest U.S. Case. The New York Times. Retrieved February 8, 2016, from http://www.nytimes.com/2002/07/22/us/worldcom-s-collapse-the-overview-worldcom-files-for-bankruptcy-largest-us-case.html
Bryman, A. (2012). Social Research Methods (4th ed.). New York: Oxford University Press. Burn, B. R. (2000). Introduction to research methods (4th ed.). London: SAGE. Chao, C., Kelsey, R. L., Horng, S., & Chui, C. (2004). Evidence of earnings management
from the measurement of deferred tax allowance account. The Engineering Econ-omist49(1), 63-93. Retrieved from http://search.proquest.com/docview/206749610/abstract/5541044DA05F49D2PQ/1?accountid=11754
Coase, R. H. (1937). The Nature of the Firm. Economica 4(16). 386-405. Retrieved from
http://www.jstor.org/stable/2626876?seq=1#page_scan_tab_contents Colley, J. R., & Volkan, A. G. (1988). Accounting For Goodwill. Accounting Horizons 2(1),
35-42. Retrieved from http://search.proquest.com/docview/208919261/fulltextPDF/4782BDA483FF4C89PQ/1?accountid=11754
Dai, D., Mao, X., & Deng, F. (2007). A research on impairment of assets in listed firms
with negative earnings in China. Frontiers of Business Research in China, 1(3), 351-364. doi: 10.1007/s11782-007-0020-1
Detzen, D., & Zülch, H. (2012). Executive compensation and goodwill recognition under
IFRS: Evidence from European mergers. Journal of International Accounting, Au-diting and Taxation, 21(2), 106-126. doi:10.1016/j.intaccaudtax.2012.07.002

List of References
52
Devalle, A,. & Rizzato, F. (2012). The Quality of Mandatory Disclosure: the Impairment of
Goodwill. An Empirical Analysis of European Listed Companies. Procedia Eco-nomics and Finance, 2, 101-108. doi:10.1016/S2212-5671(12)00069-X
Duff & Phelps. (2013). 2013 European Goodwill Impairment Study. Retrieved April 29, 2016
from http://www.duffandphelps.com/insights/publications/goodwill-impairment/2013-european-goodwill-impairment-study
Duff & Phelps. (2014). 2014 European Goodwill Impairment Study. Retrieved April 29, 2016
from http://www.duffandphelps.com/insights/publications/goodwill-impairment/2014-european-goodwill-impairment-study
Duff & Phelps. (2015). 2015 European Goodwill Impairment Study. Retrieved February 3, 2016
from http://www.duffandphelps.com/insights/publications/goodwill-impairment/2015-european-goodwill-impairment-study
Duff & Phelps. (2016). About Duff & Phelps. Retrieved February 4, 2016 from
http://www.duffandphelps.com/about-us/index Elliott, J. A., & Shaw, W. H. (1988). Write-Offs as Accounting Procedures to Manage Per-
ceptions. Journal of Accounting Research 26(3), 91-119. Retrieved from http://web.a.ebscohost.com/ehost/pdfviewer/pdfviewer?sid=14c1c247-ae16-4ef5-8038-63e2d07ef58d%40sessionmgr4001&vid=1&hid=4104
Fama, E. F., & Jensen, M. C. (1983a). Separation of Ownership and Control. The Journal of
Law & Economics, 26(2), 301-325. Retrieved from http://heinonline.org.bibl.proxy.hj.se/HOL/Page?public=false&handle=hein.journals/jlecono26&page=301&collection=journals
Fama, E. F., & Jensen, M. C. (1983b). Agency problems and residuals claims. Journal of Law
and Economics 26(2), 327-349. Retrieved from http://heinonline.org.bibl.proxy.hj.se/HOL/Page?public=false&handle=hein.journals/jlecono26&page=327&collection=journals
[FASB] Financial Accounting Standards Board. (n.d). Facts about FASB. Retrieved February
12, 2016, from http://www.fasb.org/cs/ContentServer?c=Page&pagename=FASB%2FPage%2FSectionPage&cid=1176154526495
[FASB] Financial Accounting Standards Board. (2001). Improving business reporting: Insights into
enhancing voluntary disclosures. Retrieved February 2, 2016, from http://www.fasb.org/cs/ContentServer?c=Document_C&pagename=FASB%2FDocument_C%2FDocumentPage&cid=1176156460184
[FASB] Financial Accounting Standards Board. (2002). NEWS RELEASE 10/29/02:
FASB and IASB agree to work together toward convergence of global accounting standards. [Press Release]. Retrieved from http://www.fasb.org/news/nr102902.shtml

List of References
53
[FASB] Financial Accounting Standards Board. (2015). Income Statement—Extraordinary and Unusual Items (Subtopic 225-20). Retrieved April 22, 2016, from http://www.fasb.org/resources/ccurl/147/382/ASU%202015-01.pdf
Freeman, R. E., & Reed, D. L. (1983). Stockholders and Stakeholders: A New Perspective
on Corporate Governance. California Management Review (pre-1986), 25(3), 88-107. Retrieved from http://web.a.ebscohost.com/ehost/pdfviewer/pdfviewer?sid=c7b3a3d2-cc34-4dc2-9ea4-bd6217c0f6af%40sessionmgr4001&vid=1&hid=4209
Giner, B., & Pardo, F. (2015). How Ethical are Managers’ Goodwill Impairment Decisions
in Spanish-Listed Firms? Journal of Business Ethics, 132(1), 21-40. doi:10.1007/s10551-014-2303-8
Giuliani, M., & Brännström, D. (2011). Defining goodwill: a practice perspective. Journal of
Financial Reporting and Accounting, 9(2), 161-175. doi:10.1108/19852511111173112
Hamberg, M., & Beisland, L. (2014). Changes in the value relevance of goodwill accounting
following the adoption of IFRS 3. Journal of International Accounting, Auditing and Taxation, 23(2), 59-73. doi:10.1016/j.intaccaudtax.2014.07.002
Healy, P. M. (1985). The effect on bonus schemes on accounting decision. Journal of Ac-
counting and Economics, 7(1), 85-107. doi:10.1016/0165-4101(85)90029-1 Healy, P. M., & Wahlen, J. M. (1999). A review of the earnings management literature and
its implications for standard setting. Accounting Horizons, 13(4), 365-383. Re-trieved from http://search.proquest.com/docview/208900184/fulltext/B4C9A2228F70428APQ/1?accountid=11754
Hepworth, S. R. (1953). Smoothing Periodic Income. The Accounting Review, 28(1), 32-39.
Retrieved from http://www.jstor.org/stable/241436?seq=1#page_scan_tab_contents
Houlihan Lokey. (2012). the European Goodwill Impairment Study 2012-2013. Retrieved April
28, 2016 from http://www.hl.com/email/pdf/EU_Goodwill_Impairment_2012.pdf
Ho, S. S. M., & Wong K. S. (2001). A study of the relationship between corporate govern-
ance structures and the extent of voluntary disclosure. Journal of International Ac-counting, Auditing and Taxation 10(2). 139-156. doi:10.1016/S1061-9518(01)00041-6
Huefner, R. J., & Largay III, J. A. (2004). The Effect of the New Goodwill Accounting
Rules on Financial Statements. The CPA Journal, 74(10), 30-35. Retrieved from http://search.proquest.com/docview/212331291?OpenUrlRefId=info:xri/sid:primo&accountid=11754

List of References
54
[IAS 1] European Commission. (2011). International Accounting Standard 1 - Presentation of Financial Statements. Brussels: Commission of the European Communities. Retrieved February 10, 2016 from http://ec.europa.eu/internal_market/accounting/docs/consolidated/ias1_en.pdf
[IAS 36] European Commission. (2010a). International Accounting Standard 36 - Impairment of
assets. Brussels: Commission of the European Communities. Retrieved Febru-ary 9, 2016 from http://ec.europa.eu/internal_market/accounting/docs/consolidated/ias36_en.pdf
[IAS 38] European Commission. (2010b). International Accounting Standard 38 - Intangible As-
sets. Brussels: Commission of the European Communities. Retrieved February 19, 2016 from http://ec.europa.eu/internal_market/accounting/docs/consolidated/ias38_en.pdf
[IASB] International Accounting Standard Board. (2010). the conceptual framework for financial
reporting 2010. Retrieved February 11, 2016 from http://www.ifrs.org/News/Press-Releases/Documents/ConceptualFW2010vb.pdf
IASPlus. (2015a). International Accounting Standards Committee (IASC). Retrieved February 12,
2016, from http://www.iasplus.com/en/resources/ifrsf/history/resource25 IASPlus. (2015b). International Accounting Standards Board (IASB). Retrieved February 12,
2016, from http://www.iasplus.com/en/resources/ifrsf/iasb-ifrs-ic/iasb IASPlus. (2015c.) IASB-FASB convergence. Retrieved February 15, 2016, from
http://www.iasplus.com/en/projects/completed/other/iasb-fasb-convergence
Iatridis, G. E., & Senftlechner, D. (2014). An Empirical Investigation of Goodwill in Aus-
tria: Evidence on Management Change and Cost of Capital. Australian Account-ing Review 24(2), 171-181. doi: 10.1111/auar.12014
[IFRS] International Financial Reporting Standards. (n.d.). Work plan for IFRSs: Business
Combinations. Retrieved February 15, 2016, from http://www.ifrs.org/current-projects/iasb-projects/business-combinations/Pages/business-combinations-ii.aspx
[IFRS 3] European Commission. (2011). International Financial Reporting Standard 3 - Business
Combinations. Brussels: Commission of the European Communities. Retrieved February 8, 2016 from http://ec.europa.eu/internal_market/accounting/docs/consolidated/ifrs3_en.pdf
Jensen, M. C., & Meckling, W. H. (1976). Theory of the Firm: Managerial Behavior, Agency
Cost and Ownership Structure. Journal of Financial Economics, 3(4), 305-360. Re-

List of References
55
trieved from http://www.sciencedirect.com/science/article/pii/0304405X7690026X
Johnson, L. T., & Petrone, K. R. (1998). Is goodwill an asset? Accounting Horizons, 12(3),
293-303. Retrieved from http://search.proquest.com/docview/208925623?OpenUrlRefId=info:xri/sid:primo&accountid=11754
Jordan, C. E., & Clark, S. J. (2004). Big bath earnings management: The case of goodwill
impairment under SFAS No.142. Journal of Applied Business Research, 20(2), 63-70. doi:http://dx.doi.org/10.19030/jabr.v20i2.2206
Kahneman, D. (2011). Anchors. In Kahneman, D. (Ed.), Thinking Fast and Slow. (pp. 119-
128) United States: Farrar, Straus and Giroux. Kirshenheiter, M., & Melumad, N. D. (2002). Can "Big Bath" and Earnings Smoothing Co-
exist as Equilibrium Financial Reporting Strategies? Journal of Accounting Research 40(3), 761-796. Retrieved from http://www.jstor.org/stable/3542272?seq=1#page_scan_tab_contents
Levitt, A. Jr. (1998). The numbers game. The CPA Journal, 68(12), 14-19. Retrieved from
http://search.proquest.com/docview/212249652?accountid=11754&rfr_id=info%3Axri%2Fsid%3Aprimo
Masters-Stout, B., Costigan, M,. & Lovata, L. (2008). Goodwill impairments and chief ex-
ecutive officer tenure. Critical Perspectives on Accounting, 19(8), 1370–1383. doi:10.1016/j.cpa.2007.04.002
Meek, G. K., Roberts, C. B., & Gray, S. J. (1995). Factors influencing voluntary annual re-
ports disclosures by U.S., U.K. and continental European multinational corpo-rations. Journal of International Business Studies. 26(3), 555-572. Retrieved from http://web.a.ebscohost.com/ehost/detail/detail?sid=8de1bdfc-13cf-453e-9d95-679ca401260c%40sessionmgr4005&vid=0&hid=4209&bdata=JkF1dGhUeXBlPWNvb2tpZSxpcCx1aWQmc2l0ZT1laG9zdC1saXZl#AN=9511264998&db=buh
Myddelton, D. R., Emeritus Prof. (2010, October 1). Difficulties with valuing and accounting
for goodwill. Financial Times. Retrieved February 9, 2016 from http://search.proquest.com.bibl.proxy.hj.se/docview/756037285?OpenUrlRefId=info:xri/sid:primo&accountid=11754
Nelson, M. W., Elliott, J. A., & Tarpley, R. L. (2003). How are earnings managed? Examples
from auditors. Accounting Horizons, 17, 17-35. Retrieved from http://search.proquest.com/docview/208894361/abstract/16C6CA6D8564196PQ/1?accountid=11754
Pourciau, S. (1993). Earnings management and nonroutine executive changes. Journal of Ac-
counting and Economics 16(1-3), 317-336. doi:10.1016/0165-4101(93)90015-8

List of References
56
Power, M. K. (2003). Auditing and the production of legitimacy. Accounting, Organizations and Society, 28(4), 379-394. Retrieved from http://www.sciencedirect.com/science/article/pii/S0361368201000472
Ramanna, K., & Watts, R. (2012). Evidence on the use of unverifiable estimates in required
goodwill impairment. Review of Accounting Studies 17(4), 749-780. doi:http://dx.doi.org/10.1007/s11142-012-9188-5
Rees, D. A., & Janes, T. D. (2012). The Continuing Evolution of Accounting for Goodwill.
The CPA Journal, 82, 30-33. Retrieved fromhttp://search.proquest.com/docview/923404665?OpenUrlRefId=info:xri/sid:primo&accountid=11754
Riahi-Belkaoui, A. (2004). Accounting Theory (5th ed.). Great Britain: Thomson. Rimmel, G. (2016). Kapitel 5 - Disclosureteorier, (Chapter 5 - Disclosure theory). In Rim-
mel, G. and Jonäll, K. (Eds.). Redovisningsteorier (Accounting theories) (pp. 77-88). Sweden: Sanomautbildning.
Romero, S. (2003, March 14). WorldCom to Write Down $79.8 Billion of Good Will. The
New York Times. Retrieved February 7, 2016, from http://www.nytimes.com/2003/03/14/technology/14TELE.html
Rosen, A. (2007). Cash flow myths. Canadian Business (80)6, 25. Retrieved from
http://search.proquest.com.bibl.proxy.hj.se/docview/221446821/abstract/7DF8083EA1064799PQ/1?accountid=11754
Sevin, S., & Schroeder, R. (2011). Earnings management: evidence from SFAS No. 142 re-
porting. Managerial Auditing Journal, 20(1), 47-54. doi:http://dx.doi.org/10.1108/02686900510570696
[SFAS 141R] Financial Accounting Standards Board. (2007). Statement of Financial Accounting
Standards No.141: Business Combinations (revised 2007). Norwalk, Connecticut, USA: Financial Accounting Standards Board. Retrieved February 4, 2016, from http://www.fasb.org/jsp/FASB/Document_C/DocumentPage?cid=1218220124931&acceptedDisclaimer=true
[SFAS 142] Financial Accounting Standards Board. (2001). Statement of Financial Accounting
Standards No.142: Goodwill and Other Intangible Assets. Norwalk, Connecticut, USA: Financial Accounting Standards Board. Retrieved February 2, 2016, from http://www.fasb.org/jsp/FASB/Document_C/DocumentPage?cid=1218220124961&acceptedDisclaimer=true
Shleifer, A., & Vishny, R. (1997). A Survey of Corporate Governance. Journal of Finance,
52(2), 740-748. Retrieved from http://web.b.ebscohost.com/ehost/detail/detail?sid=a893ee3a-0168-4a3d-b68d-ec117f875b19%40sessionmgr120&vid=0&hid=115&bdata=JkF1dGhUeXBlPWNvb2tpZSxpcCx1aWQmc2l0ZT1laG9zdC1saXZl#AN=9708245076&db=buh
List of References
57
Sikora, M. (1999). Timing a "big bath" to an acquisition. Mergers and Acquisitions33(6), 8-10.
Retrieved from http://search.proquest.com/docview/215911768?OpenUrlRefId=info:xri/sid:primo&accountid=11754
Statista. (2016). Leading telecommunication operators in Europe by revenue in 2014 (in million euros).
Retrieved March 4, 2016, from http://www.statista.com/statistics/221386/revenue-of-top-20-european-telecommunication-operators/
Telia Company. (2014). Telia Company Year-end Report 2013 to include one-time related items.
[Press Release]. Retrieved from http://feed.ne.cision.com/wpyfs/00/00/00/00/00/23/69/90/wkr0006.pdf
Telia Company. (2015). 2014 Annual and Sustainability Report. [Annual Report]. Retrieved
from http://feed.ne.cision.com/wpyfs/00/00/00/00/00/2C/00/91/wkr0006.pdf
Telia Company. (2016). TeliaSonera to report Region Eurasia as discontinued operations in Year-end
Report 2015 - results to be impacted by impairment charges. [Press Release]. Retrieved from http://feed.ne.cision.com/wpyfs/00/00/00/00/00/32/60/7E/wkr0006.pdf
Victor, M., Tinta, A., Elena, A. A., & Ionel, V. C. (2012). The Accounting Treatment of
Goodwill as Stipulated by IFRS 3. Procedia - Social and Behavioral Sciences, 62, 1120-1126. doi:10.1016/j.sbspro.2012.09.192
Watts, R. L., & Zimmerman, J. L. (1986). Positive accounting theory (International edt.). Eng-
lewood Cliffs, New Jersey: Prentice-Hall. Zang, Y. (2008). Discretionary behavior with respect to the adoption of SFAS no. 142 and
the behavior of security prices. Review of Accounting & Finance7(1), 38-68. doi:http://dx.doi.org/10.1108/14757700810853842

Appendix
58
Appendix 1 Foreign Exchange Rate Assumptions. All exchange rates are retrieved from http://www.oanda.com/currency/converter/
Table 1 Table 2
December 31st, Year Currency Equals € Date Currency Equals €
2015 CHF 0,92346 31-‐03-‐2015 GBP 1,36698
DKK 0,13400 31-‐03-‐2014 GBP 1,20973
GBP 1,35661 31-‐03-‐2013 GBP 1,18500
NOK 0,10452 31-‐03-‐2012 GBP 1,19855
SEK 0,10904 31-‐03-‐2011 GBP 1,13710
2014 CHF 0,83132 31-‐03-‐2010 GBP 1,11977
DKK 0,13431 31-‐03-‐2009 GBP 1,07577
GBP 1,27771 31-‐03-‐2006 GBP 1,44044
NOK 0,11040
SEK 0,10527
2013 CHF 0,81573 31-‐03-‐2015 USD 0,92152
DKK 0,13405 31-‐03-‐2014 USD 0,72707
GBP 1,19763 31-‐03-‐2013 USD 0,77999
NOK 0,11863 31-‐03-‐2012 USD 0,74965
SEK 0,11199 31-‐03-‐2011 USD 0,70927
2012 CHF 0,82799 31-‐03-‐2010 USD 0,74320
DKK 0,13404 31-‐03-‐2009 USD 0,75714
GBP 1,22196
NOK 0,13543
SEK 0,11606
2011 CHF 0,82163
DKK 0,13452
GBP 1,19333
NOK 0,12872
SEK 0,11198
2010 CHF 0,80205
DKK 0,13414
GBP 1,16716
NOK 0,12787
SEK 0,11120
2009 CHF 0,67218
DKK 0,13438
GBP 1,11116
NOK 0,12008
SEK 0,09693

Appendix
59
Appendix 2 Scoreboards 2010-2015.
2015 Indicator 1 Indicator 2 Indicator 3 Indicator 4 Indicator 5
Company Bad Result
High Gain and High Cost
Replacement of CEO
(GWI ÷ Total Assets) >1%
Negative Result
Vodafone GRP 0 0 0 0 0 Deutsche Telekom 0 0 0 0 0 BT GRP 0 1 0 0 0 Telefonica 1 1 0 0 0 Orange 0 0 0 0 0 Telia Company 1 0 0 1 0 Swisscom 0 0 0 0 0 KPN 0 0 0 0 0 Telecom Italia 1 1 0 0 0 Telenor 0 0 1 0 0 Inmarsat 0 0 0 0 0 Elisa Corporation 0 0 0 0 0 Freenet 1 1 0 0 0 Cable & Wireless Communication 0 0 0 0 0
Tele2 B 0 0 0 0 0 Talktalk Telecom GRP 0 0 0 0 0 Total 4 4 1 1 0
2014 Indicator 1 Indicator 2 Indicator 3 Indicator 4 Indicator 5
Company Bad Result
High Gain and High Cost
Replacement of CEO
(GWI ÷ Total Assets) >1%
Negative Result
Vodafone GRP 0 0 0 1 0 Deutsche Telekom 1 1 1 0 0 BT GRP 0 0 0 0 0 Telefonica 1 0 0 0 0 Orange 0 0 0 0 0 Telia Company 0 0 0 0 0 SwissCom 0 1 0 0 0 KPN 0 1 0 0 1 Telecom Italia 0 0 0 0 0 Telenor 0 0 0 0 0 Inmarsat 0 0 0 0 0 Elisa Corporation 0 1 0 0 0 Freenet 1 0 0 0 0 Cable & Wireless Communication 1 1 1 0 0
Tele2 B 0 0 0 0 0 Talktalk Telecom GRP 1 0 0 0 0 Total 5 5 2 1 1

Appendix
60
2013 Indicator 1 Indicator 2 Indicator 3 Indicator 4 Indicator 5
Company Bad Result
High Gain and High Cost
Replacement of CEO
(GWI ÷ Total Assets) >1%
Negative Result
Vodafone GRP 0 1 0 1 0 Deutsche Telekom 0 0 0 0 0 BT GRP 0 0 0 0 0 Telefonica 0 0 0 0 0 Orange 0 0 0 0 0 Telia Company 0 0 0 0 0 SwissCom 0 0 0 0 0 KPN 1 0 0 0 1 Telecom Italia 0 0 0 1 0 Telenor 0 0 0 0 0 Inmarsat 1 0 0 1 0 Elisa Corporation 0 0 0 0 0 Freenet 0 0 0 0 0 Cable & Wireless Communication 0 0 0 0 0
Tele2 B 1 1 0 0 0 Talktalk Telecom GRP 0 0 0 0 0 Total 3 2 0 3 1
2012 Indicator 1 Indicator 2 Indicator 3 Indicator 4 Indicator 5
Company Bad Result
High Gain and High Cost
Replacement of CEO
(GWI ÷ Total Assets) >1%
Negative Result
Vodafone GRP 0 0 0 1 0 Deutsche Telekom 1 0 0 1 1 BT GRP 0 0 0 0 0 Telefonica 0 0 0 0 0 Orange 1 1 0 1 0 Telia Company 1 0 1 1 0 SwissCom 0 0 0 0 0 KPN 1 1 0 1 0 Telecom Italia 0 0 0 1 0 Telenor 0 1 0 1 0 Inmarsat 0 0 0 1 0 Elisa Corporation 0 0 0 0 0 Freenet 0 0 0 0 0 Cable & Wireless Communication 0 0 0 0 0
Tele2 B 1 0 0 0 0 Talktalk Telecom GRP 0 0 0 0 0 Total 5 3 1 8 1

Appendix
61
2011 Indicator 1 Indicator 2 Indicator 3 Indicator 4 Indicator 5
Company Bad Result
High Gain and High Cost
Replacement of CEO
(GWI ÷ Total Assets) >1%
Negative Result
Vodafone GRP 0 1 0 1 0 Deutsche Telekom 1 1 0 1 0 BT GRP 0 0 0 0 0 Telefonica 1 0 0 0 0 Orange 0 0 0 0 0 Telia Company 0 0 0 0 0 SwissCom 0 1 0 1 0 KPN 1 1 1 0 0 Telecom Italia 0 1 0 1 1 Telenor 0 0 0 0 0 Inmarsat 0 1 1 1 0 Elisa Corporation 0 0 0 0 0 Freenet 0 0 0 0 0 Cable & Wireless Communication 0 0 0 0 0
Tele2 B 0 0 0 0 0 Talktalk Telecom GRP 0 0 0 0 0 Total 3 6 2 5 1
2010 Indicator 1 Indicator 2 Indicator 3 Indicator 4 Indicator 5
Company Bad Result
High Gain and High Cost
Replacement of CEO
(GWI ÷ Total Assets) >1%
Negative Result
Vodafone GRP 0 0 0 1 0 Deutsche Telekom 1 0 0 0 0 BT GRP 0 0 0 0 0 Telefonica 1 1 0 0 0 Orange 1 0 0 0 0 Telia Company 0 0 0 0 0 SwissCom 0 0 0 0 0 KPN 0 1 0 0 0 Telecom Italia 0 0 0 0 0 Telenor 0 0 0 0 0 Inmarsat 0 0 0 0 0 Elisa Corporation 0 0 0 0 0 Freenet 0 0 0 0 0 Cable & Wireless Communication 1 1 0 0 0
Tele2 B 0 0 0 0 0 Talktalk Telecom GRP 0 0 1 0 0 Total 4 3 1 1 0
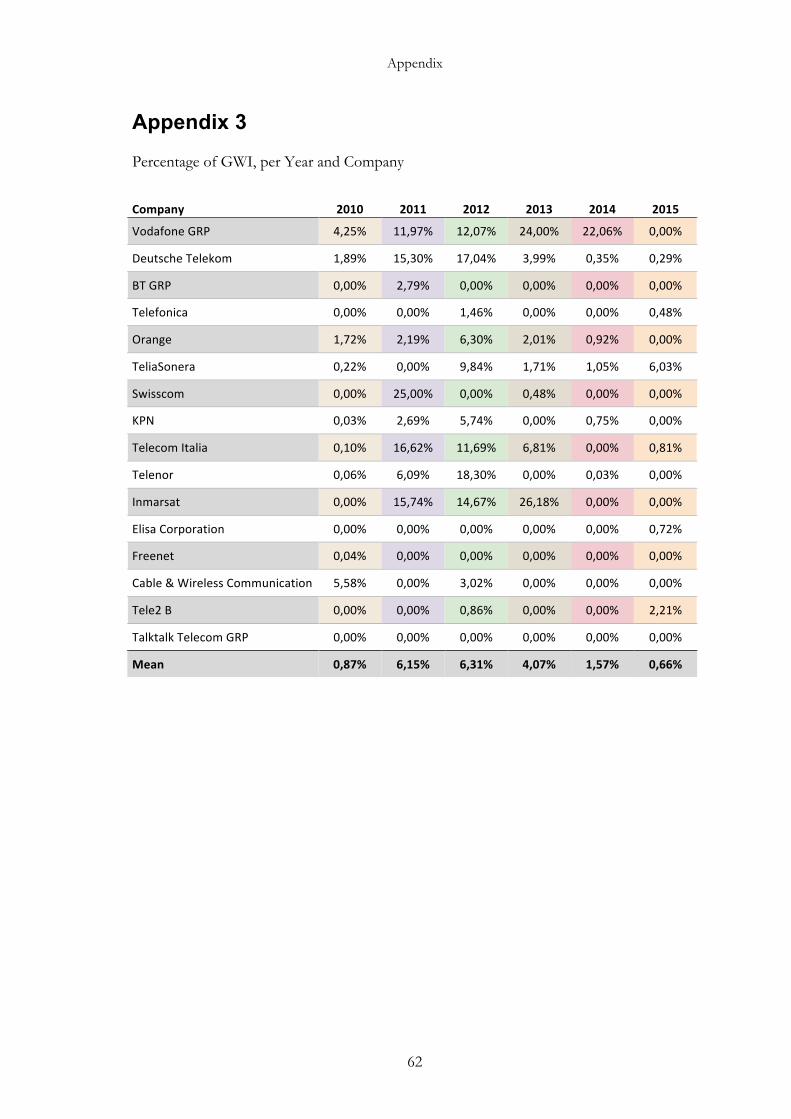
Appendix
62
Appendix 3
Percentage of GWI, per Year and Company
Company 2010 2011 2012 2013 2014 2015
Vodafone GRP 4,25% 11,97% 12,07% 24,00% 22,06% 0,00%
Deutsche Telekom 1,89% 15,30% 17,04% 3,99% 0,35% 0,29%
BT GRP 0,00% 2,79% 0,00% 0,00% 0,00% 0,00%
Telefonica 0,00% 0,00% 1,46% 0,00% 0,00% 0,48%
Orange 1,72% 2,19% 6,30% 2,01% 0,92% 0,00%
TeliaSonera 0,22% 0,00% 9,84% 1,71% 1,05% 6,03%
Swisscom 0,00% 25,00% 0,00% 0,48% 0,00% 0,00%
KPN 0,03% 2,69% 5,74% 0,00% 0,75% 0,00%
Telecom Italia 0,10% 16,62% 11,69% 6,81% 0,00% 0,81%
Telenor 0,06% 6,09% 18,30% 0,00% 0,03% 0,00%
Inmarsat 0,00% 15,74% 14,67% 26,18% 0,00% 0,00%
Elisa Corporation 0,00% 0,00% 0,00% 0,00% 0,00% 0,72%
Freenet 0,04% 0,00% 0,00% 0,00% 0,00% 0,00%
Cable & Wireless Communication 5,58% 0,00% 3,02% 0,00% 0,00% 0,00%
Tele2 B 0,00% 0,00% 0,86% 0,00% 0,00% 2,21%
Talktalk Telecom GRP 0,00% 0,00% 0,00% 0,00% 0,00% 0,00%
Mean 0,87% 6,15% 6,31% 4,07% 1,57% 0,66%
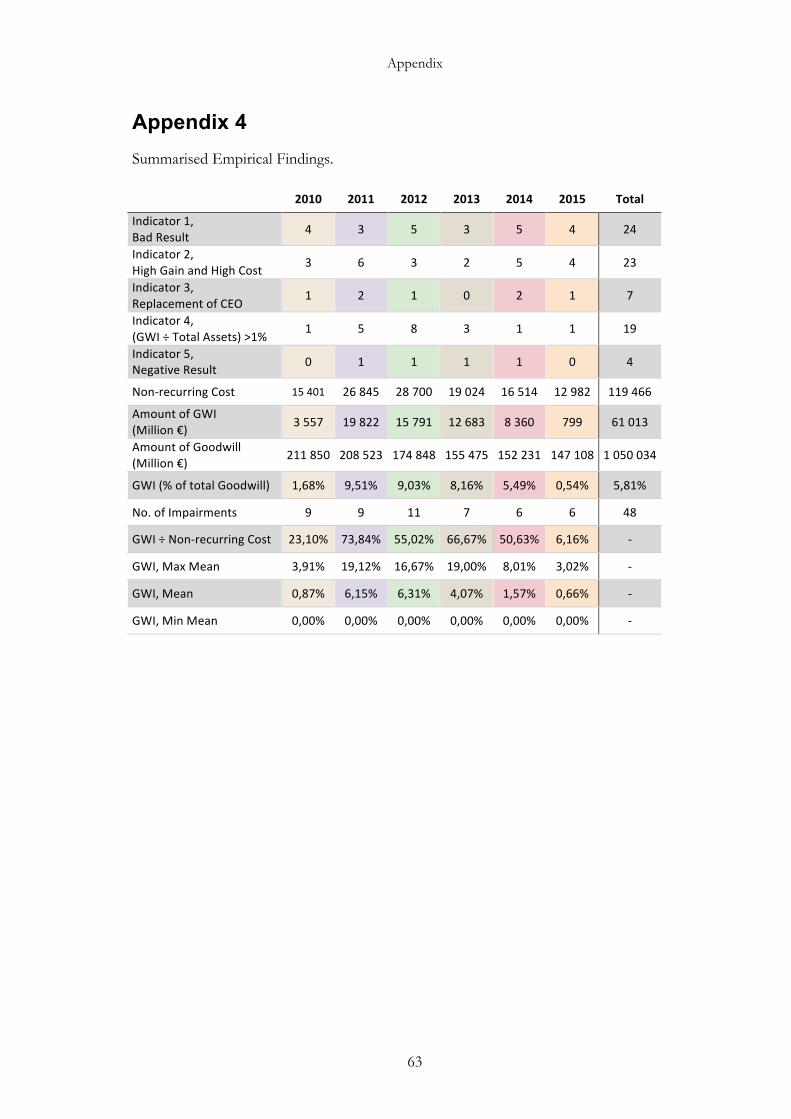
Appendix
63
Appendix 4 Summarised Empirical Findings.
2010 2011 2012 2013 2014 2015 Total
Indicator 1, Bad Result 4 3 5 3 5 4 24
Indicator 2, High Gain and High Cost 3 6 3 2 5 4 23
Indicator 3, Replacement of CEO
1 2 1 0 2 1 7
Indicator 4, (GWI ÷ Total Assets) >1%
1 5 8 3 1 1 19
Indicator 5, Negative Result 0 1 1 1 1 0 4
Non-‐recurring Cost 15 401 26 845 28 700 19 024 16 514 12 982 119 466
Amount of GWI (Million €) 3 557 19 822 15 791 12 683 8 360 799 61 013
Amount of Goodwill (Million €)
211 850 208 523 174 848 155 475 152 231 147 108 1 050 034
GWI (% of total Goodwill) 1,68% 9,51% 9,03% 8,16% 5,49% 0,54% 5,81%
No. of Impairments 9 9 11 7 6 6 48
GWI ÷ Non-‐recurring Cost 23,10% 73,84% 55,02% 66,67% 50,63% 6,16% -‐
GWI, Max Mean 3,91% 19,12% 16,67% 19,00% 8,01% 3,02% -‐
GWI, Mean 0,87% 6,15% 6,31% 4,07% 1,57% 0,66% -‐
GWI, Min Mean 0,00% 0,00% 0,00% 0,00% 0,00% 0,00% -‐


![Thoughts on Goodwill Impairment [Compatibility Mode]](https://img.pdfslide.net/doc/110x75/54fdc41e4a7959f4248b4748/thoughts-on-goodwill-impairment-compatibility-mode.jpg)