Embed Size (px)
Citation preview

Big data analytics capabilities and innovation: The
mediating role of dynamic capabilities and
moderating effect of the environment
Abstract
With big data analytics growing rapidly in popularity, academics and practitioners have been considering
the means through which they can incorporate the shifts these technologies bring into their competitive
strategies. Drawing on the resource-based view, dynamic capabilities view, and on recent literature on big
data analytics, this study examines the indirect relationship between a big data analytics capability (BDAC)
and two types of innovation capabilities, incremental and radical. The study extends existing research by
proposing that BDACs enable firms to generate insight that can help strengthen their dynamic capabilities,
which in turn positively impact incremental and radical innovation capabilities. To test our proposed
research model, we used survey data from 175 chief information officers and IT managers working in Greek
firms. By means of partial least squares structural equation modeling (PLS-SEM), results confirm our
assumptions regarding the indirect effect that BDACs have on innovation capabilities. Specifically, we find
that dynamic capabilities fully mediate the effect on both incremental and radical innovation capabilities.
In addition, under conditions of high environmental heterogeneity, the impact of BDAC’s on dynamic
capabilities, and in sequence, incremental innovation capability is enhanced, while under conditions of high
environmental dynamism the effect of dynamic capabilities on incremental innovation capabilities is
amplified.
Keywords: Big data analytics; dynamic capabilities; innovation capabilities; business value; resource-
based view; environmental uncertainty
1. Introduction
The “Age of Data” is currently thriving, with new data being produced from all industries and public bodies
at an unprecedented rate. This phenomenon has resulted in a massive hype, with organizations striving to
leverage big data analytics in order to create value (Constantiou & Kallinikos, 2015). As a result, there is
much attention from both academics and practitioners on the value that organizations can create through
the use of big data analytics (Manyika et al., 2011). Following the rapid expansion of data volume, velocity,
and variety, substantial developments have been documented in terms of techniques and technologies for
data storage, analysis, and visualization. Nevertheless, there is significantly less research on how
organizations need to change to embrace these innovations, and what business value can be derived by them
(McAfee, Brynjolfsson, & Davenport, 2012). Empirical research on the value of big data analytics is still
at a rudimentary state, which is surprising, given the surge of companies making investments in big data.
Most reports on the business value of big data to date have been from consultancy firms, popular press, and
individual case studies, that lack theoretical insight. As a result, there is limited understanding on how firms
should approach their big data initiatives, and scarce empirical support to back-up the claim that these
investments result in any measurable business value (Mikalef, Pappas, Krogstie, & Giannakos, 2017).

Big Data Analytics Capabilities and Innovation
Addressing these critical gaps in the literature is important as there is very little knowledge about how big
data analytics can be leveraged at the firm level, and through what mechanisms value can be created. In
this study we build on the notion of big data analytics capability (BDAC), which is defined as the ability of
a firm to capture and analyze data towards the generation of insights by effectively orchestrating and
deploying its data, technology, and talent (Gupta & George, 2016; Mikalef, Pappas, et al., 2017). Grounded
on the emerging research on BDAC’s (Gupta & George, 2016; Mikalef, Pappas, et al., 2017; Wamba et al.,
2017), this study posits that big data is a necessary resource, but not sufficient condition to result in business
value gains. In order to be able to leverage big data to support and guide strategic decision-making, a
number of complementary resources are necessary, which synergistically drive a firms’ overall BDAC. As
such, firms must acquire and develop a combination of technological, human, financial, and intangible
resources to create a, difficult to imitate and transfer, BDAC. Despite some, scarce, studies examining big
data through such a holistic perspective (Gupta & George, 2016; Wamba et al., 2017), there is still limited
empirical understanding on the mechanisms through which a BDAC can generate business value. The
scarcity of work in this direction has resulted in a lack of understanding about the potential value of big
data analytics, and leaves practitioners in unchartered waters when faced with such implementations in their
firms. To obtain any meaningful theoretical and practical implications, as well as to identify critical areas
for future research, it is important to understand how the core constituents of big data analytics are shaped
and how they result in business value (Constantiou & Kallinikos, 2015). Building on the concept of BDAC,
this study seeks to answer two closely related research questions:
(1) Does a firms’ big data analytics capability result in enhanced innovation capabilities, if so,
through what mechanisms?
(2) How do environmental factors influence the effect of big data analytics capabilities on a firm’s
innovation capabilities?
To provide answers to these questions, we ground our study theoretically on the resource-based view (RBV)
and the dynamic capabilities view of the firm which are presented in the next section. In addition, we define
the notion of a big data analytics capability and illustrate how it is conceptually developed. In section 3, we
provide a discussion on how a BDAC affects two types of innovation capabilities, incremental and radical
capabilities. We posit, that the effect is indirect, and is mediated through a firm’s dynamic capabilities,
which help sustain evolutionary fitness. To explore these questions, we develop a survey-based study and
describe the data collection procedures and measures for each used concept. In sequence, we present the
results of our empirical analysis, followed by a discussion on the theoretical and practical implication of
findings, as well as some core limitations.
2. Theoretical background
2.1 Big data as a source of business value
Big data analytics has been regarded as the next frontier for innovation, competition, and productivity
(Manyika et al., 2011). As a result, there is much attention from both academics and practitioners on the
value that organizations can create through the use of big data analytics. A commonly accepted definition
in the literature regards big data analytics as “a new generation of technologies and architectures, designed
to economically extract value from very large volumes of a wide variety of data, by enabling high velocity
capture, discovery and/or analysis” (Mikalef, Pappas, et al., 2017). Despite the vast majority of claims on
the value of big data analytics being anecdotal, the few empirical research studies in the areas have

Big Data Analytics Capabilities and Innovation
documented a positive relationship between the decision to invest in firm-wide deployment of big data
analytics and performance (Gupta & George, 2016; Wamba et al., 2017). Through the deployment of big
data analytics, firms are able to make sense of vast amounts of data, generate critical insight, and reconfigure
their strategies based on trends that are observed in their competitive environment (H. Chen, Chiang, &
Storey, 2012). As such, the major contribution of big data analytics lies in the fact that it enables better
informed decision-making, which is subject to less bias and based on empirical evidence (Abbasi, Sarker,
& Chiang, 2016). The hype surrounding big data analytics is evident from the increasing investments made
from firms, and particularly those working in complex and fast-paced environments (G. Wang,
Gunasekaran, Ngai, & Papadopoulos, 2016). Managers nowadays are relying ever more on big data
analytics to inform their decision making in real-time, and direct their future organizational initiatives
(Constantiou & Kallinikos, 2015). Although the impact of big data analytics can be identified in many
different areas, the overall value is clearly reflected in a recent article by Liu (2014), who notes that big
data analytics constituted a major differentiator between high-performing and low-performing firms, as it
enables firms to be more proactive and swift in identifying new business opportunities. In addition, the
study reports that big data analytics have the potential to decrease customer acquisition costs by 47% and
enhance revenues by about 8%. Adding to this, a recent article by MIT Sloan Management Review shows
that companies that are leaders in the adoption of big data analytics are much more likely to produce new
products and services compared to those that are laggards (Ransbotham & Kiron, 2017).
2.2 Big data analytics capabilities
Past literature has repeatedly noted that when assessing the business value of IS investments, it is
fundamental to capture all the underlying factors that enable effective and efficient use of IT as a
differentiator of firm success (Bharadwaj, 2000). The concept of IT capability has been developed on this
premise, and is defined as the “firm's ability to mobilize and deploy IT-based resources in combination or
co-present with other resources and capabilities” (Bharadwaj, 2000). Past empirical studies examining the
business value of IT capabilities, typically base their theoretical assumptions and operationalizations on the
Resource-Based View (RBV) of the firm (Bhatt & Grover, 2005; Wade & Hulland, 2004). Specifically, the
RBV argues that a competitive advantage emerges from unique combinations of resources that are
economically valuable, scarce, and difficult to imitate (Barney, 1991). When these resources are
heterogeneously distributed across firms, their innate traits such as path dependency, embeddedness, and
causal ambiguity enable them to generate a competitive advantage (Barney, 1991). Taken to the IS domain,
the main assumption underpinning the notion of IT capability is that while resources can be easily
replicated, distinctive firm-specific capabilities cannot be readily assembled through markets, and can
therefore, be a source of a sustained competitive advantage (Lu & Ramamurthy, 2011).
Given that the objective of this study is to isolate the core resources that will, synergistically, allow firms
to develop big data analytics capabilities (BDAC), which can in turn improve firm performance, the choice
of the RBV as the underlying theoretical framework is deemed as suitable. Grant (1991) makes a distinction
of the different types of resources that jointly form an organizational capability and categorizes them into
tangible (e.g. physical and financial resources), human skills (e.g. employee’s skills and knowledge), and
intangible (e.g. organizational culture and organizational learning). This categorization of resources into
tangibles human skills, and intangibles has been long used in the IT capability literature (Bharadwaj, 2000).
Hence, building on the RBV, we define the notion of big data analytics capability (BDAC) as the ability of
the firm to capture and analyze data towards the generation of insights, by effectively deploying its data,
technology, and talent through firm-wide processes, roles and structures. The notion of BDA capability
therefore extends the view of big data to include all related organizational resources that are important in

Big Data Analytics Capabilities and Innovation
the transformation of data into actionable insight, and its application in operational and strategic decision-
making.
Building on the previously mentioned classification, prior studies have emphasized on specific aspects of
big data analytics that are critical for firms. In relation to tangible resources, data, technology and other
basic resources are noted as being fundamental to big data success. The defining characteristics of big data
include volume, variety, and velocity (C. P. Chen & Zhang, 2014). Nevertheless, it is frequently mentioned
that IT strategists and data analysts are particularly concerned with the quality and availability of the data
they analyze (Brinkhues, Maçada, & Casalinho, 2014). While data itself is a core resource, it is also
important for firms to possess an infrastructure capable of storing, sharing, and analyzing data. Big data
call for novel technologies that are capable of handling large amounts of diverse, and fast-moving data
(Gupta & George, 2016). One of the main characteristics of such data is that it is in an unstructured format
and requires sophisticated infrastructure investments to result in meaningful and valuable information (Ji-
fan Ren, Fosso Wamba, Akter, Dubey, & Childe, 2017). Basic resources such as financial support are
necessary, especially since big data investments are noted as taking some time to result in measurable
business value (Mikalef, Framnes, Danielsen, Krogstie, & Olsen, 2017). Concerning human skills, literature
recognizes that both technical and managerial-oriented skills are required to derive value from big data
investments (Wamba et al., 2017). In a highly influential article, Davenport and Patil (2012) address the
important role that the emerging job of the data scientist will have in the context of big data. While one of
the most critical aspects of data science is the ability of data-analytic thinking, such competences are not
only important for the data scientist, but throughout the organization; particularly, for employees in
managerial positions (Prescott, 2014). Finally, concerning intangible resources, a data-driven culture and
organizational learning are noted as being critical aspects of effective deployment of big data initiatives
(Mikalef, Pappas, et al., 2017). In firms engaging in big data projects, a data-driven culture has been noted
as being a key factor in determining their overall success and continuation (LaValle, Lesser, Shockley,
Hopkins, & Kruschwitz, 2011). Companies with a strong data-driven culture use data in a pervasive way
and develop processes to make it easy for employees to acquire necessary information. In addition, they are
transparent about data access restrictions and governance practices (Tallon, Ramirez, & Short, 2013).
Nevertheless, due to the constantly evolving technological landscape, it is important that a logic of
continuous learning is infused in organizations that invest in big data (Vidgen, Shaw, & Grant, 2017).
Some early studies centered on the business value of developing a BDAC have demonstrated a positive
overall effect with performance measures (Gupta & George, 2016; Wamba et al., 2017). In the broader
domain of IT-business value research, there is a growing consensus that IT enables firms to generate
business value through intermediate organizational capabilities (Benitez, Castillo, Llorens, & Braojos,
2017; Mikalef & Pateli, 2017; Schryen, 2013). The main premise of this view is that IT capabilities, and as
an extension BDAC, are central since they develop complementary effects with intermediate organizational
capabilities that ultimately lead to competitive advantage. While these are just some of the early studies
that suggest a positive impact of BDAC’s on performance, more research is needed to understand the
mechanisms through which data-based insight is transformed into action. The main idea is that the
generation of insight is insufficient to provide any performance gains without the necessary transformation
of organizational capabilities. Thus, it is important to examine the effect of a firms’ BDAC on different
types of organizational capabilities, and how they, as mediating conditions, influence performance.
2.3 Dynamic capabilities

Big Data Analytics Capabilities and Innovation
The competitive benefits that a firm currently has managed to obtain are a result of strengths built in reaction
to environmental responsiveness strategies. These strengths can be explained in terms of organizational
capabilities, i.e. processes that facilitate the most efficient, effective and competitive use of a firms’ assets
whether tangible or intangible (S. Sharma & Vredenburg, 1998). In this perspective, capabilities represent
the potential of a business to achieve certain objectives by means of focused deployment and represent the
building blocks on which firms compete in the market. Organizational capabilities emerge through the
strategic application and complex interactions of resources that a firm owns or is capable of controlling,
and the most effective means of orchestrating and deploying them (Gold & Arvind Malhotra, 2001).
Following the definition of Winter (2003), a capability can be described as a high-level routine (or a
collection of routines), with routines comprising of purposefully learned behaviors, highly patterned,
repetitious or quasi-repetitious, founded in part in tacit knowledge. Past research in the domain of strategic
management has made great strides to develop and refine different types of organizational capabilities. The
consensus is that capabilities operate quite differently, and result in varying levels of competitive advantage
and firm performance based on a number of internal and external factors (Drnevich & Kriauciunas, 2011).
Based on the idea that firms must be both stable enough to continue to deliver value in their own distinctive
way, and agile and adaptive enough to restructure their value proposition when circumstances demand it,
there is a well-documented distinction between operational (ordinary) and dynamic capabilities.
In incomplete markets, heterogeneity among firm capabilities can serve as the basis for developing
competitive advantages and rent differentials (Amit & Schoemaker, 1993). Conditions of high
environmental uncertainty, market volatility, and frequent change, have raised questions regarding the rate
to which operational capabilities erode and cease to provide competitive gains (Drnevich & Kriauciunas,
2011). The dynamic capabilities view has been put forth to answer this gap as a neo-Schumpeterian theory
of the firm (D. J. Teece, Pisano, & Shuen, 1997). The dynamic capabilities view repositions the focus on
the renewal of existing organizational capabilities as a means of competitive survival for the firm (Winter,
2003). Correspondingly, dynamic capabilities are defined as those capabilities used to extend, modify,
change, and/or create operational capabilities (Drnevich & Kriauciunas, 2011; Winter, 2003). As such,
dynamic capabilities are particularly important for the competitive survival of firms in contemporary
dynamic and quasi-globalized markets. Dynamic capabilities are suggested to deliver rents from new
combinations of capabilities and assets, and produce outcomes that are capable of shaping the marketplace,
such as entrepreneurship and innovation (Helfat & Winter, 2011). Therefore, the definition of dynamic
capabilities specifies that they can create value indirectly, by changing a firms way of conducting business
(Protogerou, Caloghirou, & Lioukas, 2011).
3. Research model
Building on the RBV (Barney, 1991), the dynamic capabilities view (D. J. Teece, 2007; D. J. Teece et al.,
1997), and on the emerging literature on big data analytics (Gupta & George, 2016; McAfee et al., 2012;
Wamba et al., 2017), this study proposes an evolutionary fitness view (Helfat & Peteraf, 2009), by which a
BDAC enables firms to reposition themselves in the face of changing business environments. We propose
that firms need a combination of tangible, human, and intangible resources to build a BDAC. While tangible
resources cannot by themselves create a BDAC, the same applies for human and intangible resources. To
develop a strong BDAC, a combination of all three types of resources need to be invested in by the firm.
The study argues that the value of a BDAC stems from its capacity to enhance a firm’s dynamic capabilities.
In doing so, a BDAC contributes towards the processes of sensing, coordinating, learning, integrating and
reconfiguring, which ultimately leads to enhanced levels of incremental and radical innovation capabilities.

Big Data Analytics Capabilities and Innovation
Incremental and radical innovation are two fundamentally different types of capabilities, that are typically
developed through different means and have a dissimilar effect in relation to the functioning of the firm.
The proposed conceptual development of BDAC as well as the discussed relationships are illustrated in
Figure 1 below.
Figure 1 Conceptual research model and corresponding hypotheses
A strong BDAC alleviates the risk of obsolescence, since by feeding a firms dynamic capabilities,
evolutionary fitness and a strengthened capacity to innovate is achieved (Protogerou et al., 2011). As such,
we argue that a firm’s BDAC has an indirect effect on incremental and radical innovation capabilities,
mediated by dynamic capabilities. The effect of BDAC in this process is discernible by the deployment of
enhanced innovation capabilities. Lastly, we theorize that the value of BDAC’s, and dynamic capabilities
on a firm’s innovation capabilities, will be magnified under conditions of high environmental uncertainty.
The constructs used in the conceptual research model as well as their definitions and source references are
presented in Table 1 below.
Construct Role Definition Source(s)
Big Data
Analytics
Capability
Independent Big Data Analytics Capability (BDAC) is defined
as the ability of the firm to capture and analyze data
towards the generation of insights, by effectively
deploying its data, technology, and talent through
firm-wide processes, roles and structures
Adapted from Gupta and
George (2016); Wamba
et al. (2017)
Dynamic
Capabilities
Mediator Dynamic capabilities are defined as the ability
to integrate, build, and reconfigure internal and
external competencies to address rapidly changing
environments
Adapted from D. J. Teece
et al. (1997); D. J. Teece
(2007); Paul A. Pavlou
and El Sawy (2011);
Mikalef and Pateli (2017)
Incremental
Innovation
Capability
Outcome Incremental innovative capability is defined as the
ability of the firm to reinforce and extend its
existing expertise and product/service lines
Subramaniam and
Youndt (2005)

Big Data Analytics Capabilities and Innovation
Radical
Innovation
Capability
Outcome Radical innovation capability is the ability of the
firm to make current product/service lines obsolete
Subramaniam and
Youndt (2005)
Dynamism Moderator Dynamism is defined as the rate and
unpredictability of environmental change
Newkirk and Lederer
(2006)
Heterogeneity Moderator Heterogeneity is defined as the complexity and
diversity of external factors, such as the variety of
customer buying habits and the nature of
competition
Newkirk and Lederer
(2006)
Hostility Moderator Hostility is defined as the availability of key
resources and the level of competition in the
external environment
Newkirk and Lederer
(2006)
Table 1. Constructs and definitions of conceptual research model
In the contemporary business environment, firms must be capable to reconfigure and update the means
through which they operate on a continuous basis in order to remain competitive (Ambrosini, Bowman, &
Collier, 2009). The capacity to respond to changes that occur in the external environment is a complex task
that entails developing processes of sensing emerging threats and opportunities, seizing opportunities for
development and survival, and adapting existing modes of operation to better fit market needs, or
developing radically new ones (D. J. Teece, 2007). Empirical studies have shown that firms’ that utilize big
data-generated insight are in a better position to identify emerging threats and opportunities (Erevelles,
Fukawa, & Swayne, 2016). Furthermore, big data analytics has been shown to enable the identification of
new business opportunities through the combination of diverse data sources (Kiron, 2017), and even allow
for the generation of insight that was previously unknown (Erevelles et al., 2016). For instance,
deployments of real-time text and sentiment analytics on social media can allow firms to capture the
sentiment and attitudes of consumers in response to marketing campaigns, and also monitor how consumers
react to ones instituted by their main competitors (He, Zha, & Li, 2013). One of the main differentiating
elements of big data analytics is that it enables for the processing of unstructured and varied data sources
in much shorter cycle-times (H. Chen et al., 2012). This processing power contributes positively in
improving the speed, effectiveness, and efficiency of generating insight, and enables sense-making in
conditions of high complexity and velocity (Popovič, Hackney, Tassabehji, & Castelli, 2018).
Data-generated insight can then be leveraged for seizing opportunities, providing that there are well
established decision-making structures and resource-orchestration processes (R. Sharma, Mithas, &
Kankanhalli, 2014). A growing number of firms develop BDAC’s in order to generate insight that will
allow them to dynamically coordinate production, supply chain, logistics, and warehousing activities (G.
Wang et al., 2016). Furthermore, by leveraging BDAC’s firms can develop real-time resource allocation,
better coordination, and dynamic asset movement (Wamba, Akter, Edwards, Chopin, & Gnanzou, 2015).
Doing so can drastically reduce reaction time to emerging events, contribute to slice costs by improving
inefficiencies, and reduce bottlenecks in business processes. Strong BDAC’s can also help refine business
processes, and aid in the discovery of service flaws or operational road blocks (Grover, Chiang, Liang, &
Zhang, 2018). Finally, firms that leverage BDAC’s can utilize generated insight to learn about previous
successful or failed product, service, or marketing initiatives, and transform their respective capabilities
accordingly (Wamba et al., 2017). These areas in which BDAC’s can contribute are core components of a
firm’s dynamic capabilities. Nevertheless, being able to do so requires that big data analytics is not
exercised solely as a technical activity, but is developed as a firm-wide capability where participation in
data-based projects, insight generation and decision-making are an organizational effort (Vidgen et al.,
2017). To be able to react on such insight and modify or renew the way the firm operates requires maturity
in additional complementary aspects (Günther, Mehrizi, Huysman, & Feldberg, 2017). Janssen, van der

Big Data Analytics Capabilities and Innovation
Voort, and Wahyudi (2017) find that decision-making quality largely relies on the level to which firms
have developed their BDAC’s. R. Sharma et al. (2014) underscore the importance of fostering appropriate
decision-making structures, essentially enabling a data-driven culture to diffuse throughout the firm. The
point of culture and organizational learning is also highlighted by Erevelles et al. (2016) who note that it is
critical to develop structures and processes around big data analytics that will enable the firm to generate
and utilize innovative ideas.
In fact, one of the largest barriers managers face when trying to implement big data initiatives is that the
organizational culture is not supportive, and existing data silos don’t allow access of data that is necessary
to develop critical insight (Kiron, 2017). The argument made in several recent studies is that data and
technologies can only take organizations so far, and that the real drivers include the people with technical,
analytical and business knowledge, and fostering a culture that relies on evidence-based decision-making
(Grover et al., 2018). In fact, a recent report argues that introducing a data-driven culture, where decision-
making is balanced between data-generated insight and managerial intuition, requires top management
support and sufficient knowledge about the opportunities that big data analytics enable (Ransbotham, Kiron,
& Prentice, 2016). Becoming a data-driven organization requires that data analytics are part of the
competitive strategy of the firm, that governance structures are in place, and that processes and structures
are put into action to enable seamless flow of data throughout the firm breaking down departmental silos
(Tallon et al., 2013). Successful big data analytics initiatives have proven to be complex matters, which
depend on a firm’s ability to simultaneously harness multiple resources and capabilities including people,
technology, data, processes and structures within a business context, and deploy them synergistically
(Vidgen et al., 2017).
Several case reports showcase the significance of developing a BDAC, with a prominent example being
that of Southwest airlines, described in the work of Erevelles et al. (2016). Southwest Airlines uses big data
analytics on conversations between personnel and customers to better understand customer needs. The
airline has built on a speech analytics tool that allows customer service representatives to understand the
nuances of every recorded customer interaction. Data is collected from several different channels including
social media in order to get more information about customers in real-time, understand customer intent and
provide better service offerings (Aspect, 2013). As a result, different metrics guide service personnel to the
best solution in every scenario depending on the type of interaction. The insight from the speech analytics
methods, are also used to sense unrecognized customer needs and train service personnel accordingly.
While at first the implementation of analytics at Southwest may look like a technical task, training personnel
to adopt a data-driven approach when interacting with customers, developing the channels to collect
different types of data, and encouraging a perspective of organizational learning based on insight are key
components of business value. Numerous similar case studies showcase that a strong BDAC can not only
help firms identify threats and opportunities, but it can also reinforce seizing of opportunities and transform
operations through incremental or radical adaptations in existing modes of doing business, since insights
are backed-up with empirical evidence (Braganza, Brooks, Nepelski, Ali, & Moro, 2017; LaValle et al.,
2011). From the foregoing discussion, we hypothesize that:
H1: BDAC has a significant positive effect on dynamic capabilities
While dynamic capabilities may produce competitive performance gains in their own right, it is suggested
that one of their mechanisms of action is by enabling, or strengthening, innovation capabilities (Drnevich
& Kriauciunas, 2011). This idea has been initiated by the argument made by Eisenhardt and Martin (2000),
that dynamic capabilities are necessary, but not sufficient conditions for competitive advantage. Based on
this perspective, sustaining a state of competitive advantage does not depend on dynamic capabilities per
se, but rather, on the resource configurations created by dynamic capabilities. In this sense, dynamic

Big Data Analytics Capabilities and Innovation
capabilities are perceived as strategic options that allow firms to renew existing capabilities or develop new
ones when the opportunity or need arises (Paul A Pavlou & El Sawy, 2006). Zahra, Sapienza, and Davidsson
(2006) supported this view proposing that dynamic capabilities lead to performance gains by facilitating
changes in the way the firm operates and competes. Recent reviews on the mechanisms and outcomes of
dynamic capabilities, highlight that innovation is a primary consequence of dynamic capabilities, and can
lead to different forms of novel products service and processes (Schilke, Hu, & Helfat, 2018). D. Teece and
Leih (2016) argue that for managers in the innovation economy, the goal should be to navigate unexpected
events with a minimum of disruption. Being able to deliver sustained innovation and respond to unexpected
events in dynamic environments requires establishing flexible systems, which are hallmarks of strong
dynamic capabilities (Felin & Powell, 2016). At this point it is important to make a conceptual distinction
between two core types of innovation capabilities that are critical for competitive success, incremental and
radical (Subramaniam & Youndt, 2005). Tushman and Romanelli (2008), along with other researchers
describe incremental changes as those that encourage the status quo, whereas radical changes are those
characterized by a process of reorientation wherein patterns of consistency are fundamentally reordered.
Incremental innovations therefore concern minor changes and modification to products and services,
whereas radical innovations represent major departures from existing capabilities in the firm, and constitute
the basis for completely new products, services or business models (Ritala & Hurmelinna‐Laukkanen,
2013).
The difference in the nature between the two types of innovation capabilities suggest common, as well as
divergent, mechanisms in which dynamic capabilities affect them. Darroch (2005) finds that knowledge
acquisition and dissemination (both aspects included in the conceptual definition of the dynamic capabilities
construct) are related to both incremental and radical innovation capabilities. Chiang and Hung (2010) look
at the differences in the emergence on the two types of capabilities and find that intensively accessing
knowledge from a limited number of external channels can facilitate incremental innovation capabilities,
whereas accessing knowledge from a broad range of external channels can enhance radical innovation
capabilities. Yet, it is acknowledged that lateral relationships and a widening of task boundaries with
organizations creates an environment favorable to both types of innovation (Koberg, Detienne, & Heppard,
2003). Innovation capabilities depend on team rather than individual effort, and the cross-flow of
knowledge among different people working in parallel on different aspects of a project (Koberg et al.,
2003). Therefore, the ability to effectively sense emerging opportunities and threats and readily adjust to
changing external conditions through effective coordination is regarded as a facilitator of both incremental
and radical innovation capabilities (Forés & Camisón, 2016). Nevertheless, firms that combine their internal
knowledge base with knowledge from external sources can obtain a positive impact on radical innovation
capabilities, whereas those that emphasize internal knowledge creation will be more prone to develop an
incremental innovation capability (Forés & Camisón, 2016). This difference demonstrates that dynamic
capabilities have different mechanisms of action and depending on their scope of application can result in
different types of outcomes.
H2: Dynamic capabilities have a significant positive effect on incremental innovation capabilities
H3: Dynamic capabilities have a significant positive effect on radical innovation capabilities
In the context of big data analytics, the generated insight has been suggested to prompt firms in realizing
gaps or areas of ignorance, and taking action to adjust their innovation capabilities (Erevelles et al., 2016).
Strong BDAC’s can have an indirect impact on a firms innovation capabilities by strengthening the
underlying process of dynamic capabilities (Wamba et al., 2017). Specifically, by fostering BDAC’s firms
can make sense of vast quantities of diverse data which would be impossible to analyze and interpret
otherwise (Sagiroglu & Sinanc, 2013). Such efforts have been documented for identifying customer and

Big Data Analytics Capabilities and Innovation
non-customer needs (I. Lee, 2017), locating operational inefficiencies (Seddon & Currie, 2017), monitoring
competitor actions (Guo, Sharma, Yin, Lu, & Rong, 2017), and developing predictive models for future
events (H. Chen et al., 2012). Taking the example of customer and non-customer needs identifications
literature has documented that strong BDAC’s can allow companies to understand the behaviors,
interactions, experiences, and emerging patterns that consumers have with their products or services (Kwon,
Lee, & Shin, 2014), monitor in real-time their sentiment and affect about the firm itself or specific products,
services or marketing campaigns (Jang, Sim, Lee, & Kwon, 2013), develop a more fine-grained
understanding of who their customers are and what they need (Fan, Lau, & Zhao, 2015), and even help
create personalized products and services (Sagiroglu & Sinanc, 2013). Similar cases are noted in improving
operations and business processes, where strong BDAC’s can be leveraged to identify bottlenecks in supply
chains (G. Wang et al., 2016), predict maintenance times for equipment with much greater accuracy (J. Lee,
Ardakani, Yang, & Bagheri, 2015), and forecast demand and sales to allow better inventory management
and production planning (Lim, Alpan, & Penz, 2014).
In sequence, strong BDAC’s can support, and in some cases even replace, human decision-making and
automatize action in response to generated insight (Provost & Fawcett, 2013). For instance, a sizeable
number of firms now build on big data analytics to support real-time processes orchestration for logistics
and supply chain activities (Schoenherr & Speier‐Pero, 2015). Others utilize these capabilities for moving
towards smart manufacturing in the industry 4.0 paradigm which builds on cyber-physical systems that
enable faster, more flexible, and more efficient processes to produce higher-quality goods (Almada-Lobo,
2016). Furthermore, in customer management and service provision activities, strong BDAC’s can allow
firms to personalize their marketing approaches and prioritize high-profit segments (Akter & Wamba, 2016;
Fan et al., 2015), help develop customized products and services (Alyass, Turcotte, & Meyre, 2015), make
more fine-grained and personalized recommendations for future purchases (Ngai, Gunasekaran, Wamba,
Akter, & Dubey, 2017), offer custom-designed and location-based discounts (Fan et al., 2015; Grover et
al., 2018), as well as help resolve customer queries through artificial intelligence technologies (Orenga-
Roglá & Chalmeta, 2016; Van Doorn et al., 2017). In this respect, the value of BDAC’s is not limited in
sensing emerging opportunities and threats, but can also be leveraged to respond to such events and help
transform how the firm currently operates and competes in the marketplace (Mikalef, Pappas, et al., 2017).
The role of BDAC’s in enhancing incremental innovation capabilities can be discerned in several examples
such as alterations to products and services (Y. Wang, Kung, & Byrd, 2018), personalization of offered
marketing approaches and services (Buettner, 2017; Xu, Frankwick, & Ramirez, 2016), changes in client
interfaces (Lehrer, Wieneke, vom Brocke, Jung, & Seidel, 2018), improved efficiency in supply chain
management methods (Waller & Fawcett, 2013), as well as modified means for system risk analysis and
fault detection (Hu, Zhao, Hua, & Wong, 2012). Similarly, several examples of enhanced radical innovation
capabilities are described in literature including the development of novel products, such as that of
personalized medicine that integrate systems biology like genomics with electronic health record data to
provide more effective treatments (Alyass et al., 2015), new services like adaptive learning systems that
build on a broad range of data and interactions of users with their learning environments (Maseleno et al.,
2018), and developing new processes such as that of decision-aiding tools for detection, characterization
and monitoring of diseases in image-recognition tasks related to radiology for instance (Hosny, Parmar,
Quackenbush, Schwartz, & Aerts, 2018).
Several prominent case studies demonstrate the effect that strong BDAC’s have on both incremental and
radical innovation capabilities. For instance, Intel, the semiconductor manufacturer, tested every chip that
came off its production line, which meant running roughly 19.000 tests (Intel, 2013). Using its BDAC, Intel
managed to change the manufacturing process, significantly reducing the number of tests required for

Big Data Analytics Capabilities and Innovation
quality assurance. This data-intensive process has enabled Intel to detect failures in its manufacturing line
and revamp its production process, resulting in incremental innovation improvements. Delta, the American
airline, manages more than 130 million checked bags per year. Recently, Delta has become the first major
airline that allows customers to track their bags from mobile devices, utilizing as such their BDAC to
develop novel services that provide customers with greater peace of mind. The BDAC that Delta has
developed, has allowed the company to identify that bag tracking is important for passengers, and capitalize
on this opportunity by deploying novel marketing approaches which foster better relationships with its
customers (Delta, 2016). This example demonstrates that a BDAC has the potential to change the way a
firm operates and result in radical innovations that support or transform the firm’s business model. Similar
findings have been noted by several practice-based studies, where it is argued that depending on the area
of application, a strong BDAC can have an indirect effect on a firms innovation capabilities (Ransbotham
& Kiron, 2017). We can therefore hypothesize that:
H4: BDAC has a significant positive indirect effect on incremental innovation capabilities, which
is mediated by a positive effect on dynamic capabilities
H5: BDAC has a significant positive indirect effect on radical innovation capabilities, which is
mediated by a positive effect on dynamic capabilities
The conditions under which dynamic capabilities add value have been a subject of much debate, and have
been theorized to be heavily contingent from aspects of the external business environment (Drnevich &
Kriauciunas, 2011). In stable environments, where external changes are infrequent and tend to be
predictable and incremental, dynamic capabilities play a minor role. Contrarily, in fast-paced,
unpredictable, and volatile environments, existing modes of operating quickly erode, so dynamic
capabilities are necessary to maintain competitiveness (Wilden & Gudergan, 2015). In IS literature the
conditioning impact of environmental uncertainty on the relationship between a firms BDAC and
competitive performance is scarcely examined. While there is an assumption that BDAC’s may be more
valuable under conditions of high uncertainty, there is limited empirical understanding on the impact that
the external environment has. In highly dynamic and complex markets that are characterized by speed and
tough competition, a strong BDAC is argued to be beneficial by facilitating a better understanding of areas
that could provide a competitive advantage. The role of BDAC’s that operate as drivers of dynamic
capabilities has been theorized to be of increased relevance in conditions of constant and unpredictable
change (McAfee et al., 2012). In this study we distinguish between three environmental factors (Newkirk
& Lederer, 2006) that are posited to have a moderating impact on the previously discussed relationships:
dynamism, heterogeneity, and hostility.
Dynamism can be regarded as the unpredictability on the demand side, heterogeneity as the uncertainty on
the supply side, and hostility as the variability regarding longer-term trends in the industry (Xue, Ray, &
Gu, 2011). While these external environmental conditions differ significantly, they are suggested to be
significant influencers of a firm's BDAC and to the derived competitive performance. Firms that operate in
dynamic environments are likely to require frequent adjustments to their marketing approach in order to
satisfy the constantly changing customer needs (Li & Liu, 2014). By developing a strong BDAC, firms will
be in a better position to analyse in real-time customer data, generate insight, and deploy solutions to
maintain and improve their competitive position. Heterogeneous business environments put pressure on the
firm to deal with varied external partners, complex and disparate business activities, and competitors from
different domains. With increased heterogeneity comes the requirement of managing multiple business
objectives, a large number of stakeholders and related information, and a broad range of IT-based
applications (Dutot, Bergeron, & Raymond, 2014). By aggregating this information through a strong
BDAC, firms are in a better position to make sense of the complexity of the environment and act on data-
driven insight through focused action. A hostile business environment can occur from radical industry

Big Data Analytics Capabilities and Innovation
changes, intense regulatory burdens, and intense rivalry among competitors. In such circumstances, firms
that have better knowledge of all possible alternative market segments and emerging conditions will be able
to reposition their business objectives and outperform competition. As such, we hypothesize the following:
H6: Greater levels of environmental a) dynamism, b) heterogeneity, and c) hostility will amplify
the positive effect that a big data analytics capability has on a firm’s dynamic capabilities
H7: Greater levels of environmental a) dynamism, b) heterogeneity, and c) hostility will amplify
the positive effect that a firm’s dynamic capabilities have on its incremental innovation
capabilities
H8: Greater levels of environmental a) dynamism, b) heterogeneity, and c) hostility will amplify
the positive effect that a firm’s dynamic capabilities have on its radical innovation capabilities
4. Empirical study
4.1 Survey, administration and data
In this study we used a questionnaire based survey method since it enables generalizability of outcomes,
allows for easy replication, and facilitates the simultaneous investigation of a large number of factors
(Pinsonneault & Kraemer, 1993). Additionally, survey-based research is a well-documented way of
accurately capturing the general tendency and identifying associations between variables in a sample.
Suggestions by Straub, Boudreau, and Gefen (2004), emphasize the importance of survey-based research
in exploratory settings and predictive theory, to be able to generalize results. The constructs and
corresponding survey items used in this questionnaire, are based on previously published latent variables
with psychometric properties that support their validity. All constructs and respective items were
operationalized on a 7-point likert scale, a well-accepted practice in large-scale empirical research where
no standard measures exist for quantifying notions such as resources and capabilities (Kumar, Stern, &
Anderson, 1993). A pre-test was conducted in a small-cycle study with 17 firms to examine the statistical
properties of the measures. These firms operated in Greece but were not part of the sample used in the main
study. The pre-testing procedure enabled us to assess the face and content validity of items and to ensure
that key respondents would be in place to comprehend they survey as intended. After completing the survey
during the pre-test phase, respondents were contacted by phone and asked about the quality of the questions
and the clarity of the instrument. Some minor modifications were made in the phrasing of questions.
For the main study, a population of approximately 1500 firms was used from a mailing list of Chief
Information Officers and IT managers based in Greece. To ensure a collective response, the respondents
were instructed to consult other employees within their firms for information that they were not
knowledgeable about. The data collection process lasted for approximately three months (April 2017 – July
2017), and on average completion time of the survey was 14 minutes. A total of 193 firms started to
complete the survey, with 175 providing complete responses. To determine if there was any non-response
bias in our sample, the profile of the respondents was compared with those on the mailing list we collected
for each company, such as size and industry of operation. The chi-square analysis revealed no systematic
response bias. In addition to non-response, we also examine late-response bias by comparing early (first
two weeks) and late responses (last two weeks) through chi-square tests for firm size, industry, expenditure,
and firm experience with big data. The outcomes showed that there were no statistically significant
differences. Taking into consideration that all data were collected from a single source at one point in time,
and that all data were perceptions of key respondents, we controlled for common method bias following
the guidelines of Chang, Van Witteloostuijn, and Eden (2010). Ex-ante, respondents were assured that all
information they provided would remain completely anonymous and confidential, and that any analysis

Big Data Analytics Capabilities and Innovation
would be done on an aggregate level for research purposes solely. Ex-post, Harman’s one factor test was
employed, which indicated that a single construct could not account for the majority of variance (Fuller,
Simmering, Atinc, Atinc, & Babin, 2016).
The responses received came from companies of a diverse industry background. The largest proportion
came from the ICT and telecommunication sector (20.0%), followed by bank & financials (10.8%),
consumer goods (9.7%), technology (9.1%), while a large proportion came from a variety of other sectors
(30.8%). The majority were medium-sized firms, accounting for 30.2% of the sample, while high
percentages were obtained from large-sized (26.2%) and small firms (24.0%). The survey was
predominantly targeted to senior managers in the IS department, as they are more knowledgeable about
strategic issues relating to IT use. However, to ensure a collective response, respondents were instructed to
consult other employees within their firms for information that they were not knowledgeable about.
Factors Sample (N = 175) Percentage (%)
Industry
Bank & Financials 19 10.8%
Consumer Goods 17 9.7%
Oil & Gas 5 2.8%
Industrials (Construction & Industrial goods) 13 7.4%
ICT and Telecommunications 35 20.0%
Technology 16 9.1%
Media 13 7.4%
Transport 3 1.7%
Other (Shipping, Basic Materials, Consumer Services etc.) 54 30.8%
Firm size (Number of employees)
1 – 9 34 19.4%
10 – 49 42 24.0%
50 – 249 53 30.2%
250+ 46 26.2%
Total Big Data Analytics Experience
< 1 year 26 14.8%
1 – 2 years 38 21.7%
2 – 3 years 49 28.0%
3 – 4 years 34 19.4%
4+ years 28 16.0%
Respondent’s position
CEO/President 23 13.1%
CIO 129 73.7%
Head of Digital Strategy 4 2.0%
Senior Vice President 6 3.4%
Director 6 3.4%
Manager 7 4.0%
Table 2 Descriptive statistics of the sample and respondents
To examine if there is a risk of method bias in our sample, we followed the guidelines of Podsakoff,
MacKenzie, Lee, and Podsakoff (2003) and performed a series of statistical analyses to assess the severity
of common method bias. First, we conducted a Harmon one-factor tests on the four main variables of our
study; BDAC, dynamic capabilities, incremental and radical innovation capabilities. The results did not
yield a uni-factor solution and the maximum variance explained by any one factor was 38.1%, and
indication of an absence of common method bias. Second, we also tests for goodness-of-fit, following the

Big Data Analytics Capabilities and Innovation
guidelines of Tenenhaus, Vinzi, Chatelin, and Lauro (2005) for PLS path modeling. The results showed
that the model has an adequate goodness-of-fit, since it exceeds the threshold of 0.36 as suggested by
Wetzels, Odekerken-Schröder, and Van Oppen (2009). To deal with the measurement error, we employed
structural equation modeling with the maximum likelihood estimate and a multiple indicator approach,
which corrects for the biasing effects of random measurement errors (Akhtar, Khan, Frynas, Tse, & Rao‐
Nicholson, 2018). While omitted biases exist in various forms, we followed the suggestions of Antonakis,
Bendahan, Jacquart, and Lalive (2014) who note that the most important guide in this respect is ‘theory,
theory and more theory’ to develop constructs and multiple constructs can help address this point. We
adhered to these guidelines and our constructs consisted of multiple items and sub-constructs (e.g. BDAC
and dynamic capabilities).
4.2 Measurements
The scales for the various constructs were adopted from prior literature and have therefore been previously
been tested in empirical studies. Appendix A provides a summary of the scales used, their descriptive
statistics, and the supporting literature.
Big Data Analytics Capability (BDAC) was defined in accordance with the study of Gupta and George
(2016) as a firm’s capability to assemble, integrate, and deploy its big data-based resources. Accordingly,
BDAC is conceptualized and developed as a third-order formative construct. The three underlying pillars
that comprise a BDAC are big data-related tangible, human skills, and intangible resource constructs, which
in turn are formulated as second-order formative constructs, comprising of seven first-order constructs.
Specifically, the tangible big data-related components of a BDAC include basic resources (e.g. financial),
technology (e.g. software and hardware), and data (Wamba et al., 2017) which are represented as formative
first-order constructs. Human skills are developed as a Type II second-order construct (first-order reflective,
second-order formative) consisting of two dimensions. These are technical skills which are concerned with
the ability to handle the technological components and analytical requirements of big data, and managerial
skills which are mostly revolved around recognizing the value of big data and understanding where to apply
insight efforts (Akter & Wamba, 2016). Finally, intangible resources were conceptualized and developed
as a Type II second-order construct (first-order reflective, second-order formative) with the underlying
dimensions being a data-driven culture and organizational learning. A data-driven culture describes the
level to which organizational members make decisions based on insight derived from data analysis (McAfee
et al., 2012). Organizational learning on the other hand refers to the concentrated efforts of firm members
to exploit existing knowledge and continuously explore new knowledge in order to keep up with
unpredictable market conditions (D. J. Teece, 2015).
Dynamic Capabilities (DC) was measured as a Type II second order construct (reflective first-order,
formative second-order), comprised of five first order constructs (Jarvis et al., 2003). The proposed
formative model is consistent with Diamantopoulos and Winklhofer`s (2001) guidelines. Thus, first-order
constructs are theoretically distinct and contribute a unique component to the second-order construct. The
first-order constructs that comprise a dynamic capability include (1) sensing, (2) coordinating, (3) learning,
(4) integrating, and (5) reconfiguring routines, which are adapted from past empirical studies (Pavlou & El
Sawy, 2011; Protogerou et al., 2012; Mikalef & Pateli, 2017).
Innovative Capability (IC). An innovative capability is defined in the context of the skills and knowledge
needed to effectively absorb, master and improve existing technologies, products and to create new ones
(Romijn & Albaladejo, 2002). We measured innovative capability through two first-order latent construct;

Big Data Analytics Capabilities and Innovation
incremental innovative capability (INC) and radical innovative capability (RAD). Incremental innovative
capability was measured with three indicators assessing an organizations capability to reinforce and extend
its existing expertise and product/service lines. Likewise, radical innovative capability was assessed
through three indicators that asked respondents to evaluate their organization's ability to make current
product/service lines obsolete (Subramaniam & Youndt, 2005).
The degree of environmental uncertainty was assessed through three constructs, dynamism (DYN),
heterogeneity (HET), and hostility (HOST) (Newkirk & Lederer, 2006). Dynamism is defined as the rate
and unpredictability of environmental change. Heterogeneity reflects the complexity and diversity of
external factors, such as the variety of customer buying habits and the nature of competition. Hostility is
defined as the availability of key resources and the level of competition in the external environment.
Control variables. Firm size was measured as an ordinal value in accordance with the recommendations of
the European Commission (2003/361/EC) into micro (0-9 employees), small (10-49 employees), medium
(50-249 employees), and large (more than 250 employees). Firm age was measured as the age since the
inception of the firm. Industry sub-types were controlled since they can capture different conditions of the
environment that influence the firms’ responsiveness in deploying marketing and technological capabilities.
Finally, we measured ownership structure as a binary control variable, differentiating between private, and
publicly-controlled firms.
5. Analysis
In order to assess the hierarchical research model’s validity and reliability, we applied partial least squares
based structural equation modeling (PLS-SEM) analysis. Specifically, the software package SmartPLS 3
was used to conduct all analyses (Ringle, Wende, & Becker, 2015). PLS-SEM is considered as an
appropriate methodology for this study since it permits the simultaneous estimation of multiple
relationships between one or more independent variables, and one or more dependent variables (Hair,
Ringle, & Sarstedt, 2011). PLS-SEM is a soft modelling technique and is variance-based, with the
advantage for allowing (i) flexibility with respect to the assumptions on multivariate normality, (ii) usage
of both reflective and formative constructs, (iii) the ability to analyze complex models using smaller
samples, and (iv) the potential use as a predictive tool for theory building (Nair, Demirbag, Mellahi, &
Pillai, 2017). PLS-SEM is widely used in analyzing data for the estimation of complex relationships
between constructs in many subject areas including in business and management research (Ahammad,
Tarba, Frynas, & Scola, 2017; West, Hillenbrand, Money, Ghobadian, & Ireland, 2016). In addition, PLS-
SEM enables the analysis of indirect and total effects, making it possible to not only simultaneously assess
the relationships between multi-item constructs, but also to reduce the overall error associated with the
model (Astrachan, Patel, & Wanzenried, 2014). In terms of sample size requirements, the 202 responses
received exceeds both the requirements of: (1) ten times the largest number of formative indicators used to
measure one construct, and (2) ten times the largest number of structural paths directed at a particular latent
construct in the structural model (Hair et al., 2011). Finally, since the proposed research model builds more
on exploratory theory building, rather than theory testing, PLS-SEM is a better alternative than covariance-
based SEM.
5.1 Measurement model

Big Data Analytics Capabilities and Innovation
Since the model contains both reflective and formative constructs, we used different assessment criteria to
evaluate each. For first-order reflective latent constructs we conducted reliability, convergent validity, and
discriminant validity tests. Reliability was assessed at the construct and item level. At the construct level
we examined Composite Reliability (CR), and Cronbach Alpha (CA) values, and established that their
values were above the threshold of 0.70 (Nunnally, 1978). Indicator reliability was assessed by examining
if construct-to-item loadings were above the threshold of 0.70 (Appendix B). To assess convergent validity,
we examined if AVE values were above the lower limit of 0.50, with the lowest observed value being 0.57
which greatly exceeds this threshold. Discriminant validity was established through three means. The first
looked at each constructs AVE square root in order to verify that it is greater than its highest correlation
with any other construct (Fornell-Larcker criterion). The second tested if each indicators outer loading was
greater that its cross-loadings with other constructs (Farrell, 2010). Recently, Henseler, Ringle, and Sarstedt
(2015) argued that a new criterion called the heterotrait-monotrait ratio (HTMT) is a better assessment
indicator of discriminant validity. Values below 0.85 are an indication of sufficient discriminant validity,
hence, the obtained results confirm discriminant validity (Appendix C). The abovementioned results (Table
3) suggest that first-order reflective measures are valid to work with and support the appropriateness of all
items as good indicators for their respective constructs.
(1) (2) (3) (4) (5) (6) (7) (8) (9) (10) (11) (12) (13) (14) (15) (16) (17)
(1) Data n/a
(2) Basic Resources 0.288 n/a
(3) Technology 0.571 0.243 n/a
(4) Managerial Skills 0.561 0.427 0.370 0.875
(5) Technical Skills 0.470 0.487 0.307 0.576 0.947
(6) Data-driven Culture 0.269 0.322 0.222 0.307 0.343 0.811
(7) Organizational Learning
0.529 0.365 0.384 0.513 0.376 0.356 0.885
(8) Sensing 0.333 0.376 0.296 0.286 0.225 0.384 0.346 0.803
(9) Coordinating 0.377 0.315 0.255 0.438 0.310 0.278 0.421 0.485 0.880
(10) Learning 0.329 0.371 0.213 0.442 0.402 0.351 0.358 0.543 0.503 0.907
(11) Integrating 0.194 0.366 0.120 0.233 0.241 0.311 0.181 0.583 0.271 0.341 0.698
(12) Reconfiguring 0.351 0.433 0.351 0.339 0.348 0.394 0.361 0.504 0.526 0.428 0.502 0.830
(13) Incremental 0.213 0.156 0.312 0.284 0.261 0.261 0.301 0.401 0.391 0.317 0.183 0.197 0.821
(14) Radical 0.217 0.285 0.255 0.438 0.310 0.278 0.351 0.317 0.323 0.376 0.296 0.286 0.225 0.840
(15) Dynamism 0.302 0.321 0.259 0.232 0.327 0.251 0.368 0.343 0.204 0.319 0.215 0.438 0.310 0.372 0.871
(16) Heterogeneity 0.255 0.438 0.310 0.270 0.451 0.435 0.333 0.376 0.296 0.286 0.225 0.333 0.376 0.276 0.371 0.810
(17) Hostility 0.213 0.442 0.402 0.351 0.358 0.482 0.204 0.312 0.257 0.438 0.310 0.377 0.315 0.255 0.358 0.289 0.809
Mean 4.98 4.79 4.61 5.07 4.51 5.01 5.17 4.88 4.58 4.51 5.31 5.02 4.10 4.32 4.67 4.13 4.79
Standard Deviation 1.72 1.74 2.02 1.84 1.82 1.81 1.50 1.45 1.38 1.37 1.29 1.28 1.53 1.79 1.45 1.34 1.64
AVE n/a n/a n/a 0.82 0.77 0.75 0.89 0.64 0.77 0.82 0.59 0.69 0.86 0.93 0.87 0.86 0.89
Cronbach’s Alpha n/a n/a n/a 0.93 0.90 0.83 0.96 0.72 0.85 0.81 0.71 0.77 0.92 0.96 0.91 0.90 0.86
Composite Reliability n/a n/a n/a 0.95 0.93 0.90 0.97 0.84 0.91 0.93 0.78 0.86 0.95 0.97 0.92 0.91 0.89
Table 3 Assessment of reliability, convergent and discriminant validity of reflective constructs
For formative indicators, we first examined the weights and significance of their association with their
respective construct. All first-order constructs the items had positive and highly significant effects. Next,
to evaluate the validity of the items of formative constructs, we followed MacKenzie, Podsakoff, and
Podsakoff (2011) guidelines using Edwards (2001) adequacy coefficient (R2a). To do so we summed the
squared correlations between formative items and their respective formative construct and then divided the
sum by the number of indicators. All R2a value exceeded the threshold of 0.50 (Table 3), suggesting that
the majority of variance in the indicators is shared with the overarching construct, and that the indicators
are valid representations of the construct. Similarly, for the higher-order constructs, we first examined the

Big Data Analytics Capabilities and Innovation
weights of the formative lower-order constructs on their higher-order constructs (four second-order
constructs and one third-order construct). All weights were significant, and the results Edward adequacy
coefficient for each was again greater than the limit of 0.50 (Edwards, 2001). Next, we examined the extent
to which the indicators of formative constructs presented multicollinearity, with Variance Inflation Factor
(VIF) values of 3.3 being the cut-off threshold (Petter, Straub, & Rai, 2007). All values of first-order,
second-order, and third-order constructs indicated an absence of mutlicollinearity.
Construct Measures Weight Significance VIF R2a
Data D1 0.383 p<0.001 2.800 0.79
D2 0.287 p<0.001 1.300
D3 0.552 p<0.001 1.112
Basic Resources BR1 0.584 p<0.001 2.890 0.74
BR2 0.496 p<0.001 2.428
Technology T1 0.209 p<0.001 2.256 0.76
T2 0.398 p<0.001 1.986
T3 0.358 p<0.001 2.285
T4 0.202 p<0.001 2.129
T5 0.552 p<0.001 2.030
Tangible Data 0.324 p<0.001 1.471 0.84
Basic Resources 0.311 p<0.001 1.788
Technology 0.541 p<0.001 1.900
Human Managerial Skills 0.572 p<0.001 1.847 0.89
Technical Skills 0.520 p<0.001 1.847
Intangible Data-driven Culture 0.389 p<0.001 1.443 0.91
Organizational Learning 0.731 p<0.001 1.443
BDAC Tangible 0.340 p<0.001 2.108 0.90
Human 0.429 p<0.001 2.447
Intangible 0.358 p<0.001 2.161
Dynamic Capabilities Sensing 0.331 p<0.001 2.042 0.88
Coordinating 0.405 p<0.001 1.834
Learning 0.292 p<0.001 1.973
Integrating 0.302 p<0.001 1.963
Reconfiguring 0.341 p<0.001 1.832
Table 4 Higher-order construct validation
5.2 Structural model
The structural model from the PLS analysis is summarized in Figure 2, where the explained variance of
endogenous variables (R2) and the standardized path coefficients (β) are presented. The structural model is
verified by examining coefficient of determination (R2) values, effect size of predictor variables (f²),
predictive relevance (Stone-Geisser Q2), and the effect size of path coefficients. The significance of
estimates (t-values) are obtained by performing a bootstrap analysis with 5000 resamples. A firms’ BDAC
is found to have an impact on dynamic capabilities (β=0.523, t=8.923, p < 0.001). Contrary, no direct
significant effect was found between a BDAC and a firm’s incremental innovation capabilities (β=0.097,
t=0.935, p > 0.05) or towards radical innovation capabilities (β=0.112, t=1.452, p > 0.05). Additionally,
dynamic capabilities are positively associated with incremental innovation capabilities (β=0.436, t=4.742,
p < 0.001) and marketing capabilities (β=0.462, t=4.938, p < 0.001). With regards to the moderating effect
of environmental uncertainty factors, heterogeneity is found to positively moderate the relationship between
big data analytics capability and dynamic capabilities (β=0.132, t=2.042, p < 0.05), and the effect of

Big Data Analytics Capabilities and Innovation
dynamic capabilities on radical innovation (β=0.124, t=1.982, p < 0.05). On the other hand, dynamism is
found to positively moderate the effect of dynamic capabilities on incremental innovation (β=0.151,
t=2.231, p < 0.05). All other moderating relationships are found to be non-significant. The structural model
explains 38.1% of variance for dynamic capabilities (R2 = 0.381), 36.2% for incremental innovation
capabilities (R2 = 0.362) and 37.3% for radical innovation capabilities (R2 = 0.373). These coefficients of
determination represent moderate to substantial predictive power (Hair Jr, Hult, Ringle, & Sarstedt, 2016).
In addition to examining the R2, the model is evaluated by looking at the effect size f2. The effect size f2
allows us to asses an exogenous constructs contribution to an endogenous latent variables R2, and since all
direct values are either above the thresholds of 0.15 and 0.35, we can conclude that the have moderate to
high effect sizes.
Figure 2 Estimated relationships of structural model
We examined the influence of the control variables on the two outcome variables as presented in Table 5.
The results showed that the effect of firm size was positive and significant (β=0.132, t=2.071, p < 0.05)
with regards to radical innovation capabilities, but non-significant for incremental innovation capabilities
(β=0.071, t=0.971, p > 0.05). They also demonstrated that ICT and telecommunications firms had stronger
radical innovation capabilities (β=0.185, t=1.998, p < 0.05), while Bank & Financial firms presented greater
incremental innovation capabilities (β=0.117, t=1.997, p < 0.05).
Control Variables Incremental Innovation Radical Innovation Weight t-value Sig. Weight t-value Sig.
Firm size 0.071 0.971 n.s. 0.132 2.071 <0.05
Firm age 0.006 0.132 n.s. -0.07 0.135 n.s.
Ownership structure -0.012 0.403 n.s. -0.021 0.541 n.s.
Industry type
Dummy1 - Bank & Financials 0.117 1.997 <0.05 0.006 0.138 n.s.
Dummy2 - Consumer Goods 0.004 0.153 n.s. 0.009 0.112 n.s.
Dummy3 - Industrials (Construction & Industrial goods) -0.013 0.305 n.s. -0.003 0.041 n.s.
Dummy4 - ICT and Telecommunications 0.042 0.583 n.s. 0.011 0.185 <0.05
Dummy5 - Technology 0.031 0.496 n.s. 0.014 0.073 n.s.
Dummy6 - Basic materials -0.037 0.612 n.s. -0.011 0.101 n.s.
Dummy7 - Manufacturing 0.007 0.163 n.s. 0.016 0.173 n.s.
Table 5 Control variables
5.3 Test for mediation

Big Data Analytics Capabilities and Innovation
To examine if the impact of big data analytic capability on incremental and radical innovation capabilities
is mediated by dynamic capabilities, a bootstrapping approach is employed (Hair Jr et al., 2016; Preacher
& Hayes, 2008). Based on the guidelines of Hair Jr et al. (2016), we first confirmed that the mediated paths
(BDAC DC INC and BDAC DC RAD) are significant. By then including the direct paths
(BDAC INC and BDAC RAD) in the model we find that both incremental (β=0.097, t=0.935, p >
0.05) and radical innovation capabilities (β=0.112, t=1.452, p > 0.05) are non-significant an indication of
full mediation. In Table 6 we present the outcomes of the mediation analysis, associated with hypotheses
H4 and H5. To test for the mediation hypotheses, we used the parameter estimates from the bootstrapping
procedure in PLS, based on a resampling of 5000 subsamples, and calculated the standard error of each
mediation effect. We then calculated the t-statistic for each mediation path by dividing the effect of the
indirect path (i.e. the product of each indirect path), by the standard error of mediation effects. This
approach of assessing the significance of indirect paths provides the advantage of not imposing any
distributional assumptions of the indirect effects. In addition, it allows for the calculation of the entire
indirect effect simultaneously in the presence of multiple mediating effects, rather than isolating part of the
structural model. Since the direct effect of BDAC on INC and RAD are found to be non-significant, and
the mediating path significant, we can conclude that dynamic capabilities fully mediate the effect of BDAC
on incremental and radical innovation capabilities.
Structural path Effect t-value a Ratio to Total
Effect (%)
Bias corrected 95%
confidence interval
Conclusion
BDAC INC 0.097 0.935 29.9 [0.043 – 0.164] (Full mediation)
BDAC INC via DC 0.228 3.412*** 70.1 [0.187 – 0.382] H4 Supported
Total indirect effect 0.325 100.0
BDAC RAD 0.112 1.452 31.7 [0.072 – 0.217] (Full mediation)
BDAC RAD via DC 0.241 3.727*** 68.3 [0.142 – 0.303] H5 Supported
Total indirect effect 0.353 100.0
a * significant at p<0.05; ** significant at p<0.01; *** significant at p<0.001 (two-tailed test)
Table 6 Summary of hypotheses and results
5.4 Predictive validity
In addition to examining the R2, the model is assessed by examining the the Q2 predictive relevance of
exogenous variables (Woodside, 2013). This indicator measures how well observed values are reproduced
by the model and its parameter estimates, verifying as such the model`s predictive validity through sample
re-use (Chin, 1998). Values of the Q2 predictive relevance that are greater than 0 imply that the structural
model has predictive relevance, whereas values below 0 are an indication of insufficient predictive
relevance (Hair Jr et al., 2016). From the results of the we find that dynamic capabilities (Q2 = 0.182),
incremental innovation capabilities (Q2 = 0.171), and radical innovation capabilities (Q2 = 0.203) have
satisfactory predictive relevance. In addition, q2 value range from moderate to high revealing (above 0.15
and 0.35 respectively) an adequate effect size of predictive relevance. To examine model fit a test of
composite-based standardized root mean square residual (SRMR) was performed. The current SRMR yields
a value of 0.069, which is below the threshold of 0.08 thus confirming the overall fit of the PLS path model
(Henseler, Hubona, & Ray, 2016). To further establish the predictive validity of the model, this study
employs cross-validation with holdout samples (Hair, Sarstedt, Ringle, & Mena, 2012). Following the

Big Data Analytics Capabilities and Innovation
process described by Carrión, Henseler, Ringle, and Roldán (2016), the sample is randomly divided into a
training sample (n = 107) and a holdout sample (n = 68). The training sample is used to calculate the path
weights and coefficients. Then, the holdout sample observations are normalized, and construct scores are
created using the training sample estimations. The next step involves normalizing the construct scores of
the holdout sample and then using them to create prediction scores. The results confirm the predictive
validity of the model since the R2 for the holdout is close to that of the training sample for all the dependent
variables of the model.
6. Discussion
While the interest around big data analytics is continuously growing, the mechanisms and conditions under
which such investments lead to business value remain largely unexplored in empirical research. The value
of big data analytics has been questioned in several recent articles, since it is argued that only a small
percentage of companies have been able of capture the full potential of their big data investments (Ross,
Beath, & Quaadgras, 2013). This finding is rather striking when considering the vast number of business
publications that talk about the transformative power of big data analytics. Gupta and George (2016) argue
that this phenomenon can be largely attributed to the fact that most of the literature on big data analytics
has been drafted by consultants, therefore lacking in theoretical grounding and large-scale empirical testing.
They also note that what is important is not the technologies surrounding big data analytics, but rather, the
organizational diffusion of such technologies. Interestingly, in a recent survey conducted as part of a study
by the MIT Sloan Management Review, organizational aspects were cited by managers as being the biggest
inhibitors in realizing business value from big data analytics investments (Kiron, 2017). Similar findings
were noted in a Delphi study with technology managers conducted by Vidgen et al. (2017), with the
challenges related to building a BDAC been seen as the main barriers in attaining desired outcomes. While
we now know that technology and data alone are not sufficient to lead to any measurable business value,
the effect of firm-wide BDAC’s on performance outcomes, and particularly innovation remains under-
explored.
6.1 Implications for research
Building on this status of knowledge and the previously mentioned gaps in literature, the objective of this
study was to understand if, and through what mechanisms, big data analytics can lead to enhanced firm
innovation capabilities. To address this research question, we built on the notion of a big data analytics
capability, which is argued to be a necessary capacity that firms must cultivate to derive any substantial
outcomes from their investments. We ground this concept on the well-established RBV and emphasize that
big data analytics is not solely a technical task but necessitates that several other non-technical resources
are developed and orchestrated in order to create a BDAC. In addition, the business value of a BDAC, and
big data in general, have been mostly claimed around anecdotal evidence to date, with the exception of
some early studies (Gupta & George, 2016; Wamba et al., 2017). We addressed this shortcoming in the
literature by providing empirical support for the theoretical framework of a BDAC and the resulting
business value. By analyzing survey data from 175 Greek executive-level technology managers, this study
empirically explored the indirect relationship between a firms BDAC and two types of innovation
capabilities, incremental and radical. Through our narrative we described the role that a BDAC has on
enhancing a firm’s dynamic capabilities and in turn on affecting incremental and radical innovation
capabilities.
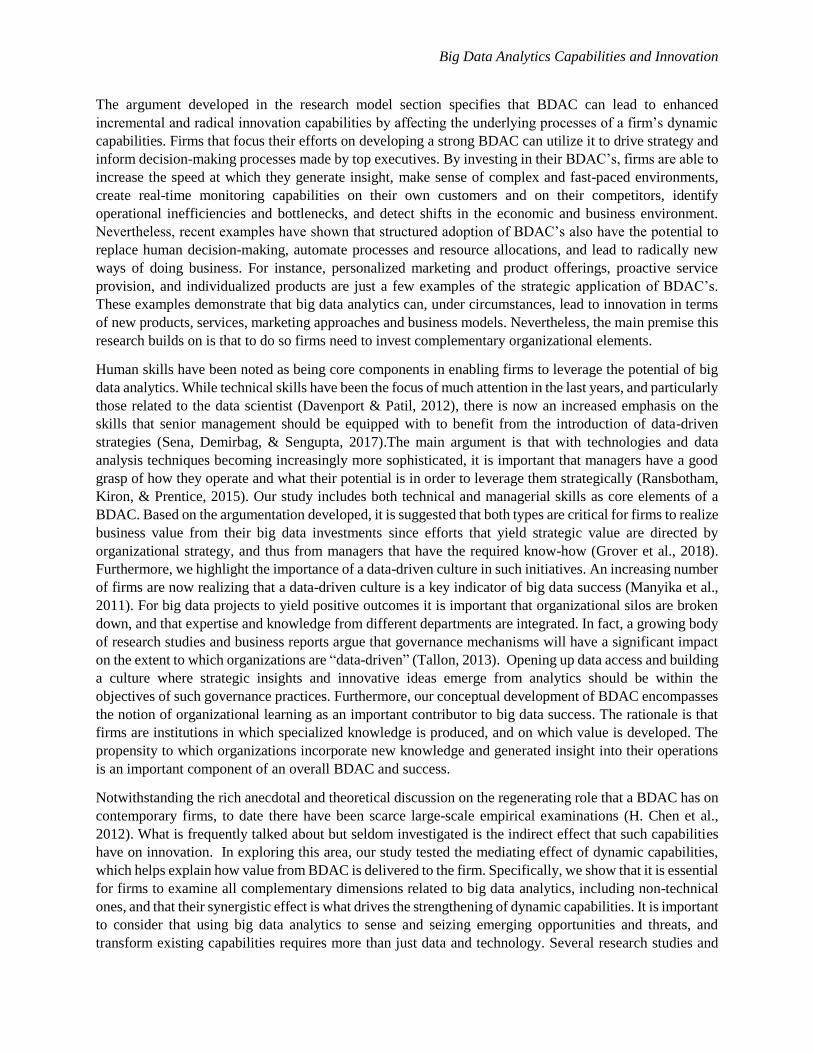
Big Data Analytics Capabilities and Innovation
The argument developed in the research model section specifies that BDAC can lead to enhanced
incremental and radical innovation capabilities by affecting the underlying processes of a firm’s dynamic
capabilities. Firms that focus their efforts on developing a strong BDAC can utilize it to drive strategy and
inform decision-making processes made by top executives. By investing in their BDAC’s, firms are able to
increase the speed at which they generate insight, make sense of complex and fast-paced environments,
create real-time monitoring capabilities on their own customers and on their competitors, identify
operational inefficiencies and bottlenecks, and detect shifts in the economic and business environment.
Nevertheless, recent examples have shown that structured adoption of BDAC’s also have the potential to
replace human decision-making, automate processes and resource allocations, and lead to radically new
ways of doing business. For instance, personalized marketing and product offerings, proactive service
provision, and individualized products are just a few examples of the strategic application of BDAC’s.
These examples demonstrate that big data analytics can, under circumstances, lead to innovation in terms
of new products, services, marketing approaches and business models. Nevertheless, the main premise this
research builds on is that to do so firms need to invest complementary organizational elements.
Human skills have been noted as being core components in enabling firms to leverage the potential of big
data analytics. While technical skills have been the focus of much attention in the last years, and particularly
those related to the data scientist (Davenport & Patil, 2012), there is now an increased emphasis on the
skills that senior management should be equipped with to benefit from the introduction of data-driven
strategies (Sena, Demirbag, & Sengupta, 2017).The main argument is that with technologies and data
analysis techniques becoming increasingly more sophisticated, it is important that managers have a good
grasp of how they operate and what their potential is in order to leverage them strategically (Ransbotham,
Kiron, & Prentice, 2015). Our study includes both technical and managerial skills as core elements of a
BDAC. Based on the argumentation developed, it is suggested that both types are critical for firms to realize
business value from their big data investments since efforts that yield strategic value are directed by
organizational strategy, and thus from managers that have the required know-how (Grover et al., 2018).
Furthermore, we highlight the importance of a data-driven culture in such initiatives. An increasing number
of firms are now realizing that a data-driven culture is a key indicator of big data success (Manyika et al.,
2011). For big data projects to yield positive outcomes it is important that organizational silos are broken
down, and that expertise and knowledge from different departments are integrated. In fact, a growing body
of research studies and business reports argue that governance mechanisms will have a significant impact
on the extent to which organizations are “data-driven” (Tallon, 2013). Opening up data access and building
a culture where strategic insights and innovative ideas emerge from analytics should be within the
objectives of such governance practices. Furthermore, our conceptual development of BDAC encompasses
the notion of organizational learning as an important contributor to big data success. The rationale is that
firms are institutions in which specialized knowledge is produced, and on which value is developed. The
propensity to which organizations incorporate new knowledge and generated insight into their operations
is an important component of an overall BDAC and success.
Notwithstanding the rich anecdotal and theoretical discussion on the regenerating role that a BDAC has on
contemporary firms, to date there have been scarce large-scale empirical examinations (H. Chen et al.,
2012). What is frequently talked about but seldom investigated is the indirect effect that such capabilities
have on innovation. In exploring this area, our study tested the mediating effect of dynamic capabilities,
which helps explain how value from BDAC is delivered to the firm. Specifically, we show that it is essential
for firms to examine all complementary dimensions related to big data analytics, including non-technical
ones, and that their synergistic effect is what drives the strengthening of dynamic capabilities. It is important
to consider that using big data analytics to sense and seizing emerging opportunities and threats, and
transform existing capabilities requires more than just data and technology. Several research studies and

Big Data Analytics Capabilities and Innovation
business reports argue that it is important to understand the areas in which analytics should be applied and
ask questions that have value for the business (Vidgen et al., 2017). Doing so requires an understanding
from top management on the potential and opportunities that big data analytics enable, a firm-wide culture
of basing decisions on data-generated insight, and access to data from multiple departments. In deploying
such actions, it is necessary that firms set up processes, governance structures, and teams with
complementary data skills, and formulate a strategy roadmap that can harness existing and new data assets
(Grover et al., 2018). It is therefore critical that big data analytics initiatives have clear business goals and
a strategic direction. The findings of our analysis complement the emerging literature on how BDAC’s can
be the key to repositioning firms in the competitive landscape. The effect of BDAC on both incremental
and radical innovation capabilities is found to be fully mediated by dynamic capabilities, indicating that big
data analytics can fundamentally change the way firms adjust to external conditions and position themselves
in the market.
Finally, by distinguishing environmental factors into the three distinct variables of dynamism, heterogeneity
and hostility, our study is one of the first to empirically demonstrate that the effect of BDAC is of increased
relevance in uncertain conditions. Specifically, we find that under conditions of high heterogeneity, the
effect of BDAC on dynamic capabilities is amplified. This is justified since when the complexity of the
environment increases, managerial insight may not be sufficient to process all relevant information and take
according decisions. A strong BDAC allows firms to deal with this complexity and deliver insight which
can then be utilized by managers in order to sense, seize, and transform the way their firm operates.
Furthermore, we find that the capacity to effectively reconfigure existing means of operating, results in
increased levels of radical innovation capabilities, especially under high environmental heterogeneity. This
serves to demonstrate that when complexity is high, and the problem of information overload exists, a
BDAC can help in deriving insight from data and can help pinpoint emerging new opportunities for radical
innovation. On the other hand, the effect of dynamic capabilities on incremental innovation capabilities is
accelerated when environmental dynamism is increased. This shows that under circumstances of high
competitive intensity, strong dynamic capabilities are particularly important for the exploitation of existing
options in producing improved products, services, and processes.
6.2 Implications for practice
The results of the present study also have several interesting implications for practitioners. First, this study
shows that big data analytics is more than just mere investments in technology, collection of vast amounts
of data, and allowing the IT department to experiment with novel analytics techniques. Complementary to
the above-mentioned, important elements of gaining business value out of big data investments include
recruiting people with good technical and managerial understanding of big data and analytics, fostering a
culture of organizational learning, and embedding big-data decision making into the fabric of the
organization. Hence, it is the combined effect of these resources that will enable a firm to develop a big
data analytics capability and realize value gains. This of course means that a multitude of processes need
to be put into action, which requires top management commitment and a clear plan for firm-wide big data
analytics adoption and diffusion. A number of studies have already begun to highlight the significance of
all these factors, and provided managers with guidelines on how to develop and mature their BDAC’s
(Mikalef, Framnes, et al., 2017; Vidgen et al., 2017).
One of the most elusive such elements is that of a data-driven culture. A great number of business reports
are now highlighting the importance that a data-driven culture has on realizing business value out of big
data investments. In essence, a data-driven culture builds on the idea that firms should place more weight

Big Data Analytics Capabilities and Innovation
on decisions that have backing from empirical data analysis. Becoming a data-driven firm is a topic of
growing interest in the practitioner community, and entails changes within the organization, including
expanding the skill set of managers who use data, broadening the types of decisions influenced by data, and
cultivating decision making that blends analytical insight with intuition (Ransbotham et al., 2016). Several
accounts from practitioners underscore the significance of infusing the organization with a data-driven
culture, as building firm-wide capabilities by leveraging big data analytics in the absence of a data-driven
culture will likely not have success. Companies that are successful in developing a data-drive culture forge
a strong connection between their organizational strategy and a formal strategy for analytics. Being able to
achieve this however is largely dependent on top management demonstrating that the role of data and
analytics should have a more prominent role in decision making.
By outlining the core resources that are needed to develop a BDAC, this study can help managers construct
an assessment tool, so they can benchmark their organizations strengths and weaknesses. The main pillars,
as defined in the elements that jointly constitute a BDAC, can help expose areas that have been under-
developed or insufficiently funded. Resources of an intangible nature, such as intensity of organizational
learning, and data-driven culture, can provide managers with an understanding of the importance of these
aspects, and help them form strategies to strengthen them throughout the firm. Given that many companies
are still at an inaugurating stage in their big data analytics initiatives, it is critical to have a good overview
of all the areas that should be considered, as well as to calculate expected costs and gains. Furthermore,
while some resources such as technical, data, and even human skills can be quite easily and quickly
replicated or acquired from the market, others, such as a data-driven culture require planning and a well-
documented process to form and mature. Hence, an additional practical implication concerns the calculation
of the time and complexity that some resources require to develop. Managers should therefore think about
the maturation time necessary well before they expect any measurable outcomes from their big data
investments. Adding to this, recruiting employees with the appropriate technical and managerial skills in
the age of big data is a great concern for many executives. Our findings showcase the importance of these
in realizing business value.
Finally, the outcomes of our study show that even by fostering a strong BDAC, business value is not directly
achieved. In other words, while firms may be producing solid data-driven insight as a result of their
BDAC’s, action is required to capitalize upon it. Data-driven insight is only a component of a firm’s ability
to sense, seize, and reconfigure, and doing so successfully means that the organization must be designed to
be able to respond to changes that insight indicate. This requires flexibility in operations, fast re-deployment
of organizational capabilities, and dissolution of any form of inertia that can hinder insight to be transformed
into action. Managers need to realize that big data-generated insight is only one component of gaining value
from big data investments, the other is responsiveness. This is a prominent theme in the guest editorial of
R. Sharma et al. (2014), in which the authors discuss the importance of understanding the process from
insight to action and value creation.
6.3 Limitations and future research
Despite the contributions of the present study it is constrained by a number of limitations that future research
could seek to address. First, as noted already, self-reported data are used to test our research hypotheses.
Although considerable efforts were undertaken to confirm data quality, the potential of biases cannot be
excluded. The perceptual nature of the data, in combination with a study-design that uses a single key
informant, could suggest that there is bias, and that factual data do not coincide with respondents’
perceptions. Despite this study relying on top management respondents as key informants, which typically

Big Data Analytics Capabilities and Innovation
have good knowledge on various related domains, sampling multiple respondents within a single firm
would be useful to establish inter-rater validity and to improve internal validity. Second, although we
examine the effect of big data analytics capabilities on different types of innovation capabilities, we do not
factor in contextual and market specific conditions. It is highly probable that the value of directing big data
initiatives may be more beneficial in some cases than in others. This is an area that future research should
seek to address, and it is of increased practical value, particularly considering the costs of deploying big
data initiatives. The main argument that a big data analytics capability is necessary but not a sufficient
condition to lead to competitive performance gains remains subject to several internal and external factors,
which hopefully will be addressed in subsequent research studies. It is important to understand in each
industry how big data analytics capabilities are developed, as well as through what mechanisms they
produce value, and how that can be captured. Third, while we look at the relationship between big data
analytics capabilities and the indirect effect on innovation capabilities, we do so under the assumption that
managers make the best choice of option when faced with data-generated insight. In addition, it could even
be possible that decision is not based on big data intelligence at all, as there are multiple factors that come
into play regarding managers decision to adopt or not data-generated insight. This is a promising area of
research since generating big data insight is only one step to capturing business value.
References
Abbasi, A., Sarker, S., & Chiang, R. H. (2016). Big Data Research in Information Systems: Toward an
Inclusive Research Agenda. Journal of the association for information systems, 17(2).
Ahammad, M. F., Tarba, S. Y., Frynas, J. G., & Scola, A. (2017). Integration of Non‐market and Market
Activities in Cross‐border Mergers and Acquisitions. British Journal of Management, 28(4), 629-
648.
Akhtar, P., Khan, Z., Frynas, J. G., Tse, Y. K., & Rao‐Nicholson, R. (2018). Essential micro‐foundations
for contemporary business operations: Top management tangible competencies, relationship‐based
business networks and environmental sustainability. British Journal of Management, 29(1), 43-62.
Akter, S., & Wamba, S. F. (2016). Big data analytics in E-commerce: a systematic review and agenda for
future research. Electronic Markets, 26(2), 173-194.
Almada-Lobo, F. (2016). The Industry 4.0 revolution and the future of Manufacturing Execution Systems
(MES). Journal of Innovation Management, 3(4), 16-21.
Alyass, A., Turcotte, M., & Meyre, D. (2015). From big data analysis to personalized medicine for all:
challenges and opportunities. BMC medical genomics, 8(1), 33.
Ambrosini, V., Bowman, C., & Collier, N. (2009). Dynamic capabilities: an exploration of how firms renew
their resource base. British Journal of Management, 20, S9-S24.
Amit, R., & Schoemaker, P. J. (1993). Strategic assets and organizational rent. Strategic management
journal, 14(1), 33-46.
Antonakis, J., Bendahan, S., Jacquart, P., & Lalive, R. (2014). Causality and endogeneity: Problems and
solutions. The Oxford handbook of leadership and organizations, 1, 93-117.
Aspect. (2013). Southwest Airlines heads to the cloud with Aspect software to provide best-in-class
customer experience [Press release]. Retrieved from http://www.aspect.com/company/news/press-
releases/southwest-airlines-heads-to-the-cloud-with-aspect-software-to-provide-best-in-class-
customer-experience
Astrachan, C. B., Patel, V. K., & Wanzenried, G. (2014). A comparative study of CB-SEM and PLS-SEM
for theory development in family firm research. Journal of Family Business Strategy, 5(1), 116-
128.
Barney, J. B. (1991). Firm resources and sustained competitive advantage. Journal of management, 17(1),
99-120.

Big Data Analytics Capabilities and Innovation
Benitez, J., Castillo, A., Llorens, J., & Braojos, J. (2017). IT-enabled knowledge ambidexterity and
innovation performance in small US firms: The moderator role of social media capability.
Information & Management.
Bharadwaj, A. (2000). A resource-based perspective on information technology capability and firm
performance: an empirical investigation. MIS quarterly, 24(1), 169-196.
Bhatt, G. D., & Grover, V. (2005). Types of Information Technology Capabilities and Their Role in
Competitive Advantage: An Empirical Study. Journal of Management Information Systems, 22(2),
253-277.
Braganza, A., Brooks, L., Nepelski, D., Ali, M., & Moro, R. (2017). Resource management in big data
initiatives: Processes and dynamic capabilities. Journal of Business Research, 70, 328-337.
Brinkhues, R., Maçada, A. C., & Casalinho, G. (2014). Information management capabilities: antecedents
and consequences.
Buettner, R. (2017). Predicting user behavior in electronic markets based on personality-mining in large
online social networks. Electronic Markets, 27(3), 247-265.
Carrión, G. C., Henseler, J., Ringle, C. M., & Roldán, J. L. (2016). Prediction-oriented modeling in business
research by means of PLS path modeling: introduction to a JBR special section. Journal of Business
Research, 69(10), 4545-4551.
Chang, S.-J., Van Witteloostuijn, A., & Eden, L. (2010). From the editors: Common method variance in
international business research. Journal of International Business Studies, 41(2), 178-184.
Chen, C. P., & Zhang, C.-Y. (2014). Data-intensive applications, challenges, techniques and technologies:
A survey on Big Data. Information Sciences, 275, 314-347.
Chen, H., Chiang, R. H., & Storey, V. C. (2012). Business intelligence and analytics: From big data to big
impact. MIS quarterly, 36(4).
Chiang, Y. H., & Hung, K. P. (2010). Exploring open search strategies and perceived innovation
performance from the perspective of inter‐organizational knowledge flows. R&d Management,
40(3), 292-299.
Chin, W. W. (1998). The partial least squares approach to structural equation modeling. Modern methods
for business research, 295(2), 295-336.
Constantiou, I. D., & Kallinikos, J. (2015). New games, new rules: big data and the changing context of
strategy. Journal of Information Technology, 30(1), 44-57.
Darroch, J. (2005). Knowledge management, innovation and firm performance. Journal of Knowledge
Management, 9(3), 101-115.
Davenport, T. H., & Patil, D. (2012). Data scientist: The Sexiest Job of the 21st Century. Harvard Business
Review, 90(5), 70-76.
Delta. (2016). Delta introduces innovative baggage tracking process
Retrieved from http://news.delta.com/delta-introduces-innovative-baggage-tracking-process-0
Drnevich, P. L., & Kriauciunas, A. P. (2011). Clarifying the conditions and limits of the contributions of
ordinary and dynamic capabilities to relative firm performance. Strategic management journal,
32(3), 254-279.
Dutot, V., Bergeron, F., & Raymond, L. (2014). Information management for the internationalization of
SMEs: An exploratory study based on a strategic alignment perspective. International Journal of
Information Management, 34(5), 672-681.
Edwards, J. R. (2001). Multidimensional constructs in organizational behavior research: An integrative
analytical framework. Organizational Research Methods, 4(2), 144-192.
Eisenhardt, K. M., & Martin, J. A. (2000). Dynamic capabilities: what are they? Strategic management
journal, 21(10/11), 1105-1121.
Erevelles, S., Fukawa, N., & Swayne, L. (2016). Big Data consumer analytics and the transformation of
marketing. Journal of Business Research, 69(2), 897-904.
Fan, S., Lau, R. Y., & Zhao, J. L. (2015). Demystifying big data analytics for business intelligence through
the lens of marketing mix. Big Data Research, 2(1), 28-32.

Big Data Analytics Capabilities and Innovation
Farrell, A. M. (2010). Insufficient discriminant validity: A comment on Bove, Pervan, Beatty, and Shiu
(2009). Journal of Business Research, 63(3), 324-327.
Felin, T., & Powell, T. C. (2016). Designing organizations for dynamic capabilities. California management
review, 58(4), 78-96.
Forés, B., & Camisón, C. (2016). Does incremental and radical innovation performance depend on different
types of knowledge accumulation capabilities and organizational size? Journal of Business
Research, 69(2), 831-848.
Fuller, C. M., Simmering, M. J., Atinc, G., Atinc, Y., & Babin, B. J. (2016). Common methods variance
detection in business research. Journal of Business Research, 69(8), 3192-3198.
Gold, A. H., & Arvind Malhotra, A. H. S. (2001). Knowledge management: An organizational capabilities
perspective. Journal of Management Information Systems, 18(1), 185-214.
Grant, R. M. (1991). The resource-based theory of competitive advantage: implications for strategy
formulation. California management review, 33(3), 114-135.
Grover, V., Chiang, R. H., Liang, T.-P., & Zhang, D. (2018). Creating Strategic Business Value from Big
Data Analytics: A Research Framework. Journal of Management Information Systems, 35(2), 388-
423.
Günther, W. A., Mehrizi, M. H. R., Huysman, M., & Feldberg, F. (2017). Debating big data: A literature
review on realizing value from big data. The Journal of Strategic Information Systems.
Guo, L., Sharma, R., Yin, L., Lu, R., & Rong, K. (2017). Automated competitor analysis using big data
analytics: Evidence from the fitness mobile app business. Business Process Management Journal,
23(3), 735-762.
Gupta, M., & George, J. F. (2016). Toward the development of a big data analytics capability. Information
& Management, 53(8), 1049-1064.
Hair, J. F., Ringle, C. M., & Sarstedt, M. (2011). PLS-SEM: Indeed a silver bullet. Journal of Marketing
theory and Practice, 19(2), 139-152.
Hair, J. F., Sarstedt, M., Ringle, C. M., & Mena, J. A. (2012). An assessment of the use of partial least
squares structural equation modeling in marketing research. Journal of the Academy of Marketing
science, 40(3), 414-433.
Hair Jr, J. F., Hult, G. T. M., Ringle, C., & Sarstedt, M. (2016). A primer on partial least squares structural
equation modeling (PLS-SEM): Sage Publications.
He, W., Zha, S., & Li, L. (2013). Social media competitive analysis and text mining: A case study in the
pizza industry. International Journal of Information Management, 33(3), 464-472.
Helfat, C. E., & Peteraf, M. A. (2009). Understanding dynamic capabilities: progress along a developmental
path. In: Sage publications Sage UK: London, England.
Helfat, C. E., & Winter, S. G. (2011). Untangling dynamic and operational capabilities: Strategy for the (N)
ever‐changing world. Strategic management journal, 32(11), 1243-1250.
Henseler, J., Hubona, G., & Ray, P. A. (2016). Using PLS path modeling in new technology research:
updated guidelines. Industrial Management & Data Systems, 116(1), 2-20.
Henseler, J., Ringle, C. M., & Sarstedt, M. (2015). A new criterion for assessing discriminant validity in
variance-based structural equation modeling. Journal of the Academy of Marketing science, 43(1),
115-135.
Hosny, A., Parmar, C., Quackenbush, J., Schwartz, L. H., & Aerts, H. J. (2018). Artificial intelligence in
radiology. Nature Reviews Cancer, 1.
Hu, D., Zhao, J. L., Hua, Z., & Wong, M. C. (2012). Network-based modeling and analysis of systemic risk
in banking systems. MIS quarterly, 1269-1291.
Intel. (2013). Accelerating Business Growth through IT. Retrieved from
Jang, H.-J., Sim, J., Lee, Y., & Kwon, O. (2013). Deep sentiment analysis: Mining the causality between
personality-value-attitude for analyzing business ads in social media. Expert Systems with
applications, 40(18), 7492-7503.
Janssen, M., van der Voort, H., & Wahyudi, A. (2017). Factors influencing big data decision-making
quality. Journal of Business Research, 70, 338-345.

Big Data Analytics Capabilities and Innovation
Ji-fan Ren, S., Fosso Wamba, S., Akter, S., Dubey, R., & Childe, S. J. (2017). Modelling quality dynamics,
business value and firm performance in a big data analytics environment. International Journal of
Production Research, 55(17), 5011-5026.
Kiron, D. (2017). Lessons from Becoming a Data-Driven Organization. MIT sloan management review,
58(2).
Koberg, C. S., Detienne, D. R., & Heppard, K. A. (2003). An empirical test of environmental,
organizational, and process factors affecting incremental and radical innovation. The Journal of
High Technology Management Research, 14(1), 21-45.
Kumar, N., Stern, L. W., & Anderson, J. C. (1993). Conducting interorganizational research using key
informants. Academy of management journal, 36(6), 1633-1651.
Kwon, O., Lee, N., & Shin, B. (2014). Data quality management, data usage experience and acquisition
intention of big data analytics. International Journal of Information Management, 34(3), 387-394.
LaValle, S., Lesser, E., Shockley, R., Hopkins, M. S., & Kruschwitz, N. (2011). Big data, analytics and the
path from insights to value. MIT sloan management review, 52(2), 21.
Lee, I. (2017). Big data: Dimensions, evolution, impacts, and challenges. Business Horizons, 60(3), 293-
303.
Lee, J., Ardakani, H. D., Yang, S., & Bagheri, B. (2015). Industrial big data analytics and cyber-physical
systems for future maintenance & service innovation. Procedia Cirp, 38, 3-7.
Lehrer, C., Wieneke, A., vom Brocke, J., Jung, R., & Seidel, S. (2018). How big data analytics enables
service innovation: materiality, affordance, and the individualization of service. Journal of
Management Information Systems, 35(2), 424-460.
Li, D.-y., & Liu, J. (2014). Dynamic capabilities, environmental dynamism, and competitive advantage:
Evidence from China. Journal of Business Research, 67(1), 2793-2799.
Lim, L. L., Alpan, G., & Penz, B. (2014). Reconciling sales and operations management with distant
suppliers in the automotive industry: a simulation approach. International Journal of Production
Economics, 151, 20-36.
Liu, Y. (2014). Big data and predictive business analytics. The Journal of Business Forecasting, 33(4), 40.
Lu, Y., & Ramamurthy, K. (2011). Understanding the link between information technology capability and
organizational agility: An empirical examination. MIS quarterly, 35(4), 931-954.
MacKenzie, S. B., Podsakoff, P. M., & Podsakoff, N. P. (2011). Construct measurement and validation
procedures in MIS and behavioral research: Integrating new and existing techniques. MIS
quarterly, 35(2), 293-334.
Manyika, J., Chui, M., Brown, B., Bughin, J., Dobbs, R., Roxburgh, C., & Byers, A. H. (2011). Big data:
The next frontier for innovation, competition, and productivity.
Maseleno, A., Sabani, N., Huda, M., Ahmad, R., Jasmi, K. A., & Basiron, B. (2018). Demystifying Learning
Analytics in Personalised Learning. International Journal of Engineering & Technology, 7(3),
1124-1129.
McAfee, A., Brynjolfsson, E., & Davenport, T. H. (2012). Big data: the management revolution. Harvard
Business Review, 90(10), 60-68.
Mikalef, P., Framnes, V. A., Danielsen, F., Krogstie, J., & Olsen, D. H. (2017, 2018). Big Data Analytics
Capability: Antecedents and Business Value. Paper presented at the Pacific Asia Conference on
Information Systems, Langkawi, Malaysia.
Mikalef, P., Pappas, I. O., Krogstie, J., & Giannakos, M. (2017). Big data analytics capabilities: a systematic
literature review and research agenda. Information Systems and e-Business Management, 1-32.
Mikalef, P., & Pateli, A. (2017). Information technology-enabled dynamic capabilities and their indirect
effect on competitive performance: Findings from PLS-SEM and fsQCA. Journal of Business
Research, 70, 1-16.
Nair, S. R., Demirbag, M., Mellahi, K., & Pillai, K. G. (2017). Do parent units benefit from reverse
knowledge transfer? British Journal of Management.
Newkirk, H. E., & Lederer, A. L. (2006). The effectiveness of strategic information systems planning under
environmental uncertainty. Information & Management, 43(4), 481-501.

Big Data Analytics Capabilities and Innovation
Ngai, E. W., Gunasekaran, A., Wamba, S. F., Akter, S., & Dubey, R. (2017). Big data analytics in electronic
markets. Electronic Markets, 27(3), 243-245.
Nunnally, J. (1978). Psychometric methods. In: New York: McGraw-Hill.
Orenga-Roglá, S., & Chalmeta, R. (2016). Social customer relationship management: taking advantage of
Web 2.0 and Big Data technologies. SpringerPlus, 5(1), 1462.
Pavlou, P. A., & El Sawy, O. A. (2006). From IT leveraging competence to competitive advantage in
turbulent environments: The case of new product development. Information Systems Research,
17(3), 198-227.
Pavlou, P. A., & El Sawy, O. A. (2011). Understanding the Elusive Black Box of Dynamic Capabilities.
Decision Sciences, 42(1), 239-273. doi:10.1111/j.1540-5915.2010.00287.x
Pinsonneault, A., & Kraemer, K. (1993). Survey research methodology in management information
systems: an assessment. Journal of Management Information Systems, 10(2), 75-105.
Podsakoff, P. M., MacKenzie, S. B., Lee, J.-Y., & Podsakoff, N. P. (2003). Common method biases in
behavioral research: a critical review of the literature and recommended remedies. Journal of
applied psychology, 88(5), 879.
Popovič, A., Hackney, R., Tassabehji, R., & Castelli, M. (2018). The impact of big data analytics on firms’
high value business performance. Information Systems Frontiers, 20(2), 209-222.
Preacher, K. J., & Hayes, A. F. (2008). Asymptotic and resampling strategies for assessing and comparing
indirect effects in multiple mediator models. Behavior research methods, 40(3), 879-891.
Prescott, M. (2014). Big data and competitive advantage at Nielsen. Management Decision, 52(3), 573-
601.
Protogerou, A., Caloghirou, Y., & Lioukas, S. (2011). Dynamic capabilities and their indirect impact on
firm performance. Industrial and Corporate Change, 21(3), 615-647.
Provost, F., & Fawcett, T. (2013). Data science and its relationship to big data and data-driven decision
making. Big Data, 1(1), 51-59.
Ransbotham, S., & Kiron, D. (2017). Analytics as a Source of Business Innovation. MIT Sloan Management
Review.
Ransbotham, S., Kiron, D., & Prentice, P. K. (2015). Minding the analytics gap. MIT sloan management
review, 56(3), 63.
Ransbotham, S., Kiron, D., & Prentice, P. K. (2016). Beyond the hype: the hard work behind analytics
success. MIT sloan management review, 57(3).
Ringle, C. M., Wende, S., & Becker, J.-M. (2015). SmartPLS 3. Boenningstedt: SmartPLS GmbH,
http://www. smartpls. com.
Ritala, P., & Hurmelinna‐Laukkanen, P. (2013). Incremental and radical innovation in coopetition—The
role of absorptive capacity and appropriability. Journal of Product Innovation Management, 30(1),
154-169.
Ross, J. W., Beath, C. M., & Quaadgras, A. (2013). You may not need big data after all. Harvard Business
Review, 91(12), 90-+.
Sagiroglu, S., & Sinanc, D. (2013). Big data: A review. Paper presented at the Collaboration Technologies
and Systems (CTS), 2013 International Conference on.
Schilke, O., Hu, S., & Helfat, C. E. (2018). Quo vadis, dynamic capabilities? A content-analytic review of
the current state of knowledge and recommendations for future research. Academy of Management
Annals, 12(1), 390-439.
Schoenherr, T., & Speier‐Pero, C. (2015). Data science, predictive analytics, and big data in supply chain
management: Current state and future potential. Journal of Business Logistics, 36(1), 120-132.
Schryen, G. (2013). Revisiting IS business value research: what we already know, what we still need to
know, and how we can get there. European Journal of Information Systems, 22(2), 139-169.
Seddon, J. J., & Currie, W. L. (2017). A model for unpacking big data analytics in high-frequency trading.
Journal of Business Research, 70, 300-307.
Sena, V., Demirbag, M., & Sengupta, A. (2017). British Journal of Management Special Issue 2019-CALL
FOR PAPERS: BIG DATA AND PERFORMANCE. British Journal of Management.

Big Data Analytics Capabilities and Innovation
Sharma, R., Mithas, S., & Kankanhalli, A. (2014). Transforming decision-making processes: a research
agenda for understanding the impact of business analytics on organisations. European Journal of
Information Systems, 23(4), 433-441.
Sharma, S., & Vredenburg, H. (1998). Proactive corporate environmental strategy and the development of
competitively valuable organizational capabilities. Strategic management journal, 729-753.
Straub, D., Boudreau, M.-C., & Gefen, D. (2004). Validation guidelines for IS positivist research. The
Communications of the Association for Information Systems, 13(1), 63.
Subramaniam, M., & Youndt, M. A. (2005). The influence of intellectual capital on the types of innovative
capabilities. Academy of management journal, 48(3), 450-463.
Tallon, P. P. (2013). Corporate governance of big data: Perspectives on value, risk, and cost. Computer,
46(6), 32-38.
Tallon, P. P., Ramirez, R. V., & Short, J. E. (2013). The information artifact in IT governance: toward a
theory of information governance. Journal of Management Information Systems, 30(3), 141-178.
Teece, D., & Leih, S. (2016). Uncertainty, innovation, and dynamic capabilities: An introduction.
California management review, 58(4), 5-12.
Teece, D. J. (2007). Explicating dynamic capabilities: the nature and microfoundations of (sustainable)
enterprise performance. Strategic management journal, 28(13), 1319-1350.
Teece, D. J. (2015). Intangible assets and a theory of heterogeneous firms. In Intangibles, Market Failure
and Innovation Performance (pp. 217-239): Springer.
Teece, D. J., Pisano, G., & Shuen, A. (1997). Dynamic capabilities and strategic management. Strategic
management journal, 18(7), 509-533.
Tenenhaus, M., Vinzi, V. E., Chatelin, Y.-M., & Lauro, C. (2005). PLS path modeling. Computational
statistics & data analysis, 48(1), 159-205.
Tushman, M. L., & Romanelli, E. (2008). Organizational evolution. Organization change: A
comprehensive reader, 155(2008), 174.
Van Doorn, J., Mende, M., Noble, S. M., Hulland, J., Ostrom, A. L., Grewal, D., & Petersen, J. A. (2017).
Domo arigato Mr. Roboto: Emergence of automated social presence in organizational frontlines
and customers’ service experiences. Journal of Service Research, 20(1), 43-58.
Vidgen, R., Shaw, S., & Grant, D. B. (2017). Management challenges in creating value from business
analytics. European Journal of Operational Research, 261(2), 626-639.
Wade, M., & Hulland, J. (2004). The resource-based view and information systems research: Review,
extension, and suggestions for future research. MIS quarterly, 28(1), 107-142.
Waller, M. A., & Fawcett, S. E. (2013). Data science, predictive analytics, and big data: a revolution that
will transform supply chain design and management. Journal of Business Logistics, 34(2), 77-84.
Wamba, S. F., Akter, S., Edwards, A., Chopin, G., & Gnanzou, D. (2015). How ‘big data’can make big
impact: Findings from a systematic review and a longitudinal case study. International Journal of
Production Economics, 165, 234-246.
Wamba, S. F., Gunasekaran, A., Akter, S., Ren, S. J.-f., Dubey, R., & Childe, S. J. (2017). Big data analytics
and firm performance: Effects of dynamic capabilities. Journal of Business Research, 70, 356-365.
Wang, G., Gunasekaran, A., Ngai, E. W., & Papadopoulos, T. (2016). Big data analytics in logistics and
supply chain management: Certain investigations for research and applications. International
Journal of Production Economics, 176, 98-110.
Wang, Y., Kung, L., & Byrd, T. A. (2018). Big data analytics: Understanding its capabilities and potential
benefits for healthcare organizations. Technological Forecasting and Social Change, 126, 3-13.
West, B., Hillenbrand, C., Money, K., Ghobadian, A., & Ireland, R. D. (2016). Exploring the impact of
social axioms on firm reputation: A stakeholder perspective. British Journal of Management, 27(2),
249-270.
Wetzels, M., Odekerken-Schröder, G., & Van Oppen, C. (2009). Using PLS path modeling for assessing
hierarchical construct models: Guidelines and empirical illustration. MIS quarterly, 177-195.

Big Data Analytics Capabilities and Innovation
Wilden, R., & Gudergan, S. P. (2015). The impact of dynamic capabilities on operational marketing and
technological capabilities: investigating the role of environmental turbulence. Journal of the
Academy of Marketing science, 43(2), 181-199.
Winter, S. G. (2003). Understanding dynamic capabilities. Strategic management journal, 24(10), 991-995.
Woodside, A. G. (2013). Moving beyond multiple regression analysis to algorithms: Calling for adoption
of a paradigm shift from symmetric to asymmetric thinking in data analysis and crafting theory. In:
Elsevier.
Xu, Z., Frankwick, G. L., & Ramirez, E. (2016). Effects of big data analytics and traditional marketing
analytics on new product success: A knowledge fusion perspective. Journal of Business Research,
69(5), 1562-1566.
Xue, L., Ray, G., & Gu, B. (2011). Environmental uncertainty and IT infrastructure governance: A
curvilinear relationship. Information Systems Research, 22(2), 389-399.
Zahra, S. A., Sapienza, H. J., & Davidsson, P. (2006). Entrepreneurship and dynamic capabilities: A review,
model and research agenda. Journal of Management studies, 43(4), 917-955.
Appendix A. Survey Instrument
Measure Item
Big Data Analytics Capability
Tangible
- Data D1. We have access to very large, unstructured, or fast-moving data for analysis
D2. We integrate data from multiple sources into a data warehouse for easy access
D3. We integrate external data with internal to facilitate analysis of business environment
- Basic
Resources
BR1. Our 'big data analytics' projects are adequately funded
BR2. Our 'big data analytics' projects are given enough time to achieve their objectives
- Technology T1. We have explored or adopted parallel computing approaches (e.g., Hadoop) to big data
processing
T2. We have explored or adopted different data visualization tools
T3. We have explored or adopted new forms of databases such as Not Only SQL(NoSQL)
T4. We have explored or adopted cloud-based services for processing data and performing
analytics
T5. We have explored or adopted open-source software for big data analytics
Human Skills
- Managerial Skills MS1. Our BDA managers are able to understand the business need of other functional managers,
suppliers, and customers to determine opportunities that big data might bring to our business.
MS2. Our DBA managers are able to coordinate big data-related activities in ways that support
other functional managers, suppliers, and customers
MS3. Our BDA' managers are able to understand and evaluate the output extracted from big data
MS4. Our BDA' managers are able to understand where to apple big data
- Technical Skills TS1. Our 'big data analytics' staff has the right skills to accomplish their jobs successfully
TS2. Our 'big data analytics' staff is well trained
TS3. We provide big data analytics training to our own employees
TS4. Our 'big data analytics' staff has suitable education to fulfil their jobs
Intangible
- Data-driven
Culture
DD1. We base our decisions on data rather than on instinct
DD2. We are willing to override our own intuition when data contradict our viewpoints
DD3. We continuously coach our employees to make decisions based on data
- Organizational
Learning
OL1. We are able to acquire new and relevant knowledge
OL2. We have made concerted efforts for the exploitation of existing competencies and
exploration of new knowledge
OL3. We are able to assimilate relevant knowledge
OL4. We are able to apply relevant knowledge
Dynamic Capabilities Please indicate how effective your company is in the following areas
Sensing SNS1. Scanning the environment and identifying new business opportunities
SNS2. Reviewing our product development efforts to ensure they are in line with what the
customers want
SNS3. Implementing ideas for new products and improving existing products or services

Big Data Analytics Capabilities and Innovation
SNS4. Anticipating discontinuities arising in our business domain by developing greater reactive
and proactive strength
Coordinating CRD1. Providing more effective coordination among different functional activities
CRD2. Providing more effective coordination with customers, business partners and distributors
CRD3. Ensuring that the output of work is synchronized with the work of other functional units
or business partners
CRD4. Reducing redundant tasks, or overlapping activities performed by different operational
units
Learning LRN1. Identify, evaluate, and import new information and knowledge
LRN2. Transform existing information into new knowledge
LRN3. Assimilate new information and knowledge
LRN4. Use accumulated information and knowledge to assist decision making
Integrating INT1. Easily accessing data and other valuable resources in real time from business partners
INT2. Aggregating relevant information from business partners, suppliers and customers. (e.g.
operating information, business customer performance)
INT3. Collaborating in demand forecasting and planning between our firm and our business
partners
INT4. Streamlining business processes with suppliers, distributors, and customers
Reconfiguring REC1. Adjusting for and responding to unexpected changes easily
REC2. Easily adding an eligible new partner that you want to do business with or removing ones
that you have terminated your partnership
REC3. Adjusting our business processes in response to shifts in our business priorities
REC4. Reconfiguring our business processes in order to come up with new productive assets
Innovative Capability How would you rate your organizations capability to generate the following types of innovations
in the products/services you introduce
Incremental INC1. Innovations that reinforce our prevailing product/service lines
INC2. Innovations that reinforce our existing expertise in prevailing products/services
INC3. Innovations that reinforce how you currently compete
Radical
RAD1. Innovations that make our prevailing product/service lines obsolete
RAD2. Innovations that fundamentally change our prevailing products/services
RAD3. Innovations that make our expertise in prevailing products/services obsolete
Environmental Uncertainty
Dynamism With respect to the uncertainty of your environment, please indicate how much you agree or
disagree with the following statements
DYN1. Products and services in our industry become obsolete very quickly
DYN2. The product/services technologies in our industry change very quickly
DYN3. We can predict what our competitors are going to do next (Reverse coded)
DYN4. We can predict when our products/services demand changes (Reverse coded)
Heterogeneity With respect to the uncertainty of your environment, please indicate how much you agree or
disagree with the following statements
HET1. Customer buying habits
HET2. Nature of competition
HET3. Product lines
Hostility With respect to the uncertainty of your environment, please indicate how much you agree or
disagree with the following statements
HOS1. Scarce supply of labor
HOS2. Scarce supply of materials
HOS3. Tough price competition
HOS4. Tough competition in product/service quality
HOS5. Tough competition in product/service differentiation

Big Data Analytics Capabilities and Innovation
Appendix B. Cross-loadings
D BR T MS TS DD OL DS DC DL DI DR INC RAD DYN HET HOS
D1 0.714 0.199 0.480 0.286 0.294 0.156 0.270 0.254 0.258 0.105 0.511 0.444 0.213 0.288 0.345 0.332 0.489
D2 0.725 0.238 0.224 0.402 0.439 0.278 0.308 0.187 0.335 0.343 0.564 0.392 0.162 0.192 0.322 0.448 0.399
D3 0.817 0.216 0.457 0.543 0.360 0.206 0.541 0.267 0.276 0.330 0.534 0.324 0.072 0.265 0.338 0.488 0.512
BR1 0.272 0.926 0.249 0.387 0.520 0.260 0.352 0.362 0.315 0.326 0.467 0.258 0.343 0.401 0.247 0.411 0.507
BR2 0.242 0.851 0.172 0.387 0.312 0.343 0.296 0.306 0.237 0.353 0.475 0.438 0.313 0.378 0.237 0.300 0.376
T1 0.408 0.227 0.824 0.290 0.245 0.051 0.269 0.106 0.220 0.136 0.490 0.391 0.078 0.217 0.251 0.308 0.465
T2 0.495 0.202 0.797 0.303 0.308 0.267 0.338 0.310 0.208 0.169 0.465 0.419 0.123 0.348 0.251 0.304 0.375
T3 0.489 0.180 0.832 0.318 0.198 0.181 0.326 0.267 0.205 0.211 0.408 0.314 0.086 0.274 0.261 0.313 0.469
T4 0.543 0.360 0.852 0.276 0.330 0.267 0.276 0.072 0.265 0.338 0.206 0.541 0.072 0.265 0.338 0.488 0.512
MS1 0.460 0.317 0.335 0.839 0.425 0.362 0.315 0.328 0.372 0.388 0.260 0.352 0.343 0.401 0.258 0.343 0.401
MS2 0.517 0.419 0.334 0.902 0.569 0.306 0.237 0.189 0.368 0.365 0.343 0.296 0.313 0.378 0.438 0.313 0.378
MS3 0.494 0.379 0.303 0.882 0.512 0.295 0.396 0.244 0.413 0.411 0.373 0.201 0.251 0.369 0.391 0.078 0.217
MS4 0.285 0.394 0.273 0.827 0.133 0.152 0.315 0.328 0.343 0.296 0.553 0.486 0.510 0.388 0.260 0.352 0.343
TS1 0.436 0.435 0.298 0.527 0.925 0.306 0.237 0.189 0.373 0.201 0.511 0.423 0.468 0.388 0.260 0.352 0.343
TS2 0.454 0.487 0.284 0.564 0.917 0.295 0.396 0.244 0.251 0.430 0.270 0.253 0.294 0.365 0.343 0.296 0.313
TS3 0.524 0.416 0.269 0.224 0.902 0.559 0.553 0.486 0.510 0.465 0.419 0.123 0.348 0.411 0.373 0.201 0.251
TS4 0.473 0.225 0.259 0.187 0.852 0.503 0.511 0.423 0.468 0.408 0.314 0.086 0.274 0.296 0.553 0.486 0.510
DD1 0.238 0.133 0.152 0.240 0.201 0.823 0.270 0.253 0.294 0.206 0.541 0.072 0.265 0.338 0.401 0.247 0.411
DD2 0.128 0.250 0.109 0.144 0.214 0.793 0.285 0.355 0.180 0.225 0.392 0.503 0.409 0.307 0.378 0.237 0.300
DD3 0.285 0.394 0.273 0.357 0.412 0.818 0.312 0.327 0.204 0.294 0.538 0.489 0.367 0.457 0.217 0.251 0.308
OL1 0.541 0.235 0.379 0.489 0.338 0.293 0.880 0.313 0.452 0.423 0.369 0.399 0.320 0.631 0.348 0.251 0.304
OL2 0.398 0.407 0.303 0.421 0.329 0.337 0.891 0.300 0.297 0.253 0.294 0.206 0.541 0.072 0.274 0.261 0.313
OL3 0.306 0.237 0.353 0.475 0.438 0.314 0.821 0.443 0.324 0.309 0.340 0.368 0.365 0.274 0.261 0.338 0.488
OL4 0.106 0.220 0.136 0.490 0.391 0.452 0.785 0.442 0.394 0.237 0.197 0.413 0.411 0.265 0.338 0.258 0.343
DS1 0.153 0.228 0.247 0.208 0.100 0.239 0.284 0.712 0.409 0.392 0.503 0.343 0.296 0.401 0.258 0.438 0.313
DS2 0.321 0.337 0.202 0.255 0.207 0.332 0.282 0.844 0.355 0.538 0.489 0.373 0.201 0.386 0.369 0.391 0.078
DS3 0.317 0.334 0.268 0.223 0.226 0.346 0.268 0.834 0.410 0.369 0.399 0.320 0.631 0.435 0.388 0.260 0.352
DS4 0.407 0.303 0.421 0.353 0.475 0.438 0.458 0.873 0.524 0.260 0.352 0.374 0.308 0.401 0.133 0.152 0.240
DC1 0.349 0.235 0.196 0.355 0.266 0.185 0.361 0.438 0.907 0.343 0.296 0.435 0.304 0.378 0.250 0.109 0.144
DC2 0.382 0.290 0.443 0.324 0.309 0.340 0.465 0.496 0.937 0.051 0.269 0.299 0.262 0.369 0.394 0.273 0.357
DC3 0.251 0.316 0.442 0.394 0.388 0.260 0.352 0.343 0.789 0.345 0.401 0.247 0.411 0.467 0.235 0.379 0.489
DC4 0.247 0.208 0.493 0.404 0.365 0.343 0.296 0.313 0.847 0.399 0.378 0.237 0.300 0.422 0.407 0.303 0.421
DL1 0.222 0.299 0.210 0.429 0.411 0.373 0.201 0.251 0.452 0.864 0.217 0.251 0.308 0.404 0.237 0.353 0.475
DL2 0.344 0.363 0.209 0.373 0.296 0.553 0.486 0.510 0.464 0.921 0.348 0.251 0.304 0.410 0.220 0.136 0.490
DL3 0.325 0.344 0.161 0.402 0.430 0.343 0.315 0.487 0.451 0.934 0.274 0.261 0.313 0.350 0.228 0.247 0.208
DL4 0.294 0.206 0.541 0.072 0.265 0.338 0.401 0.202 0.255 0.823 0.265 0.338 0.488 0.362 0.315 0.396 0.176
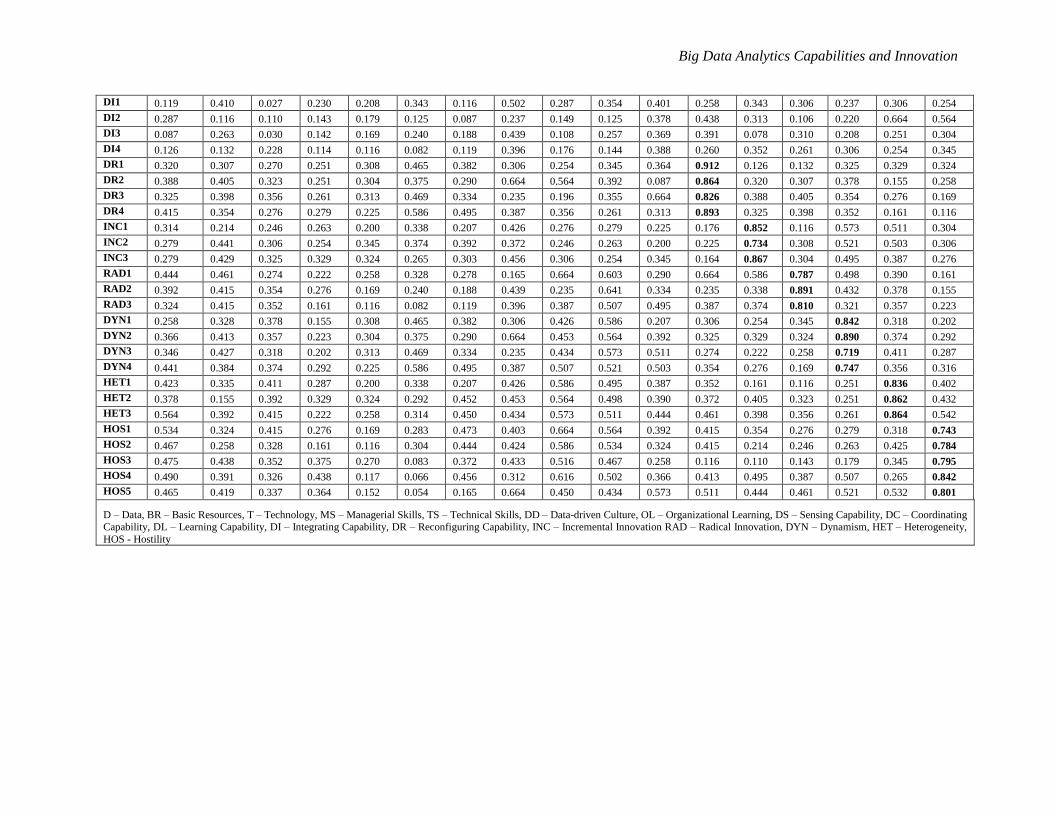
Big Data Analytics Capabilities and Innovation
DI1 0.119 0.410 0.027 0.230 0.208 0.343 0.116 0.502 0.287 0.354 0.401 0.258 0.343 0.306 0.237 0.306 0.254
DI2 0.287 0.116 0.110 0.143 0.179 0.125 0.087 0.237 0.149 0.125 0.378 0.438 0.313 0.106 0.220 0.664 0.564
DI3 0.087 0.263 0.030 0.142 0.169 0.240 0.188 0.439 0.108 0.257 0.369 0.391 0.078 0.310 0.208 0.251 0.304
DI4 0.126 0.132 0.228 0.114 0.116 0.082 0.119 0.396 0.176 0.144 0.388 0.260 0.352 0.261 0.306 0.254 0.345
DR1 0.320 0.307 0.270 0.251 0.308 0.465 0.382 0.306 0.254 0.345 0.364 0.912 0.126 0.132 0.325 0.329 0.324
DR2 0.388 0.405 0.323 0.251 0.304 0.375 0.290 0.664 0.564 0.392 0.087 0.864 0.320 0.307 0.378 0.155 0.258
DR3 0.325 0.398 0.356 0.261 0.313 0.469 0.334 0.235 0.196 0.355 0.664 0.826 0.388 0.405 0.354 0.276 0.169
DR4 0.415 0.354 0.276 0.279 0.225 0.586 0.495 0.387 0.356 0.261 0.313 0.893 0.325 0.398 0.352 0.161 0.116
INC1 0.314 0.214 0.246 0.263 0.200 0.338 0.207 0.426 0.276 0.279 0.225 0.176 0.852 0.116 0.573 0.511 0.304
INC2 0.279 0.441 0.306 0.254 0.345 0.374 0.392 0.372 0.246 0.263 0.200 0.225 0.734 0.308 0.521 0.503 0.306
INC3 0.279 0.429 0.325 0.329 0.324 0.265 0.303 0.456 0.306 0.254 0.345 0.164 0.867 0.304 0.495 0.387 0.276
RAD1 0.444 0.461 0.274 0.222 0.258 0.328 0.278 0.165 0.664 0.603 0.290 0.664 0.586 0.787 0.498 0.390 0.161
RAD2 0.392 0.415 0.354 0.276 0.169 0.240 0.188 0.439 0.235 0.641 0.334 0.235 0.338 0.891 0.432 0.378 0.155
RAD3 0.324 0.415 0.352 0.161 0.116 0.082 0.119 0.396 0.387 0.507 0.495 0.387 0.374 0.810 0.321 0.357 0.223
DYN1 0.258 0.328 0.378 0.155 0.308 0.465 0.382 0.306 0.426 0.586 0.207 0.306 0.254 0.345 0.842 0.318 0.202
DYN2 0.366 0.413 0.357 0.223 0.304 0.375 0.290 0.664 0.453 0.564 0.392 0.325 0.329 0.324 0.890 0.374 0.292
DYN3 0.346 0.427 0.318 0.202 0.313 0.469 0.334 0.235 0.434 0.573 0.511 0.274 0.222 0.258 0.719 0.411 0.287
DYN4 0.441 0.384 0.374 0.292 0.225 0.586 0.495 0.387 0.507 0.521 0.503 0.354 0.276 0.169 0.747 0.356 0.316
HET1 0.423 0.335 0.411 0.287 0.200 0.338 0.207 0.426 0.586 0.495 0.387 0.352 0.161 0.116 0.251 0.836 0.402
HET2 0.378 0.155 0.392 0.329 0.324 0.292 0.452 0.453 0.564 0.498 0.390 0.372 0.405 0.323 0.251 0.862 0.432
HET3 0.564 0.392 0.415 0.222 0.258 0.314 0.450 0.434 0.573 0.511 0.444 0.461 0.398 0.356 0.261 0.864 0.542
HOS1 0.534 0.324 0.415 0.276 0.169 0.283 0.473 0.403 0.664 0.564 0.392 0.415 0.354 0.276 0.279 0.318 0.743
HOS2 0.467 0.258 0.328 0.161 0.116 0.304 0.444 0.424 0.586 0.534 0.324 0.415 0.214 0.246 0.263 0.425 0.784
HOS3 0.475 0.438 0.352 0.375 0.270 0.083 0.372 0.433 0.516 0.467 0.258 0.116 0.110 0.143 0.179 0.345 0.795
HOS4 0.490 0.391 0.326 0.438 0.117 0.066 0.456 0.312 0.616 0.502 0.366 0.413 0.495 0.387 0.507 0.265 0.842
HOS5 0.465 0.419 0.337 0.364 0.152 0.054 0.165 0.664 0.450 0.434 0.573 0.511 0.444 0.461 0.521 0.532 0.801
D – Data, BR – Basic Resources, T – Technology, MS – Managerial Skills, TS – Technical Skills, DD – Data-driven Culture, OL – Organizational Learning, DS – Sensing Capability, DC – Coordinating Capability, DL – Learning Capability, DI – Integrating Capability, DR – Reconfiguring Capability, INC – Incremental Innovation RAD – Radical Innovation, DYN – Dynamism, HET – Heterogeneity,
HOS - Hostility

Big Data Analytics Capabilities and Innovation
Appendix C. Heterotrait-Monotrait Ratio (HMTM)
(4) (5) (6) (7) (8) (9) (10) (11) (12) (13) (14) (15) (16) (17)
(4) Managerial Skills
(5) Technical Skills 0.532
(6) Data-driven Culture 0.345 0.530
(7) Organizational Learning 0.430 0.446 0.326
(8) Sensing 0.292 0.225 0.342 0.382
(9) Coordinating 0.412 0.310 0.305 0.421 0.432
(10) Learning 0.404 0.402 0.351 0.358 0.435 0.503
(11) Integrating 0.255 0.241 0.387 0.420 0.583 0.271 0.341
(12) Reconfiguring 0.396 0.348 0.661 0.470 0.504 0.526 0.428 0.504
(13) Incremental 0.284 0.261 0.261 0.301 0.401 0.391 0.317 0.183 0.197
(14) Radical 0.438 0.310 0.278 0.351 0.317 0.323 0.301 0.317 0.301 0.225
(15) Dynamism 0.232 0.387 0.420 0.378 0.343 0.204 0.416 0.421 0.416 0.310 0.360
(16) Heterogeneity 0.270 0.661 0.470 0.333 0.376 0.296 0.286 0.225 0.333 0.523 0.481 0.355
(17) Hostility 0.351 0.358 0.482 0.267 0.312 0.257 0.424 0.350 0.377 0.345 0.530 0.358 0.384