Embed Size (px)
Citation preview
august201320 © 2013 The Royal Statistical Society
B i g d a t a a n d b i g b u s i n e s s : S h o u l d s t a t i s t i c i a n s j o i n i n ?
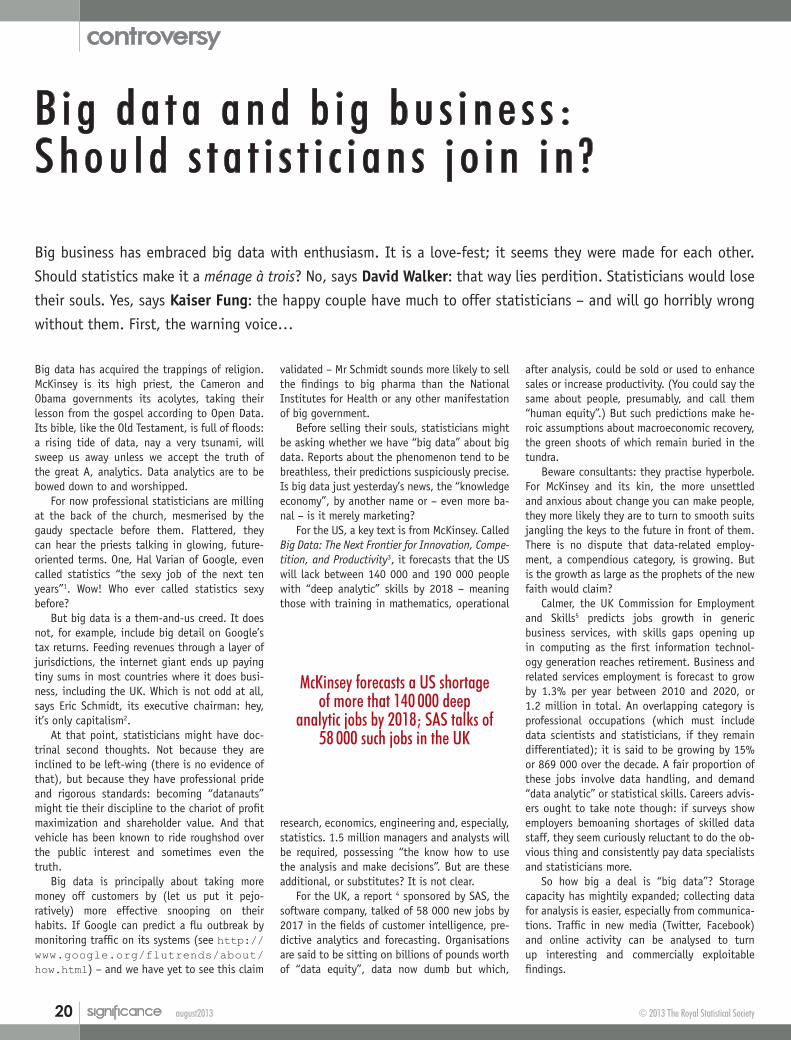
Big data has acquired the trappings of religion. McKinsey is its high priest, the Cameron and Obama governments its acolytes, taking their lesson from the gospel according to Open Data. Its bible, like the Old Testament, is full of floods: a rising tide of data, nay a very tsunami, will sweep us away unless we accept the truth of the great A, analytics. Data analytics are to be bowed down to and worshipped.
For now professional statisticians are milling at the back of the church, mesmerised by the gaudy spectacle before them. Flattered, they can hear the priests talking in glowing, future-oriented terms. One, Hal Varian of Google, even called statistics “the sexy job of the next ten years”1. Wow! Who ever called statistics sexy before?
But big data is a them-and-us creed. It does not, for example, include big detail on Google’s tax returns. Feeding revenues through a layer of jurisdictions, the internet giant ends up paying tiny sums in most countries where it does busi-ness, including the UK. Which is not odd at all, says Eric Schmidt, its executive chairman: hey, it’s only capitalism2.
At that point, statisticians might have doc-trinal second thoughts. Not because they are inclined to be left-wing (there is no evidence of that), but because they have professional pride and rigorous standards: becoming “datanauts” might tie their discipline to the chariot of profit maximization and shareholder value. And that vehicle has been known to ride roughshod over the public interest and sometimes even the truth.
Big data is principally about taking more money off customers by (let us put it pejo-ratively) more effective snooping on their habits. If Google can predict a flu outbreak by monitoring traffic on its systems (see http://www.google.org/flutrends/about/how.html) – and we have yet to see this claim
validated – Mr Schmidt sounds more likely to sell the findings to big pharma than the National Institutes for Health or any other manifestation of big government.
Before selling their souls, statisticians might be asking whether we have “big data” about big data. Reports about the phenomenon tend to be breathless, their predictions suspiciously precise. Is big data just yesterday’s news, the “knowledge economy”, by another name or – even more ba-nal – is it merely marketing?
For the US, a key text is from McKinsey. Called Big Data: The Next Frontier for Innovation, Compe-tition, and Productivity3, it forecasts that the US will lack between 140 000 and 190 000 people with “deep analytic” skills by 2018 – meaning those with training in mathematics, operational
research, economics, engineering and, especially, statistics. 1.5 million managers and analysts will be required, possessing “the know how to use the analysis and make decisions”. But are these additional, or substitutes? It is not clear.
For the UK, a report 4 sponsored by SAS, the software company, talked of 58 000 new jobs by 2017 in the fields of customer intelligence, pre-dictive analytics and forecasting. Organisations are said to be sitting on billions of pounds worth of “data equity”, data now dumb but which,
after analysis, could be sold or used to enhance sales or increase productivity. (You could say the same about people, presumably, and call them “human equity”.) But such predictions make he-roic assumptions about macroeconomic recovery, the green shoots of which remain buried in the tundra.
Beware consultants: they practise hyperbole. For McKinsey and its kin, the more unsettled and anxious about change you can make people, they more likely they are to turn to smooth suits jangling the keys to the future in front of them. There is no dispute that data-related employ-ment, a compendious category, is growing. But is the growth as large as the prophets of the new faith would claim?
Calmer, the UK Commission for Employment and Skills5 predicts jobs growth in generic business services, with skills gaps opening up in computing as the first information technol-ogy generation reaches retirement. Business and related services employment is forecast to grow by 1.3% per year between 2010 and 2020, or 1.2 million in total. An overlapping category is professional occupations (which must include data scientists and statisticians, if they remain differentiated); it is said to be growing by 15% or 869 000 over the decade. A fair proportion of these jobs involve data handling, and demand “data analytic” or statistical skills. Careers advis-ers ought to take note though: if surveys show employers bemoaning shortages of skilled data staff, they seem curiously reluctant to do the ob-vious thing and consistently pay data specialists and statisticians more.
So how big a deal is “big data”? Storage capacity has mightily expanded; collecting data for analysis is easier, especially from communica-tions. Traffic in new media (Twitter, Facebook) and online activity can be analysed to turn up interesting and commercially exploitable findings.
Big business has embraced big data with enthusiasm. It is a love-fest; it seems they were made for each other.
Should statistics make it a ménage à trois? No, says David Walker: that way lies perdition. Statisticians would lose
their souls. Yes, says Kaiser Fung: the happy couple have much to offer statisticians – and will go horribly wrong
without them. First, the warning voice…
controversy
McKinsey forecasts a US shortage of more that 140 000 deep
analytic jobs by 2018; SAS talks of 58 000 such jobs in the UK

august2013 21
But on closer inspection big data looks aw-fully like the big sell. Its prophets talk profit because exploiting data for the sake of enhanced sales is a principal driver behind analytics as practised by Google, Amazon and such compa-nies. Locational data (from mobile communica-tions devices) potentially brings customers through “geo-targeted advertising”.
The supermarket Tesco wants to discern pat-terns and preferences among its customers so it can sell them more; its loyalty card (an ample source of consumption data) becomes a way of minimising competition by inducing Tesco shoppers not to go to Sainsbury or Morrison’s. Harrah’s Entertainment Corp (frequently cited in the big data texts) wants to know more about its gamblers because it would make more money moving them from slot machines to gaming tables. Netflix, the DVD-rental company, seeks correlations in people’s viewing habits so it can automate its recommendations to customers.
In big data, the public are passive. The traffic is one-way: customers give but the enhanced choices they receive in return are confined to Amazon’s website. Tax and other corporate data from the companies energetically proselytis-ing for big data are not readily available to be mashed, scraped or analysed.
Some utopians reject that asymmetry. Charlie Leadbeater6 conjures a “mass of loosely
connected, small scale conversations, campaigns, and interest groups [coalescing] to create a mass movement”. Quite why the great proletarian un-derclass should mount the barricade armed with iPads loaded with local authority performance data when they could not be roused before is unclear.
That is one of the problems in getting to grips with the big data mania: the social and economic channels into which higher volumes of data are flowing are well known. Collecting data to flag variability has been done before. Scale and technology are new, but organisational and privacy questions are not.
Take housing. Banks and building societies have long collected area income and debt data to “red-line” streets for mortgage lending. Max Wind-Cowie and Rohit Lekhi7 are excited by land-lords wielding handheld devices, generating data about the condition of housing and tenants, cut-ting the unit cost of transactions. Over a century ago the social reformer Octavia Hill collected and analysed tenant data in painstaking detail, also using a handheld device: pencil and paper. Both visions of data collection were unencumbered (as a housing association or council ought now to be encumbered) by any concern with tenants’ rights to privacy.
Big data gets conflated with “open data” and the talk turns to transparency, an opaque
concept. The Cameron government sees big and open data coming together as a source of ex-ports and income. And service improvement. Tim Kelsey, data tsar for the National Health Service National Commissioning Board, wants more ex-posure of surgeons’ mortality rates performance – but who is going to propagate the necessary metadata, about acuity in caseloads, providing clinical context?
David Hand8 reminds us that data is not in-formation – that is the “useful content” of data. Information is contextual. The quest for disci-plined information – or “knowledge” – exposes the limits of the promiscuous inductivism behind big data thinking. Let the algorithm run and in-formation will come, seems to be the watchword. Data, says Hand, is the “simplifying representa-tion of the things in which we are interested”; but to be interested is, at a simple level, to seek validation of a theory.
McKinsey defines big data as data sets “be-yond the ability of typical tools to capture, man-age and analyse”. If those typical tools include statistics, then the profession’s dream of wealth and power in the era of big data is dashed. But no, a data set requiring petabytes of storage is a data set still; indeed, the larger it gets, the greater the reliance on sampling, that everyday spanner in the statistician’s toolkit. Statisti-cians are the people who surely know how to
Illustration: Andrew Tapsell (www.andrewtapsell.com)

august201322
make what Hand calls the “oldest data analytic technology” work. The necessity of statistical imagination, as well as practical application of technique, makes the case.
So data analysis is intrinsically a statistical activity. It depends on a tried and trusted ap-paratus to decipher trends and patterns, make comparisons, and address large blocks of num-bers. Does that mean statisticians are necessarily “data scientists”, with a prior and regal claim on the territory?
Not necessarily. According to D. J. Patil, chief scientist at the social media outlet for wired professionals, LinkedIn, the best data scientists will be “hard”, meaning that they are physicists9. Their ticket to the future comes from marrying a strong mathematical background, computing skills, and survival in a discipline that depends on getting the most from the data. “They have to think about the big picture, the big problem.”
Statisticians will dispute that. If they do, hovering above the Royal Statistical Society and the American Statistical Association is the ques-tion of whether they can and ought to become professional bodies for the emergent data ana-lytical workforce, with members in specialities such as marketing, which have hitherto been unknown territory. Might the learned societies in statistics have to get down and dirty and elbow the operational researchers and mathematicians out of the way as they rebrand themselves pro-fessional bodies for datanauts, brandishing their datascopes?
Consequent questions for the statistical societies include: does preparation to do data analysis demand a full statistical education or
some cut-down version? Data analysis falls into the borderlands between computer science, information technology, social sciences and the expertise of actuaries – where do the statistics fit?
Answering that will challenge the profession, especially its modes of training and qualifica-tion. But there is another shift ahead: won’t getting into big data require statisticians to become more market friendly and private sector in orientation? According to the Economist In-telligence Unit10, data professionals are required to “understand a company’s priorities and com-petitive environment, so that they can exploit data to answer the right questions”. Is that a big ask? Couldn’t statisticians work and thrive in Google and Google-aspiring companies, along-side engineers, lawyers and other accredited professionals, who do not seem to get ethical indigestion?
Ahead, in the data economy, it is statistics plus. And the plus is profit. LinkedIn’s Patil says the right answer to the question “what kind of person are you looking for when you hire a data scientist?” has to be “someone you would start a company with”. The implication for statisticians wanting to surf this wave is that they would have to get closer to markets, companies, prod-uct development. And who has to worry about disciplinary truth when the bears start selling your company’s shares?
References1. Lohr, S. (2009) For today’s graduate, just
one word: Statistics. New York Times, August 5th.
http://www.nytimes.com/2009/08/06/technology/06stats.html?_r=2&
2. Daily Telegraph (2012) Google’s tax avoidance is called “capitalism”, says chairman Eric Schmidt. Daily Telegraph, December 12th. h t t p : / / w w w . t e l e g r a p h . c o . u k /technology/google/9739039/Googles-tax-avoidance-is-called-capitalism-says-chairman-Eric-Schmidt.html
3. Manyika, J., Chui, M., Brown, B., Bughin, J., Dobbs, R., Roxburgh, C. and Byers, A. H. (2011) Big Data: The Next Frontier for Innovation, Competition, and Productivity. McKinsey Global Institute.
4. Centre for Economics and Business Research (2012) Data Equity: Unlocking the Value of Big Data. A report for SAS. London: Centre for Economics and Business Research.
5. Wilson, R. A. and Homenidou, K. (2012) Working Futures 2010-2020. Evidence Report 41. London: UK Commission for Employment and Skills.
6. Leadbeater, C. (2011) The Civic Long Tail. London: Demos.
7. Wind-Cowie, M. and Lekhi, R. (2012) The Data Dividend. London: Demos.
8. Hand, D. (2007) Information Generation: How Data Rule Our World. Oxford: Oneworld.
9. Loukides, M. (2010) What is data science? O’Reilly Radar, June 2nd. http://radar.oreilly.com/2010/06/what-is-data-science.html
10. Economist Intelligence Unit (2012) Big Data: Lessons from the Leaders. London: Economist Intelligence Unit.
David Walker is former director of RSS Getstats. He is a member of the council at the Economic and Social Research Council, where he chairs the Methods and Infrastructure Committee. This article expresses his personal views.
T h e p e n d i n g m a r r i a g e o f b i g d a t a a n d s t a t i s t i c s Kaiser Fung argues that business, big data and statistics should consummate their long-overdue alliance.
I am a business statistician. I have been one for most of my career. For the last few years, the ground under me has been shifting. Describing my job as statistics used to trigger the blank, befuddled stare, the spooky minute of silence, or worse, the how-did-you-end-up-there frown. These emotions are reaching their sell-by dates, replaced by mild awe. Imagine the blush of amusement that affects residents of tropical regions who, on the coldest day of the winter,
rush to higher grounds in search of frosted twigs; they perceive a minor miracle even if they can-not utterly comprehend it. No less than the New York Times carried Varian’s view that my chosen profession is the “sexy” job of the decade1.
Hal Varian, Chief Economist of Google, is also the former dean of Berkeley’s unique School of Information and an expert in mathematical economics. Google did more than any other company to make statistics cool. Two Stanford
scientists developed a way to measure the usefulness of web pages, vastly improving our ability to discover information within the com-plex, hyperlinked web infrastructure. This work represents the best of applied science; within it, Markov chain theory is the basis of the famous PageRank algorithm that underlies Google’s search engines. On top of this statistical innova-tion the founders built an entire company, and cognate industry, eventually finding a means to

august2013 23
make money through advertising. Today, Google is a behemoth, generating $54 billion in annual revenues, the vast majority still related to its core search technology.
Google’s example inspires entrepreneurs to embrace data-driven decision-making. The e-commerce giant Amazon recommends products to customers based on their browsing and pur-chasing habits. The “ad-tech” companies such as RocketFuel apply statistical and optimisation techniques to determine which banner ads to display. Netflix, the DVD and streaming media provider, deploys a variety of techniques, includ-ing Boltzmann machines, and singular value decomposition, to determine which movies to place in the queue of recommendations2. Gmail, Google’s email service, scans the contents of emails to enhance the relevance of ads shown to users. And the online dating website, Match.com, uses applied mathematics to propose ro-mantic couplings. Countless happy relationships, we trust, have resulted. Who can claim that statistical algorithms do not transform lives?
David Walker, in the companion article, is deeply disturbed by these recent trends, impre-cisely labelled “big data” by the business com-munity. Walker pits statistics against business. Google is the devil incarnate. Big data is “like the big sell,” he alleges, asking, perhaps rhetorically, whether it is “merely marketing”. My own open-ing phrase “I am a business statistician” takes on a sinister meaning. It signifies the final sur-render to “profit maximisation and shareholder value”; it leads to the loss of “professional pride” and forfeiture of “disciplinary truth”.
Unfortunately, Walker’s displeasure with the corporate tax avoidance schemes of Google takes his argument off track almost from the start, as tax policy is not a part of big data but instead is the domain of accountants and lawyers. Besides, one need not buy Google’s “don’t be evil” creed to recognise the remarkable social benefits de-rived from PageRank. Every month, more than a billion people are conducting 13.7 billion Google searches.
Industry and statistics have enjoyed a sym-biosis for a long time. Walker needs no reminder that much of what we know about randomised, controlled experiments and analysis of variance grew out of Ronald Fisher’s investigations at Rothamsted Research Centre of the effect of fer-tilisers on crop yield in the 1920s3. Rothamsted was founded by the entrepreneur John Bennet Lawes for the benefit of his artificial fertilisers business. Another famous statistician, William Gosset, discovered the Student’s t-distribution while optimising yeast composition for the Guinness Brewing Company3. I have argued that credit scoring pioneered by the Fair, Isaac Company in the 1960s should count as one of the earliest cases of successful businesses built
on statistical algorithms, pre-dating Google by decades4.
Contrary to Walker’s polemic, business pro-vides a stimulating environment in which to practise statistics. The business statistician is the rare job that demands creative problem-solving skills. Many other quantitative jobs, such as accounting, forecasting or financial model-ling, entail doing the same tasks each month and each quarter. The statistician gets broad exposure to many aspects of a business, as broad as is needed to understand the data. The job requires a range of skills, including mathematics, coding, judging uncertainty, consulting, and, notably, presentation and listening. Since no one is a master of all of the above, statisticians must work well in teams. By self-selection, fellow team members are smart people. The corporate culture allows for a better work–life balance than that of, say, consultancies and investment banks. Last, but not least, business statistics
is a growth industry, a non-trivial advantage in today’s dour economy. I can think of no other jobs that offer so many benefits.
Business and statistics are not incompat-ible. And yet, there is some truth to Walker’s observation that “professional statisticians are milling at the back of the church, mesmerised by the gaudy spectacle [of big data] before them”. The real tension is between statistics and computer science. Up to now, the big data era has been steered by computer scientists, or data engineers, to be specific. I believe statisti-cians should stand up. This is an unprecedented moment to cross-pollinate two related fields. Below are six areas in which we can make key contributions.
Estimation versus counting
Estimation from samples comes naturally to a statistician. I have rarely met a data engineer who is not uneasy about sampling. The notion that one would knowingly “throw away data” is heresy. The fear is that the number discarded today will turn out to be the one piece of data
you would need in the future. But is it rational to carry an umbrella around at all times to plan for the rainy day – while living in a desert?
Imagine you keep a database of plays of songs. The distribution of plays is long-tailed: the top 50 titles account for 25% of all plays while the bottom 10 million titles account for 35% of all plays. Those 10 million songs are played three times a week, on average. A typi-cal database of plays has an entry for each play, and its associated details, such as the type of player, the IP address, the time zone, the user’s identifier, the operating system and so on. The 10 million titles produce 30 million weekly rows of data, or 1.5 billion rows per annum. This implies 85 million new rows enter the database every week. These rows record only the start of a play. The volume doubles if the end of a play is also captured. If the system keeps track of each pause, each fast-forward, each backtrack, each volume change, and so on, the database will conceivably receive billions of rows per week.
To a computer scientist, the problem of glut is tackled by speedier loading and storage of ever larger data sets. That is the prevailing view in the big data community; it is also the view of the McKinsey consultants cited by Walker. By contrast, the statistician relies on sampling. Why not generate and store aggregate statistics, and of those bottom 10 million titles, why not retain only a 10% random sample of the details?
Suppose, on the unlikely occasion, we require the number of times users in the Bahamas played an obscure song, “The Elephant and the Lizard”, during May. The statistician, having thrown away the exact data, estimates the number to be between zero and three, with a high likelihood of zero. How much does this lack of precision hurt? Would the exact count yield more useful information?
Sampling is not simple to implement, es-pecially for massive, complex data sets, but it ought to be part of the big data toolkit. The expertise of statisticians is sorely missed.
Slow and steady versus fast and dirty
The top concerns of the data engineer are speed and capacity. The contents of the data are little noticed. Indeed, inspecting the contents slows down the processing and, worse, can introduce unforced errors. For example, in order to ensure that each value in a column of country codes is valid, one must check that the value matches one of about 250 two-letter variations, and then, in case of mismatch, replace the unrecognised value with an indicator of anomaly. The cost of inspection expands with growing dimensions of the data. Inspection is further complicated by the new penchant for distributed storage. Big
Big Data is not the issue. The real tension is between statistics and
computer science
august201324
data’s focus on speed and capacity pushes qual-ity to the back seat.
While statistics textbooks also tend to rep-resent data as an integral entity (the matrix X), applied statisticians are quickly cured of this dis-ease, as they are exposed to errors and holes in real-world data sets. Such dirty data is the cul-prit behind many statistical lies. A sharp shift in geographical distribution of website visits alarms management, but the shift is entirely artificial, caused by the statistical software ignoring data that contain invalid country codes. An analyst prepares a list of all “male” customers, only to realise later that she has inadvertently omitted “Male”, “M” and “MALE” customers, which all exist because the gender data set is compiled from multiple sources. Having been burned by such situations, statisticians religiously clean and transform data prior to use.
There is a trade-off between data quality and processing efficiency. A proper balance be-tween these two objectives is possible only if there is a dialogue between data engineers and statisticians.
Causation versus attribution
A big chunk of big data comes from cookies (or similar objects such as beacons and pixels). Cookies are tiny text files used by web brows-ers to identify you. In reality, they identify your browser, not you, although it is routine to con-found the two. Cookies are the crumbs you leave on your web trail.
Suppose you just purchased an air ticket from London to New York City from Expedia, a travel website. Through cookies, the marketing team at Expedia knew all about the numerous visits you made before deciding on the purchase. Thirty days ago, you clicked on a banner ad, landing at Expedia to check the fare. One week before, you clicked a link inside a travel-themed newsletter before you reviewed the flight schedules. On the day of purchase, you arrived at the website by typing “Expedia” in the Google search engine, and then clicking on the “sponsored link” at the top of the page of results. After reviewing your brows-ing history, the analyst at Expedia assigned your purchase to the “paid search” channel. (Expedia pays Google a “finder’s fee” for every click on the sponsored link.) This is known in industry as an attribution: the “paid search” channel claimed credit for generating that commercial transaction.
The vaunted accountability of the digital marketing channel rests on such attributions. When marketing managers notice that sales attributed to newsletters have weakened, they revise the copy, hoping to reverse the trend.
The catch is that attributions are not causal. Worse, they are subjective decisions, a function
of the time order of measured events. In the example above, the banner ad or the newsletter arguably was more influential than web search in causing the purchase. Perhaps the real credit should have gone to television advertising, a result no analysis of web logs can yield.
In fact, a counterfactual perspective is help-ful. Causal thinking is another area in which statisticians have plenty to offer to the big data community.
More effective experiments
In 2012, Wired magazine eulogised the “A/B test”, declaring it to be “the technology that’s changing the rules of business”5. The A/B test is known to every introduction to statistics student as the t-test of two means. Yes, the t-test is traced back to Gosset who developed it for the Guinness brewery in the 1900s. In the contemporary setting, a website delivers at random one of two pages to visitors, and measures if one page performs better than the other page, typically in terms of clickthroughs. Brian Christian, the author of the Wired article, asked: “Could the scientific rigor of Google’s A/B ethos start making waves outside the web? Is it possible to A/B the offline world?” Any statistician will answer that many industries long ago implemented randomised, controlled experiments, and did so before the web existed, and at a higher level of sophistication than at most web companies. For example, direct mar-keters routinely run statistical tests to optimise their marketing vehicles such as catalogues and direct mail.
One of Christian’s talking points holds: the web is indeed a nice laboratory in which tests
can be executed at scale, and relatively pain-lessly (though see the section on randomisation below). And yet, in the A/B testing universe, few people are aware of the huge literature on statistical testing, or of Fisher’s monumental contributions. This field is ripe for collaboration between computer scientists and statisticians. A quick flip through the Wired article reveals numerous fallacies about t-tests: fallacies of certainty, of automation, and of false positives among them.
The fallacy of certainty. Again and again, Christian stresses the certainty of test results, using words such as “incontrovertible”. Data from tests end all subjective arguments, we are told. How is it possible to have such definitive results when, as these web businesses claim, they run thousands of tests per year? One expects that most tweaks, such as changing the width of a border on a web page, have inconclusive results. It turns out that most practitioners of A/B tests use point estimates. If the test fails to achieve significance, the variation with the best per-formance is declared the “directional” winner. Sometimes, a test is run for such a length of time that tiny effects display significance by virtue of sample size.
The fallacy of automation. In Christian’s world, the summit of A/B testing is “automat-ing the whole process of adjudicating the test, so that the software, when it finds statistical significance, simply diverts all traffic to the better-performing option – no human oversight necessary”. Twinned with this is the fallacy of real time. One of the deepest insights in statis-tics is the law of large numbers, which requires a sufficient sample size in order to detect a signal to a given precision. Real-time deci-sions imply undersized samples, and huge error
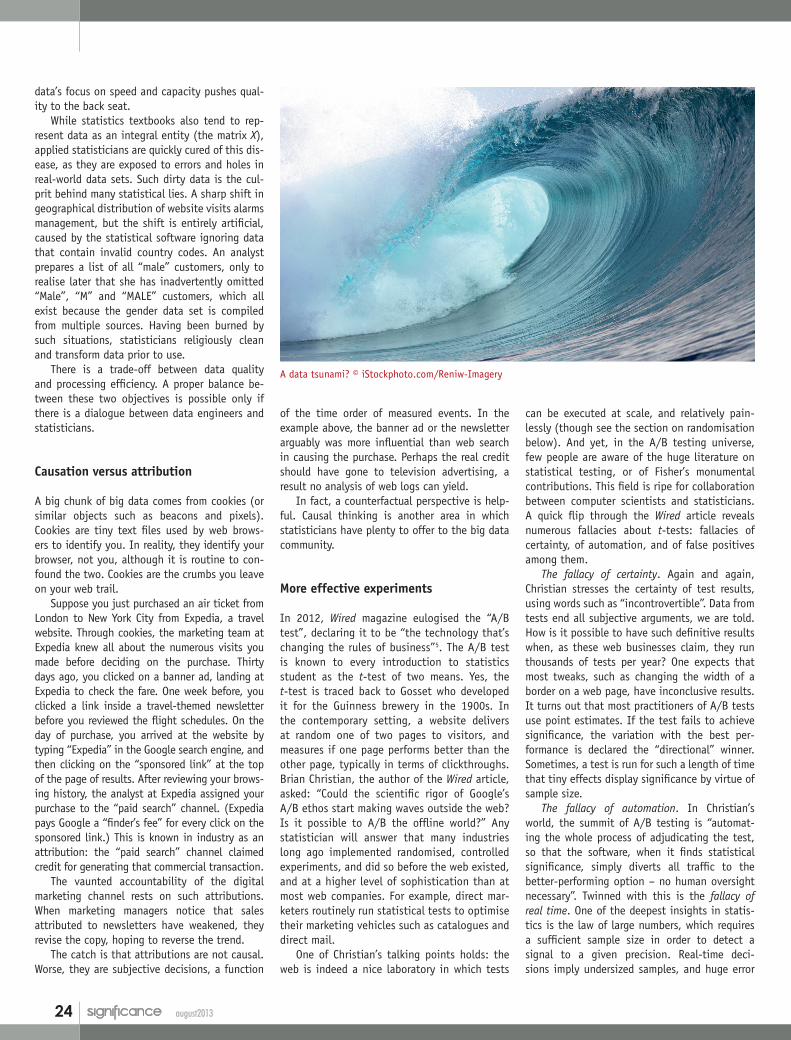
A data tsunami? © iStockphoto.com/Reniw-Imagery
august2013 25
bars. Furthermore, such decisions are biased, as Microsoft scientists explained in an important paper on the “novelty effect” and the “primacy effect”, among other things6. False positive re-sults abound in small samples, turning statistical testing into witchcraft.
The plague of multiple comparisons. In the new world of “choose everything”, that is to say, “see what sticks”, Wired reports that “the percentage of users getting some kind of tweak may well approach 100 percent”5. Statisticians worry about false positive findings when so many tests are run at the same time. Given the complexity of correcting for multiple com-parisons, it is not surprising that the software tools available to conduct A/B tests completely ignore this issue.
We should be excited that randomised, con-trolled tests have been embraced by the web community. Regrettably, only a few practition-ers, such as Ron Kohavi’s team at Microsoft, and Randall Lewis and Justin Rao7 (in their work at Yahoo!), have reflected on the practical chal-lenges of this enterprise. Statisticians are well equipped to make important contributions to how experiments are designed, executed and analysed.
Randomisation
The majority of tests are poorly executed and are poorly understood. The practical challenges, especially concerning randomizing test cells, are formidable.
Website users can be generically partitioned into two groups: logged-in users, and logged-out users. The latter group includes unregistered users essentially anonymous to the website. Logged-in users are assigned an ID number by the website, while logged-out users are identified by the cookie. In an ideal test, the unit of randomi-sation is an individual. How does one keep track of the individual through a series of log-ins and log-outs? How does one overcome the fact that cookies identify browsers, not individuals? How does one deal with the proliferation of devices used to surf the web, deploying a range of track-ing technologies? Does one reassign logged-out users who become registered after they have been assigned to a test cell? Does one assign one or multiple test cells to those users who sign up for multiple accounts, sometimes using the same browser?
The flexibility of web architecture does the test designer no favours. A flawed randomisa-tion takes the glitter off the gold standard of statistical testing. Guidance from statisticians surely enriches the enterprise, and research into nearly random or robust test designs can push the frontier.
Effect sizes
In the 2000s, a curious phenomenon happened at the stock exchanges in the US. Banks began paying millions of dollars to put their servers physically close to those run by the exchanges8. It later emerged that the traders employed by these banks had found an edge: a new breed of algorithmic traders, known as high-frequency traders, were profiting handsomely from placing outsized bets on extremely small, short-lived price movements. The name of the game was getting to the head of the queue, accomplished by collocation of servers and faster networks. One moral of this story is that physical advan-tages have bested the intellectual advantage of smarter algorithms.
I encountered the same type of phenomenon while working at an ad-tech company. The sales force bought an inventory of (banner) ad place-ments on websites. Then, data scientists devel-
oped algorithms to maximise the value of that inventory by placing the right ads that would elicit the most clicks. The click rate of banner ads is notoriously tiny. If the rate is one out of 1 million, an algorithm that doubles the rate will generate only one additional sale per million ad impressions. The incremental benefit of an algo-rithm tweak is dwarfed by any cost saving negoti-ated by the sales team purchasing the inventory.
The Netflix Prize is another reminder that big data frequently produce small effects. It was for a better algorithm to predict the ratings – one star to five stars – that users would give to movies. The training data set was of 100 million ratings, given by half a million users, to 18 000 movies, so it was clearly big. The 10% progress that won the million-dollar prize is roughly worth one-tenth of one star on the five-star rating scale. It was not a surprise when the company’s engineers later admitted that the “The additional accuracy gains … did not seem to justify the engineering effort to bring [the ensemble of 107 methods] into a production environment”2.
Lost in the hype over big data is an honest evaluation of the benefits of having processed all the data. When placed in their proper context, claims of extraordinary value appear exaggerated.
While statisticians are not completely innocent of such practices, we do have a range of tools for measuring and interpreting effect sizes.
Statistics and business are not conflicting enterprises. Statisticians are alienated from the big data phenomenon because our approach to data analysis is fundamentally different from that taken by computer scientists. Thus far, the big data community has focused its attention on the capacity of databases, the speed of pro-cessing data, organising unstructured data, and automation. A statistical perspective emphasises the quality of the data, the characteristics of the sample, the validity of generalisation, and the balance of humans and machines.
As big data and statistics engage with one another, it is critical to remember that the two fields are united by one common goal, to draw reliable conclusions from available data.
References1. Lohr, S. (2009) For today’s graduate, just
one word: Statistics. New York Times, August 5th. http://www.nytimes.com/2009/08/06/technology/06stats.html?_r=2&
2. Amatriain, X. and Justin Basilico, J. (2012) Netflix recommendations: Beyond the 5 stars (Part I). Netflix Tech Blog, April 6th. http://techblog.netflix.com/2012/04/netflix-recommendations-beyond-5-stars.html
3. Salsburg, D. (2001) The Lady Tasting Tea: How Statistics Revolutionized Science in the Twentieth Century. New York: W.H. Freeman.
4. Fung, K. (2010) Numbers Rule Your World: The Hidden Influence of Probability and Statistics on Everything You Do. New York: McGraw-Hill.
5. Christian, B. (2012) The A/B test: Inside the technology that’s changing the rules of business. Wired, April. http://www.wired.com/business/2012/04/ff_abtesting/
6. Kohavi, R., Deng, A., Frasca, B., Longbotham, R., Walker, T. and Xu, Y. (2012) Trustworthy online controlled experiments: Five puzzling outcomes explained. Paper presented to KDD 2012, the 18th ACM SIGKDD Conference on Knowledge Discovery and Data Mining, Beijing. http://www.exp-platform.com/Documents/puzzlingOutcomesInControlled Experiments.pdf
7. Lewis, R. and Rao, J. M. (2013) “On the near-impossibility of measuring the returns to advertising,” April 11th.
8. Rogow, G. (2012) Colocation: The root of all high-frequency trading evil. Wall Street Journal MarketBeat blog, September 20th. http://blogs.wsj.com/marketbeat/2012/09/20/collocation-the-root-of-all-high-frequency-trading-evil/
Kaiser Fung is the author of Numbersense: How to Use Big Data to Your Advantage (McGraw-Hill, 2013). He has worked in the web, entertainment, and financial industries.
An honest evaluation of the benefits of processing Big Data
has been lost in the hype