Embed Size (px)
Citation preview
Big Data in Fixed Income
Markets?
Scott Richardson, Ph.D.
November 23, 2018
Private and Confidential
For Institutional Investor Use Only
Disclosures
2
The information set forth herein has been obtained or derived from sources believed by AQR Capital Management, LLC (“AQR”) to be reliable. However, AQR does not make any representation or warranty, express or implied, as to the information’s accuracy or completeness, nor does AQR recommend that the attached information serve as the basis of any investment decision. This document has been provided to you solely for information purposes and does not constitute an offer or solicitation of an offer, or any advice or recommendation, to purchase any securities or other financial instruments, and may not be construed as such. This document is intended exclusively for the use of the person to whom it has been delivered by AQR and it is not to be reproduced or redistributed to any other person. Please refer to the Appendix for more information on risks and fees. For one-on-one presentation use only. Past performance is not a guarantee of future performance.
This presentation is not research and should not be treated as research. This presentation does not represent valuation judgments with respect to any financial instrument, issuer, security or sector that may be described or referenced herein and does not represent a formal or official view of AQR.
The views expressed reflect the current views as of the date hereof and neither the speaker nor AQR undertakes to advise you of any changes in the views expressed herein. It should not be assumed that the speaker will make investment recommendations in the future that are consistent with the views expressed herein, or use any or all of the techniques or methods of analysis described herein in managing client accounts. AQR and its affiliates may have positions (long or short) or engage in securities transactions that are not consistent with the information and views expressed in this presentation.
The information contained herein is only as current as of the date indicated, and may be superseded by subsequent market events or for other reasons. Charts and graphs provided herein are for illustrative purposes only. The information in this presentation has been developed internally and/or obtained from sources believed to be reliable; however, neither AQR nor the speaker guarantees the accuracy, adequacy or completeness of such information. Nothing contained herein constitutes investment, legal, tax or other advice nor is it to be relied on in making an investment or other decision.
There can be no assurance that an investment strategy will be successful. Historic market trends are not reliable indicators of actual future market behavior or future performance of any particular investment which may differ materially, and should not be relied upon as such. Target allocations contained herein are subject to change. There is no assurance that the target allocations will be achieved, and actual allocations may be significantly different than that shown here. This presentation should not be viewed as a current or past recommendation or a solicitation of an offer to buy or sell any securities or to adopt any investment strategy.
The information in this presentation may contain projections or other forward‐looking statements regarding future events, targets, forecasts or expectations regarding the strategies described herein, and is only current as of the date indicated. There is no assurance that such events or targets will be achieved, and may be significantly different from that shown here. The information in this presentation, including statements concerning financial market trends, is based on current market conditions, which will fluctuate and may be superseded by subsequent market events or for other reasons. Performance of all cited indices is calculated on a total return basis with dividends reinvested.
The investment strategy and themes discussed herein may be unsuitable for investors depending on their specific investment objectives and financial situation. Please note that changes in the rate of exchange of a currency may affect the value, price or income of an investment adversely.
Neither AQR nor the speaker assumes any duty to, nor undertakes to update forward looking statements. No representation or warranty, express or implied, is made or given by or on behalf of AQR, the speaker or any other person as to the accuracy and completeness or fairness of the information contained in this presentation, and no responsibility or liability is accepted for any such information. By accepting this presentation in its entirety, the recipient acknowledges its understanding and acceptance of the foregoing statement.
Big Data in Fixed Income Markets?
AQR Fixed Income Investment Philosophy
Digging Deeper: Value Investing in Fixed Income
Machine Learning Use Case: Does Fundamental Volatility Help Explain Credit Risk?
3
AQR Fixed Income Investment Philosophy
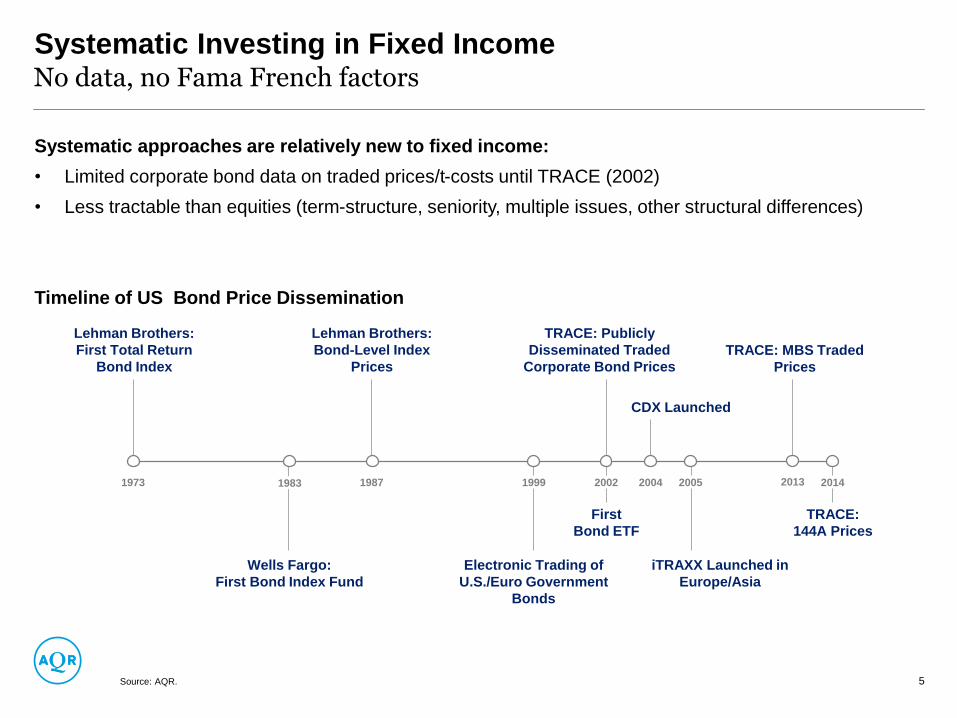
Systematic Investing in Fixed Income
Systematic approaches are relatively new to fixed income:
• Limited corporate bond data on traded prices/t-costs until TRACE (2002)
• Less tractable than equities (term-structure, seniority, multiple issues, other structural differences)
Timeline of US Bond Price Dissemination
No data, no Fama French factors
Source: AQR. 5
1973 1983 1987 20052004 2014
Lehman Brothers:
First Total Return
Bond Index
TRACE: Publicly
Disseminated Traded
Corporate Bond Prices
First
Bond ETF
2002
TRACE:
144A Prices
1999
Wells Fargo:
First Bond Index Fund
Lehman Brothers:
Bond-Level Index
Prices
Electronic Trading of
U.S./Euro Government
Bonds
iTRAXX Launched in
Europe/Asia
CDX Launched
2013
TRACE: MBS Traded
Prices
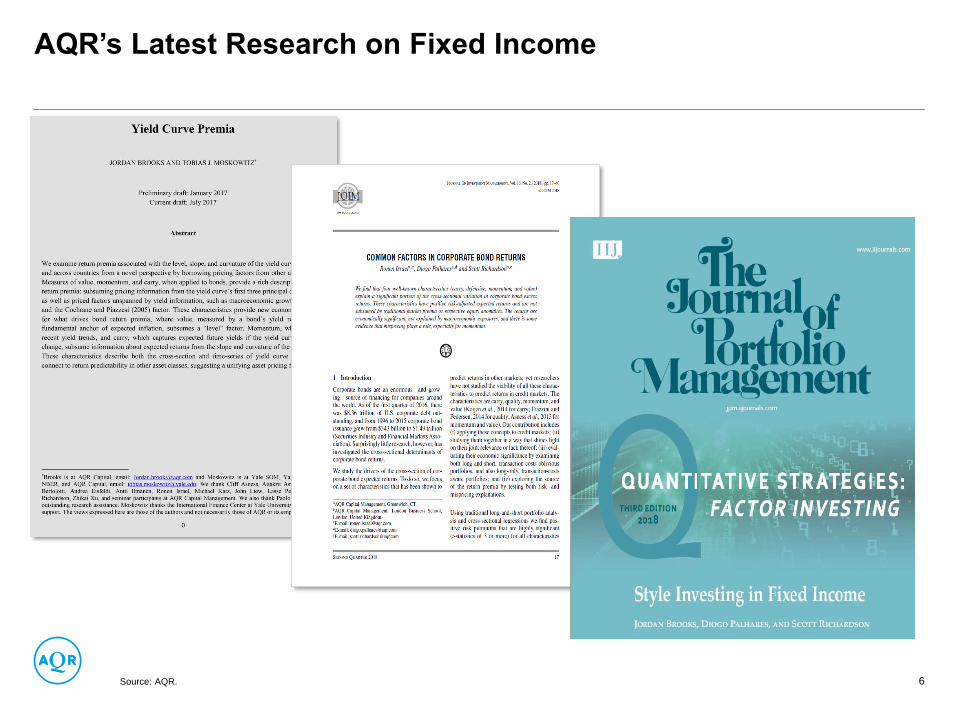
AQR’s Latest Research on Fixed Income
6Source: AQR.
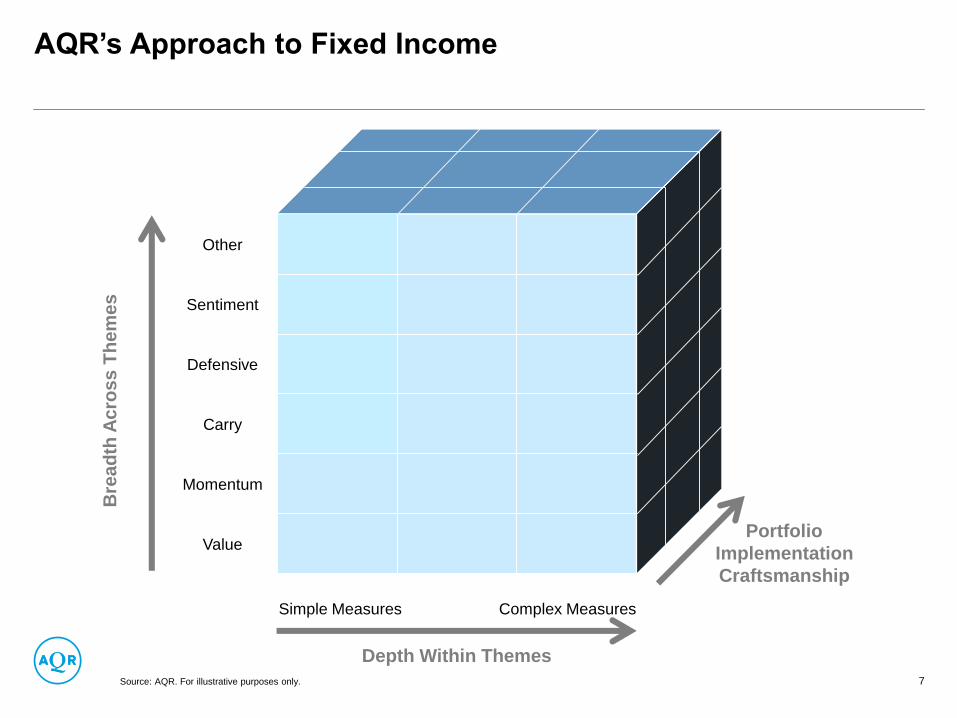
AQR’s Approach to Fixed Income
Source: AQR. For illustrative purposes only. 7
Other
Sentiment
Defensive
Carry
Momentum
Value
Depth Within Themes
Bre
ad
th A
cro
ss
Th
em
es
Portfolio
Implementation
Craftsmanship
Simple Measures Complex Measures
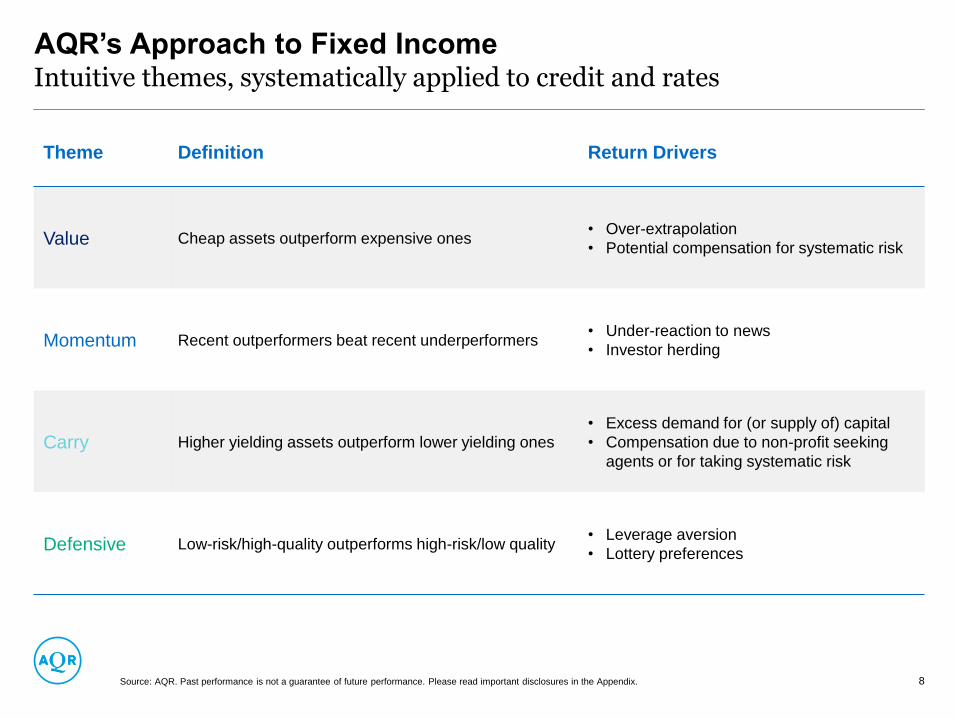
AQR’s Approach to Fixed IncomeIntuitive themes, systematically applied to credit and rates
Source: AQR. Past performance is not a guarantee of future performance. Please read important disclosures in the Appendix. 8
Theme Definition Return Drivers
Value Cheap assets outperform expensive ones• Over-extrapolation
• Potential compensation for systematic risk
Momentum Recent outperformers beat recent underperformers• Under-reaction to news
• Investor herding
Carry Higher yielding assets outperform lower yielding ones
• Excess demand for (or supply of) capital
• Compensation due to non-profit seeking
agents or for taking systematic risk
Defensive Low-risk/high-quality outperforms high-risk/low quality• Leverage aversion
• Lottery preferences
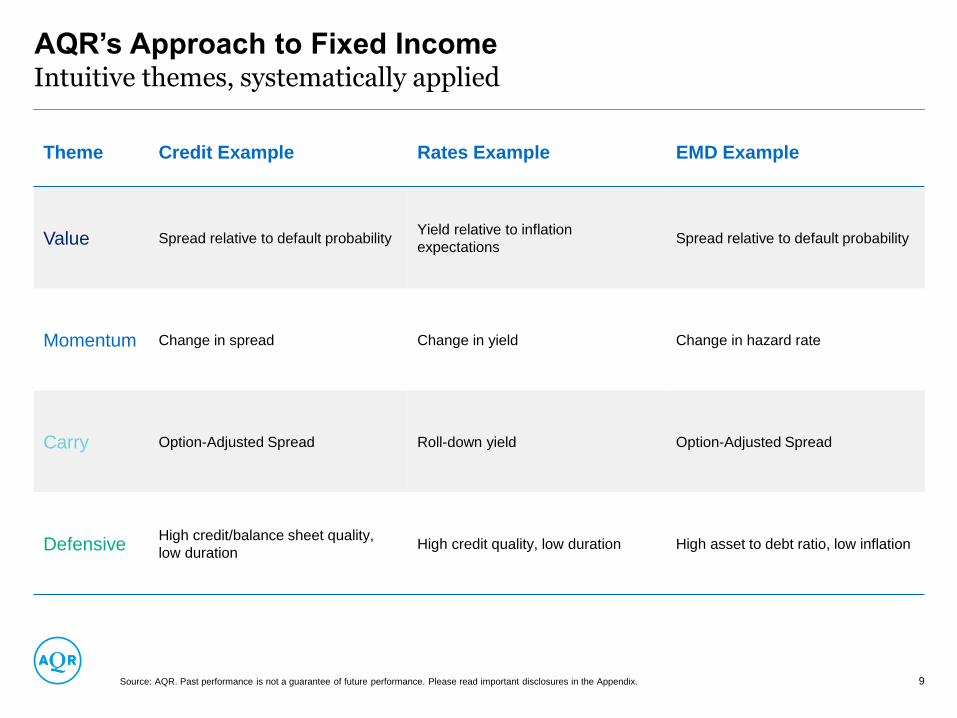
AQR’s Approach to Fixed IncomeIntuitive themes, systematically applied
Source: AQR. Past performance is not a guarantee of future performance. Please read important disclosures in the Appendix. 9
Theme Credit Example Rates Example EMD Example
Value Spread relative to default probabilityYield relative to inflation
expectationsSpread relative to default probability
Momentum Change in spread Change in yield Change in hazard rate
Carry Option-Adjusted Spread Roll-down yield Option-Adjusted Spread
DefensiveHigh credit/balance sheet quality,
low durationHigh credit quality, low duration High asset to debt ratio, low inflation
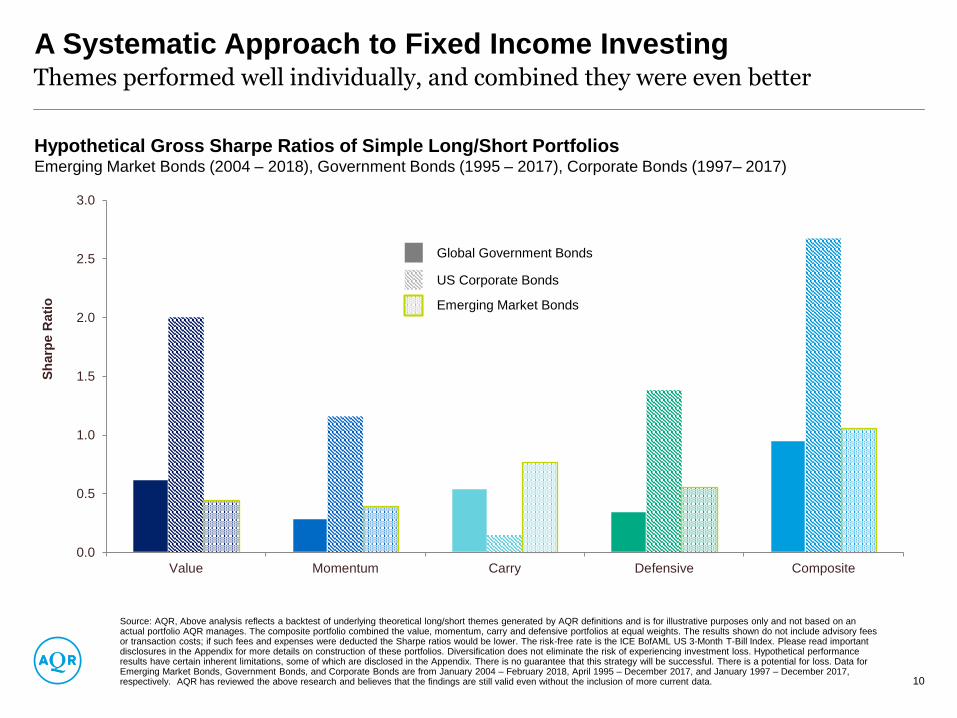
A Systematic Approach to Fixed Income InvestingThemes performed well individually, and combined they were even better
Hypothetical Gross Sharpe Ratios of Simple Long/Short PortfoliosEmerging Market Bonds (2004 – 2018), Government Bonds (1995 – 2017), Corporate Bonds (1997– 2017)
Source: AQR, Above analysis reflects a backtest of underlying theoretical long/short themes generated by AQR definitions and is for illustrative purposes only and not based on an actual portfolio AQR manages. The composite portfolio combined the value, momentum, carry and defensive portfolios at equal weights. The results shown do not include advisory fees or transaction costs; if such fees and expenses were deducted the Sharpe ratios would be lower. The risk-free rate is the ICE BofAML US 3-Month T-Bill Index. Please read important disclosures in the Appendix for more details on construction of these portfolios. Diversification does not eliminate the risk of experiencing investment loss. Hypothetical performance results have certain inherent limitations, some of which are disclosed in the Appendix. There is no guarantee that this strategy will be successful. There is a potential for loss. Data for Emerging Market Bonds, Government Bonds, and Corporate Bonds are from January 2004 – February 2018, April 1995 – December 2017, and January 1997 – December 2017, respectively. AQR has reviewed the above research and believes that the findings are still valid even without the inclusion of more current data. 10
US Corporate Bonds
Emerging Market Bonds
Global Government Bonds
0.0
0.5
1.0
1.5
2.0
2.5
3.0
Value Momentum Carry Defensive Composite
Sh
arp
e R
ati
o
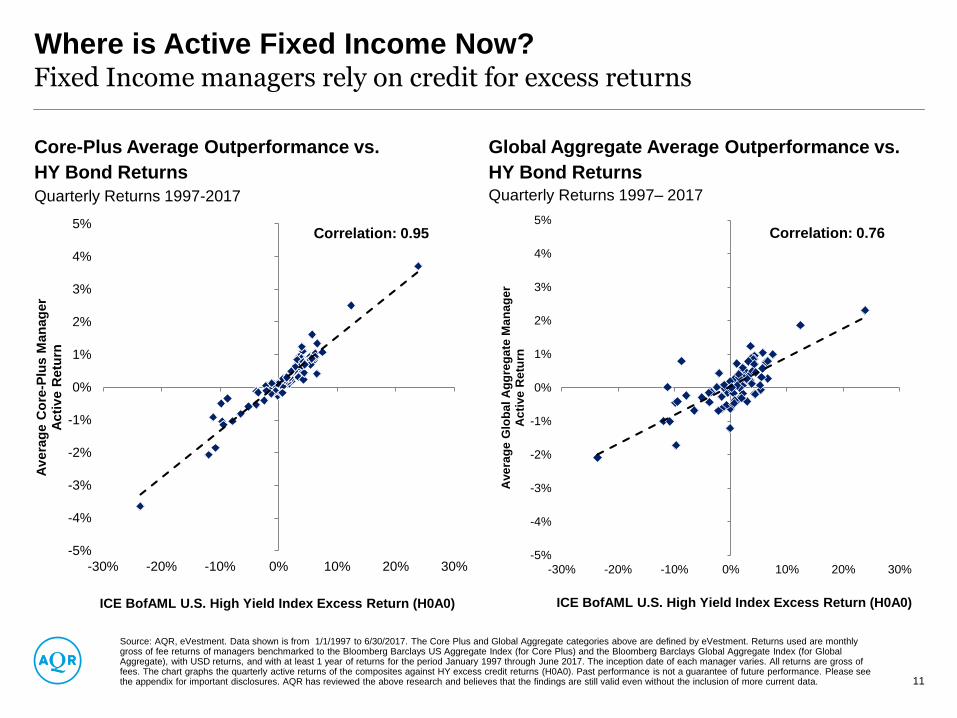
Where is Active Fixed Income Now?Fixed Income managers rely on credit for excess returns
Core-Plus Average Outperformance vs.
HY Bond Returns
Quarterly Returns 1997-2017
Global Aggregate Average Outperformance vs.
HY Bond ReturnsQuarterly Returns 1997– 2017
Source: AQR, eVestment. Data shown is from 1/1/1997 to 6/30/2017. The Core Plus and Global Aggregate categories above are defined by eVestment. Returns used are monthly gross of fee returns of managers benchmarked to the Bloomberg Barclays US Aggregate Index (for Core Plus) and the Bloomberg Barclays Global Aggregate Index (for Global Aggregate), with USD returns, and with at least 1 year of returns for the period January 1997 through June 2017. The inception date of each manager varies. All returns are gross of fees. The chart graphs the quarterly active returns of the composites against HY excess credit returns (H0A0). Past performance is not a guarantee of future performance. Please see the appendix for important disclosures. AQR has reviewed the above research and believes that the findings are still valid even without the inclusion of more current data. 11
-5%
-4%
-3%
-2%
-1%
0%
1%
2%
3%
4%
5%
-30% -20% -10% 0% 10% 20% 30%
Av
era
ge C
ore
-Plu
s M
an
ag
er
Acti
ve R
etu
rn
ICE BofAML U.S. High Yield Index Excess Return (H0A0)
Correlation: 0.95
-5%
-4%
-3%
-2%
-1%
0%
1%
2%
3%
4%
5%
-30% -20% -10% 0% 10% 20% 30%
Ave
rag
e G
lob
al A
gg
reg
ate
Ma
na
ge
rA
cti
ve
Re
turn
ICE BofAML U.S. High Yield Index Excess Return (H0A0)
Correlation: 0.76
0%
5%
10%
15%
20%
25%
30%
35%
-1.0
-0.9
-0.8
-0.7
-0.6
-0.5
-0.4
-0.3
-0.2
-0.1
0.0
0.1
0.2
0.3
0.4
0.5
0.6
0.7
0.8
0.9
1.0
% o
f M
an
ag
ers
Correlation to the Average Manager
0%
5%
10%
15%
20%
25%
30%
35%
-1.0
-0.9
-0.8
-0.7
-0.6
-0.5
-0.4
-0.3
-0.2
-0.1
0.0
0.1
0.2
0.3
0.4
0.5
0.6
0.7
0.8
0.9
1.0
% o
f M
an
ag
ers
Correlation to Credit
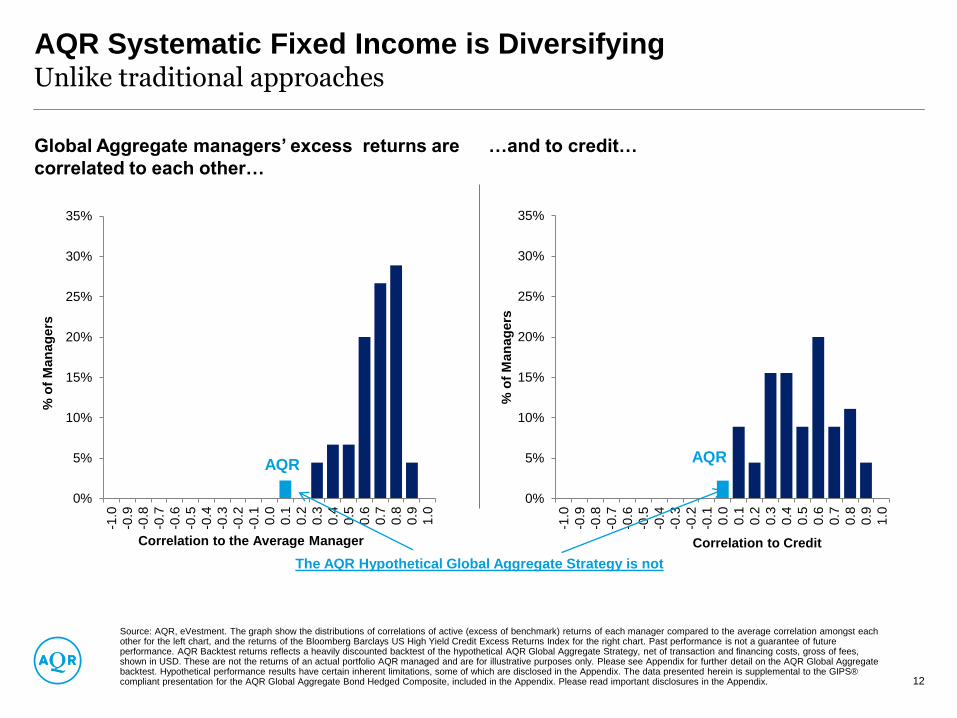
AQR Systematic Fixed Income is DiversifyingUnlike traditional approaches
Global Aggregate managers’ excess returns are
correlated to each other…
…and to credit…
Source: AQR, eVestment. The graph show the distributions of correlations of active (excess of benchmark) returns of each manager compared to the average correlation amongst each other for the left chart, and the returns of the Bloomberg Barclays US High Yield Credit Excess Returns Index for the right chart. Past performance is not a guarantee of future performance. AQR Backtest returns reflects a heavily discounted backtest of the hypothetical AQR Global Aggregate Strategy, net of transaction and financing costs, gross of fees, shown in USD. These are not the returns of an actual portfolio AQR managed and are for illustrative purposes only. Please see Appendix for further detail on the AQR Global Aggregate backtest. Hypothetical performance results have certain inherent limitations, some of which are disclosed in the Appendix. The data presented herein is supplemental to the GIPS® compliant presentation for the AQR Global Aggregate Bond Hedged Composite, included in the Appendix. Please read important disclosures in the Appendix. 12
AQRAQR
The AQR Hypothetical Global Aggregate Strategy is not
Value Momentum
Carry Defensive
0
20
40
60
80
100
-1.0 -0.8 -0.6 -0.4 -0.2 0.0 0.2 0.4 0.6 0.8 1.0
Co
un
t
Theme Tilt Weights
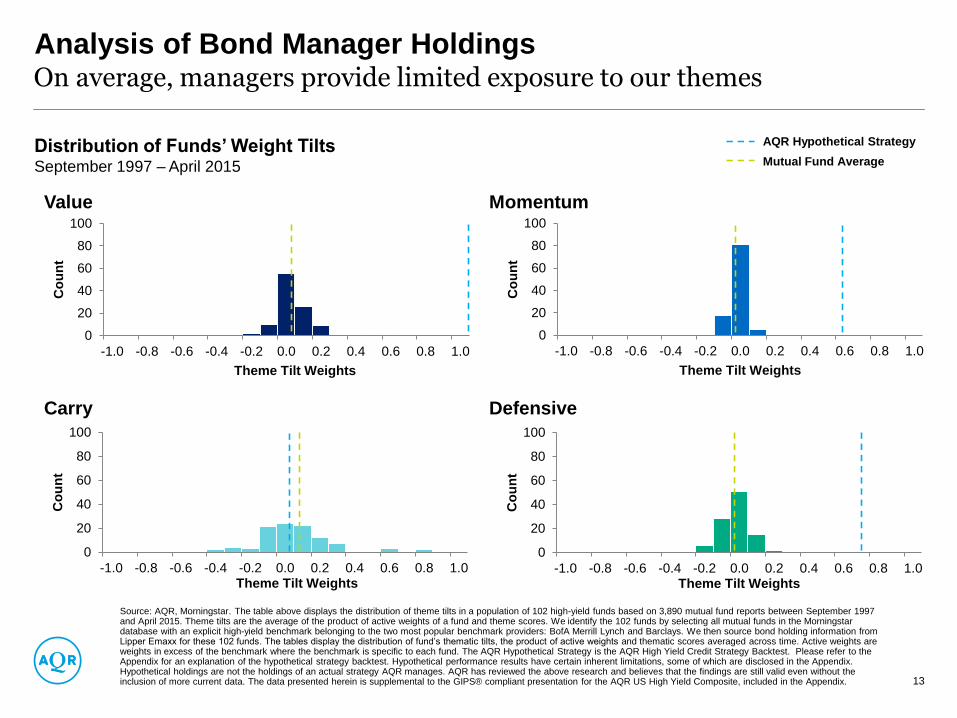
Analysis of Bond Manager HoldingsOn average, managers provide limited exposure to our themes
Distribution of Funds’ Weight TiltsSeptember 1997 – April 2015
Source: AQR, Morningstar. The table above displays the distribution of theme tilts in a population of 102 high-yield funds based on 3,890 mutual fund reports between September 1997 and April 2015. Theme tilts are the average of the product of active weights of a fund and theme scores. We identify the 102 funds by selecting all mutual funds in the Morningstar database with an explicit high-yield benchmark belonging to the two most popular benchmark providers: BofA Merrill Lynch and Barclays. We then source bond holding information from Lipper Emaxx for these 102 funds. The tables display the distribution of fund’s thematic tilts, the product of active weights and thematic scores averaged across time. Active weights are weights in excess of the benchmark where the benchmark is specific to each fund. The AQR Hypothetical Strategy is the AQR High Yield Credit Strategy Backtest. Please refer to the Appendix for an explanation of the hypothetical strategy backtest. Hypothetical performance results have certain inherent limitations, some of which are disclosed in the Appendix. Hypothetical holdings are not the holdings of an actual strategy AQR manages. AQR has reviewed the above research and believes that the findings are still valid even without the inclusion of more current data. The data presented herein is supplemental to the GIPS® compliant presentation for the AQR US High Yield Composite, included in the Appendix. 13
AQR Hypothetical Strategy
Mutual Fund Average
0
20
40
60
80
100
-1.0 -0.8 -0.6 -0.4 -0.2 0.0 0.2 0.4 0.6 0.8 1.0
Co
un
t
Theme Tilt Weights
0
20
40
60
80
100
-1.0 -0.8 -0.6 -0.4 -0.2 0.0 0.2 0.4 0.6 0.8 1.0
Co
un
t
Theme Tilt Weights
0
20
40
60
80
100
-1.0 -0.8 -0.6 -0.4 -0.2 0.0 0.2 0.4 0.6 0.8 1.0
Co
un
t
Theme Tilt Weights
Digging DeeperValue Investing in Fixed Income
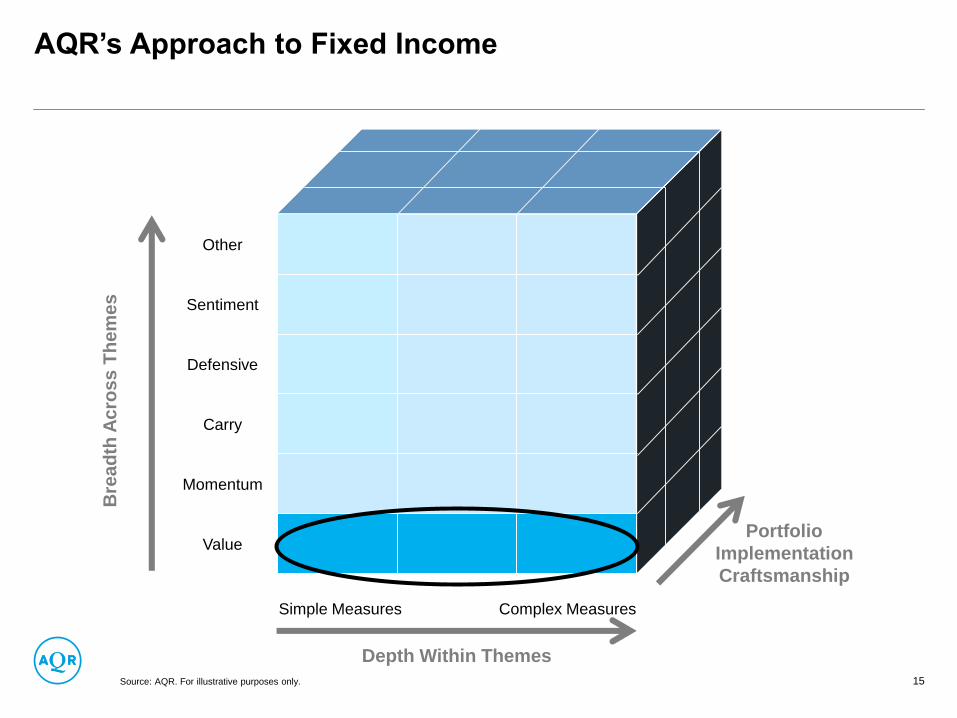
AQR’s Approach to Fixed Income
Source: AQR. For illustrative purposes only. 15
Other
Sentiment
Defensive
Carry
Momentum
Value
Depth Within Themes
Bre
ad
th A
cro
ss
Th
em
es
Portfolio
Implementation
Craftsmanship
Simple Measures Complex Measures
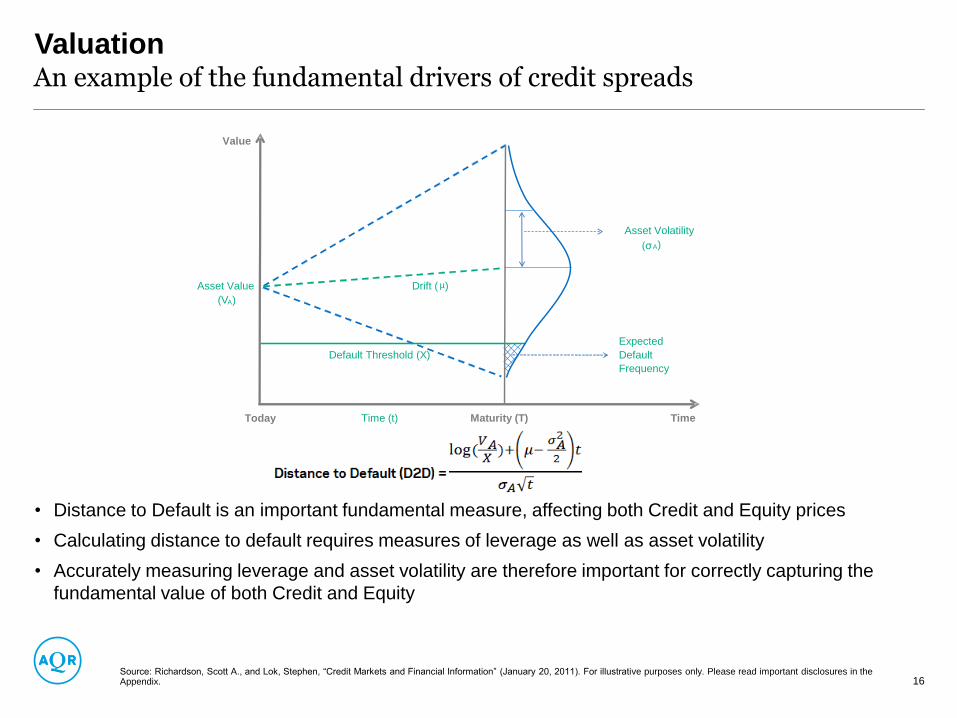
Valuation
• Distance to Default is an important fundamental measure, affecting both Credit and Equity prices
• Calculating distance to default requires measures of leverage as well as asset volatility
• Accurately measuring leverage and asset volatility are therefore important for correctly capturing the
fundamental value of both Credit and Equity
An example of the fundamental drivers of credit spreads
Source: Richardson, Scott A., and Lok, Stephen, “Credit Markets and Financial Information” (January 20, 2011). For illustrative purposes only. Please read important disclosures in the Appendix. 16
Value
Asset Volatility
A)
Asset Value Drift ( µ)
(VA)
Expected
Default
Frequency
Today Maturity (T) TimeTime (t)
Default Threshold (X)
(σ
Machine Learning Use Case:Does Fundamental Volatility Help Explain Credit Risk?
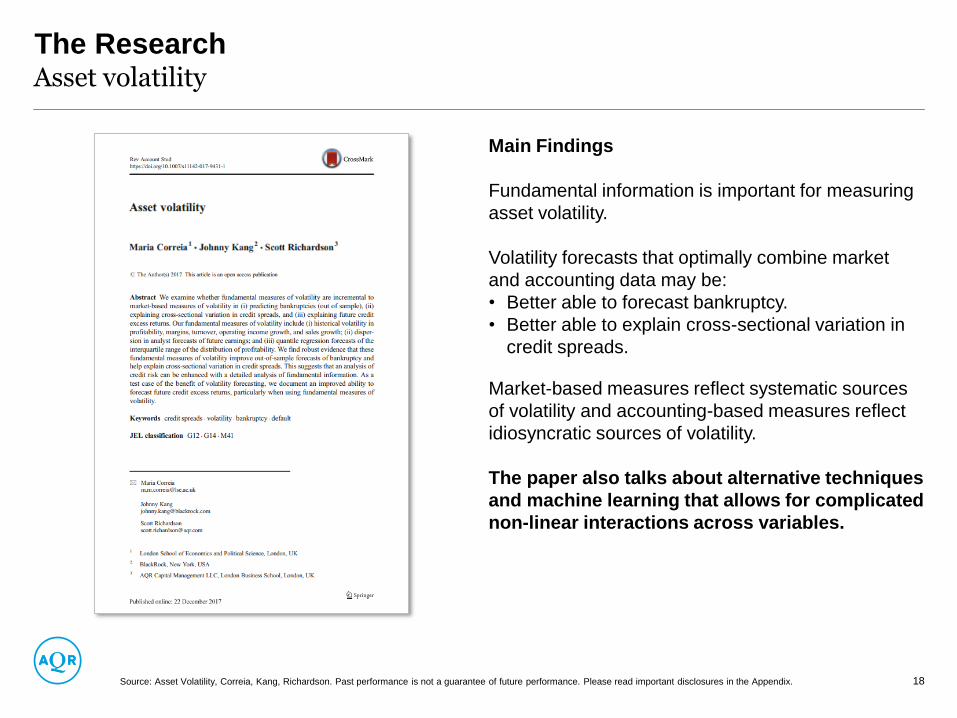
The ResearchAsset volatility
Main Findings
Fundamental information is important for measuring
asset volatility.
Volatility forecasts that optimally combine market
and accounting data may be:
• Better able to forecast bankruptcy.
• Better able to explain cross-sectional variation in
credit spreads.
Market-based measures reflect systematic sources
of volatility and accounting-based measures reflect
idiosyncratic sources of volatility.
The paper also talks about alternative techniques
and machine learning that allows for complicated
non-linear interactions across variables.
Source: Asset Volatility, Correia, Kang, Richardson. Past performance is not a guarantee of future performance. Please read important disclosures in the Appendix. 18
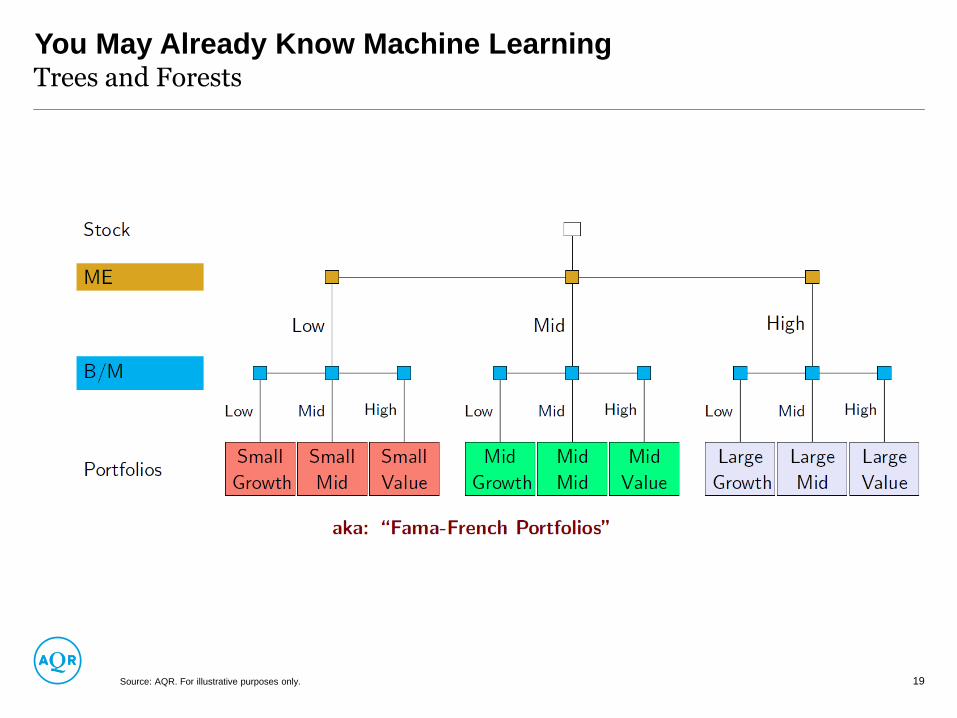
You May Already Know Machine LearningTrees and Forests
Source: AQR. For illustrative purposes only. 19
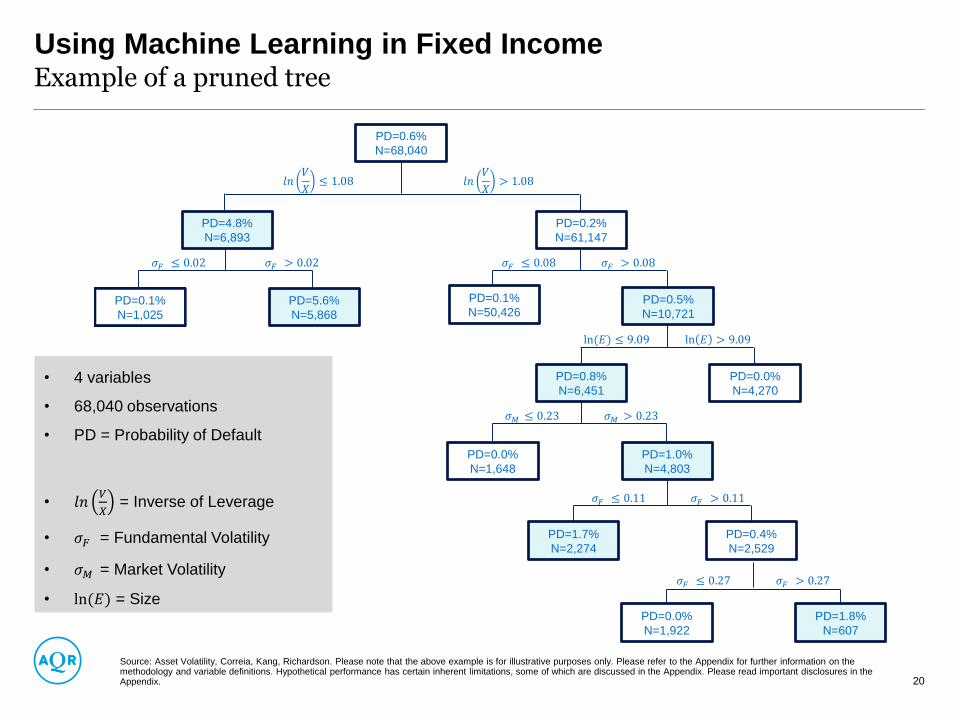
Using Machine Learning in Fixed IncomeExample of a pruned tree
Source: Asset Volatility, Correia, Kang, Richardson. Please note that the above example is for illustrative purposes only. Please refer to the Appendix for further information on the methodology and variable definitions. Hypothetical performance has certain inherent limitations, some of which are discussed in the Appendix. Please read important disclosures in the Appendix. 20
PD=4.8%
N=6,893
PD=0.1%
N=1,025
PD=5.6%
N=5,868
𝑙𝑛𝑉
𝑋≤ 1.08 𝑙𝑛
𝑉
𝑋> 1.08
𝜎𝐹 ≤ 0.08 𝜎𝐹 > 0.08𝜎𝐹 ≤ 0.02 𝜎𝐹 > 0.02
ln(𝐸) ≤ 9.09 ln 𝐸 > 9.09
𝜎𝐹 ≤ 0.27 𝜎𝐹 > 0.27
𝜎𝐹 ≤ 0.11 𝜎𝐹 > 0.11
𝜎𝑀 ≤ 0.23 𝜎𝑀 > 0.23
PD=0.6%
N=68,040
PD=0.2%
N=61,147
PD=0.1%
N=50,426PD=0.5%
N=10,721
PD=0.8%
N=6,451
PD=0.0%
N=4,270
PD=0.0%
N=1,648
PD=0.4%
N=2,529
PD=1.7%
N=2,274
PD=1.8%
N=607
PD=0.0%
N=1,922
• 4 variables
• 68,040 observations
• PD = Probability of Default
• 𝑙𝑛𝑉
𝑋= Inverse of Leverage
• 𝜎𝐹 = Fundamental Volatility
• 𝜎𝑀 = Market Volatility
• ln(𝐸) = Size
PD=1.0%
N=4,803

AQR’s Approach to Fixed IncomeIntuitive themes, systematically applied
Source: AQR. Past performance is not a guarantee of future performance. Please read important disclosures in the Appendix. 21
Theme Rates Example Credit Example EMD Example
ValueYield relative to inflation
expectations
Spread relative to default
probabilitySpread relative to default probability
Momentum
Price: Change in yield
Fundamental: Change in growth
expectations
Price: Change in spread
Fundamental: Change in
default probability
Change in hazard rate
Carry Roll-down yield Option-Adjusted Spread Option-Adjusted Spread
Defensive High credit quality, low durationHigh credit/balance sheet
quality, low durationHigh asset to debt ratio, low inflation

We believe that a systematic approach can capture the fundamental drivers of relative performance
in fixed income.
Experienced Team
• AQR has a 20-year track record managing and implementing systematic fixed income strategies
Fundamental Investing – Systematically Applied
• Fundamental drivers of returns applied within fixed income sectors
Targets Consistent and Diversifying Outperformance
• Targets excess returns uncorrelated to other asset classes as well as traditional fixed income managers
Machine learning: fundamental volatility may help explain credit risk
ConclusionSystematic investing in fixed income
22Source: AQR. As of 9/30/2018. Targets may be subject to change and there is no guarantee that they will be met. Diversification does not eliminate the risk of experiencing investment losses.
Appendix
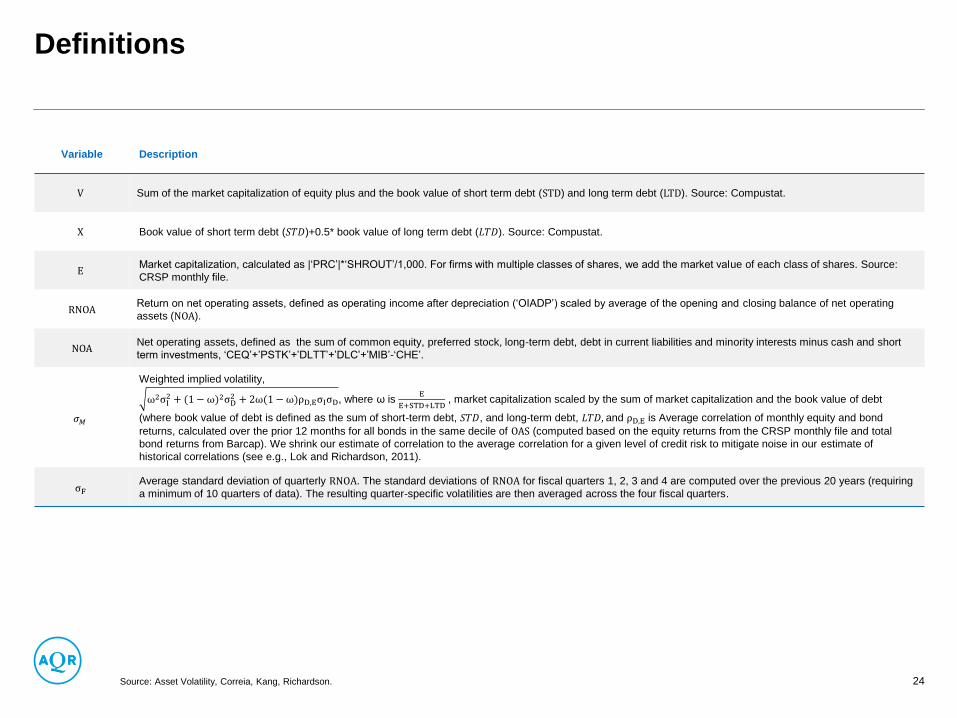
Definitions
Variable Description
V Sum of the market capitalization of equity plus and the book value of short term debt (STD) and long term debt (LTD). Source: Compustat.
X Book value of short term debt (𝑆𝑇𝐷)+0.5* book value of long term debt (𝐿𝑇𝐷). Source: Compustat.
EMarket capitalization, calculated as |‘PRC’|*‘SHROUT’/1,000. For firms with multiple classes of shares, we add the market value of each class of shares. Source:
CRSP monthly file.
RNOAReturn on net operating assets, defined as operating income after depreciation (‘OIADP’) scaled by average of the opening and closing balance of net operating
assets (NOA).
NOANet operating assets, defined as the sum of common equity, preferred stock, long-term debt, debt in current liabilities and minority interests minus cash and short
term investments, ‘CEQ’+’PSTK’+’DLTT’+’DLC’+’MIB’-‘CHE’.
𝜎𝑀
Weighted implied volatility,
ω2σI2 + (1 − ω)2σD
2 + 2ω(1 −ω)ρD,EσIσD, where ω is E
E+STD+LTD, market capitalization scaled by the sum of market capitalization and the book value of debt
(where book value of debt is defined as the sum of short-term debt, 𝑆𝑇𝐷, and long-term debt, 𝐿𝑇𝐷, and ρD,E is Average correlation of monthly equity and bond
returns, calculated over the prior 12 months for all bonds in the same decile of OAS (computed based on the equity returns from the CRSP monthly file and total
bond returns from Barcap). We shrink our estimate of correlation to the average correlation for a given level of credit risk to mitigate noise in our estimate of
historical correlations (see e.g., Lok and Richardson, 2011).
σFAverage standard deviation of quarterly RNOA. The standard deviations of RNOA for fiscal quarters 1, 2, 3 and 4 are computed over the previous 20 years (requiring
a minimum of 10 quarters of data). The resulting quarter-specific volatilities are then averaged across the four fiscal quarters.
Source: Asset Volatility, Correia, Kang, Richardson. 24

Methodology
We estimate the probability of bankruptcy based on a large sample of Chapter 7 and Chapter 11 bankruptcies filed between 1980 and the end of 2012. We combine bankruptcy data from
four main sources: Beaver, Correia, and McNichols (2012); the New Generation Research bankruptcy database (bankruptcydata.com); Mergent FISD; and the UCLA-Lo Pucki bankruptcy
database. Our dependent variable is equal to 1 if a firm files for bankruptcy within 1 year of the end of the month, and 0 otherwise. We keep the first bankruptcy filing and remove from the
sample all months after this filing.
For the binary recursive partitioning analysis we use the Classification and Regression Trees methodology (CART) (Breiman, Friedman, Olshen and Stone, 1984) to create a decision tree
that classifies firm-years into bankrupt or non-bankrupt. Variable importance scores capture the role played by a variable in a specific tree, and CART trees may be sensitive to the training
data. To circumvent this potential issue and assess the stability of our variable importance scores, we build 100 bootstrap samples and compute variable importance scores for each of
these samples. The analysis is based on a sample of 61,301 firm-months for the period January 1996 through to December 2012.
Example of a pruned tree
25
Performance Disclosures
26
This document has been provided to you solely for information purposes and does not constitute an offer or solicitation of an offer or any advice or recommendation to purchase any securities or other financial instruments and may not be construed as such. The factual information set forth herein has been obtained or derived from sources believed to be reliable but it is not necessarily all-inclusive and is not guaranteed as to its accuracy and is not to be regarded as a representation or warranty, express or implied, as to the information’s accuracy or completeness, nor should the attached information serve as the basis of any investment decision. This document is intended exclusively for the use of the person to whom it has been delivered and it is not to be reproduced or redistributed to any other person. For one-on-one presentation use only.
Actual performance figures contained herein reflect the reinvestment of dividends and all other earnings and represent unaudi ted estimates of realized and unrealized gains and losses prepared by AQR Capital Management, LLC (“AQR”). There is no guarantee as to the above information's accuracy or completeness. PAST PERFORMANCE IS NOT A GUARANTEE OF FUTURE PERFORMANCE. There is no guarantee, express or implied, that long-term return and/or volatility targets will be achieved. Realized returns and/or volatility may come in higher or lower than expected. Diversification does not eliminate the risk of experiencing investment losses.
HYPOTHETICAL PERFORMANCE RESULTS HAVE MANY INHERENT LIMITATIONS, SOME OF WHICH, BUT NOT ALL, ARE DESCRIBED HEREIN. NO REPRESENTATION IS BEING MADE THAT ANY FUND OR ACCOUNT WILL OR IS LIKELY TO ACHIEVE PROFITS OR LOSSES SIMILAR TO THOSE SHOWN HEREIN. IN FACT, THERE ARE FREQUENTLY SHARP DIFFERENCES BETWEEN HYPOTHETICAL PERFORMANCE RESULTS AND THE ACTUAL RESULTS SUBSEQUENTLY REALIZED BY ANY PARTICULAR TRADING PROGRAM. ONE OF THE LIMITATIONS OF HYPOTHETICAL PERFORMANCE RESULTS IS THAT THEY ARE GENERALLY PREPARED WITH THE BENEFIT OF HINDSIGHT. IN ADDITION, HYPOTHETICAL TRADING DOES NOT INVOLVE FINANCIAL RISK, AND NO HYPOTHETICAL TRADING RECORD CAN COMPLETELY ACCOUNT FOR THE IMPACT OF FINANCIAL RISK IN ACTUAL TRADING. FOR EXAMPLE, THE ABILITY TO WITHSTAND LOSSES OR TO ADHERE TO A PARTICULAR TRADING PROGRAM IN SPITE OF TRADING LOSSES ARE MATERIAL POINTS THAT CAN ADVERSELY AFFECT ACTUAL TRADING RESULTS. THERE ARE NUMEROUS OTHER FACTORS RELATED TO THE MARKETS IN GENERAL OR TO THE IMPLEMENTATION OF ANY SPECIFIC TRADING PROGRAM WHICH CANNOT BE FULLY ACCOUNTED FOR IN THE PREPARATION OF HYPOTHETICAL PERFORMANCE RESULTS, ALL OF WHICH CAN ADVERSELY AFFECT ACTUAL TRADING RESULTS. The hypothetical performance results contained herein represent the application of the quantitative models as currently in effect on the date first written above and there can be no assurance that the models will remain the same in the future or that an application of the current models in the future will produce similar results because the relevant market and economic conditions that prevailed during the hypothetical performance period will not necessarily recur. Discounting factors may be applied to reduce suspected anomalies. This backtest’s return, for this period, may vary depending on the date it is run. Hypothetical performance results are presented for illustrative purposes only. In addition, our transaction cost assumptions utilized in backtests, where noted, are based on AQR Capital Management, LLC’s, (“AQR”)’s historical realized transaction costs and market data. Certain of the assumptions have been made for modeling purposes and are unlikely to be realized. No representation or warranty is made as to the reasonableness of the assumptions made or that all assumptions used in achieving the returns have been stated or fully considered. Changes in the assumptions may have a material impact on the hypothetical returns presented. Actual advisory fees for products offering this strategy may vary.
(c) Morningstar 2018. All rights reserved. Use of this content requires expert knowledge. It is to be used by specialist institutions only. The information contained herein: (1) is proprietary to Morningstar and/or its content providers; (2) may not be copied, adapted or distributed; and (3) is not warranted to be accurate, complete or timely. Neither Morningstar nor its content providers are responsible for any damages or losses arising from any use of this information, except where such damages or losses cannot be limited or excluded by law in your jurisdiction. Past financial performance is no guarantee of future results.
There is a risk of substantial loss associated with trading commodities, futures, options, derivatives and other financial instruments. Before trading, investors should carefully consider their financial position and risk tolerance to determine if the proposed trading theme is appropriate. Investors should realize that when trading futures, commodities, options, derivatives and other financial instruments one could lose the full balance of their account. It is also possible to lose more than the initial deposit when trading derivatives or using leverage. All funds committed to such a trading strategy should be purely risk capital.
The information set forth herein has been prepared and issued by AQR Capital Management (Europe) LLP, a U.K. limited liability partnership with its registered office at Charles House 5-11 Regent St. London, SW1Y 4LR, which is authorized by the U.K. Financial Conduct Authority (“FCA”) .This presentation is a financial promotion and has been approved by AQR Capital Management (Europe) LLP.
Corporate Bonds BacktestAQR backtests of Value, Momentum, Carry and Defensive theoretical long/short theme components are based on monthly returns, undiscounted, gross of fees and transaction costs, and scaled to 5% annualized volatility. Each strategy is designed to take long positions in the assets with the strongest theme attributes and short positions in the assets with the weakest theme attributes, while seeking to ensure the portfolio is market-neutral. The universe is based on the constituents of the Bank of America High Yield and Investment Grade Indices.
Emerging Bonds BacktestFor Emerging bonds, portfolios are formed by ranking the bonds along the four themes (Value, Momentum, Carry, Defensive) and then overweighting the securities that look most attractive and underweighting the securities that look least attractive. Time period used is January 2004 – February 2018. The universe is based on the constituents of the JPMorgan EMBI Global Diversified Index. Each theme is scaled to 10% and all returns are excess of cash.
Government Bonds BacktestAQR backtests of Value, Momentum, Carry, and Defensive theoretical long/short theme components are built as follows. We first rank the universe of securities (i.e., the 39 country-maturity buckets) by the raw measure of a given theme. We then standardize the ranks by subtracting the mean rank from each rank and dividing by the standard deviation of ranks to convert them into a set of standardized weights. Next we scale each side of these portfolios (long and short) to sum to one. Lastly, we apply these weights to our asset returns, which are always expressed in a constant duration of four.
Value: Value strategies favor investments that appear cheap over those that appear expensive based on fundamental measures related to credit spreads, seeking to capture the tendency for relatively cheap assets to outperform relatively expensive assets.
Momentum: Momentum strategies favor investments that either have performed well recently or have related securities that have performed well recently. It seeks to capture the tendency that an asset’s and related securities recent relative performance predict the performance of the asset in the near future.
Carry: Carry strategies favor high-yielding assets, seeking to capture the tendency of high-yielding assets to outperform lower-yielding assets.
Defensive: Defensive strategies favor investments with strong drivers of credit valuation. It seeks to capture the tendency for assets with strong fundamentals to generate higher risk-adjusted returns than assets with weak fundamentals.
Performance Disclosures
27
AQR backtests of Value, Momentum, Carry and Defensive theoretical long/short style components are based on monthly returns, undiscounted, gross of fees and transaction costs, excess of a cash rate proxied by the Merrill Lynch 3-Month T-Bill Index, and scaled to 12% annualized volatility. Each strategy is designed to take long positions in the assets with the strongest style attributes and short positions in the assets with the weakest style attributes, while seeking to ensure the portfolio is market-neutral. The Style Premia Strategy portfolio is based on the target asset group allocations included herein, roughly equally risk weighting styles within the asset group, resulting in a style allocation of approximately 34% to Value, 34% to Momentum, 18% to Defensive and 14% to Carry. The Style and Asset Group Composites, are based on an allocation to the style components and asset group components based on their liquidity and breadth. The components are then allocated with roughly equal weighting to each of the styles within an asset group (as not all four styles are present in each asset group). Please see below for a description of the Universe selection.
Stock and Industry Selection: approximately 2,000 stocks across Europe, Japan, and U.S. Country Equity Indices: Developed Markets: Australia, Canada, Eurozone, Hong Kong, Japan, Sweden, Switzerland, U.K., U.S. Within Europe: Italy, France, Germany, Netherlands, Spain. Emerging Markets: Brazil, China, India, Israel, Malaysia, Mexico, Poland, Singapore, South Africa, South Korea, Taiwan, Thailand, Turkey. Bond Futures: Australia, Canada, Germany, Japan, U.K., U.S. Yield Curve: Australia Germany, United States. Interest Rate Futures: Australia, Canada, Europe (Euribor), U.K. and U.S. (Eurodollar). Currencies: Developed Markets: Australia, Canada, Euro, Japan, New Zealand, Norway, Sweden, Switzerland, U.K., U.S. Emerging Markets: Brazil, Hungary, India, Israel, Mexico, Poland, Singapore, South Africa, South Korea, Taiwan, Turkey. Commodity Selection: Silver, copper, gold, crude, Brent oil, natural gas, corn, soybeans.
Government Bonds: Government bonds include all bonds covered by the J.P. Morgan Government Bond Index (GBI). The GBI is a market-cap-weighted index of all liquid government bonds across 13 markets (Australia, Belgium, Canada, Denmark, France, Germany, Italy, Japan, Netherlands, Spain, Sweden, U.K., U.S.). It excludes securities with time-to-maturity (TTM) of less than 12 months, illiquid securities, and securities with embedded optionality (e.g., convertible bonds). The GBI is sub-divided into two country-maturity partitions. We use the first, more coarse partition in this analysis, which divides bonds into 1yr-5yr TTM, 5yr-10yr TTM, and 10yr-30yr TTM. We sort the bonds into terciles based on the theme metrics described on page 2. The portfolios go long the top tercile and short the bottom tercile. Bonds are equal-weighted in each tercile.
Corporate Bond: Corporate bonds include 1,300 bonds that roughly comprise the Bank of America Merrill Lynch investment grade (U.S. Corporate Master) and high yield (U.S. High Yield Master) corporate bond indices. Of the 1,300, 600 are investment grade, and 700 are high yield bonds. We sort the bonds into quintiles based on the four theme metrics described on page 3. The portfolios go long the top quintile and short the bottom quintile. Bonds are value-weighted, not equal-weighted, within each quintile.
Spread returns are excess returns over duration-matched treasury returns; spread risk is the volatility (standard deviation) of the previously defined spread returns.
Rate returns are the difference between total returns and spread returns; rate risk is the volatility (standard deviation) of the previously defined rate returns.
Emerging Bond: Universe is based on the constituents of the JP Morgan EMBI Global Diversified Index. The JPMorgan EMBI Global Diversified Index is a broad emerging market debt benchmark including US dollar denominated Brady bonds, Eurobonds, and traded loans issued by quasi-sovereign entities.
Fama French portfolios: SMB is a zero-investment portfolio that is long on small capitalization (cap) stocks and short on big cap stocks. Similarly, HML is a zero-investment portfolio that is long on high book-to-market (B/M) stocks and short on low B/M stocks, and UMD is a zero-cost portfolio that is long previous 12-month return winners and short previous 12-month loser stocks. The universe for the Fama French portfolios is the CRSP universe.
QMJ is a portfolio that is long high-quality stocks and shorts low-quality stocks using the CRSP universe.
The AQR High Yield Credit Strategy BacktestThe strategy provides exposure to value, momentum, carry, and defensive styles in an integrated fashion. Backtest returns are heavily discounted, net of t-costs but gross of fees, in excess of a cash rate proxied by the Merrill Lynch 3-Month T-Bill Index. Each strategy is designed to take positions in the high yield corporate bonds with the strongest combined styles or single style attributes, respectively. The tradable universe of selected credits consists of a liquid subset of the ICE BofAML US High Yield Index (H0A0).Value: Value strategies favor investments that appear cheap over those that appear expensive based on fundamental measures related to credit spreads, seeking to capture the tendency for relatively cheap assets to outperform relatively expensive assets.Momentum: Momentum strategies favor investments that either have performed well recently or have related securities that have performed well recently. It seeks to capture the tendency that an asset’s and related securities recent relative performance predict the performance of the asset in the near future.Carry: Carry strategies favor high-yielding assets, seeking to capture the tendency of high-yielding assets to outperform lower-yielding assets.Defensive: Defensive strategies favor investments with strong drivers of credit valuation. It seeks to capture the tendency for assets with strong fundamentals to generate higher risk-adjusted returns than assets with weak fundamentals.
Performance DisclosuresAQR Capital Management, LLC Firm-wide Disclosures
28
This presentation cannot be used in a general solicitation or general advertising to offer or sell interest in its Funds. As such, this information cannot be included in any advertisement, article, notice or other communication published in any newspaper, magazine, or similar media or broadcast over television or radio; and cannot be used in any seminar or meeting whose attendees have been invited by any general solicitation or general advertising.
Firm Information: AQR Capital Management, LLC (“AQR”) is a Connecticut based investment advisor registered with the Securities and Exchange Commission under the Investment Advisors Act of 1940. AQR conducts trading and investment activities involving a broad range of instruments, including, but not limited to, individual equity and debt securities, currencies, futures, commodities, fixed income products and other derivative securities. For purposes of firm-wide compliance and firm-wide total assets, AQR defines the “Firm” as entities controlled by or under common control with AQR (including voting right). The Firm is comprised of AQR and its advisory affiliates, including CNH Partners, LLC (“CNH”).
Upon request, AQR will make available a complete list and description of all Firm composites, as well as additional information regarding the policies for valuing portfolios, calculating performance, and preparing compliant presentations.
GIPS Compliance: AQR claims compliance with the Global Investment Performance Standards (GIPS®) and has prepared and presented this report in compliance with the GIPS standards. AQR has been independently verified for the period August 1, 1998 through December 31, 2017. The verification reports are available upon request. Verification assesses whether (1) the Firm has complied with all composite construction requirements of the GIPS standards on a firm-wide basis and (2) the Firm’s policies and procedures are designed to calculate and present performance in compliance with the GIPS standards. Verification does not ensure the accuracy of any specific composite presentation.
Composite Characteristics: New accounts that fit a composite definition are added at the start of the first full calendar month after the assets come under management, or after it is deemed that the investment decisions made by the investment advisor fully reflect the intended investment strategy of the portfolio. A composite will exclude terminated accounts after the last full calendar month performance measurement period that the assets were under management. The composite will continue to include the performance results for all periods prior to termination. For periods beginning July 1, 2010 through February 28, 2015, AQR defined a significant cash flow as an external cash flow within a portfolio of 50%. Additional information is available upon request.
Calculation Methodology: All portfolios are valued daily, weekly, intra-monthly or monthly as defined by Firm policy. The Modified Dietz calculation methodology is used when calculating monthly and intra-month returns. Mutual funds and UCITS are valued daily and performance is calculated on a daily basis. Gross of fees returns are calculated gross of management and performance fees, administrative and custodial costs, and net of transaction costs beginning January 1, 2010. Prior to January 1, 2010, gross of fees returns are gross of management and performance fees, and net of administrative, custodial, and transaction costs. Additional information regarding fees and the calculation of gross and net performance is available upon request.
The dispersion measure is the equal-weighted standard deviation of accounts in a composite for the entire year. Dispersion is not considered meaningful for periods shorter than one year or for periods during which a composite contains five or fewer accounts for the full period. The three-year annualized ex-post standard deviation measure is inapplicable when 36 monthly returns are not available.
Returns are calculated net of all withholding taxes on foreign dividends. Accruals for fixed income and equity securities are included in calculations. AQR’s management or advisory fees are described in Part 2A of its Form ADV. In addition, AQR funds may have a redemption charge up to 2.00% based on gross redemption proceeds that may be charged upon early withdrawals. Consultants supplied with gross results are to use this data in accordance with SEC, CFTC and NFA guidelines.
Other Disclosures: AQR may engage in leveraged, derivative, and short positions in order to meet its performance objectives. The use of these positions may have a material impact on performance results. Additionally, there may be subjective unobservable inputs used in the valuation of certain financial instruments utilized by certain AQR managed investment vehicles. The risks inherent to the strategies employed by accounts included are set forth in the applicable offering documents and other information provided to potential subscribers, from where more detailed information regarding the extent to which leverage, derivatives, and short positions can be obtained. These are available upon request, if not provided along with this presentation itself.
Past performance is not an indication of future performance.
Performance DisclosuresAQR Capital Management, LLC Global Aggregate Bond Hedged Composite2/1/2018 – Present
29
Bloomberg Barclays Global Aggregate Total Return Index Value Hedged
Composite Description: The Global Aggregate Bond Hedged Composite (the “Composite”) was created in February 2018. The investment objective of the composite strategy is to maximize total return through capital growth and income by outperforming the Bloomberg Barclays Global Aggregate Hedged Bond benchmark. The strategy pursues its investment objective by providing exposure to systematic factors such as value, momentum, carry and defensive. It achieves these exposures by investing primarily in investment grade global debt securities, using derivative strategies where appropriate, and currency allocation. The Composite is denominated in USD.
Benchmark: The Composite benchmark is the Bloomberg Barclays Global Aggregate Total Return Index Value Hedged (the “Benchmark”). The index is a measure of global investment grade debt from twenty-four local currency markets, including treasury, government-related, corporate and securitized fixed-rate bonds from both developed and emerging markets issuers.
Fees: Composite net of fees returns are calculated by deducting the maximum model management or advisory fee AQR could charge from the composite monthly gross returns. AQR’s asset-based fees for portfolios within the Composite may range up to 0.30% of assets under management and are generally billed monthly or quarterly at the commencement of the calendar month or quarter during which AQR will perform the services to which the fees relate. Composite assets may have been exposed to the impact of performance fees.
Past performance is not an indication of future performance.
Performance DisclosuresAQR Capital Management, LLC US High Yield Composite7/1/2016 – 12/31/2017
30
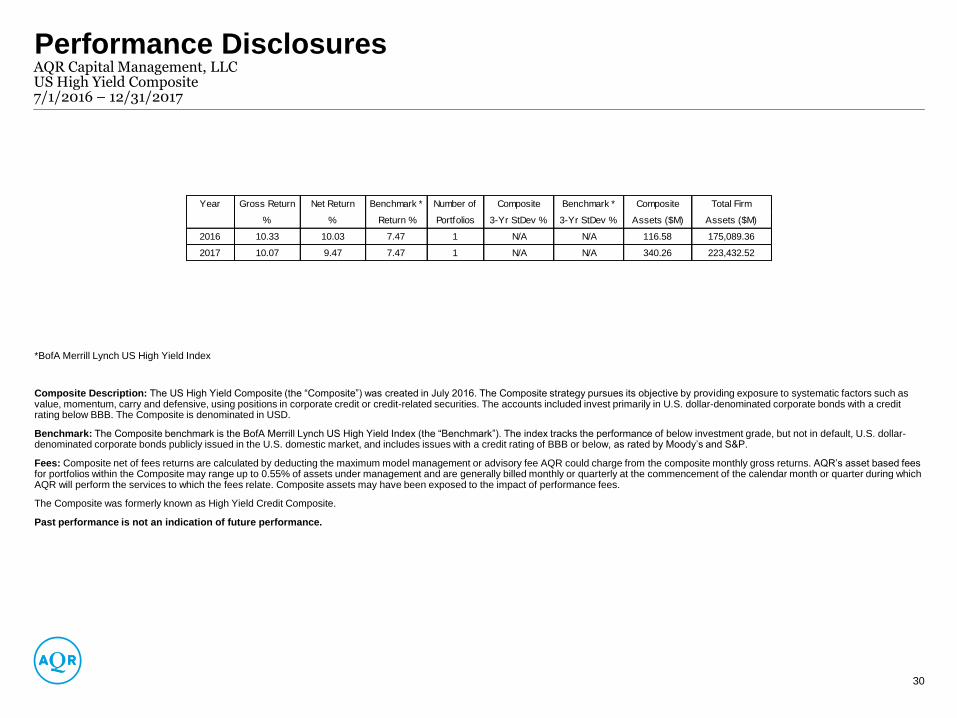
*BofA Merrill Lynch US High Yield Index
Composite Description: The US High Yield Composite (the “Composite”) was created in July 2016. The Composite strategy pursues its objective by providing exposure to systematic factors such as value, momentum, carry and defensive, using positions in corporate credit or credit-related securities. The accounts included invest primarily in U.S. dollar-denominated corporate bonds with a credit rating below BBB. The Composite is denominated in USD.
Benchmark: The Composite benchmark is the BofA Merrill Lynch US High Yield Index (the “Benchmark”). The index tracks the performance of below investment grade, but not in default, U.S. dollar-denominated corporate bonds publicly issued in the U.S. domestic market, and includes issues with a credit rating of BBB or below, as rated by Moody’s and S&P.
Fees: Composite net of fees returns are calculated by deducting the maximum model management or advisory fee AQR could charge from the composite monthly gross returns. AQR’s asset based fees for portfolios within the Composite may range up to 0.55% of assets under management and are generally billed monthly or quarterly at the commencement of the calendar month or quarter during which AQR will perform the services to which the fees relate. Composite assets may have been exposed to the impact of performance fees.
The Composite was formerly known as High Yield Credit Composite.
Past performance is not an indication of future performance.
Year Gross Return Net Return Benchmark * Number of Composite Benchmark * Composite Total Firm
% % Return % Portfolios 3-Yr StDev % 3-Yr StDev % Assets ($M) Assets ($M)
2016 10.33 10.03 7.47 1 N/A N/A 116.58 175,089.36
2017 10.07 9.47 7.47 1 N/A N/A 340.26 223,432.52