Embed Size (px)
Citation preview
1
Big Data in the Utilities Industry
Timotej Gavrilovic, Colin Kerrigan Demand Side Analytics, Customer Energy Solutions May 2015
[email protected] [email protected]
Current status and future outlook
2
Agenda
Overview of Demand Side Analytics at PG&E
Analytics Development is an Ongoing Process
Examples of DSA work
3
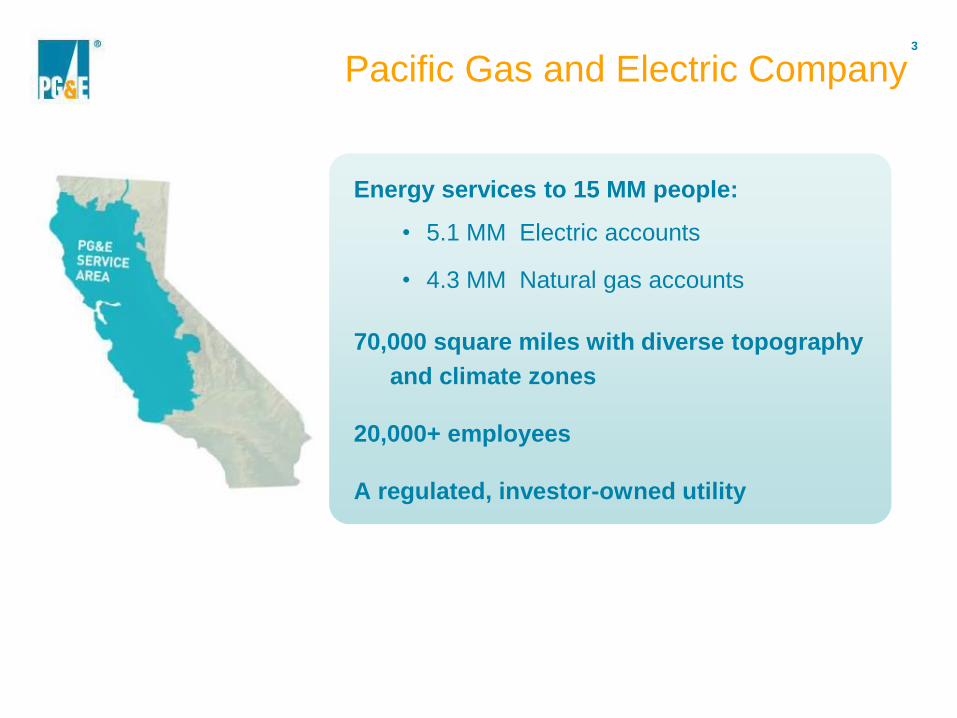
Energy services to 15 MM people:
• 5.1 MM Electric accounts
• 4.3 MM Natural gas accounts
70,000 square miles with diverse topography
and climate zones
20,000+ employees
A regulated, investor-owned utility
Pacific Gas and Electric Company
4
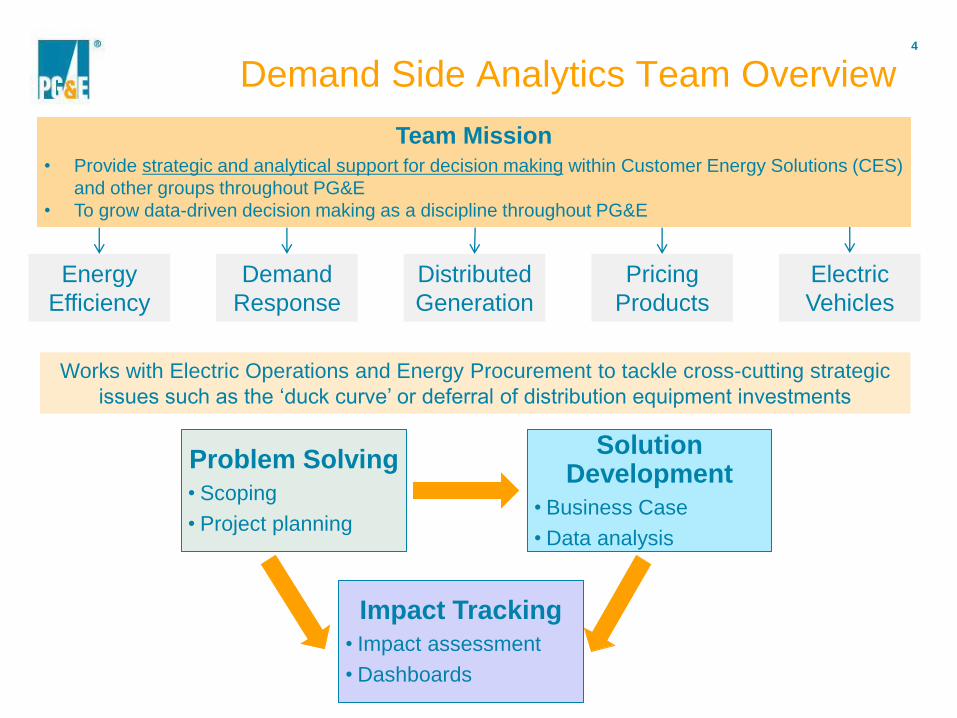
Demand Side Analytics Team Overview
Energy
Efficiency
Demand
Response
Distributed
Generation
Pricing
Products
Electric
Vehicles
Works with Electric Operations and Energy Procurement to tackle cross-cutting strategic
issues such as the ‘duck curve’ or deferral of distribution equipment investments
Team Mission
• Provide strategic and analytical support for decision making within Customer Energy Solutions (CES)
and other groups throughout PG&E
• To grow data-driven decision making as a discipline throughout PG&E
Problem Solving
• Scoping
• Project planning
Solution Development
• Business Case
• Data analysis
Impact Tracking
• Impact assessment
• Dashboards
5
Agenda
Overview of Demand Side Analytics at PG&E
Analytics Development is an Ongoing Process
Examples of DSA work
6
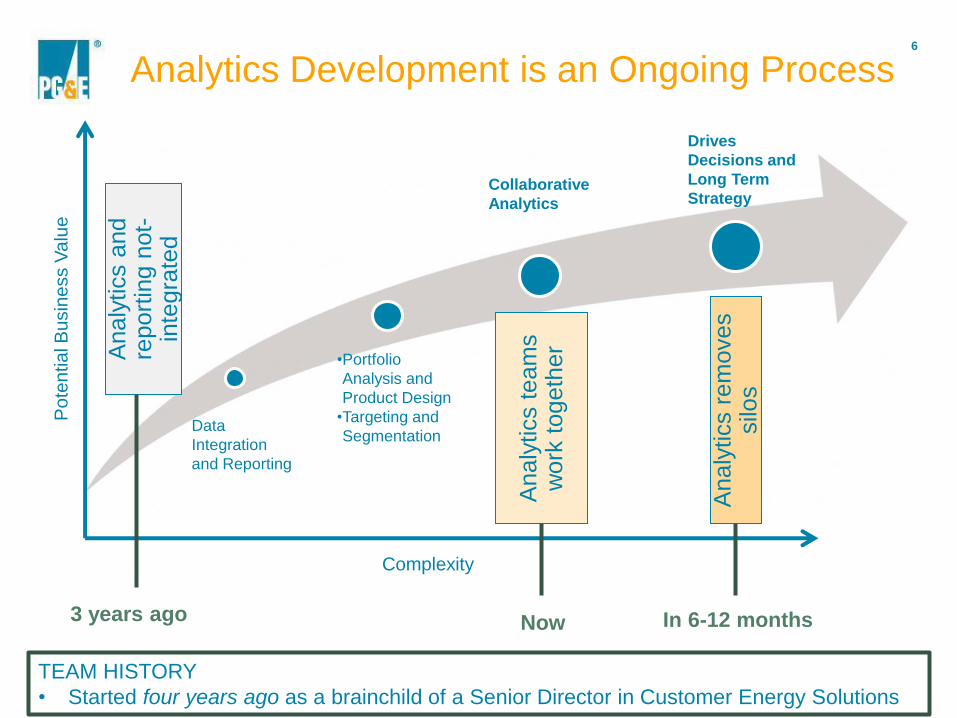
Analytics Development is an Ongoing Process
Complexity
Po
ten
tia
l B
usin
ess V
alu
e
Data
Integration
and Reporting
•Portfolio
Analysis and
Product Design
•Targeting and
Segmentation
Collaborative
Analytics
Drives
Decisions and
Long Term
Strategy
Analy
tics a
nd
report
ing n
ot-
inte
gra
ted
Analy
tics t
eam
s
work
togeth
er
Analy
tics r
em
oves
silo
s
3 years ago Now In 6-12 months
TEAM HISTORY
• Started four years ago as a brainchild of a Senior Director in Customer Energy Solutions
7
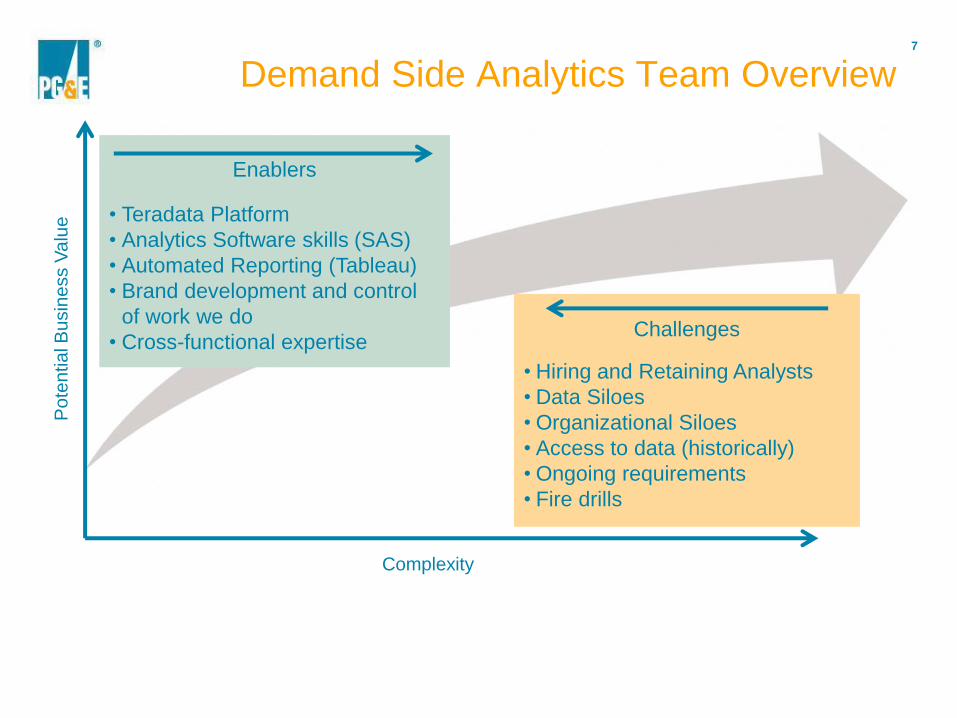
Demand Side Analytics Team Overview
Enablers
• Teradata Platform
• Analytics Software skills (SAS)
• Automated Reporting (Tableau)
• Brand development and control
of work we do
• Cross-functional expertise
Challenges
• Hiring and Retaining Analysts
• Data Siloes
• Organizational Siloes
• Access to data (historically)
• Ongoing requirements
• Fire drills
Complexity
Po
ten
tia
l B
usin
ess V
alu
e
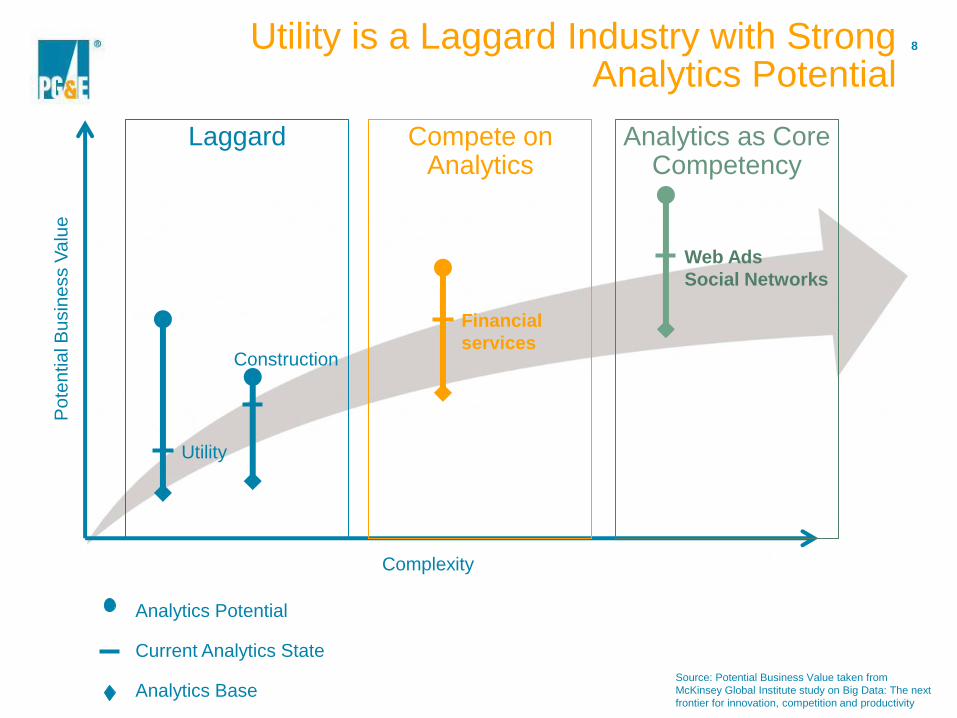
8 Utility is a Laggard Industry with Strong Analytics Potential
Complexity
Po
ten
tia
l B
usin
ess V
alu
e
Laggard Analytics as Core Competency
Compete on Analytics
Analytics Potential
Current Analytics State
Analytics Base
Utility
Construction
Financial
services
Web Ads
Social Networks
Source: Potential Business Value taken from
McKinsey Global Institute study on Big Data: The next
frontier for innovation, competition and productivity
9
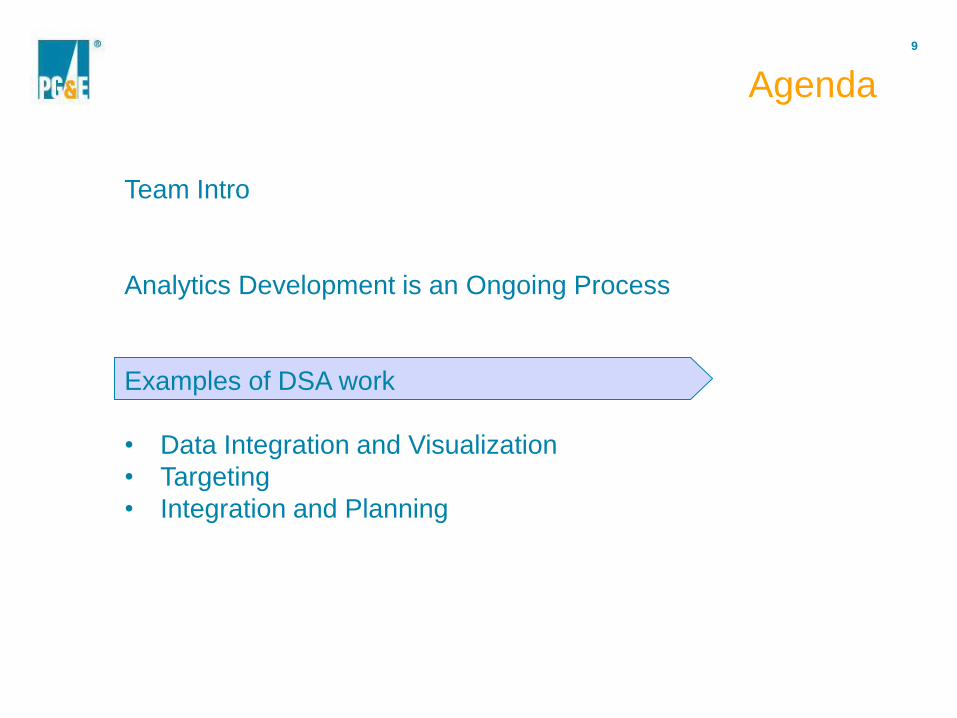
Agenda
Team Intro
Analytics Development is an Ongoing Process
Examples of DSA work
• Data Integration and Visualization
• Targeting
• Integration and Planning
10
Data Integration and Visualization
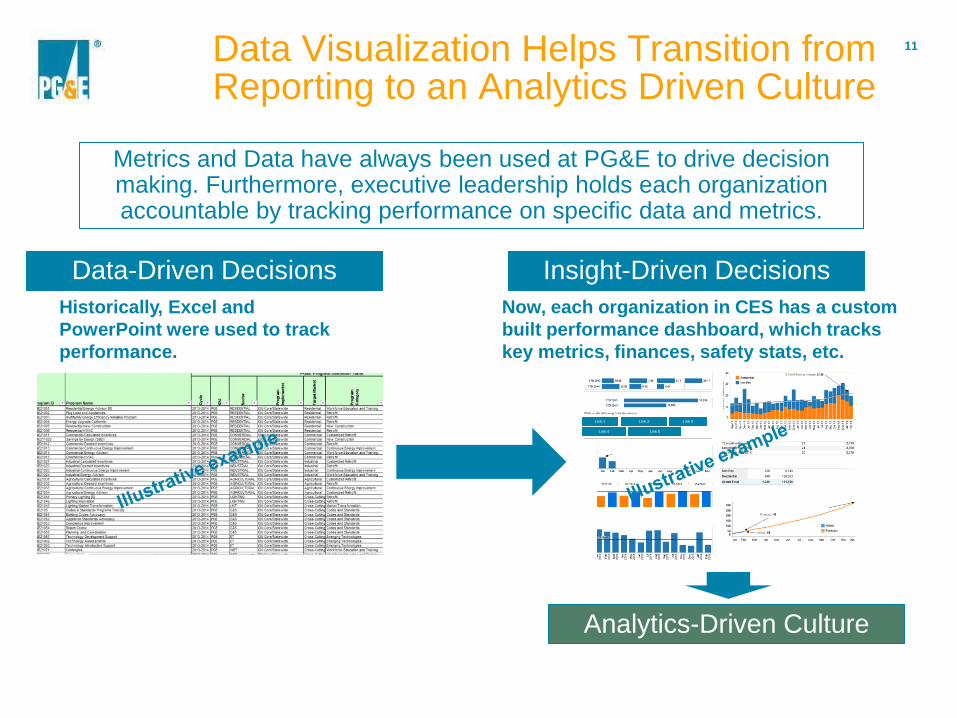
11 Data Visualization Helps Transition from Reporting to an Analytics Driven Culture
Metrics and Data have always been used at PG&E to drive decision making. Furthermore, executive leadership holds each organization accountable by tracking performance on specific data and metrics.
Historically, Excel and
PowerPoint were used to track
performance.
Link 1 Link 2
Link 5
Link 3
Link 4
Data-Driven Decisions Insight-Driven Decisions
Analytics-Driven Culture
Now, each organization in CES has a custom
built performance dashboard, which tracks
key metrics, finances, safety stats, etc.
12
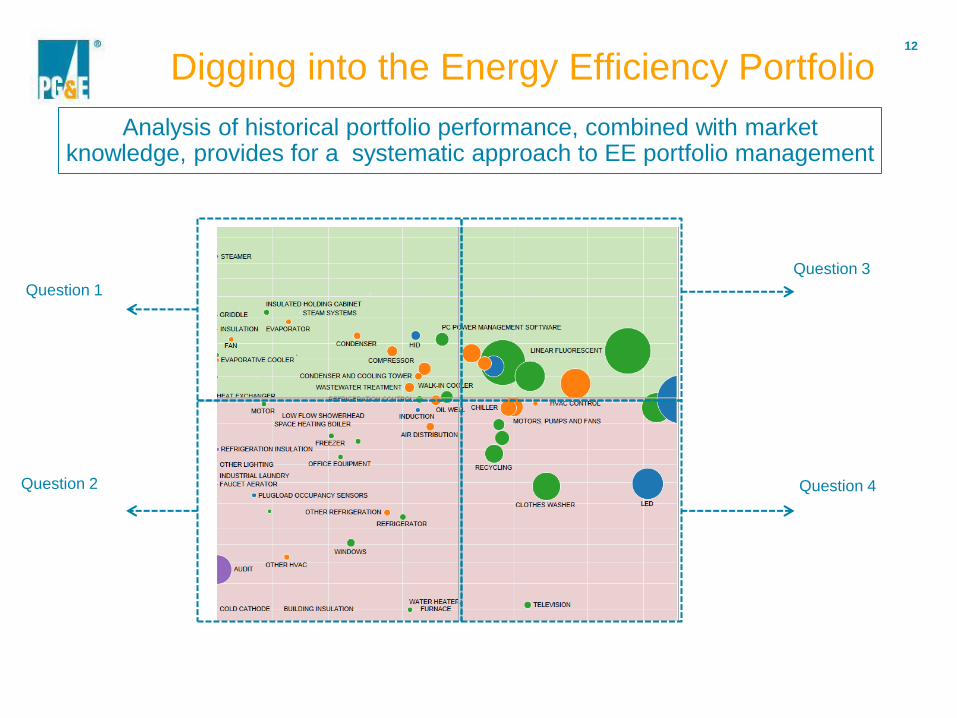
Digging into the Energy Efficiency Portfolio
Analysis of historical portfolio performance, combined with market knowledge, provides for a systematic approach to EE portfolio management
Question 1
Question 2 Question 4
Question 3
13
Targeting
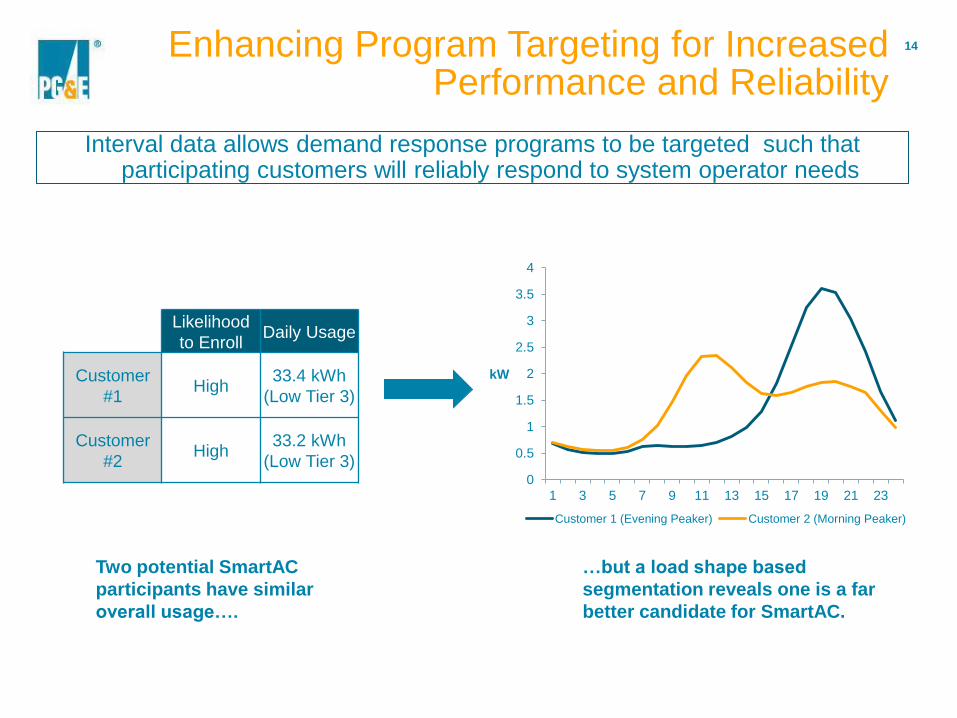
14
Interval data allows demand response programs to be targeted such that participating customers will reliably respond to system operator needs
Likelihood
to Enroll Daily Usage
Customer
#1 High
33.4 kWh
(Low Tier 3)
Customer
#2 High
33.2 kWh
(Low Tier 3) 0
0.5
1
1.5
2
2.5
3
3.5
4
1 3 5 7 9 11 13 15 17 19 21 23
kW
Customer 1 (Evening Peaker) Customer 2 (Morning Peaker)
Two potential SmartAC
participants have similar
overall usage….
…but a load shape based
segmentation reveals one is a far
better candidate for SmartAC.
Enhancing Program Targeting for Increased Performance and Reliability
15
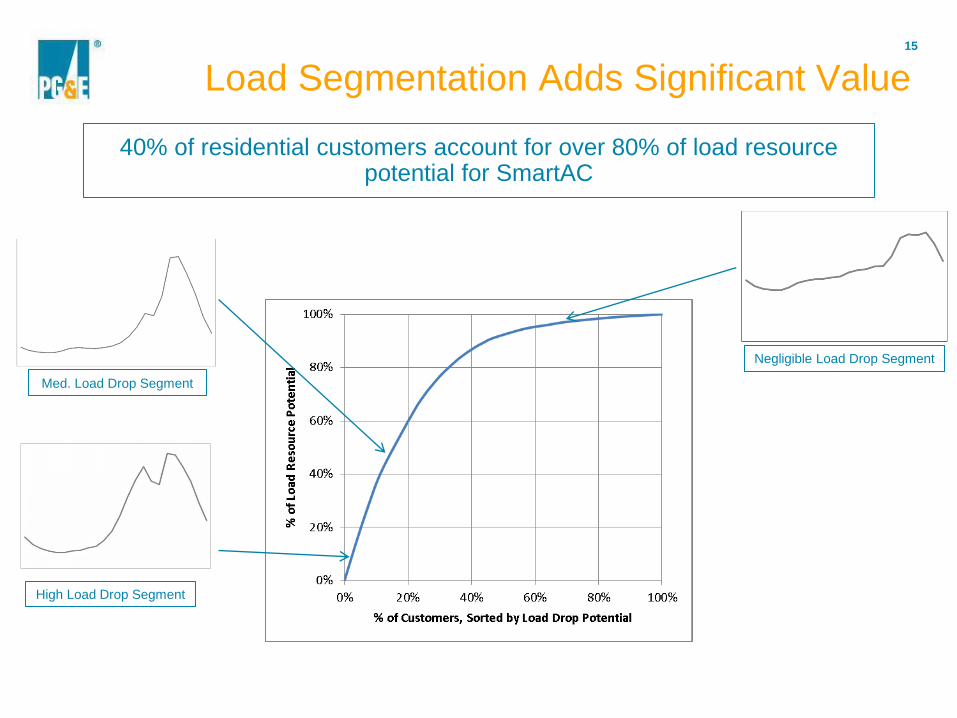
Load Segmentation Adds Significant Value
40% of residential customers account for over 80% of load resource potential for SmartAC
High Load Drop Segment
Med. Load Drop Segment
Negligible Load Drop Segment
16
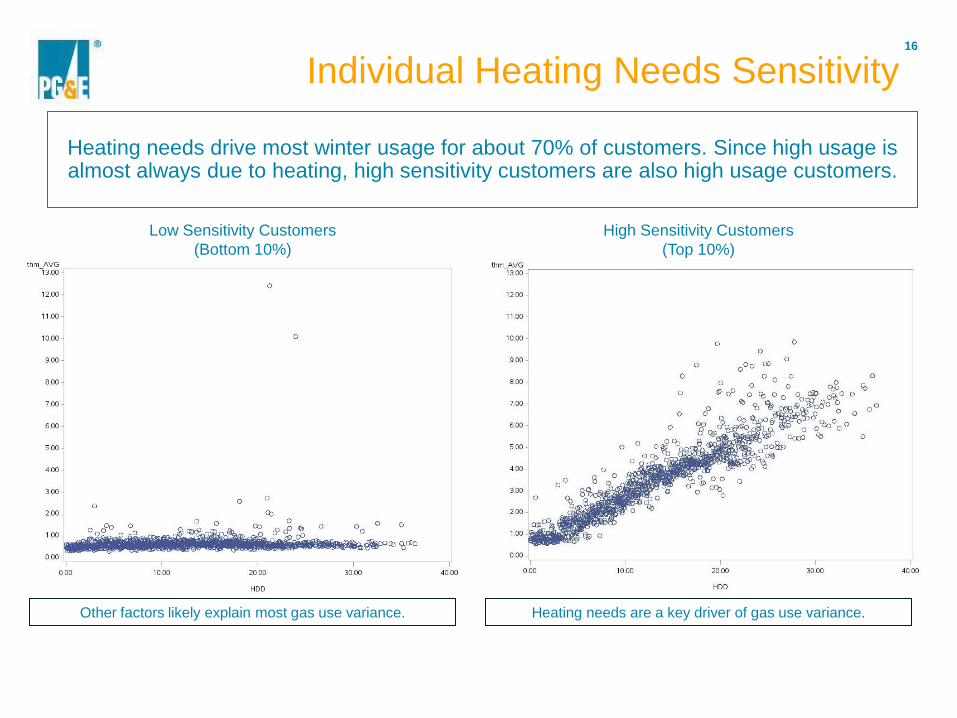
Individual Heating Needs Sensitivity
Heating needs drive most winter usage for about 70% of customers. Since high usage is almost always due to heating, high sensitivity customers are also high usage customers.
Low Sensitivity Customers
(Bottom 10%)
High Sensitivity Customers
(Top 10%)
Other factors likely explain most gas use variance. Heating needs are a key driver of gas use variance.
18
Integration and Planning
19
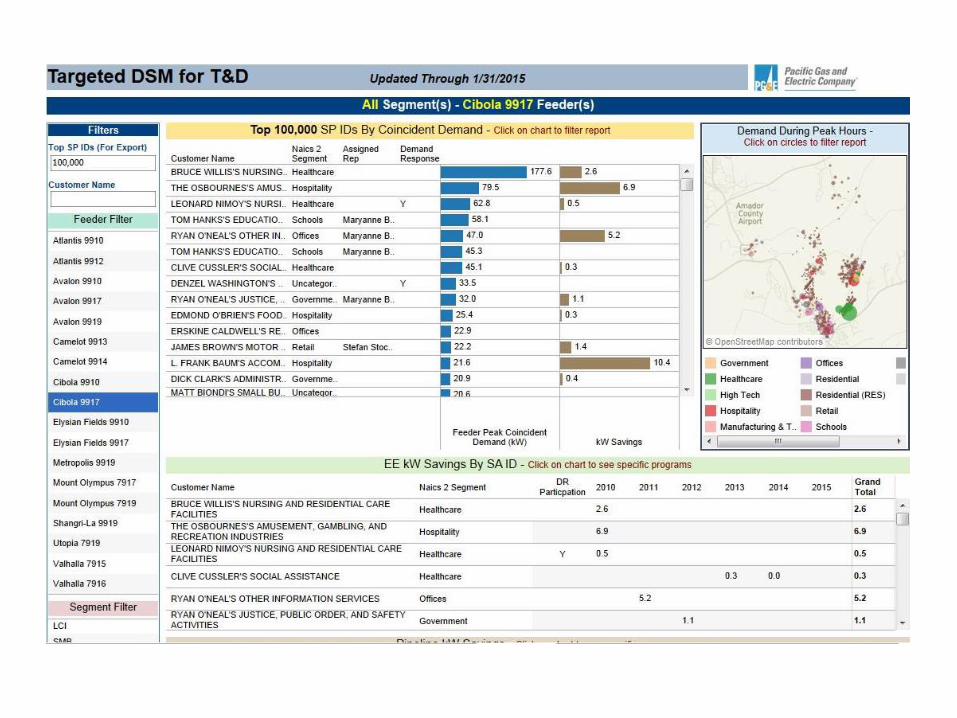
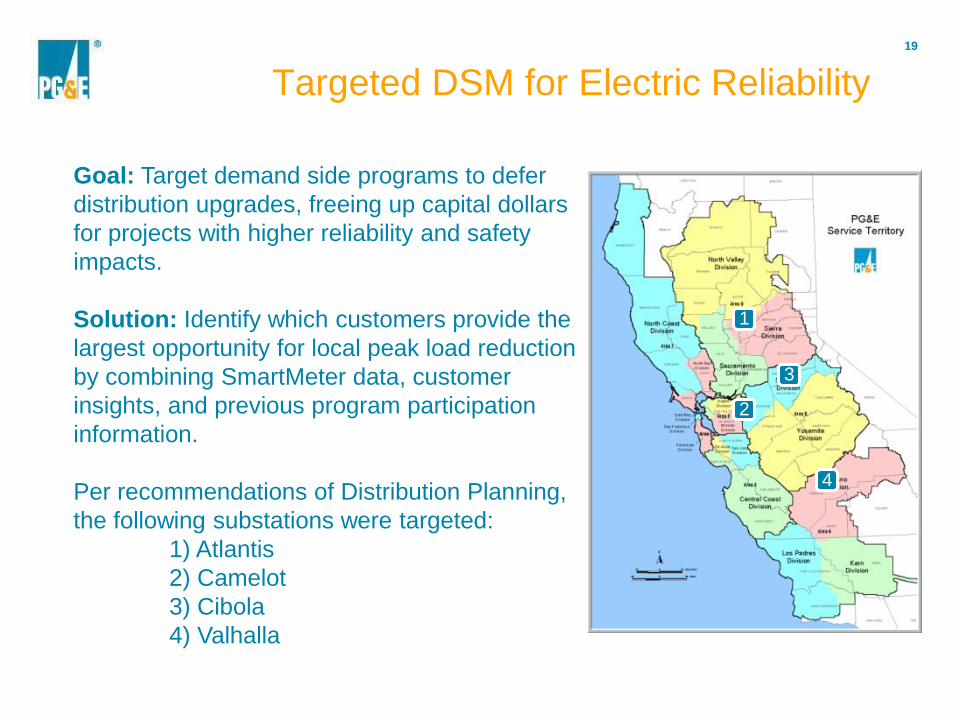
Targeted DSM for Electric Reliability
Goal: Target demand side programs to defer
distribution upgrades, freeing up capital dollars
for projects with higher reliability and safety
impacts.
Solution: Identify which customers provide the
largest opportunity for local peak load reduction
by combining SmartMeter data, customer
insights, and previous program participation
information.
Per recommendations of Distribution Planning,
the following substations were targeted:
1) Atlantis
2) Camelot
3) Cibola
4) Valhalla
2
3
1
4
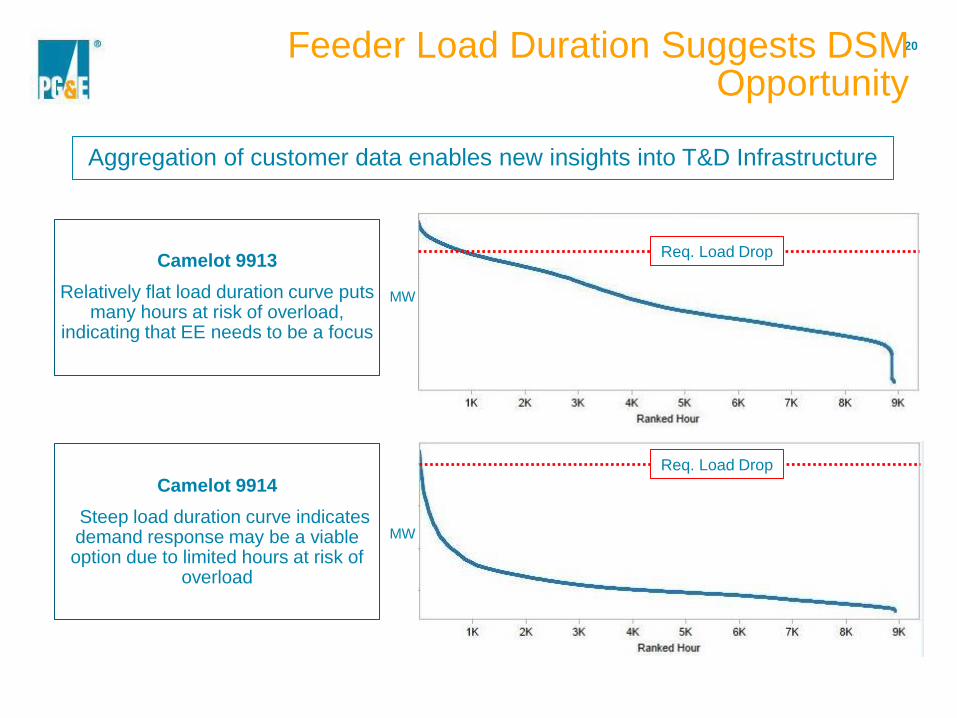
20 Feeder Load Duration Suggests DSM Opportunity
Req. Load Drop
MW
Camelot 9914
Steep load duration curve indicates demand response may be a viable option due to limited hours at risk of
overload
Req. Load Drop
MW
Camelot 9913
Relatively flat load duration curve puts many hours at risk of overload,
indicating that EE needs to be a focus
Aggregation of customer data enables new insights into T&D Infrastructure