Embed Size (px)
Citation preview
Big West of California, LLCBakersfield Refinery
REFINING 101
July 2008

Outline
Where Does The Crude Oil Come From? Crude Oil Basics Refining Concepts Flowcharts of Petroleum Refineries Basic Refinery Operations and Optimization Conversion Refinery Overview

Where does the Crude Oil Come From?• Kern County produces about
550,000 barrels of crude oil per day, 68% of the state’s total production; enough to fuel about 5 ½ million automobiles.
• Three of the six largest oil fields in the U.S. are located in Kern County
• Kern County represents approximately 10% of the Nation’s total oil production.
Source: Greater Bakersfield Chamber of Commerce

What is Crude Oil?• Crude oil is a mixture of
hydrocarbons formed from organic matter.
• Crude varies significantly in color and composition
• Composition varies– Sulfur content– Density varies– Contains sediment and
water
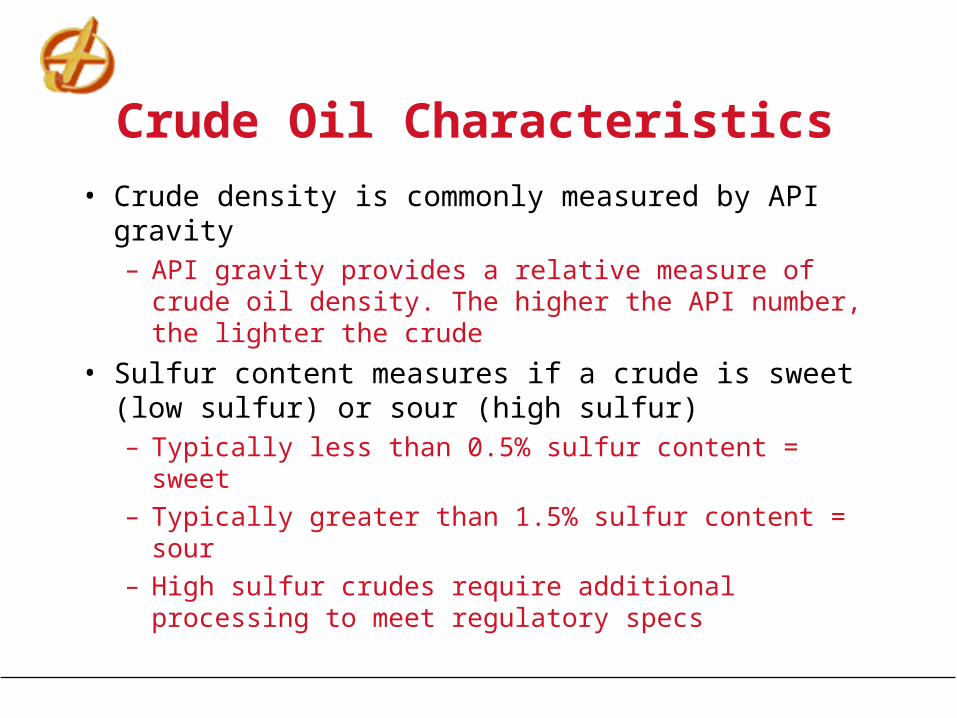
Crude Oil Characteristics
• Crude density is commonly measured by API gravity– API gravity provides a relative measure of crude oil
density. The higher the API number, the lighter the crude
• Sulfur content measures if a crude is sweet (low sulfur) or sour (high sulfur)– Typically less than 0.5% sulfur content = sweet
– Typically greater than 1.5% sulfur content = sour
– High sulfur crudes require additional processing to meet regulatory specs

Crude Types Versus Demand
Gasoline Gasoline Gasoline5 - 15 %
20 - 30 % 40 - 45%Distillate20 - 25%
Distillate Distillate
25 - 35% Heavy Fuel 30 - 35%Oil Heavy Fuel
60 - 75% OilHeavy Fuel ~10%
Oil35 - 55% Asphalt ~5%
Other ~5 -10%Light Crude Heavy Crude Example
Product Product Product Composition Composition Demand
Naturally occuring hydrocarbon molecules do not meet customer needs.
The refining processes must adjust the molecules, reshape them and remove contaminants to ensure they meet requirements for: - end use performance - environmental performance

Supply and DemandCalifornia
• CA now consumes 44 to 45 million gallons of gasoline and 10 million gallons of diesel fuel per day.
• Demand for transportation fuels increased nearly 50% in last 20 years
• Number of refineries producing gasoline in California dropped from 32 in mid-1980s to 14 today
• California now imports 3.5 million gallons of gasoline per day.
Source: California Energy Commission

Basic Refining ConceptsCrude Separation

Basic Refining Concepts

Basic Flowchart of Petroleum Refinery (1915)
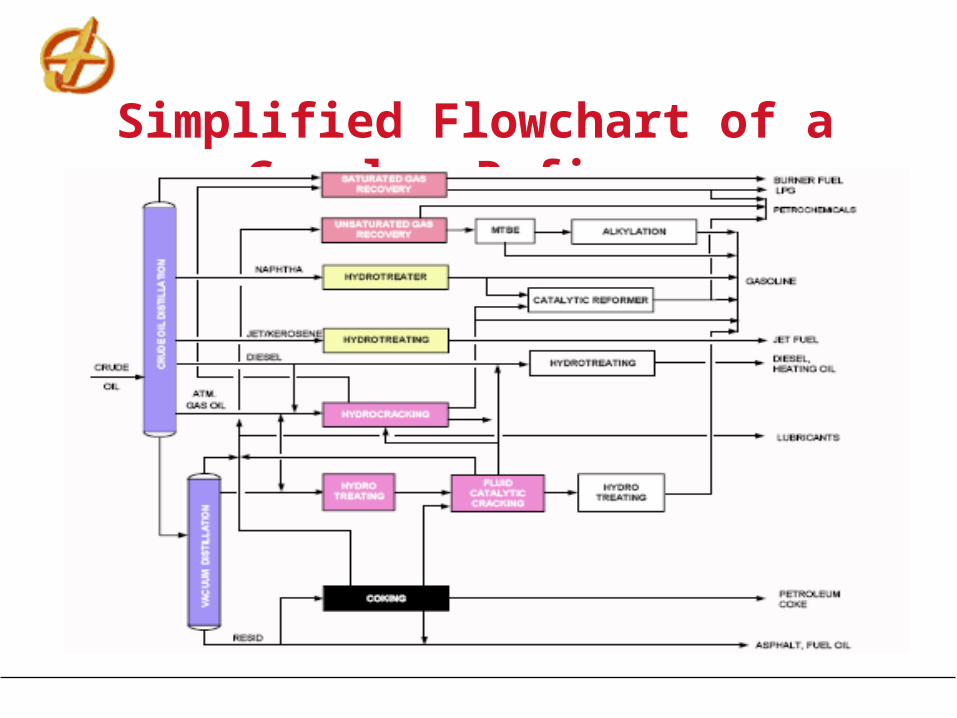
Simplified Flowchart of a Complex Refinery

Basic Refinery Operations• Separation – Distillation• Conversion – Changing the size or shape of molecules
– Re-shape molecules to improve product quality Catalytic Reforming Unit
– Upgrading – breaking large molecules into smaller Coking Hydrocraking
• Treatment / Blending – Making on specification products– Removal of impurities – desalting, desulfurization,
denitrofication– Mixtures of components to meet specifications
Refinery Optimization• Two areas can not be compromised
– Safety– Reliability
• Ecomonic optimization is a series of trade-offs– Feedstocks
Availability (crude, Intermediate products), Yields, Cost Refinery Complexity, Flexibility + Constraints
– Crude rate Maximize to spread fixed costs
– Products Meet market demands Value added and margins
– Operations Maximize yields, minimize giveaway / inventories Optimize energy use

Conversion

REFINERY OVERVIEW
Distillation Cracking Treating Reforming(Separation) (Changing Size) (Changing Shape)
LPGRaw Fuel gasLPG C4
I-C4
Naptha Gasoline
Diesel Diesel
Gas GasOil Oil
Resid. Coke
Coker
MHCU
HCU
HDS
CRU

Utilities
For More Information
www.bigwestca.com
www.energy.gov
www.energy.ca.gov
www.pipeline101.com
www.wspa.org

Thank you