Embed Size (px)
Citation preview

Bijay Lal Pradhan

Measurement and Scaling
Bijay Lal Pradhan, M Sc Statistics, FDPM (IIMA) 2
1) Definition of measurement and scale
2) Type of Physical scale
i. Nominal Scale iii. Interval scale
ii. Ordinal Scale iv. Ratio Scale
3) Need of scaling
4) Criteria of good scaling
5) Validity and Reliability of scale and its test
6) Percentile and ranking scale

Measurement and Scaling Measurement means assigning numbers or other symbols
to characteristics of objects according to certain prespecified rules.
One-to-one correspondence between the numbers and the characteristics being measured.
The rules for assigning numbers should be standardized and applied uniformly.
Rules must not change over objects or time.

Measurement and Scaling Scaling involves creating a continuum upon which
measured objects are located.
Consider an attitude scale from 1 to 100. Each respondent is assigned a number from 1 to 100, with 1 = Extremely Unfavorable, and 100 = Extremely Favorable. Measurement is the actual assignment of a number from 1 to 100 to each respondent. Scaling is the process of placing the respondents on a continuum with respect to their attitude toward department stores.

Types of Scales Nominal - Identification only
Ex (players numbers, male=1 female=0)
Ordinal -Ranking
Ex (grades?) SEI score
Interval –Ranks and distinguishes intervals
Ex (temperature)
Ratio – absolute quantities
Ex (weight, degrees Kelvin)

Physical Measurement Scale Nominal Numbers Assigned to Runners Ordinal Rank Order of Winners Interval Performance Rating on a 0 to 10 Scale Ratio Time to Finish, in Seconds
7 3 8
Third place
Second place
First place
Finish
8.2 9.1 9.6
15.2 14.1 13.4

Nominal

Nominal Scale The numbers serve only as labels or tags for identifying and
classifying objects.
When used for identification, there is a strict one-to-one correspondence between the numbers and the objects.
The numbers do not reflect the amount of the characteristic possessed by the objects.
The only permissible operation on the numbers in a nominal scale is counting.
Only a limited number of statistics, all of which are based on frequency counts, are permissible, e.g., percentages, and mode.

Ordinal?

Ordinal Scale A ranking scale in which numbers are assigned to objects
to indicate the relative extent to which the objects possess some characteristic.
Can determine whether an object has more or less of a characteristic than some other object, but not how much more or less.
Any series of numbers can be assigned that preserves the ordered relationships between the objects.
In addition to the counting operation allowable for nominal scale data, ordinal scales permit the use of statistics based on centiles, e.g., percentile, quartile, median.

Interval

Interval Scale Numerically equal distances on the scale represent equal values in the characteristic being measured.
It permits comparison of the differences between objects.
The location of the zero point is not fixed. Both the zero point and the units of measurement are arbitrary.
Any positive linear transformation of the form y = a + bx will preserve the properties of the scale.
It is meaningful to take ratios of scale values.
Statistical techniques that may be used include all of those that can be applied to nominal and ordinal data, and in addition the arithmetic mean, standard deviation, and other statistics commonly used.

Ratio Ratio

Ratio Scale Possesses all the properties of the nominal, ordinal, and
interval scales.
It has an absolute zero point.
It is meaningful to compute ratios of scale values.
Only proportionate transformations of the form y = bx, where b is a positive constant, are allowed.
All statistical techniques can be applied to ratio data.

Primary Scales of Measurement Scale Basic
Characteristics
Examples Examples
Nominal Numbers identify
& classify objects
Social Security
nos., numbering
of football players
Brand nos., store
types
Percentages,
mode
Chi-square,
binomial test
Ordinal Nos. indicate the
relative positions
of objects but not
the magnitude of
differences
between them
Quality rankings,
rankings of teams
in a tournament
Preference
rankings, market
position, social
class
Percentile,
median
Rank-order
correlation,
Friedman
ANOVA
Ratio Zero point is fixed,
ratios of scale
values can be
compared
Length, weight Age, sales,
income, costs
Geometric
mean, harmonic
mean
Coefficient of
variation
Permissible Statistics
Descriptive Inferential
Interval Differences
between objects
Temperature
(Fahrenheit)
Attitudes,
opinions, index
Range, mean,
standard
Product-
moment

Criteria of good measurement Reliability: Since a grocer obtain the true
measure of a commodity by a kilogram, a cloth merchant obtains true length of cloth by a meter, these measuring instruments have to be reliable. Kilogram and meter always give the same result when they used for measuring commodity. In research also the measure has to be reliable.
Bijay Lal Pradhan, M Sc Statistics, FDPM (IIMA) 16

RELIABILITY The degree to which measures are free from random error and therefore yield consistent results
Stability and consistency with which the instrument measures the concept and helps to assess the goodness of a measure.
Maintains stability over time in the measurement of a concept.
Two important dimensions of reliability: (a) stability and (b) consistency

a. Stability of Measures Ability of the measure to remain the same
over time.
It attests to the “goodness” of measure because the measure of the concept is stable, no matter when it is applied.
Two tests of stability: (1) test-retest reliability, and (2) parallel-form reliability
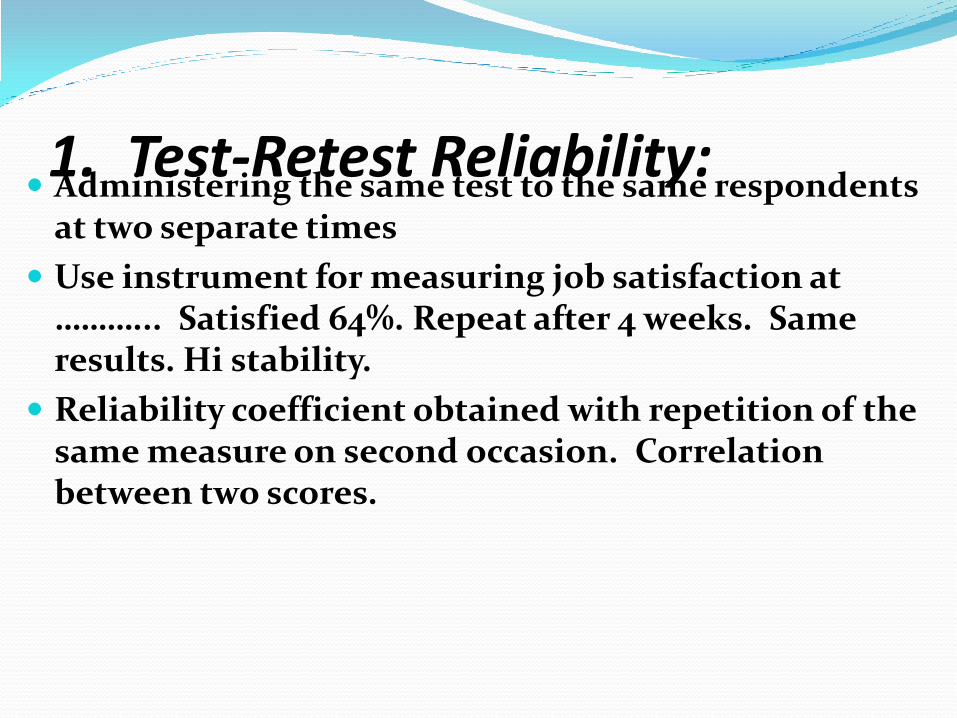
1. Test-Retest Reliability: Administering the same test to the same respondents
at two separate times
Use instrument for measuring job satisfaction at ………... Satisfied 64%. Repeat after 4 weeks. Same results. Hi stability.
Reliability coefficient obtained with repetition of the same measure on second occasion. Correlation between two scores.
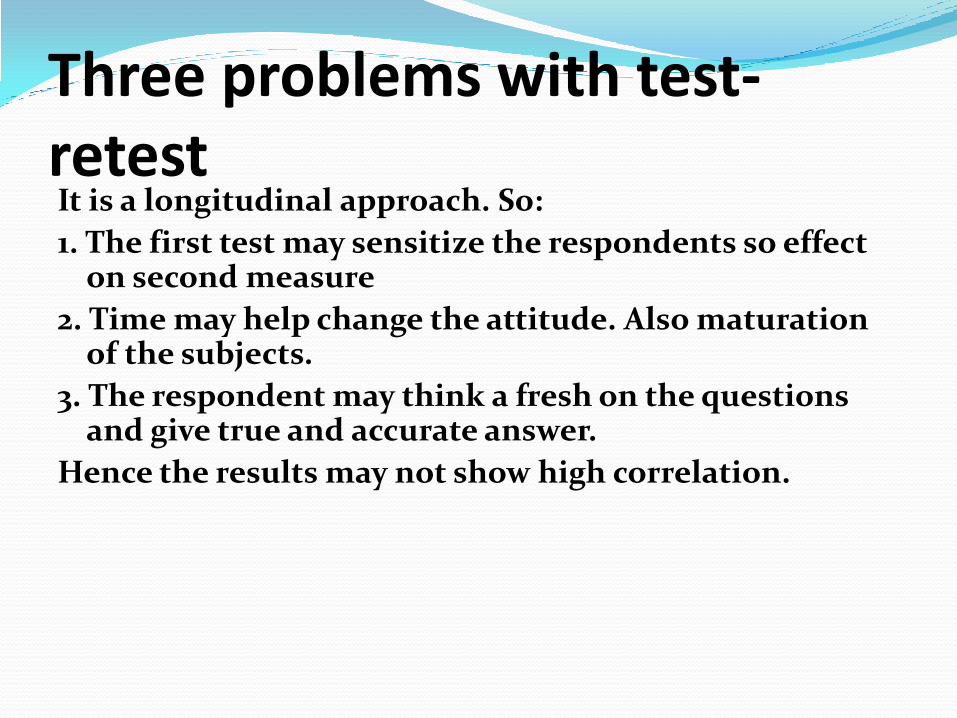
Three problems with test-retest It is a longitudinal approach. So:
1. The first test may sensitize the respondents so effect on second measure
2. Time may help change the attitude. Also maturation of the subjects.
3. The respondent may think a fresh on the questions and give true and accurate answer.
Hence the results may not show high correlation.

2. Parallel-Form Reliability Also called equivalent-form reliability.
When responses on two comparable sets of measures tapping the same construct are highly correlated.
Both forms/sets have similar items, same response format. Change the wording/ordering.
Minimum error variance caused by wording, ordering, or other factors
Parallel form reliability correlation between two form of an instrument.

b. Internal Consistency of Measures Indicative of the homogeneity of the
items in the measure.
Items should ‘hang together as a set,’
Each item be capable of independently measuring the same concept.
Examine if the items and subsets of items in the instrument are highly correlated.
Two ways to do it.

1. Inter-item Consistency Reliability (Rational Equivalence Method)
Test of consistency of respondents’ answers to all items in a measure.
To the degree that items are independent measures of the same concept, they will be correlated.

2. Split-Half Reliability Reflects the correlation between two
halves of an instrument.
One half could be of even numbered items and other half of odd numbered items.
High correlation tells us about similarity among items

Validity The ability of an instrument to measure
what is intended to be measured.
Validity of the indicator Is it a true measure? Are we tapping the concept?
Degree of fit between a construct and its indicators.
Bijay Lal Pradhan, M Sc Statistics, FDPM (IIMA) 25

Researchers ask questions: Do colleagues agree with my
measurement?
Does my measure correlate with others’ measures of the same concept?
Does it really measure what is expected to measure?
The answers provide some evidence of the measure’s validity.

Validity If you wish to find out about age, income, height or weight
The effectiveness of a program, service provided by organization
Tengible concept like effectiveness, attitude or satisfaction etc
Need to ask several questions in order to cover different aspect of concept
Bijay Lal Pradhan, M Sc Statistics, FDPM (IIMA) 27

Types of Validity
1. Content validity
2. Criterion-related validity
3. Construct validity

1. Content Validity: Each question or item on the scale must have a
logical link with an objective
Each item and question must cover the full range of the issue or attitude being measured.

Content Validity Items that are supposed to measure a concept, do on
the face look like they measure the concept. For example:
Measure a college student’s math ability ask: 2+2=? Not a valid measure of college level math ability.
Subjective agreement among professionals about the measuring content.

Content Validity Problems:
The judgment is based upon subjective logic, hence, no definite conclusion can be drawn. Different people may have different opinion.
The validity or its extent may vary with the questions selected for an instrument.
Bijay Lal Pradhan, M Sc Statistics, FDPM (IIMA) 31

2. Criterion-Related Validity
Uses some standard or criterion to indicate a construct accurately.
Compare the measure with another accepted measure of the same construct.

3. Construct Validity Used for measures with multiple indicators.
Do various indicators operate in consistent manner?
How well the results obtained from the use of the measure fit the theories around which the test is designed? This is assessed through (a)
convergent and (b) discriminant validity.

a. Convergent Validity Multiple indicators of a concept
converge or are associated with one another.
Multiple indicators hang together, or operate in similar ways. For example, we measure “education” as a construct.

Construct “education” Ask the level of education completed.
Verify the certificates.
Give a test measuring school level knowledge.
If the measures do not converge i.e. People claiming college degree but not supported by college records, or those with college degree perform no better than hi school drop-out on the test.
The outcome of each does not converge. Weak convergent validity. Do not combine the three indicators into one measure.

b. Discriminant Validity Divergent validity.
Indicators of one concept hang together or converge, but also diverge or are negatively associated with opposing constructs.
If two constructs A and B are very different then measures of A and B should not be associated.
Example of political conservatism.

Measuring political conservatism We have 10 questions to measure P C.
People answer all 10 in similar ways.
We put 5 additional questions that measure liberalism.
Two scores are theoretically predicted to be different and are empirically found to be so.
If the 10 conservatism items hang together and are negatively associated with 5 liberalism ones.
It has discriminant validity

Reliability and Validity on Target

Difficulties of Scaling 1. Social phenomenon is complex and
cannot easily measured quantitatively. The main problem is comes in defining a phenomenon.
2. There are no universally accepted measures of values.
3. Since attitude of persons often differ, A scale prepared for a particular group is not often suitable for another.
39

Difficulties of Scaling 4. Most of the social phenomenon is intangible in
nature which cause difficulty in measuring validity of the scale.
5. It is not possible to measure the magnitude of various variables influencing the social phenomenon without the knowledge of these causative factors, the scaling becomes only a guesswork.
40

Measuring attitude (example) Attitude of student towards a Lecturer
Organization of materials
Lecturer’s ability to communicate material
The presentation style
Knowledge of the subject
Responsiveness
Punctuality
Bijay Lal Pradhan, M Sc Statistics, FDPM (IIMA) 41

Difficulties in Attitudinal Scale Which aspects of a situation or issue should be
included when seeking to measure an attitude?
What procedure should be adopted for combining the different aspects to obtain an overall picture?
How can one ensure that a scale really is measuring what it is supposed to measure?
Bijay Lal Pradhan, M Sc Statistics, FDPM (IIMA) 42

Likert Scale Self- report technique for attitude measurement in
which the subjects are asked their degree of agreement and disagreement with each of statements.
The summing score is the total attitude score, is the Likert scale.
Example
Most people can be trusted.
Strongly agree5_ Agree4_ Undecided3_ Disagree2_ Strongly disagree1
Any body select 1 to 5
Bijay Lal Pradhan, M Sc Statistics, FDPM (IIMA) 43

Likert Scale Take other similar items- to find out general
attitude of indication
Add the total score- the top 25% - the most favourable attitude and bottom 25%- the least favourable attitude toward the topic being studied;
Assumption – Each statement on the scale has equal attitudinal value, importance
Bijay Lal Pradhan, M Sc Statistics, FDPM (IIMA) 44

Likert Scale example The Lecturer Strongly
Agree Agree Uncertain Disagree Strongly
Disagree
1. Knows subject well
2. Is unenthusiastic about teaching
3. Shows concern for students
4. Makes unreasonable demands
5. Has poor communication skills
6. Knows how to teach
7. Can explain difficult concepts in simple terms
8. Is hard to approach
9. Is liked by some students and not by others
10. It is difficult to get along with
Bijay Lal Pradhan, M Sc Statistics, FDPM (IIMA) 45

Procedure Assemble or construct statements that are reflective of attitude
towards the main issue in question. Statements should be worded to reflect both positive and negative attitudes towards issue. The statements must have logical link with the main issue.
Administer the statements to a small group of people.
Analyse the responses by assigning a weighting – a numerical value – to the responses. Numerical value are assigned differently to positive and negative statements.
Calculate each respondent’s attitudinal score by adding numerical values assigned in step 3 to the responses s/he gave to each statement.
Bijay Lal Pradhan, M Sc Statistics, FDPM (IIMA) 46

Procedure (cont.) Compare all respondents’ score for each item to identify
non-discriminative items. Non discriminative statements do not help to distinguish respondents with respect to attitude as almost everyone responds to them in the same way.
Eliminate non discriminative items.
Construct a questionnaire schedule comprising the selected statements/items.
Bijay Lal Pradhan, M Sc Statistics, FDPM (IIMA) 47

Calculating Likert Scale The Lecturer Strongly Agree
Agree Uncertain Disagree Strongly Disagree
1. Knows subject well +
2. Is unenthusiastic about teaching -
3. Shows concern for students +
4. Makes unreasonable demands -
5. Has poor communication skills -
6. Knows how to teach +
7. Can explain difficult concepts in simple terms +
8. Is hard to approach -
9. Is liked by some students and not by others +
10. It is difficult to get along with -
Bijay Lal Pradhan, M Sc Statistics, FDPM (IIMA) 48

Likert Statement 1 2 3 4 5 6 7 8 9 10
Respondent 5 + 5 + 3 + 5 + 5 + 4 + 5 + 3 + 2 + 5 = 4 2
Respondent 1 + 2 + 1 + 2 + 2 + 2 + 4 + 3 + 2 + 3 = 2 0
The analysis shows that overall respondent has a more positive attitude towards the lecturer than respondent .
Bijay Lal Pradhan, M Sc Statistics, FDPM (IIMA) 49

Thurstone scale The thrustone scale calculates a weight or attitudinal
value for each statements.
The weight (equivalent to median value) for each statement is calculated on the basis of rating assigned by a group of judges.
Indicating agreement or disagreement
Some items are given higher value than other items.
Bijay Lal Pradhan, M Sc Statistics, FDPM (IIMA) 50

Thurstone Scale Assemble or construct statements reflective of attitudes towards the issue in
question
Select a panel of judges who are experts in the field of attitudes being explored.
Send the statements to these judges with a request to rate each statements importance in reflecting an attitude towards the issue being studied. Ask them to rate each statement on an 11-point scale.
On the basis of the judges’ rating, calculate the median value of their rating for each item.
If the judges’ rating of any item are scattered over the scale, this indicates that even among the experts there is no agreement as to the degree to which that statement reflects an attitude towards the issue in question. Discard such statement.
From the remaining statement select items that best reflect attitudes towards various aspect of the issue.
Construct a questionnaire comprising the selected items.
Bijay Lal Pradhan, M Sc Statistics, FDPM (IIMA) 51

Thurstone scale Example,
My job is like a hobby to me. (10.1)
I am satisfied with my job for the time being. (7.2)
I am often bored with my job. (3.2)
Most of the time I have to force myself to got to work. (1.1)
Bijay Lal Pradhan, M Sc Statistics, FDPM (IIMA) 52

Guttman scale Also known as Cumulative scaling or scalogram analysis
Unlike other two scale it tend to cumulative that is if a person can not answer last items than he or she probably was not able to answer any of the items
It is most difficult to construct and therefore is rarely used but is relatively easy to administer.
Example
A) 28 7 =?
B) 8x4 = ?
C) 12+9 = ?
Bijay Lal Pradhan, M Sc Statistics, FDPM (IIMA) 53

Chapter 6 : Sampling
Bijay Lal Pradhan, M Sc Statistics, FDPM (IIMA) 54
1) Its needs, steps, population, sampling units, Sampling frame/list
2) Types of sampling (Random Sampling(RS))
i. Simple RS iv. Cluster RS
ii. Stratified RS v. Multistage RS
iii. Systematic RS
3) Types of sampling (Non Random Sampling)
i. Judgmental iii. Quota
ii. Convenient iv. Snowball
4) Size of sample, Factors affecting size and method of estimating size, testing reliability of estimation of size
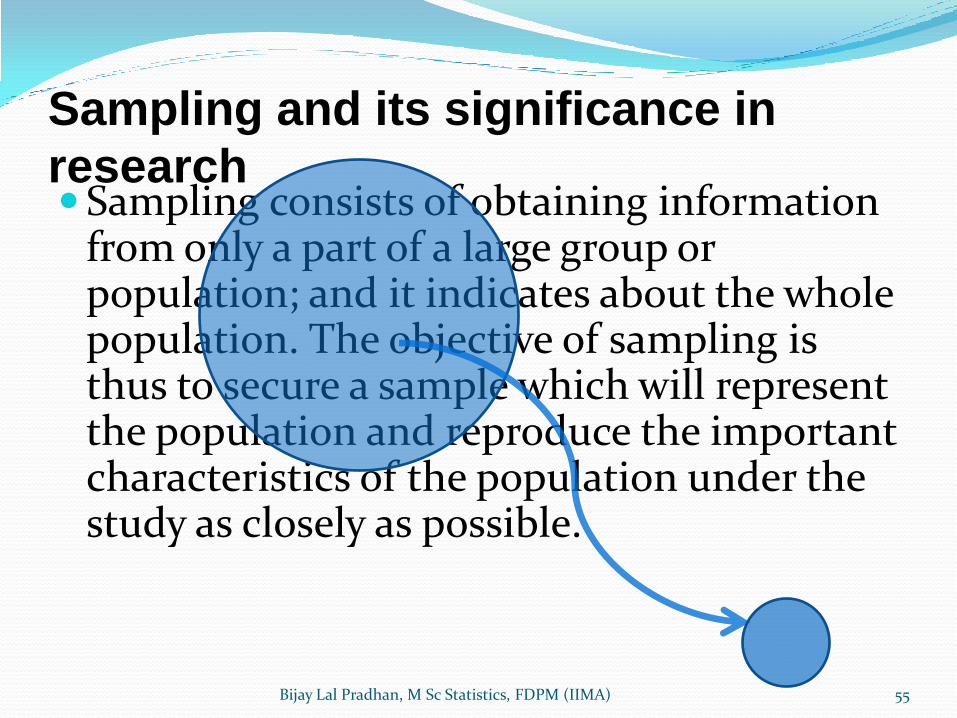
Sampling and its significance in
research Sampling consists of obtaining information
from only a part of a large group or population; and it indicates about the whole population. The objective of sampling is thus to secure a sample which will represent the population and reproduce the important characteristics of the population under the study as closely as possible.
Bijay Lal Pradhan, M Sc Statistics, FDPM (IIMA) 55

The value calculated from a defined population, such mean (µ), standard deviation (σ), standard error of mean (s.e.) is called a parameter. It is a constant value because it covers all the members of the population. A value calculated from a sample is called statistic such as mean ( ). Standard deviation (s) and proportion (P).
Bijay Lal Pradhan, M Sc Statistics, FDPM (IIMA) 56

Census Vs sampling ?? The data is the basic units in statistical analysis and
inference; is either collected by experimentation or by sampling methods. Method of collection of statistical data by complete enumeration of the population is census. If the data collected by a certain group or part of population is called sampling enquiry. The principal advantages of sampling as compared to complete enumeration of the population are:
Reduced cost
Save time and speed up
Greater scope and improved accuracy
Bijay Lal Pradhan, M Sc Statistics, FDPM (IIMA) 57

Some terminology used in sampling
a. Universe/Population:
It is the set of object under study. In a census survey, all the universe or population is studied while in a sample survey an appropriate number of units called samples is selected and studied; the generalization is made for the universe or population from which the samples are drawn.
b. Finite population:
The number of items or the units under the study is known.
c. Infinite population:
The number of units of the items is unknown.
d. Element:
Each and every unit of population or universe is called element. An element constitutes one case for analysis.
Bijay Lal Pradhan, M Sc Statistics, FDPM (IIMA) 58
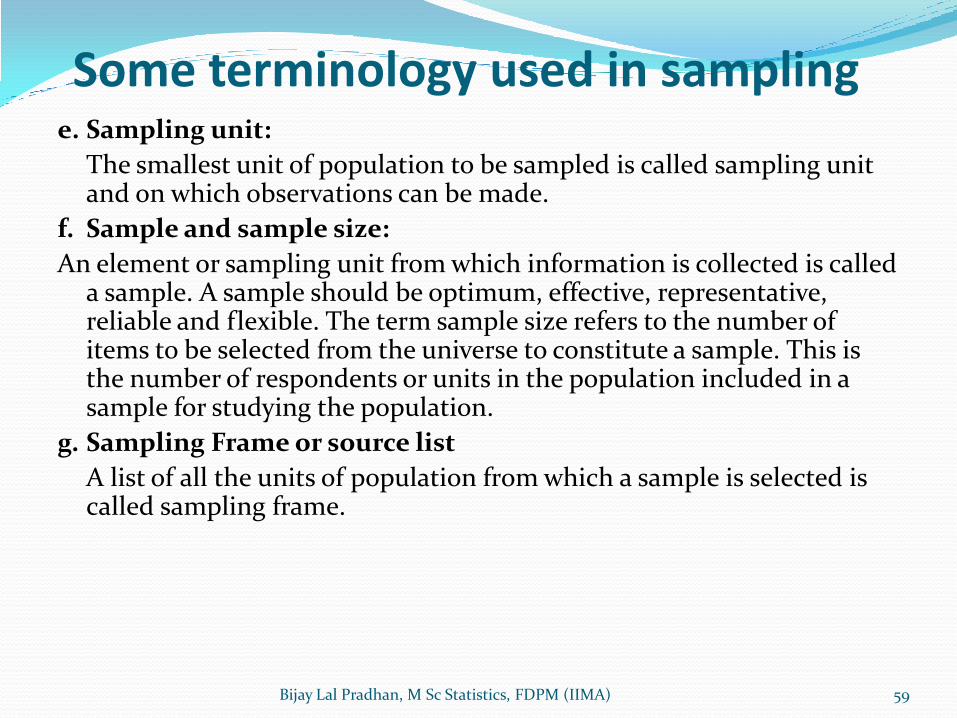
Some terminology used in sampling e. Sampling unit:
The smallest unit of population to be sampled is called sampling unit and on which observations can be made.
f. Sample and sample size:
An element or sampling unit from which information is collected is called a sample. A sample should be optimum, effective, representative, reliable and flexible. The term sample size refers to the number of items to be selected from the universe to constitute a sample. This is the number of respondents or units in the population included in a sample for studying the population.
g. Sampling Frame or source list
A list of all the units of population from which a sample is selected is called sampling frame.
Bijay Lal Pradhan, M Sc Statistics, FDPM (IIMA) 59

Some terminology used in sampling h. Parameter
A coefficient or value for the population that corresponds to particular statistic from a sample is called parameter. A parameter is characteristic of population. For instance, mean, standard deviation, etc.
i. Statistic
It is characteristics of a sample and is hence computed from the actual data.
j. Respondent
A sampling unit from which information is collected is called respondent.
k. Non- respondent
Those respondents who were included in the sample but failed to respond because they refused, could not reach, or some other responses.
Bijay Lal Pradhan, M Sc Statistics, FDPM (IIMA) 60

Bijay Lal Pradhan, M Sc Statistics, FDPM (IIMA) 61
Define Population
Specify the Sampling frame
Specify the sampling unit
Selection of sampling method
Determine the sample size
Specify the sampling plan
Select the sample
Th
e s
am
pli
ng
me
tho
d

Types of Sampling Random sampling
1. Simple random sampling
a. Lottery method
b. Use of random number
2. Stratified sampling
3. Cluster sampling
4. Systematic sampling
5. Multistage sampling
Bijay Lal Pradhan, M Sc Statistics, FDPM (IIMA) 62
Non Random sampling
1. Judgmental sampling
2. Convenient sampling
3. Quota sampling
4. Snow ball sampling
5. Purposive sampling

Calculating the minimum sample size
Based on
How confident you need to be that the estimate is accurate (the level of confidence in the estimate);
How accurate the estimate need to be (the margin of error that can be tolerated);
The proportion of responses you expect to have some particular attribute.
The formula is:
If population is less than 1000 then
Bijay Lal Pradhan, M Sc Statistics, FDPM (IIMA) 63
2
e
zpxqxn
2
e
zn
N
n
nn
1
'

SIMPLE RANDOM SAMPLING
Bijay Lal Pradhan, M Sc Statistics, FDPM (IIMA) 64
Lottery Method Use of Random Numbers

Bijay Lal Pradhan, M Sc Statistics, FDPM (IIMA) 65
within class homogeneous; between class heterogeneous
If the population is heterogeneous then srs may not give representative data
Stratified Random sampling
Each class is said to be strata

Bijay Lal Pradhan, M Sc Statistics, FDPM (IIMA) 66
within class heterogeneous; between class homogeneous
If the population is heterogeneous then srs may not give representative data
Cluster sampling
Each class is said to be cluster

Bijay Lal Pradhan, M Sc Statistics, FDPM (IIMA) 67
Systematic Sampling
4
1
3
2
Sampling of households

1st 2nd 3rd 4th 5th
5 developmental Region of Nepal
A study of attitude of Nepalese people towards the Family Planning
4th 1st

Development Region
Different Anchal

Similarly
Some districts can be taken as sample from the selected anchal
Likewise VDC, Municipality ward number and house no can be taken as sample
In this way there is
Nepal
Development region
zone
District
VDC Municipality
Ward no
Bijay Lal Pradhan, M Sc Statistics, FDPM (IIMA) 70
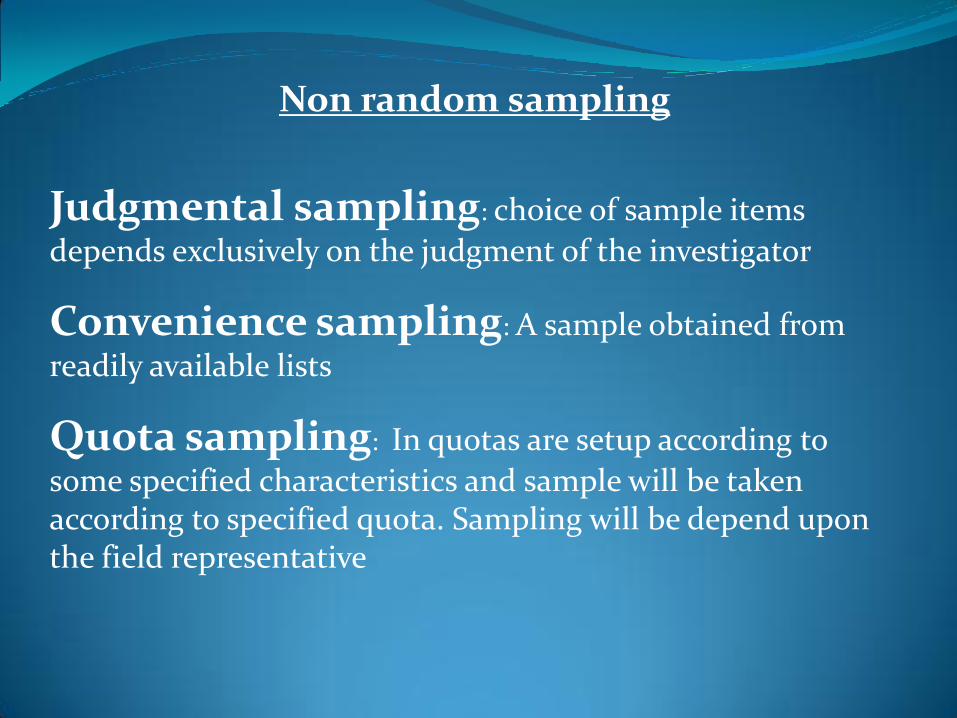
Non random sampling
Judgmental sampling: choice of sample items
depends exclusively on the judgment of the investigator
Convenience sampling: A sample obtained from
readily available lists
Quota sampling: In quotas are setup according to
some specified characteristics and sample will be taken according to specified quota. Sampling will be depend upon the field representative
Snow ball method
Assumption of this method is that “ if small ball is let roll from the top of snow-peak, it gathers substantial amount of snow and looks like a big ball when it arrives at the bottom of snow hill.

Sampling errors It is the error of representativeness It is the difference between total population value and the sampling value The degree to which sample characteristics app- roximate the characteristics of total population. Sapling error = Statistics – Parameter 𝑆𝑎𝑚𝑝𝑙𝑖𝑛𝑔 𝑒𝑟𝑟𝑜𝑟 𝛼
1
𝑆𝑎𝑚𝑝𝑙𝑒 𝑠𝑖𝑧𝑒
Parameter
20 years
Statistic
19 years
Statistic
21 years
Statistic
24 years


![BIRENDRA LAL/MINA DEVI - Nepal Telecom · १९ ७५०plngf gof}kfg] aleena neupane morang,biratnagar-19 dharma raj/sunita kumari ... td bijay gautam baglung,bhim pokhara-4 dipak/sushila](https://img.pdfslide.net/doc/110x75/5b1830f17f8b9a3c258b916c/birendra-lalmina-devi-nepal-telecom-plngf-gofkfg-aleena.jpg)