Embed Size (px)
Citation preview
Bilateral Key Comparison
Luminous Flux COOMET.PR-K4.1
(COOMET project 636/UA/14)
FINAL REPORT
M. Huriev, B. Khlevnoy, G. Tolstykh, E. Ivashin and T. Gorchkova
Kharkiv 2017
2
COOMET.PR-K4.1 Bilateral Comparison Final Report
CONTENT
1 INTRODUCTION ……………………………………….……………………………..….. 3
2. ORGANIZATION OF COMPARISON ….…………..………………………………….. 3 2.1 Participants……………………………………………………………………………….. 3 2.2 Order of comparison ……………………………………………………………………. 4 3. ARTEFACT ….…………..……………………………………………………………….. 4 3.1 Description of transfer standards lamps ……………………………………………… 4 3.2 Measurement conditions …………………………..…………………………..………. 4
3.3 Lamps stability …………………………..……………….……………………..………. 6 4. MEASUREMENTS AT NSC “IM” …………………………..…………………..………. 6 4.1. Description of the national primary standard facility of luminous flux in the NSC "Institute of Metrology" …………………………..…………………………..…………..…. 6
4.2. Procedure of measuring the comparison transfer standard lamps …………...…. 11
4.3. Results of the comparison lamps measurements at NSC. Lamps stability …..… 11
4.4. Uncertainty of NSC “IM” measurement …………………………………………...... 13
5. MEASUREMENTS AT VNIIOFI. LINK TO CCPR-K4 ……………………….…….… 13 6. DEGREE OF EQUIVALENCE of NSC "INSTITUTE OF METROLOGY" ...……..... 14 6.1. Summary of measurement results ………………………………….……..……..…. 14 6.2. Degree of Equivalence of NSC “IM” ……………………………………….……..…. 15 6.3. Uncertainty of DoE ……………………………………….………………….……..…. 15 7. SUMMARY OF COMPARISON RESULTS ……………………………….…...…..…. 17 8. LITERATURE ………………………………………………………………….…………. 17
Annex A …………………………………………………………………..….……….. 18
3
COOMET.PR-K4.1 Bilateral Comparison Final Report
1. INTRODUCTION
This report describes an international bilateral key comparison on luminous flux, which are transferred by a set of incandescent lamps.
This comparison is conducted by the Euro-Asian Cooperation of National Metrological Institutions (COOMET) as the Regional Metrology Organization (RMO) in accordance with the COOMET project 636/UA/14.
The National Scientific Centre "Institute of Metrology" (NSC “IM”, Ukraine) acts as a pilot laboratory for this key comparison. All-Russian Research Institute for Optical and Physical Measurements (VNIIOFI, Russia) acts as a laboratory, providing the link to the comparisons CCPR-K4 (link laboratory).
This bilateral key comparison is intended to determine the Degrees of Equivalence (DoE) for NSC “IM” and the associated expanded uncertainty. The DoE sets the relative difference of the NSC “IM” measurement results to the Key Comparison Reference Value (KCRV), which were determined in the CCPR-K4 key comparisons, initialized by the Comité Consultative de Photométrie et Radiométrie (CCPR). The results of the CCPR-K4 were published in 2001 [1].
Since CCPR-K4, KCRV are maintained by the participants of CCPR-K4. One of the participants (VNIIOFI, Russia) now plays the role of a link-laboratory for the COOMET key comparisons. VNIIOFI transfers its maintained values by a set of lamps to NSC "IM".
2. ORGANIZATION OF COMPARISON 2.1. Participants VNIIOFI participated in CCPR-K4 and provides the link of results between this bilateral KC and CCPR-K4. VNIIOFI acts as a link laboratory and is responsible for conducting Pre-Draft A procedures.
NSC "IM" is the laboratory, which requires link to the KCRV (non-link laboratory), and simultaneously acts as a pilot. NSC "IM" is responsible for the preparation of the Technical Protocol, preparation of transfer standards, checking the stability of the transfer standards, registration of the comparisons, preparing Draft A and executing all subsequent work.
Table 1 provides information about the participants of the comparison.
Table 1. Participants of the comparison
NMI Shortcut Function Contact Person
Contact Details
All-Russian research institute for optical and physical measurement 46, Ozernaya, 119361, Moscow, Russia
VNIIOFI Link laboratory
Tatyjana Gorchkova
Tel: + 495 437 55 33 Fax: +495 437 31 47 Email: [email protected]
National Scientific Center “Institute of Metrology” 42, Mironositskaya 61002, Kharkiv, Ukraine
NSC “IM”
Pilot
Non-link Laboratory
Mykola Huriev
Tel: +38 057 704 97 72 Fax: +38 057 700 34 47 Email:[email protected]
4
COOMET.PR-K4.1 Bilateral Comparison Final Report
2.2. Order of comparison
Comparisons were performed by alternate calibration of the same group of transfer standard lamps (described in the section 3). The artefacts (lamps) underwent an initial calibration in the pilot laboratory, NSC "IM". Then they were sent to VNIIOFI for calibration. After that the lamp came back to NSC "IM" and were re-measured.
When all the measurements were completed, all the results obtained in both laboratories were sent to a third party (CCPR WG-KC Secretary: Michael Stock, [email protected]) in accordance with the requirements of the guidelines CCPR-G5 (paragraphs 5.2 - 5.4). After collection of all the results, the third party sent all the data to the link laboratory (VNIIOFI), which implemented Pre-Draft A procedures.
When the Pre-Draft A procedures were completed the results were sent to the pilot (NSC "IM"), who prepared the Draft A report and executed all subsequent work.
3. ARTIFACT The artifact consisted of a group of the three lamps of the SIP 107-3500 type constituting a comparison transfer standard. The lamps had acceptable stability and reliability. The lamps were prepared and provided by NSC "IM”. The number of lamps was selected as a minimal number, which reduces the risk of uncontrolled drift and damage to the lamps, and allowed with greater confidence to establish the degree of equivalence (DoE).
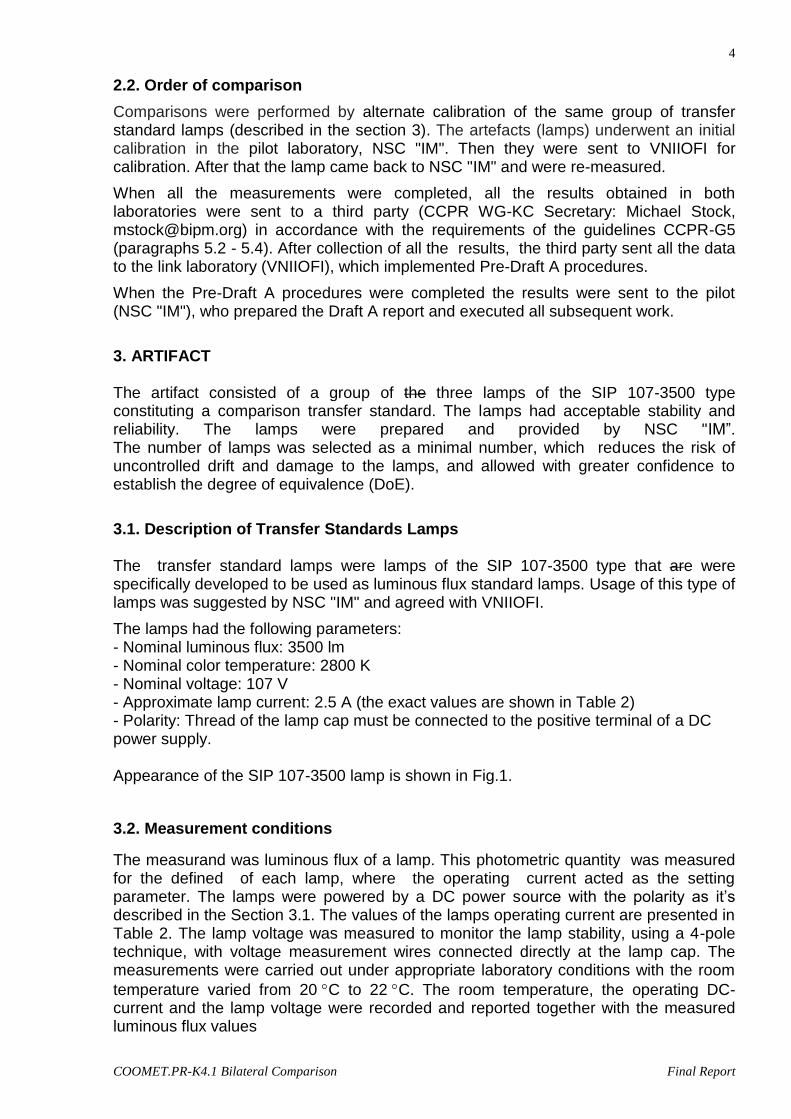
3.1. Description of Transfer Standards Lamps The transfer standard lamps were lamps of the SIP 107-3500 type that are were specifically developed to be used as luminous flux standard lamps. Usage of this type of lamps was suggested by NSC "IM" and agreed with VNIIOFI.
The lamps had the following parameters: - Nominal luminous flux: 3500 lm - Nominal color temperature: 2800 K - Nominal voltage: 107 V - Approximate lamp current: 2.5 A (the exact values are shown in Table 2) - Polarity: Thread of the lamp cap must be connected to the positive terminal of a DC power supply. Appearance of the SIP 107-3500 lamp is shown in Fig.1.
3.2. Measurement conditions
The measurand was luminous flux of a lamp. This photometric quantity was measured for the defined of each lamp, where the operating current acted as the setting parameter. The lamps were powered by a DC power source with the polarity as it’s described in the Section 3.1. The values of the lamps operating current are presented in Table 2. The lamp voltage was measured to monitor the lamp stability, using a 4-pole technique, with voltage measurement wires connected directly at the lamp cap. The measurements were carried out under appropriate laboratory conditions with the room
temperature varied from 20 C to 22 C. The room temperature, the operating DC-current and the lamp voltage were recorded and reported together with the measured luminous flux values
5
COOMET.PR-K4.1 Bilateral Comparison Final Report
Figure 1: Luminous flux transfer standard lamp of SIP 107-3500 type.
The luminous flux of the lamps was measured independently at least 2 times. Each independent measurement was carried out for the lamp being realigned in the measurement facility and being switched off and on after a break of at least 1 h for each lamp. Table 2. Operating currents of transfer standard lamps
Lamp number 22 26 102
Value of operation current, A 2.4450 2.4060 2.4370
In both laboratories, all lamps were measured using an integrating sphere photometer. The lamp was installed in the center of the sphere vertically, the lamp cap pointing upwards. The photometer head used with the sphere did not receive direct radiation from the lamp. The lamp was aligned following the usual laboratory procedures. The lamp was warmed up by slow (for several minutes) increasing the electrical current. Before starting measurements the lamp was warm-up at the operating current for at least 10 minutes.
Before installing in the facility the lamps were inspected for damage or contamination of the lamp bulb or cap. No any damage or contamination was recorded during the comparison.
6
COOMET.PR-K4.1 Bilateral Comparison Final Report
3.3. Lamps stability
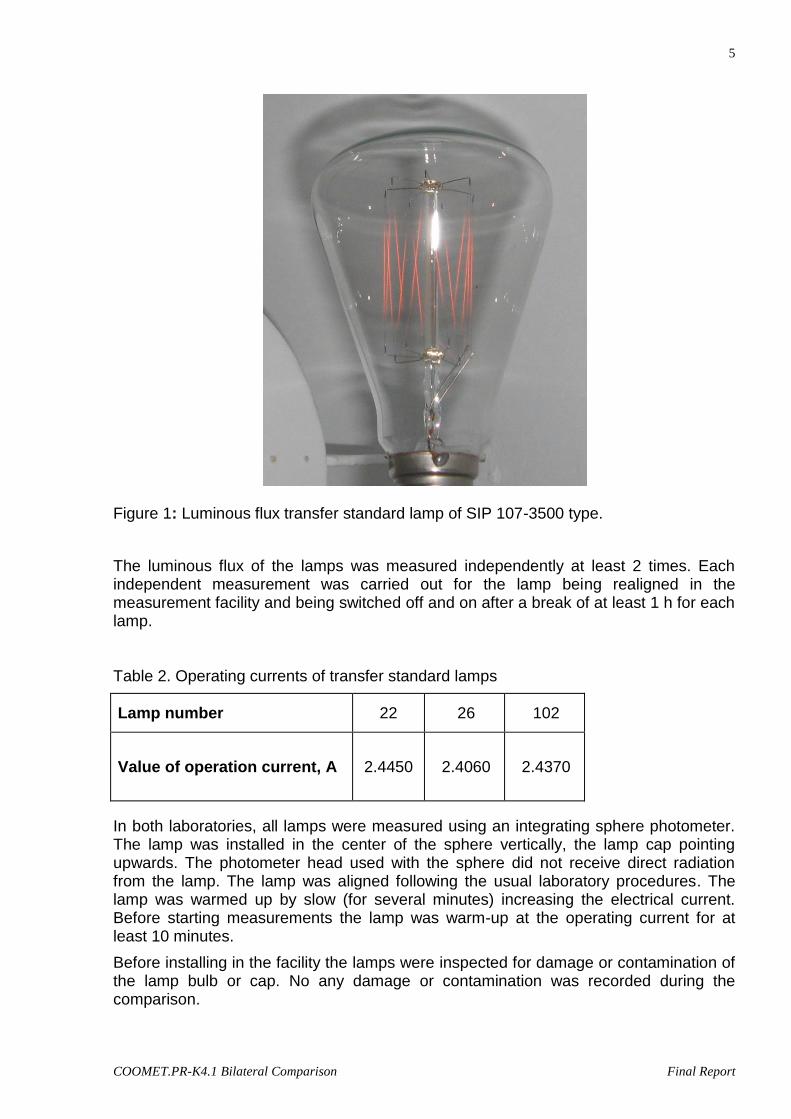
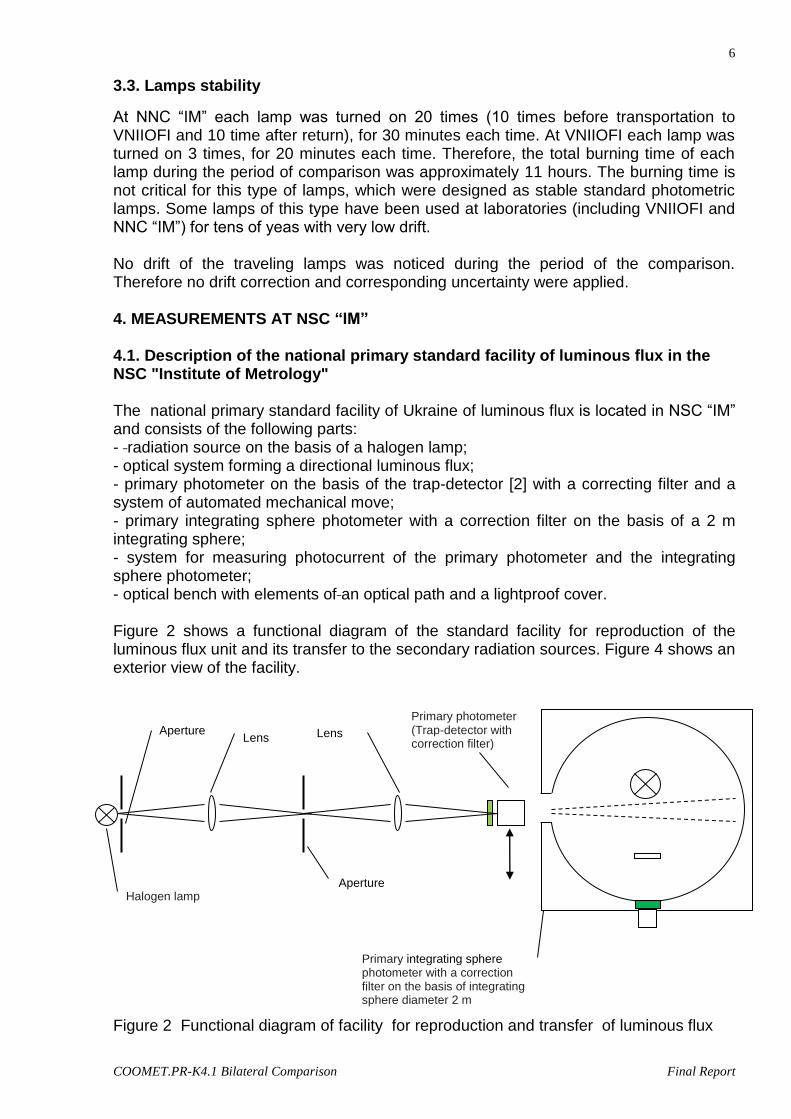
At NNC “IM” each lamp was turned on 20 times (10 times before transportation to VNIIOFI and 10 time after return), for 30 minutes each time. At VNIIOFI each lamp was turned on 3 times, for 20 minutes each time. Therefore, the total burning time of each lamp during the period of comparison was approximately 11 hours. The burning time is not critical for this type of lamps, which were designed as stable standard photometric lamps. Some lamps of this type have been used at laboratories (including VNIIOFI and NNC “IM”) for tens of yeas with very low drift. No drift of the traveling lamps was noticed during the period of the comparison. Therefore no drift correction and corresponding uncertainty were applied. 4. MEASUREMENTS AT NSC “IM” 4.1. Description of the national primary standard facility of luminous flux in the NSC "Institute of Metrology" The national primary standard facility of Ukraine of luminous flux is located in NSC “IM” and consists of the following parts: - radiation source on the basis of a halogen lamp; - optical system forming a directional luminous flux; - primary photometer on the basis of the trap-detector [2] with a correcting filter and a system of automated mechanical move; - primary integrating sphere photometer with a correction filter on the basis of a 2 m integrating sphere; - system for measuring photocurrent of the primary photometer and the integrating sphere photometer; - optical bench with elements of an optical path and a lightproof cover. Figure 2 shows a functional diagram of the standard facility for reproduction of the luminous flux unit and its transfer to the secondary radiation sources. Figure 4 shows an exterior view of the facility.
Figure 2 Functional diagram of facility for reproduction and transfer of luminous flux
Halogen lamp
Lens Lens
Aperture
Aperture
Primary photometer (Trap-detector with correction filter)
Primary integrating sphere photometer with a correction filter on the basis of integrating sphere diameter 2 m
7
COOMET.PR-K4.1 Bilateral Comparison Final Report
Figure 3. Exterior view of the national primary standard facility of luminous flux
8
COOMET.PR-K4.1 Bilateral Comparison Final Report
Radiation flux of the halogen lamps source is transformed by the optical system into the trap-detector is based on three Hamamatsu silicon photodiodes with a hundred-percent internal quantum efficiency for optical radiation in the wavelength range from 400 nm to 900 nm. Due to the fact that the light 5 times hits the photodiodes, only a small fraction, less than 0.1 % (in the visible wavelength range), comes back out of the trap-detector. The coefficient of radiation absorption of the device is close to 1, which ensures almost one hundred percent external quantum efficiency of the trap- detector.
Integrating sphere has an internal coating of BaSO4. A detector, consisting of a Si photodiode, a milk glass diffuser and a correction filter, is placed on the lateral surface of the sphere and adjusts the relative spectral responsivity curve of the photometer to
the luminosity curve V(λ).
Also a secondary standard source (a source to be measured) is placed inside the sphere. Between the secondary source and the detector there is a baffle that prevents direct rays from the source to the detector diffuser. In addition, the integrating sphere has a hole that allows the external luminous flux to get inside and to illuminate the sphere surface, so that the light spot is within the detector field of view.
This design allows measuring the responsivity of the integrating sphere photometer by means of known external luminous flux and then to use this responsivity value for measurement of the luminous flux from the secondary light source that is to be calibrated.
One of the main metrological characteristic of the trap-detector with the correcting filter is the difference between its relative spectral responsivity and the luminous efficiency
function V(λ).
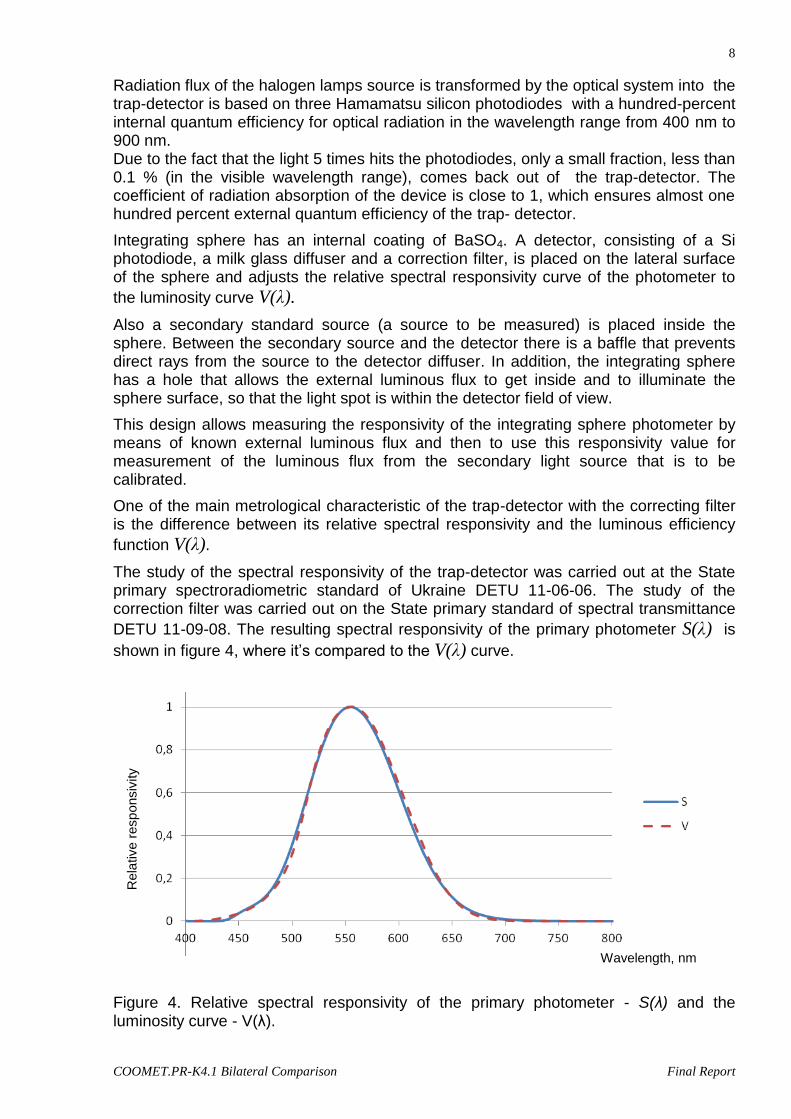
The study of the spectral responsivity of the trap-detector was carried out at the State primary spectroradiometric standard of Ukraine DETU 11-06-06. The study of the correction filter was carried out on the State primary standard of spectral transmittance
DETU 11-09-08. The resulting spectral responsivity of the primary photometer S(λ) is
shown in figure 4, where it’s compared to the V(λ) curve.
Figure 4. Relative spectral responsivity of the primary photometer - S(λ) and the luminosity curve - V(λ).
Wavelength, nm
Rela
tive
resp
onsiv
ity
9
COOMET.PR-K4.1 Bilateral Comparison Final Report
As a result of the research the actinic coefficient of the primary photometer was determined by the formula:
∫
∫
(1)
Where Ф(λ) is the relative spectral characteristics of the luminous flux.
The relative spectral responsivity of the primary photometer can be represented as:
S(λ) = Strap(λ)× τ(λ)/(Strap(λ)× τ(λ))max (2)
Where Strap(λ) is the spectral responsivity of the trap-detector, τ(λ) is the spectral
transmittance of the correction filter. The responsivity of the primary photometer for directed luminous flux of the halogen lamp:
SФ = S(555))/(683×A) (3)
where S(555), the spectral responsivity of the primary photometer at the wavelength
λ = 555 nm, was determined by the absolute method on the State primary
spectroradiometric standard of Ukraine DETU 11-06-06.
The values Strap(λ) and τ(λ) were measured absolutely on the two State primary
standards separately, with the spectral step of 1 nm for reliable determining the value of the primary photometer actinic coefficient. On the State primary spectroradiometric standard of Ukraine DETU 11-06-06 we made sure to perfect spectral linearity of trap-detector without the correction filter in the range of 400 nm to 900 nm. The correction filter was repeatedly measured by the step of 1 nm on the State primary standard of spectral transmittance DETU 11-09-08. All this has allowed us to accurately determine the actinic coefficient of the trap-detector with correction filter.
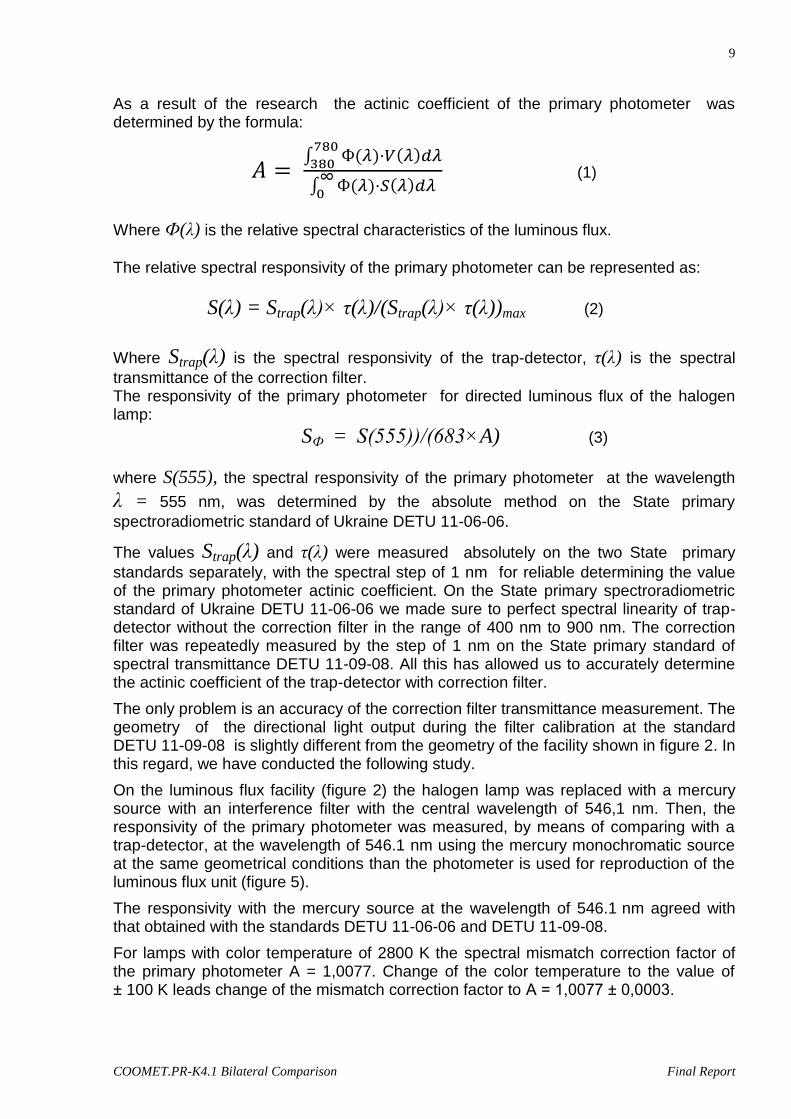
The only problem is an accuracy of the correction filter transmittance measurement. The geometry of the directional light output during the filter calibration at the standard DETU 11-09-08 is slightly different from the geometry of the facility shown in figure 2. In this regard, we have conducted the following study.
On the luminous flux facility (figure 2) the halogen lamp was replaced with a mercury source with an interference filter with the central wavelength of 546,1 nm. Then, the responsivity of the primary photometer was measured, by means of comparing with a trap-detector, at the wavelength of 546.1 nm using the mercury monochromatic source at the same geometrical conditions than the photometer is used for reproduction of the luminous flux unit (figure 5).
The responsivity with the mercury source at the wavelength of 546.1 nm agreed with that obtained with the standards DETU 11-06-06 and DETU 11-09-08.
For lamps with color temperature of 2800 K the spectral mismatch correction factor of the primary photometer A = 1,0077. Change of the color temperature to the value of ± 100 K leads change of the mismatch correction factor to A = 1,0077 ± 0,0003.
10
COOMET.PR-K4.1 Bilateral Comparison Final Report
Figure 5. Functional diagram of the facility for the study of the correction filter at the wavelength of 546.1 nm. Taking these results into account one can conclude that the mismatch correction factor of the photometer is weakly dependent on the color temperature of the halogen lamp, which allows determining with high precision (in terms of the mismatch correction) the responsivity of the primary photometer to luminous flux for the type A source, which
amounted to SФ = 3,5985 × 10⁻⁴ A/lm.
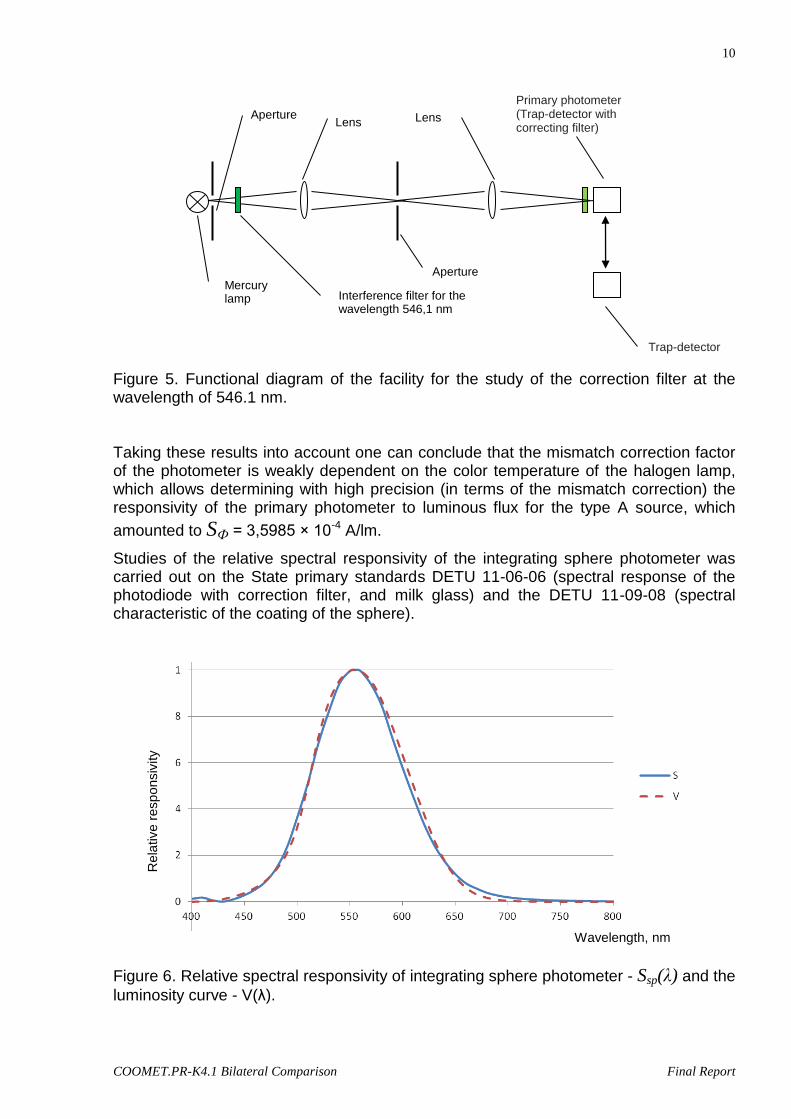
Studies of the relative spectral responsivity of the integrating sphere photometer was carried out on the State primary standards DETU 11-06-06 (spectral response of the photodiode with correction filter, and milk glass) and the DETU 11-09-08 (spectral characteristic of the coating of the sphere).
Figure 6. Relative spectral responsivity of integrating sphere photometer - Ssp(λ) and the
luminosity curve - V(λ).
Mercury lamp
Lens Lens
Aperture
Aperture
Primary photometer (Trap-detector with correcting filter)
Interference filter for the wavelength 546,1 nm
Trap-detector
Rela
tive
resp
onsiv
ity
Wavelength, nm
11
COOMET.PR-K4.1 Bilateral Comparison Final Report
The results are shown in figure 6, which the relative spectral responsivity of the
integrating sphere photometer - Ssp(λ) and the luminosity curve - V(λ). The spectral
mismatch correction factor of the integrating sphere photometer was evaluated to be A = 0,9963 ± 0.002 for the color temperature of (2800 ± 100) K. 4.2. Procedure measuring the comparison transfer standard lamps
The value of directional luminous flux Ф of the halogen lamp is determined by the trap
detector based primary photometer:
Ф =Jtrap/ SФ (4)
where Jtrap is photocurrent of the trap and SФ is the primary photometer responsivity in
A/lm.
Then the flux from the halogen lamp is directed to the integrating sphere photometer (the lamp, to be calibrated, inside the sphere is turned OFF), and the responsivity of the
integrating sphere photometer SФ sph (in A/lm) is determined by:
SФ sphere = Jsph hal / Ф (5)
where Jsph hal is photocurrent of the integrating sphere photometer.
Then the directed light flux is shut the comparison is gradually ON. After stabilization at the nominal value of the lamp for 30 minutes, the comparison lamp is measured and its
luminous flux Фlamp is determined as:
Фlamp = Jsph lamp / SФ sphere (6)
4.3. Results of the comparison lamps measurements at NSC. Lamps stability. According to the Technical Protocol the comparison transfer standard lamps were
measured first at NSC "IM"; the results are presented in Appendix A in tables A1, A3 and A5. Then the lamps were transported to VNIIOFI for measuring by the link laboratory. After that, they were returned back to NSC "IM", where they were measured again. The results of the repeat measurements are shown in tables A2, A4 and A6. The Tables A1 – A6 present the NSC “IM” results as they were submitted to the Third Party.
Comparing the results “before” and “after” one can concluded that after conducting a full cycle of the comparison the lamps did not change their electrical characteristics: the voltage (when corrected to the nominal current value) changed less than by 0.01 V for all lamps. The luminous flux values (corrected to the nominal current) of the “after” measurements are higher than the “before” values by approximately 0.01%, which is comparable with the random uncertainty of NSC “IM”. Therefore for further analysis we assume that the comparison standard lamps were stable.
After completion of the measurements, at the Pre-Draft A stage, NSC “IM” discovered an error in the lamp current measurement due to wrong calibrations of the reference
12
COOMET.PR-K4.1 Bilateral Comparison Final Report
resistance and voltmeter. The pair, the resistance plus voltmeter, were then sent to the NSC “IM” center of electromagnetic measurement, where it was re-calibrated using a precise DC source and a high level accuracy DC current meter. New calibration showed that the actual values of the comparison lamp current were lower by the factor of 0.99971 than that declared in the NSC “IM” measurement report forwarded to the third party. Such a change in the lamp current leads to the essential change of the lamp luminous flux value of approximately 0.15%.
NSC “IM” informed the link laboratory (VNIIOFI) about the discovered error and the result of the re-calibration. After discussion the participants agreed that the correction must be applied to the NSC “IM” lamp current data before further analysis of the comparison results. The NSC “IM” data with the corrected lamp current values are presented in tables A7 – A12 of the Annex A (the values of luminous flux, voltage and room temperature are unchanged).
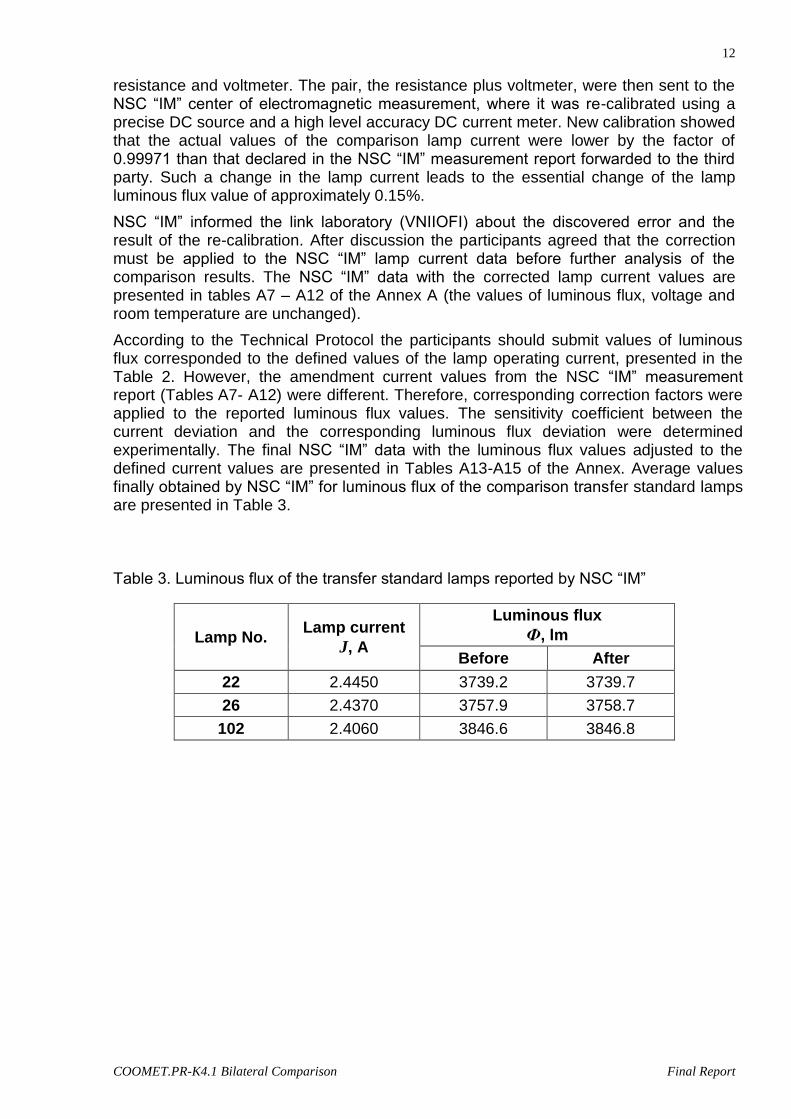
According to the Technical Protocol the participants should submit values of luminous flux corresponded to the defined values of the lamp operating current, presented in the Table 2. However, the amendment current values from the NSC “IM” measurement report (Tables A7- A12) were different. Therefore, corresponding correction factors were applied to the reported luminous flux values. The sensitivity coefficient between the current deviation and the corresponding luminous flux deviation were determined experimentally. The final NSC “IM” data with the luminous flux values adjusted to the defined current values are presented in Tables A13-A15 of the Annex. Average values finally obtained by NSC “IM” for luminous flux of the comparison transfer standard lamps are presented in Table 3. Table 3. Luminous flux of the transfer standard lamps reported by NSC “IM”
Lamp No.
Lamp current
J, A
Luminous flux
Ф, lm
Before After
22 2.4450 3739.2 3739.7
26 2.4370 3757.9 3758.7
102 2.4060 3846.6 3846.8
13
COOMET.PR-K4.1 Bilateral Comparison Final Report
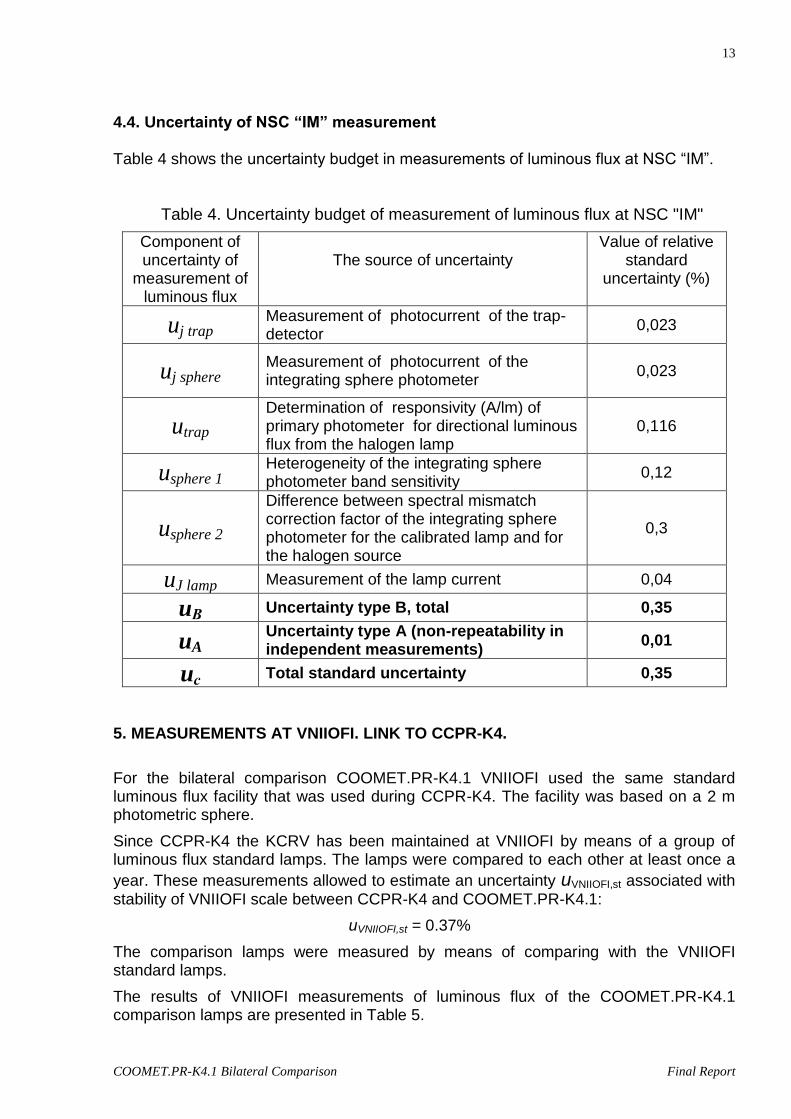
4.4. Uncertainty of NSC “IM” measurement
Table 4 shows the uncertainty budget in measurements of luminous flux at NSC “IM”.
Table 4. Uncertainty budget of measurement of luminous flux at NSC "IM"
Component of uncertainty of
measurement of luminous flux
The source of uncertainty Value of relative
standard uncertainty (%)
uj trap Measurement of photocurrent of the trap-detector
0,023
uj sphere Measurement of photocurrent of the integrating sphere photometer
0,023
utrap
Determination of responsivity (A/lm) of primary photometer for directional luminous flux from the halogen lamp
0,116
usphere 1 Heterogeneity of the integrating sphere photometer band sensitivity
0,12
usphere 2
Difference between spectral mismatch correction factor of the integrating sphere photometer for the calibrated lamp and for the halogen source
0,3
uJ lamp Measurement of the lamp current 0,04
uВ Uncertainty type B, total 0,35
uA Uncertainty type A (non-repeatability in independent measurements)
0,01
uс Total standard uncertainty 0,35
5. MEASUREMENTS AT VNIIOFI. LINK TO CCPR-K4.
For the bilateral comparison COOMET.PR-K4.1 VNIIOFI used the same standard luminous flux facility that was used during CCPR-K4. The facility was based on a 2 m photometric sphere.
Since CCPR-K4 the KCRV has been maintained at VNIIOFI by means of a group of luminous flux standard lamps. The lamps were compared to each other at least once a
year. These measurements allowed to estimate an uncertainty uVNIIOFI,st associated with stability of VNIIOFI scale between CCPR-K4 and COOMET.PR-K4.1:
uVNIIOFI,st = 0.37%
The comparison lamps were measured by means of comparing with the VNIIOFI standard lamps.
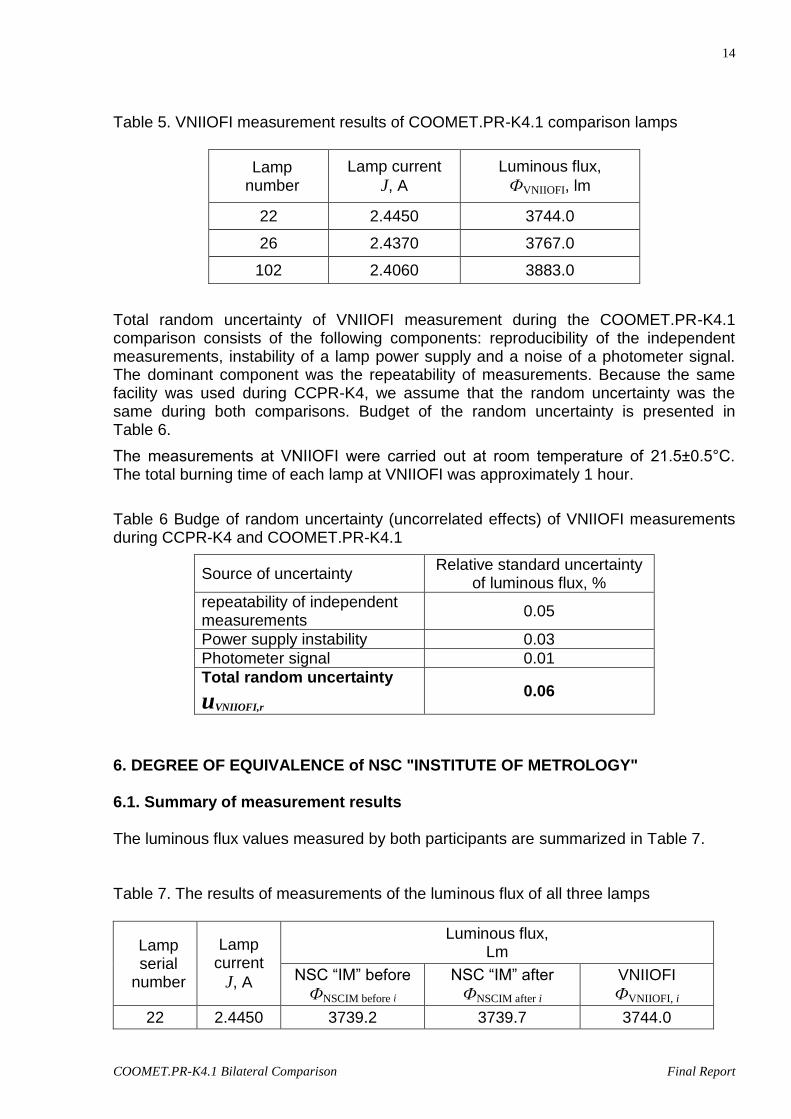
The results of VNIIOFI measurements of luminous flux of the COOMET.PR-K4.1 comparison lamps are presented in Table 5.
14
COOMET.PR-K4.1 Bilateral Comparison Final Report
Table 5. VNIIOFI measurement results of COOMET.PR-K4.1 comparison lamps
Lamp number
Lamp current
J, A
Luminous flux,
ФVNIIOFI, lm
22 2.4450 3744.0
26 2.4370 3767.0
102 2.4060 3883.0
Total random uncertainty of VNIIOFI measurement during the COOMET.PR-K4.1 comparison consists of the following components: reproducibility of the independent measurements, instability of a lamp power supply and a noise of a photometer signal. The dominant component was the repeatability of measurements. Because the same facility was used during CCPR-K4, we assume that the random uncertainty was the same during both comparisons. Budget of the random uncertainty is presented in Table 6.
The measurements at VNIIOFI were carried out at room temperature of 21.5±0.5°C. The total burning time of each lamp at VNIIOFI was approximately 1 hour.
Table 6 Budge of random uncertainty (uncorrelated effects) of VNIIOFI measurements during CCPR-K4 and COOMET.PR-K4.1
Source of uncertainty Relative standard uncertainty
of luminous flux, %
repeatability of independent measurements
0.05
Power supply instability 0.03
Photometer signal 0.01
Total random uncertainty
uVNIIOFI,r 0.06
6. DEGREE OF EQUIVALENCE of NSC "INSTITUTE OF METROLOGY" 6.1. Summary of measurement results The luminous flux values measured by both participants are summarized in Table 7. Table 7. The results of measurements of the luminous flux of all three lamps
Lamp serial
number
Lamp current
J, A
Luminous flux, Lm
NSC “IM” before
ФNSCIM before i
NSC “IM” after
ФNSCIM after i
VNIIOFI
ФVNIIOFI, i
22 2.4450 3739.2 3739.7 3744.0
15
COOMET.PR-K4.1 Bilateral Comparison Final Report
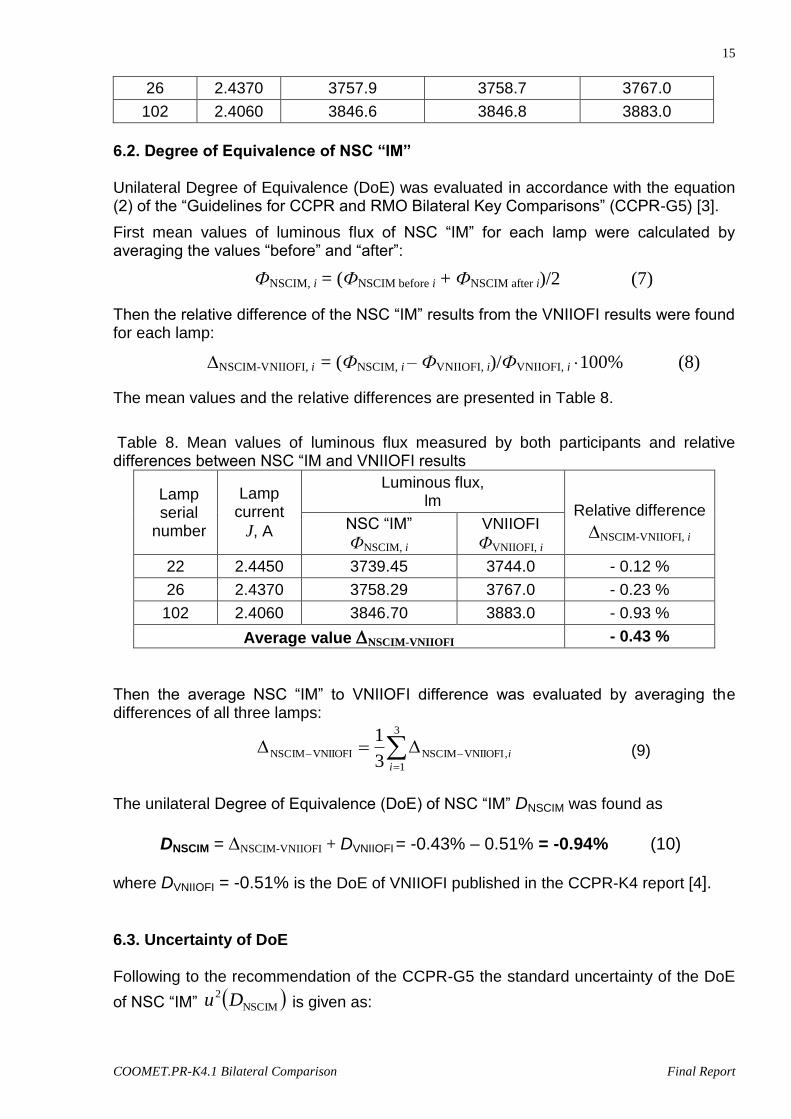
26 2.4370 3757.9 3758.7 3767.0
102 2.4060 3846.6 3846.8 3883.0
6.2. Degree of Equivalence of NSC “IM” Unilateral Degree of Equivalence (DoE) was evaluated in accordance with the equation (2) of the “Guidelines for CCPR and RMO Bilateral Key Comparisons” (CCPR-G5) [3].
First mean values of luminous flux of NSC “IM” for each lamp were calculated by averaging the values “before” and “after”:
ФNSCIM, i = (ФNSCIM before i + ФNSCIM after i)/2 (7)
Then the relative difference of the NSC “IM” results from the VNIIOFI results were found for each lamp:
NSCIM-VNIIOFI, i = (ФNSCIM, i – ФVNIIOFI, i)/ФVNIIOFI, i 100% (8)
The mean values and the relative differences are presented in Table 8.
Table 8. Mean values of luminous flux measured by both participants and relative differences between NSC “IM and VNIIOFI results
Lamp serial
number
Lamp current
J, A
Luminous flux, lm
Relative difference
NSCIM-VNIIOFI, i NSC “IM”
ФNSCIM, i
VNIIOFI
ФVNIIOFI, i
22 2.4450 3739.45 3744.0 - 0.12 %
26 2.4370 3758.29 3767.0 - 0.23 %
102 2.4060 3846.70 3883.0 - 0.93 %
Average value NSCIM-VNIIOFI - 0.43 %
Then the average NSC “IM” to VNIIOFI difference was evaluated by averaging the differences of all three lamps:
3
1
,VNIIOFINSCIMVNIIOFINSCIM3
1
i
i (9)
The unilateral Degree of Equivalence (DoE) of NSC “IM” DNSCIM was found as
DNSCIM = NSCIM-VNIIOFI + DVNIIOFI = -0.43% – 0.51% = -0.94% (10)
where DVNIIOFI = -0.51% is the DoE of VNIIOFI published in the CCPR-K4 report [4]. 6.3. Uncertainty of DoE Following to the recommendation of the CCPR-G5 the standard uncertainty of the DoE
of NSC “IM” NSCIM
2 Du is given as:
16
COOMET.PR-K4.1 Bilateral Comparison Final Report
2
BC
2
link
2
KC
2
NSCIMNSCIM
2 uuuuDu (11)
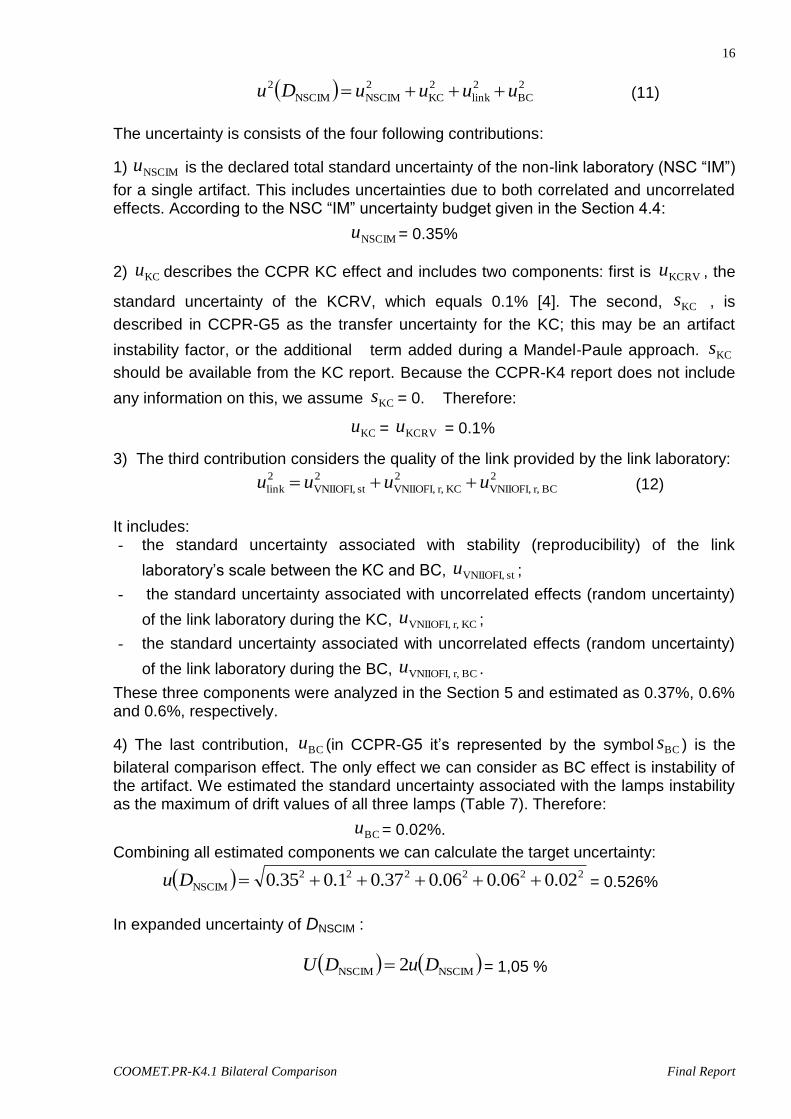
The uncertainty is consists of the four following contributions:
1)
NSCIMu is the declared total standard uncertainty of the non-link laboratory (NSC “IM”)
for a single artifact. This includes uncertainties due to both correlated and uncorrelated effects. According to the NSC “IM” uncertainty budget given in the Section 4.4:
NSCIMu = 0.35%
2) KCu describes the CCPR KC effect and includes two components: first is KCRVu , the
standard uncertainty of the KCRV, which equals 0.1% [4]. The second,
KCs , is
described in CCPR-G5 as the transfer uncertainty for the KC; this may be an artifact
instability factor, or the additional term added during a Mandel-Paule approach. KCs
should be available from the KC report. Because the CCPR-K4 report does not include
any information on this, we assume KCs = 0. Therefore:
KCu = KCRVu = 0.1%
3) The third contribution considers the quality of the link provided by the link laboratory:
2
BC r, VNIIOFI,
2
KC r, VNIIOFI,
2
st VNIIOFI,
2
link uuuu
(12)
It includes: - the standard uncertainty associated with stability (reproducibility) of the link
laboratory’s scale between the KC and BC, st VNIIOFI,u ;
- the standard uncertainty associated with uncorrelated effects (random uncertainty)
of the link laboratory during the KC, KC r, VNIIOFI,u ;
- the standard uncertainty associated with uncorrelated effects (random uncertainty)
of the link laboratory during the BC, BC r, VNIIOFI,u .
These three components were analyzed in the Section 5 and estimated as 0.37%, 0.6% and 0.6%, respectively.
4) The last contribution, BCu (in CCPR-G5 it’s represented by the symbol BCs ) is the
bilateral comparison effect. The only effect we can consider as BC effect is instability of the artifact. We estimated the standard uncertainty associated with the lamps instability as the maximum of drift values of all three lamps (Table 7). Therefore:
BCu = 0.02%.
Combining all estimated components we can calculate the target uncertainty:
222222
NSCIM 02.006.006.037.01.035.0 Du = 0.526%
In expanded uncertainty of DNSCIM :
NSCIMNSCIM 2 DuDU = 1,05 %
17
COOMET.PR-K4.1 Bilateral Comparison Final Report
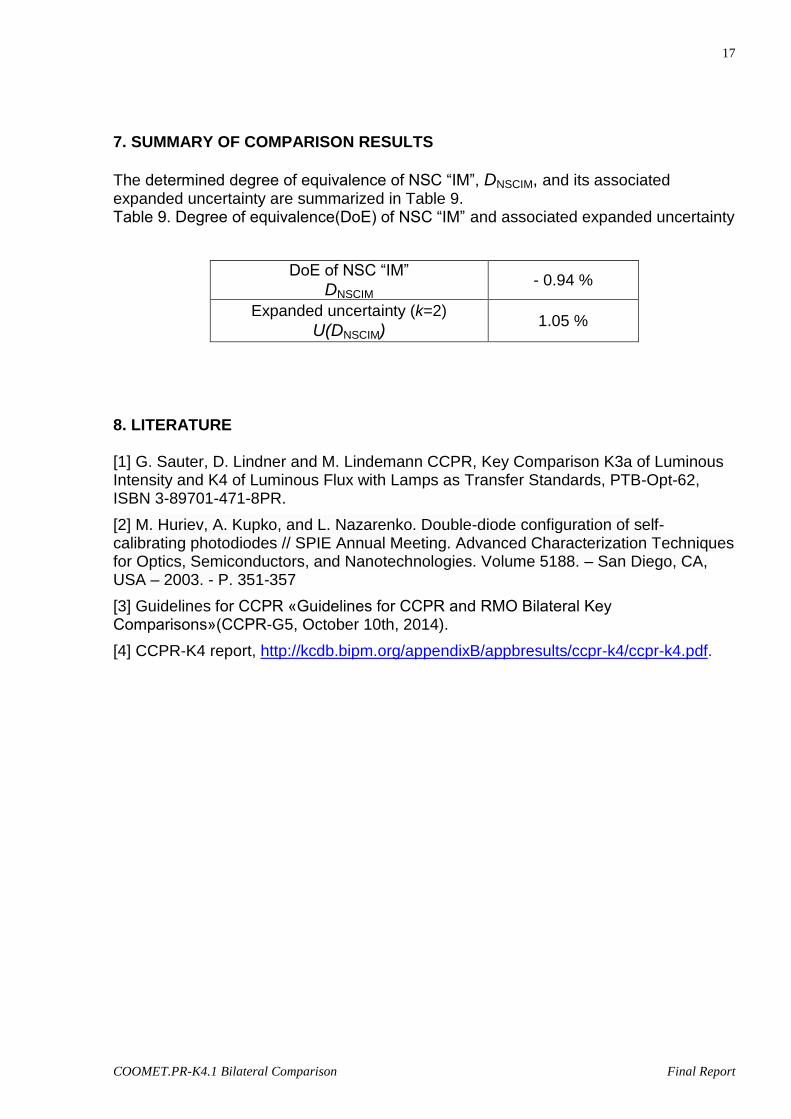
7. SUMMARY OF COMPARISON RESULTS
The determined degree of equivalence of NSC “IM”, DNSCIM, and its associated expanded uncertainty are summarized in Table 9. Table 9. Degree of equivalence(DoE) of NSC “IM” and associated expanded uncertainty
DoE of NSC “IM”
DNSCIM - 0.94 %
Expanded uncertainty (k=2)
U(DNSCIM) 1.05 %
8. LITERATURE [1] G. Sauter, D. Lindner and M. Lindemann CCPR, Key Comparison K3a of Luminous Intensity and K4 of Luminous Flux with Lamps as Transfer Standards, PTB-Opt-62, ISBN 3-89701-471-8PR.
[2] M. Huriev, A. Kupko, and L. Nazarenko. Double-diode configuration of self-calibrating photodiodes // SPIE Annual Meeting. Advanced Characterization Techniques for Optics, Semiconductors, and Nanotechnologies. Volume 5188. – San Diego, CA, USA – 2003. - P. 351-357
[3] Guidelines for CCPR «Guidelines for CCPR and RMO Bilateral Key Comparisons»(CCPR-G5, October 10th, 2014).
[4] CCPR-K4 report, http://kcdb.bipm.org/appendixB/appbresults/ccpr-k4/ccpr-k4.pdf.
18
COOMET.PR-K4.1 Bilateral Comparison Final Report
19
COOMET.PR-K4.1 Bilateral Comparison Final Report
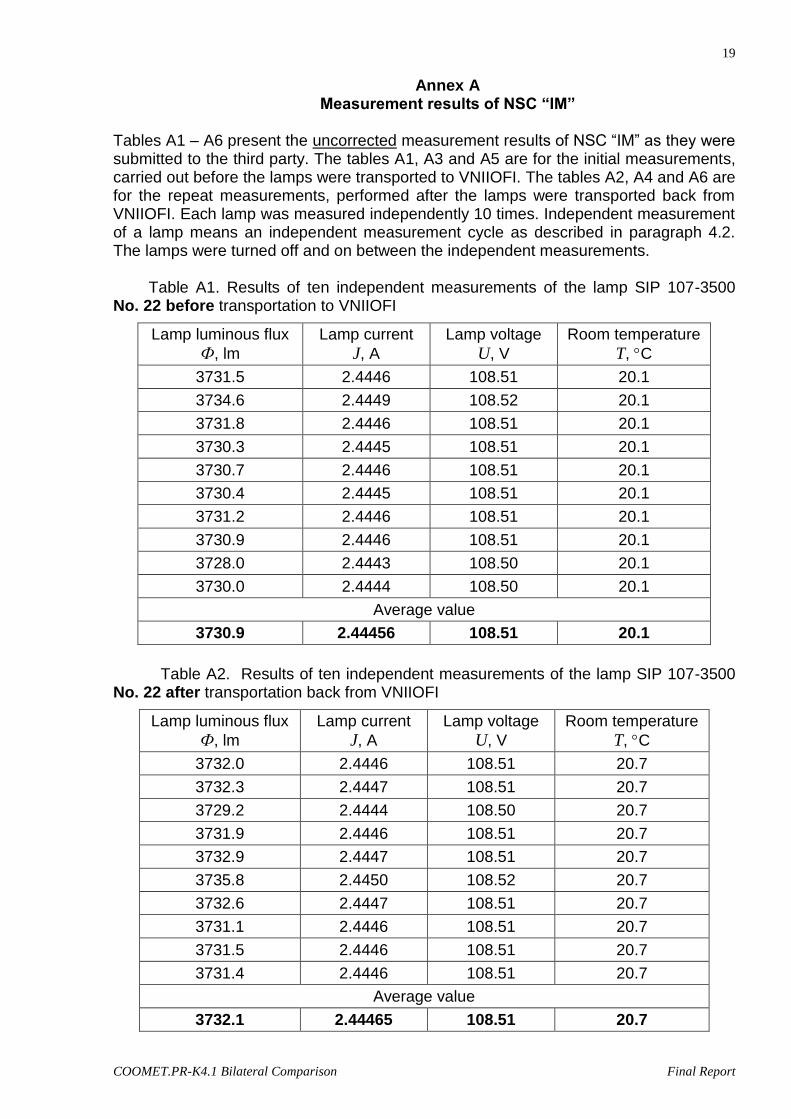
Annex A Measurement results of NSC “IM”
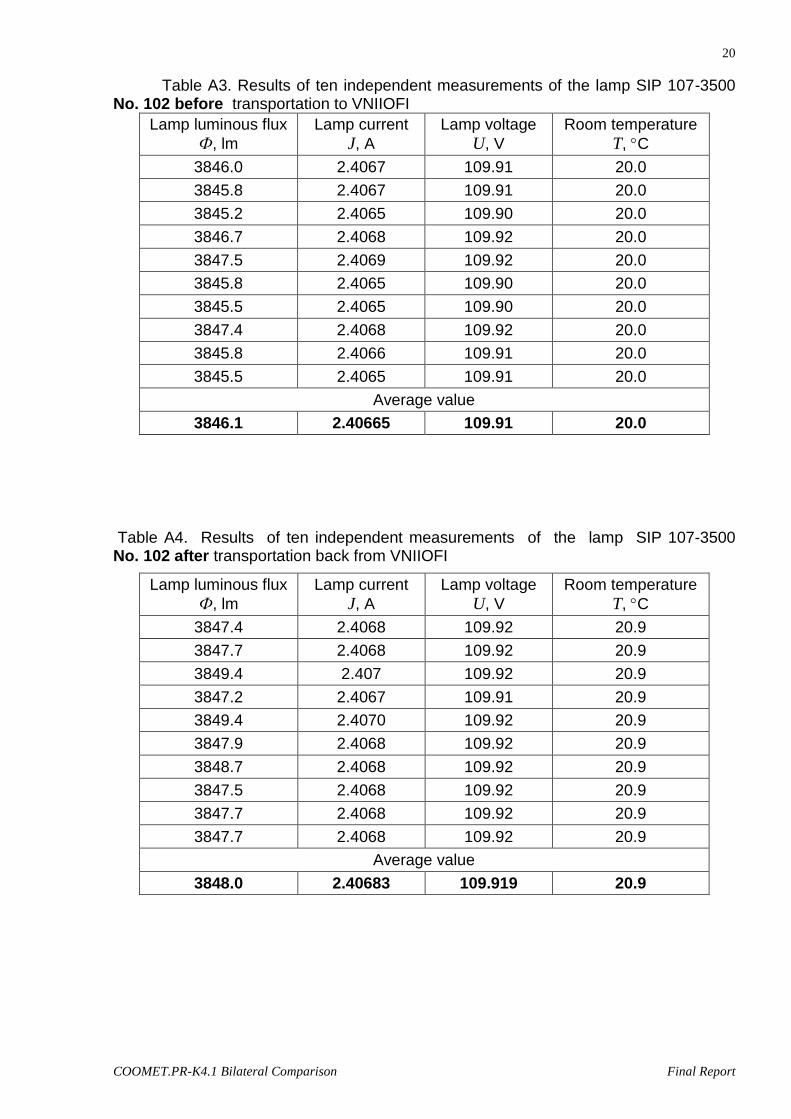
Tables A1 – A6 present the uncorrected measurement results of NSC “IM” as they were submitted to the third party. The tables A1, A3 and A5 are for the initial measurements, carried out before the lamps were transported to VNIIOFI. The tables A2, A4 and A6 are for the repeat measurements, performed after the lamps were transported back from VNIIOFI. Each lamp was measured independently 10 times. Independent measurement of a lamp means an independent measurement cycle as described in paragraph 4.2. The lamps were turned off and on between the independent measurements.
Table A1. Results of ten independent measurements of the lamp SIP 107-3500 No. 22 before transportation to VNIIOFI
Lamp luminous flux
Ф, lm
Lamp current
J, A
Lamp voltage
U, V
Room temperature
T, C
3731.5 2.4446 108.51 20.1
3734.6 2.4449 108.52 20.1
3731.8 2.4446 108.51 20.1
3730.3 2.4445 108.51 20.1
3730.7 2.4446 108.51 20.1
3730.4 2.4445 108.51 20.1
3731.2 2.4446 108.51 20.1
3730.9 2.4446 108.51 20.1
3728.0 2.4443 108.50 20.1
3730.0 2.4444 108.50 20.1
Average value
3730.9 2.44456 108.51 20.1
Table A2. Results of ten independent measurements of the lamp SIP 107-3500 No. 22 after transportation back from VNIIOFI
Lamp luminous flux
Ф, lm
Lamp current
J, A
Lamp voltage
U, V
Room temperature
T, C
3732.0 2.4446 108.51 20.7
3732.3 2.4447 108.51 20.7
3729.2 2.4444 108.50 20.7
3731.9 2.4446 108.51 20.7
3732.9 2.4447 108.51 20.7
3735.8 2.4450 108.52 20.7
3732.6 2.4447 108.51 20.7
3731.1 2.4446 108.51 20.7
3731.5 2.4446 108.51 20.7
3731.4 2.4446 108.51 20.7
Average value
3732.1 2.44465 108.51 20.7
20
COOMET.PR-K4.1 Bilateral Comparison Final Report
Table A3. Results of ten independent measurements of the lamp SIP 107-3500 No. 102 before transportation to VNIIOFI
Lamp luminous flux
Ф, lm
Lamp current
J, A
Lamp voltage
U, V
Room temperature
T, C
3846.0 2.4067 109.91 20.0
3845.8 2.4067 109.91 20.0
3845.2 2.4065 109.90 20.0
3846.7 2.4068 109.92 20.0
3847.5 2.4069 109.92 20.0
3845.8 2.4065 109.90 20.0
3845.5 2.4065 109.90 20.0
3847.4 2.4068 109.92 20.0
3845.8 2.4066 109.91 20.0
3845.5 2.4065 109.91 20.0
Average value
3846.1 2.40665 109.91 20.0
Table A4. Results of ten independent measurements of the lamp SIP 107-3500 No. 102 after transportation back from VNIIOFI
Lamp luminous flux
Ф, lm
Lamp current
J, A
Lamp voltage
U, V
Room temperature
T, C
3847.4 2.4068 109.92 20.9
3847.7 2.4068 109.92 20.9
3849.4 2.407 109.92 20.9
3847.2 2.4067 109.91 20.9
3849.4 2.4070 109.92 20.9
3847.9 2.4068 109.92 20.9
3848.7 2.4068 109.92 20.9
3847.5 2.4068 109.92 20.9
3847.7 2.4068 109.92 20.9
3847.7 2.4068 109.92 20.9
Average value
3848.0 2.40683 109.919 20.9
21
COOMET.PR-K4.1 Bilateral Comparison Final Report
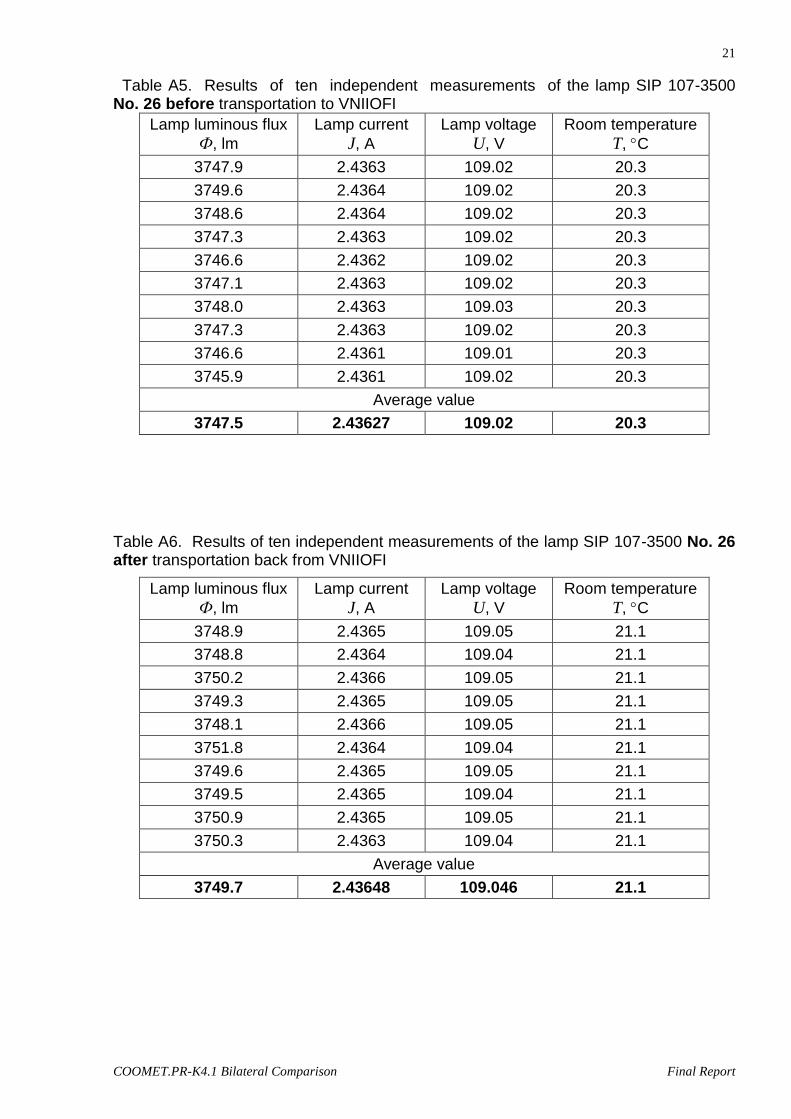
Table A5. Results of ten independent measurements of the lamp SIP 107-3500 No. 26 before transportation to VNIIOFI
Lamp luminous flux
Ф, lm
Lamp current
J, A
Lamp voltage
U, V
Room temperature
T, C
3747.9 2.4363 109.02 20.3
3749.6 2.4364 109.02 20.3
3748.6 2.4364 109.02 20.3
3747.3 2.4363 109.02 20.3
3746.6 2.4362 109.02 20.3
3747.1 2.4363 109.02 20.3
3748.0 2.4363 109.03 20.3
3747.3 2.4363 109.02 20.3
3746.6 2.4361 109.01 20.3
3745.9 2.4361 109.02 20.3
Average value
3747.5 2.43627 109.02 20.3
Table A6. Results of ten independent measurements of the lamp SIP 107-3500 No. 26 after transportation back from VNIIOFI
Lamp luminous flux
Ф, lm
Lamp current
J, A
Lamp voltage
U, V
Room temperature
T, C
3748.9 2.4365 109.05 21.1
3748.8 2.4364 109.04 21.1
3750.2 2.4366 109.05 21.1
3749.3 2.4365 109.05 21.1
3748.1 2.4366 109.05 21.1
3751.8 2.4364 109.04 21.1
3749.6 2.4365 109.05 21.1
3749.5 2.4365 109.04 21.1
3750.9 2.4365 109.05 21.1
3750.3 2.4363 109.04 21.1
Average value
3749.7 2.43648 109.046 21.1
22
COOMET.PR-K4.1 Bilateral Comparison Final Report
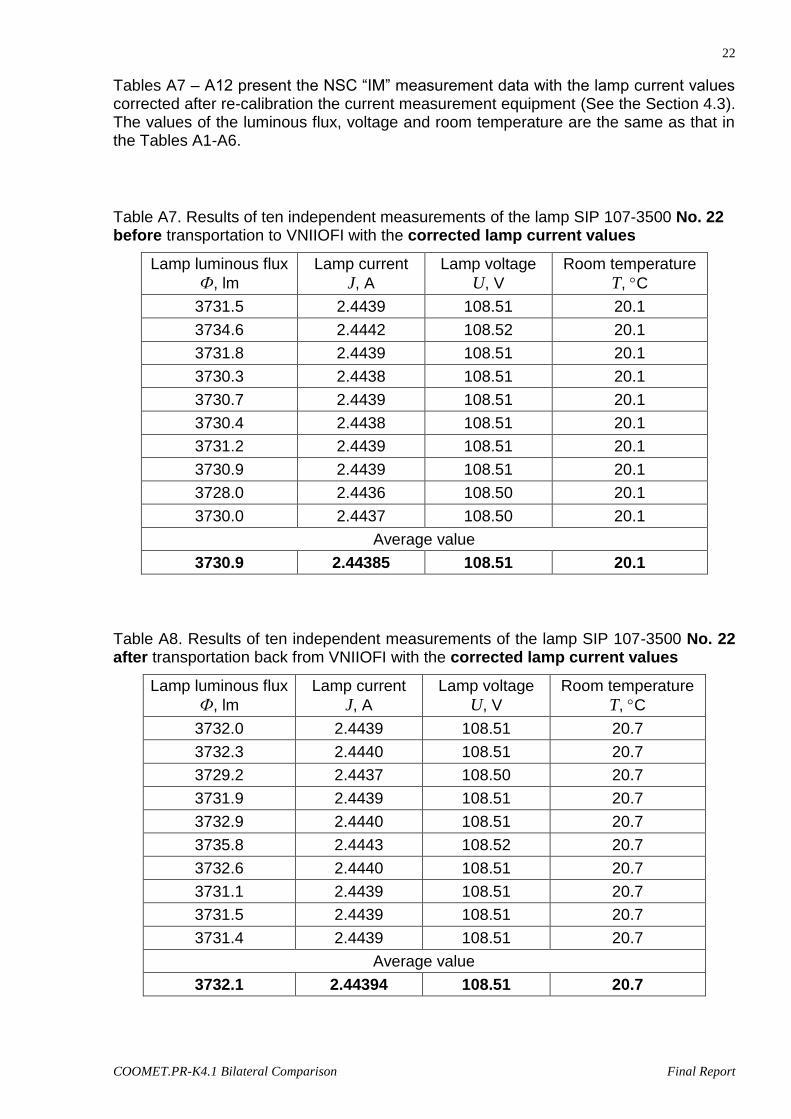
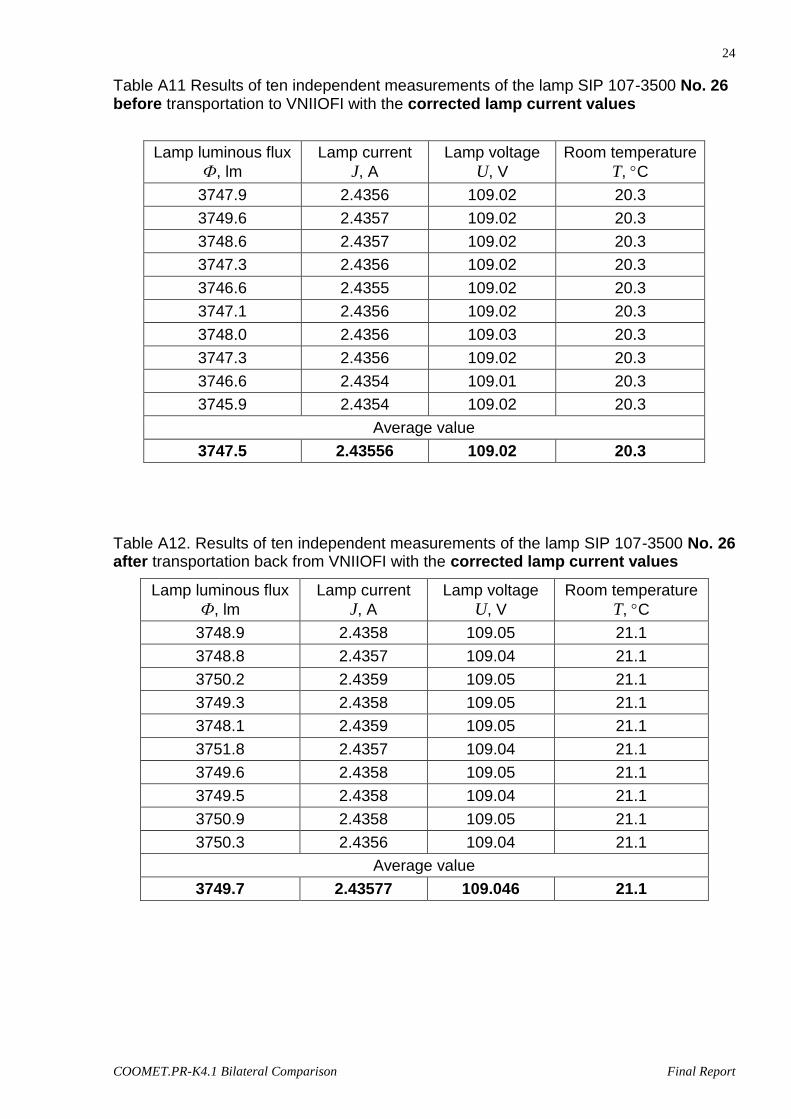
Tables A7 – A12 present the NSC “IM” measurement data with the lamp current values corrected after re-calibration the current measurement equipment (See the Section 4.3). The values of the luminous flux, voltage and room temperature are the same as that in the Tables A1-A6.
Table A7. Results of ten independent measurements of the lamp SIP 107-3500 No. 22 before transportation to VNIIOFI with the corrected lamp current values
Lamp luminous flux
Ф, lm
Lamp current
J, A
Lamp voltage
U, V
Room temperature
T, C
3731.5 2.4439 108.51 20.1
3734.6 2.4442 108.52 20.1
3731.8 2.4439 108.51 20.1
3730.3 2.4438 108.51 20.1
3730.7 2.4439 108.51 20.1
3730.4 2.4438 108.51 20.1
3731.2 2.4439 108.51 20.1
3730.9 2.4439 108.51 20.1
3728.0 2.4436 108.50 20.1
3730.0 2.4437 108.50 20.1
Average value
3730.9 2.44385 108.51 20.1
Table A8. Results of ten independent measurements of the lamp SIP 107-3500 No. 22 after transportation back from VNIIOFI with the corrected lamp current values
Lamp luminous flux
Ф, lm
Lamp current
J, A
Lamp voltage
U, V
Room temperature
T, C
3732.0 2.4439 108.51 20.7
3732.3 2.4440 108.51 20.7
3729.2 2.4437 108.50 20.7
3731.9 2.4439 108.51 20.7
3732.9 2.4440 108.51 20.7
3735.8 2.4443 108.52 20.7
3732.6 2.4440 108.51 20.7
3731.1 2.4439 108.51 20.7
3731.5 2.4439 108.51 20.7
3731.4 2.4439 108.51 20.7
Average value
3732.1 2.44394 108.51 20.7
23
COOMET.PR-K4.1 Bilateral Comparison Final Report
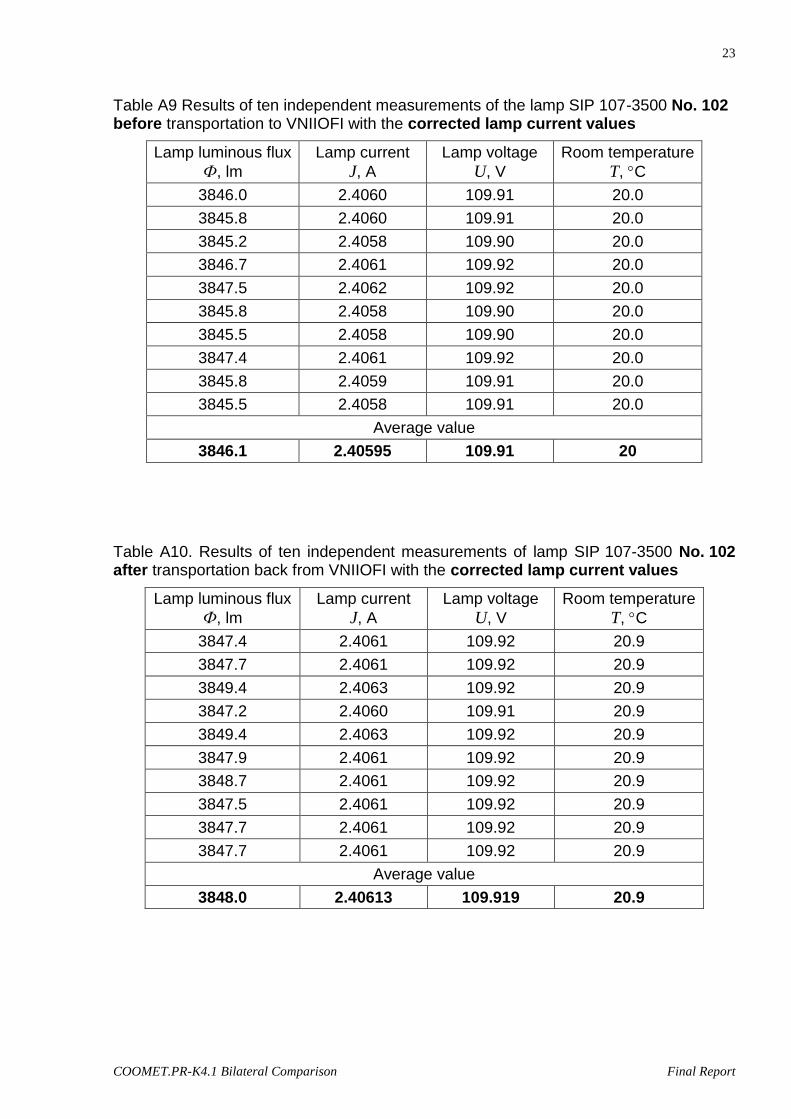
Table A9 Results of ten independent measurements of the lamp SIP 107-3500 No. 102 before transportation to VNIIOFI with the corrected lamp current values
Lamp luminous flux
Ф, lm
Lamp current
J, A
Lamp voltage
U, V
Room temperature
T, C
3846.0 2.4060 109.91 20.0
3845.8 2.4060 109.91 20.0
3845.2 2.4058 109.90 20.0
3846.7 2.4061 109.92 20.0
3847.5 2.4062 109.92 20.0
3845.8 2.4058 109.90 20.0
3845.5 2.4058 109.90 20.0
3847.4 2.4061 109.92 20.0
3845.8 2.4059 109.91 20.0
3845.5 2.4058 109.91 20.0
Average value
3846.1 2.40595 109.91 20
Table A10. Results of ten independent measurements of lamp SIP 107-3500 No. 102 after transportation back from VNIIOFI with the corrected lamp current values
Lamp luminous flux
Ф, lm
Lamp current
J, A
Lamp voltage
U, V
Room temperature
T, C
3847.4 2.4061 109.92 20.9
3847.7 2.4061 109.92 20.9
3849.4 2.4063 109.92 20.9
3847.2 2.4060 109.91 20.9
3849.4 2.4063 109.92 20.9
3847.9 2.4061 109.92 20.9
3848.7 2.4061 109.92 20.9
3847.5 2.4061 109.92 20.9
3847.7 2.4061 109.92 20.9
3847.7 2.4061 109.92 20.9
Average value
3848.0 2.40613 109.919 20.9
24
COOMET.PR-K4.1 Bilateral Comparison Final Report
Table A11 Results of ten independent measurements of the lamp SIP 107-3500 No. 26 before transportation to VNIIOFI with the corrected lamp current values
Lamp luminous flux
Ф, lm
Lamp current
J, A
Lamp voltage
U, V
Room temperature
T, C
3747.9 2.4356 109.02 20.3
3749.6 2.4357 109.02 20.3
3748.6 2.4357 109.02 20.3
3747.3 2.4356 109.02 20.3
3746.6 2.4355 109.02 20.3
3747.1 2.4356 109.02 20.3
3748.0 2.4356 109.03 20.3
3747.3 2.4356 109.02 20.3
3746.6 2.4354 109.01 20.3
3745.9 2.4354 109.02 20.3
Average value
3747.5 2.43556 109.02 20.3
Table A12. Results of ten independent measurements of the lamp SIP 107-3500 No. 26 after transportation back from VNIIOFI with the corrected lamp current values
Lamp luminous flux
Ф, lm
Lamp current
J, A
Lamp voltage
U, V
Room temperature
T, C
3748.9 2.4358 109.05 21.1
3748.8 2.4357 109.04 21.1
3750.2 2.4359 109.05 21.1
3749.3 2.4358 109.05 21.1
3748.1 2.4359 109.05 21.1
3751.8 2.4357 109.04 21.1
3749.6 2.4358 109.05 21.1
3749.5 2.4358 109.04 21.1
3750.9 2.4358 109.05 21.1
3750.3 2.4356 109.04 21.1
Average value
3749.7 2.43577 109.046 21.1
25
COOMET.PR-K4.1 Bilateral Comparison Final Report
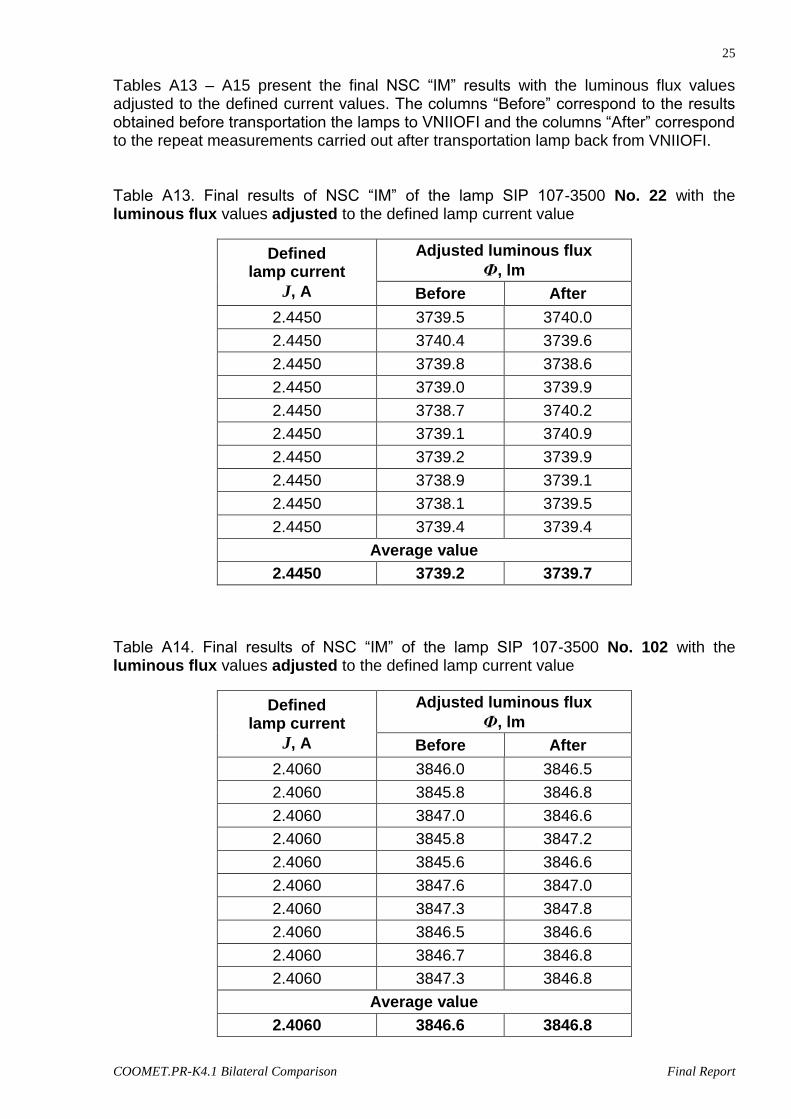
Tables A13 – A15 present the final NSC “IM” results with the luminous flux values adjusted to the defined current values. The columns “Before” correspond to the results obtained before transportation the lamps to VNIIOFI and the columns “After” correspond to the repeat measurements carried out after transportation lamp back from VNIIOFI. Table A13. Final results of NSC “IM” of the lamp SIP 107-3500 No. 22 with the luminous flux values adjusted to the defined lamp current value
Defined lamp current
J, A
Adjusted luminous flux
Ф, lm
Before After
2.4450 3739.5 3740.0
2.4450 3740.4 3739.6
2.4450 3739.8 3738.6
2.4450 3739.0 3739.9
2.4450 3738.7 3740.2
2.4450 3739.1 3740.9
2.4450 3739.2 3739.9
2.4450 3738.9 3739.1
2.4450 3738.1 3739.5
2.4450 3739.4 3739.4
Average value
2.4450 3739.2 3739.7
Table A14. Final results of NSC “IM” of the lamp SIP 107-3500 No. 102 with the luminous flux values adjusted to the defined lamp current value
Defined lamp current
J, A
Adjusted luminous flux
Ф, lm
Before After
2.4060 3846.0 3846.5
2.4060 3845.8 3846.8
2.4060 3847.0 3846.6
2.4060 3845.8 3847.2
2.4060 3845.6 3846.6
2.4060 3847.6 3847.0
2.4060 3847.3 3847.8
2.4060 3846.5 3846.6
2.4060 3846.7 3846.8
2.4060 3847.3 3846.8
Average value
2.4060 3846.6 3846.8
26
COOMET.PR-K4.1 Bilateral Comparison Final Report
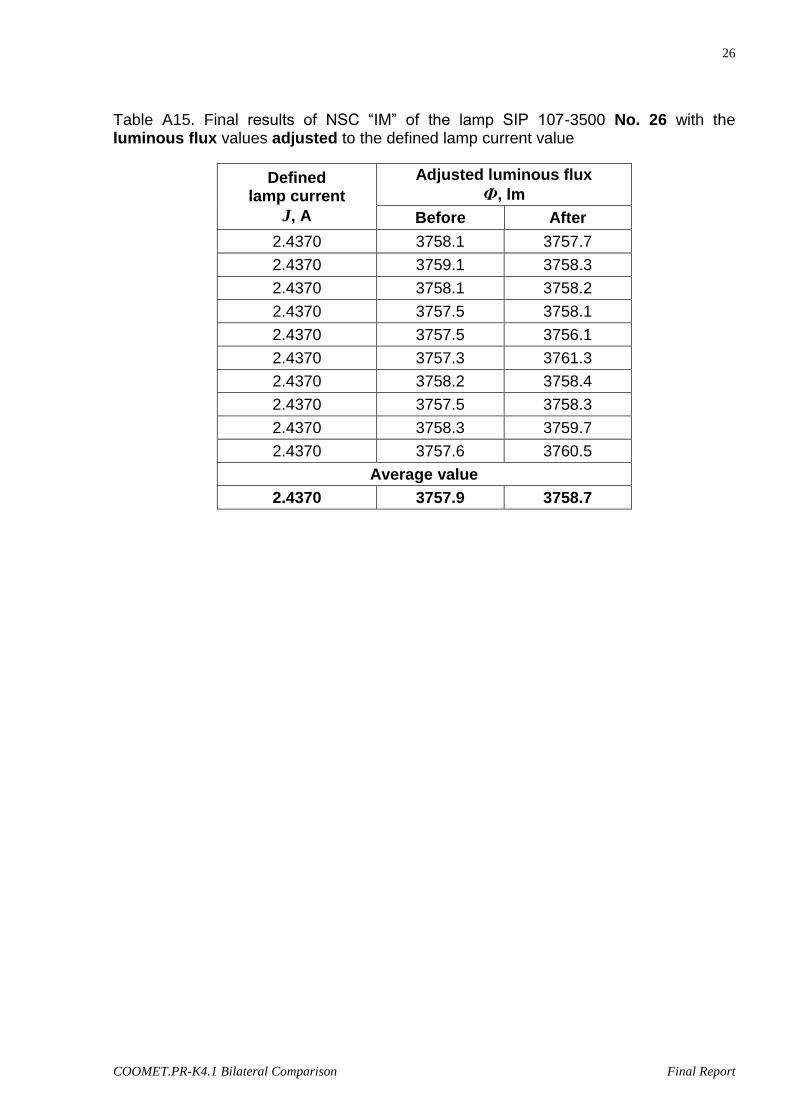
Table A15. Final results of NSC “IM” of the lamp SIP 107-3500 No. 26 with the luminous flux values adjusted to the defined lamp current value
Defined lamp current
J, A
Adjusted luminous flux
Ф, lm
Before After
2.4370 3758.1 3757.7
2.4370 3759.1 3758.3
2.4370 3758.1 3758.2
2.4370 3757.5 3758.1
2.4370 3757.5 3756.1
2.4370 3757.3 3761.3
2.4370 3758.2 3758.4
2.4370 3757.5 3758.3
2.4370 3758.3 3759.7
2.4370 3757.6 3760.5
Average value
2.4370 3757.9 3758.7