Embed Size (px)
Citation preview

© Copyright WEQAS 2015. All rights reserved. No part of this document may be reproduced or utilised in any form without permission from WEQAS
Bile Acids SchemeGuide

Filename: SP-QL1-
BILEGUIDE0315
Authorised by:
M.A Thomas
Date of Revision:
12/03/15
Version 1.9 Page 2 of 12
Contents
1. Scheme details and repertoire………………………...............…………….3
2. Source Material and Serum Integrity………............………………….….3
2.1 Sterility…………………………….........................………………………3
2.2 Sample stability….…...................……………………………………..4
3 ID-GCMS Target assessment
3.1 Bile acid Recovery to ID- GCMS….............………....…………..4
3.2 Specificity Recovery experiment 2008…….......……......…….5
3.3 Specificity Recovery experiment 2012…….......……..…....….6
4 Statistical Analysis……………………..…………......................…….………7
4.1 Performance Criteria………………...............…..………………….8
4.2 Method Performance…………..….................…………………….8-9

Filename: SP-QL1-
BILEGUIDE0315
Authorised by:
M.A Thomas
Date of Revision:
12/03/15
Version 1.9 Page 3 of 12
1. Scheme Details and Repetoire.
List of Analytes and Frequency of Distribution Frequency : Monthly Number of samples: 3
Analyte Approx. Range Covered
Total Bile acids 5 - 100 µmol/l
This guide illustrates the design of the Scheme from sample preparation to dispatch of participants’ reports. It includes data on interlaboratory variation, method bias and stability over the 12 month batch. The bile acid scheme provides ID-GCMS target values for the individual bile acids, chenodeoxycholic acid, cholic acid and deoxycholic acid. In the absence of a true reference method the sum of the individual bile acids provides the current ‘gold standard’ for Total Bile Acids.
2. Source Material and Serum Integrity
The material is human serum, tested negative for HIV, Hepatitis B and C at donor level, spiked with a mixture of bile acids. WEQAS samples are prepared to reflect the bile acids found in obstetric cholestasis, with Cholic acid used as the predominant bile acid. Additional bile acids in the form of Chenodeoxycholic acid and Deoxycholic acid are also included. The overall ratio is usually 3.4: 1 for Cholic acid and the other bile acids respectively. Although every effort is made to ensure that the material is free from any known infectious agent, the samples should be handled as for clinical specimens.
2.1 Sterility
The pools are filtered aseptically down to a 0.2m, and gentamicin added to maintain sterility. Preservatives such as sodium azide are not added as these are known to inhibit certain immuno enzymatic methods. Great care is taken to ensure that aseptic techniques are used throughout all procedures to maintain sterility. The serum is dispensed aseptically into 0.5ml aliquots and stored
at -20C until dispatched. The samples are dispatched by first class mail as frozen samples packaged in containers conforming to Post Office guidelines.
2.2 Sample Stability
Short term stability. Stability experiments were carried out over a period of 14 days at room temperature, fridge(4°) and at -20°C. The total bile acid concentration over this period showed no deterioration at any of the specified temperatures.

Filename: SP-QL1-
BILEGUIDE0315
Authorised by:
M.A Thomas
Date of Revision:
12/03/15
Version 1.9 Page 4 of 12
Long term stability at -20C
The 2 pools relate to processed serum samples stored at -20C and dispatched over a period of several months. Pool 2 and Pool 7 (Batch 101205) were each dispatched 3 times over a 13 month period.
BILE ACID STABILITY
0
20
40
60
80
1 3 5 7 9 11 13
PERIOD IN MONTHS
OV
ER
AL
L M
EA
N
(um
ol/
L)
POOL 2
POOL 7
3 ID-GCMS Target assessment The ID-GCMS method analyses the three major bile acids present: Cholic acid, Deoxycholic acid and Chenodeoxycholic acid as separate specific entities. Gravimetric analysis is used throughout, allowing uncertainty measurements to be estimated according to GUM, with traceability by use of gravimetrically prepared QC material. Each bile acid is chemically derivatised to form the methyl trimethylsilyl ether derivative prior to analysis (figure 2). Standardisation was achieved by use of the purest form of each bile acid available (table 1). No certified material is currently available for these bile acids. Analytical control was assessed using gravimetrically prepared serum as internal QC material (table 2). For the purposes of EQA evaluation, the results for each of the three bile acid targets are combined to produce a total bile acid target value. For the purpose of this recovery experiment, where single bile acids were spiked, the target value represents each individual bile acid. This target value would also include any endogenous bile acid present in the base serum.
3.1 Bile acid Recovery to ID- GCMS The recovery of the routine bile acid methods were compared with the “weighed in “ value and GCMS data. Recovery was calculated for the pools spiked with the individual bile acids: cholic acid, deoxycholic acid and chenodeoxycholic acid and a mixture of the three bile acids.
Filename: SP-QL1-
BILEGUIDE0315
Authorised by:
M.A Thomas
Date of Revision:
12/03/15
Version 1.9 Page 5 of 12
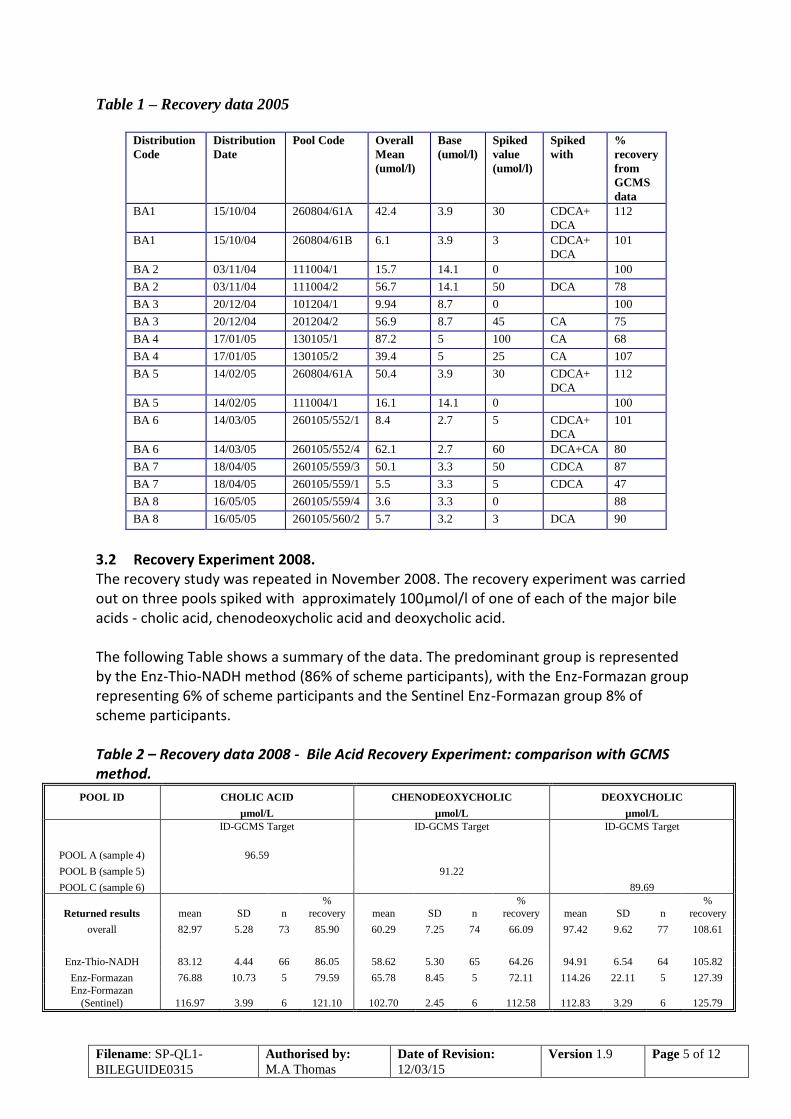
Table 1 – Recovery data 2005
Distribution
Code
Distribution
Date
Pool Code Overall
Mean
(umol/l)
Base
(umol/l)
Spiked
value
(umol/l)
Spiked
with
%
recovery
from
GCMS
data
BA1 15/10/04 260804/61A 42.4 3.9 30 CDCA+
DCA
112
BA1 15/10/04 260804/61B 6.1 3.9 3 CDCA+
DCA
101
BA 2 03/11/04 111004/1 15.7 14.1 0 100
BA 2 03/11/04 111004/2 56.7 14.1 50 DCA 78
BA 3 20/12/04 101204/1 9.94 8.7 0 100
BA 3 20/12/04 201204/2 56.9 8.7 45 CA 75
BA 4 17/01/05 130105/1 87.2 5 100 CA 68
BA 4 17/01/05 130105/2 39.4 5 25 CA 107
BA 5 14/02/05 260804/61A 50.4 3.9 30 CDCA+
DCA
112
BA 5 14/02/05 111004/1 16.1 14.1 0 100
BA 6 14/03/05 260105/552/1 8.4 2.7 5 CDCA+
DCA
101
BA 6 14/03/05 260105/552/4 62.1 2.7 60 DCA+CA 80
BA 7 18/04/05 260105/559/3 50.1 3.3 50 CDCA 87
BA 7 18/04/05 260105/559/1 5.5 3.3 5 CDCA 47
BA 8 16/05/05 260105/559/4 3.6 3.3 0 88
BA 8 16/05/05 260105/560/2 5.7 3.2 3 DCA 90
3.2 Recovery Experiment 2008. The recovery study was repeated in November 2008. The recovery experiment was carried out on three pools spiked with approximately 100µmol/l of one of each of the major bile acids - cholic acid, chenodeoxycholic acid and deoxycholic acid. The following Table shows a summary of the data. The predominant group is represented by the Enz-Thio-NADH method (86% of scheme participants), with the Enz-Formazan group representing 6% of scheme participants and the Sentinel Enz-Formazan group 8% of scheme participants. Table 2 – Recovery data 2008 - Bile Acid Recovery Experiment: comparison with GCMS method.
POOL ID CHOLIC ACID CHENODEOXYCHOLIC DEOXYCHOLIC
µmol/L µmol/L µmol/L
ID-GCMS Target
ID-GCMS Target
ID-GCMS Target
POOL A (sample 4) 96.59
POOL B (sample 5) 91.22
POOL C (sample 6) 89.69
Returned results mean SD n
%
recovery mean SD n
%
recovery mean SD n
%
recovery
overall 82.97 5.28 73 85.90 60.29 7.25 74 66.09 97.42 9.62 77 108.61
Enz-Thio-NADH 83.12 4.44 66 86.05 58.62 5.30 65 64.26 94.91 6.54 64 105.82
Enz-Formazan 76.88 10.73 5 79.59 65.78 8.45 5 72.11 114.26 22.11 5 127.39
Enz-Formazan
(Sentinel) 116.97 3.99 6 121.10 102.70 2.45 6 112.58 112.83 3.29 6 125.79
Filename: SP-QL1-
BILEGUIDE0315
Authorised by:
M.A Thomas
Date of Revision:
12/03/15
Version 1.9 Page 6 of 12
Poor recoveries were observed for chenodeoxycholic and cholic acid for all methods. However, as similar specificities were observed for all the bile acid compounds for the Sentinel method this could potentially be addressed through re-standardisation. The variability in specificity of the other methods however suggests that harmonisation of these methods may not be achieved easily. The study highlights the importance of using reference methods to assign target values (refer to section 3 on statistical analysis), rather than consensus mean and presents strong evidence on the variability in specificities of the methods for the different bile acids. The full report for this experiment is available on request.
3.3 Recovery experiment 2012 Recovery experiments were repeated in November 2012 (distribution BA93), with the inclusion of Ursodeoxycholic acid. Ursodeoxycholic acid is a dihydroxycholic bile acid. This physiologically represents about 3% of total bile acid concentration. It is synthesised from 7-ketolithocholic acid which is a product of bacterial oxidation of Chenodeoxycholic. Chemically Ursodeoxycholic acid differs from Chenodeoxycholic only in the equatorial oxidation of the 7β hydroxyl group. This makes Ursodeoxycholic acid more hydrophilic than the other bile acids. This high polarity correlates with the low potential to form micelles, and is the reason for its extremely low toxicity. Pharmacologically it is administered for the treatment of cholestatic disease (biliary cirrhosis, obstetric cholestasis) and gallstones. Its therapeutic effect in hepatic and cholestatic disease is thought to be due to a relative exchange of lipophilic toxic bile acid (cholic acid) for the hydrophilic cytoprotective, non toxic Ursodeoxycholic acid.
Four extra samples were therefore distributed to all participants of the bile acid scheme, each containing only one of the individual bile acids. A summary of the method data is provided in Table 3.

Filename: SP-QL1-
BILEGUIDE0315
Authorised by:
M.A Thomas
Date of Revision:
12/03/15
Version 1.9 Page 7 of 12
Table 3 – Recovery data 2012. Bile Acid Recovery Experiment: comparison with GCMS Method
POOL ID CHOLIC ACID DEOXYCHOLIC
µmol/L µmol/L
ID-GCMS Target ID-GCMS Target
POOL A (sample 4) 103.18
POOL B (sample 5) 108.78
POOL C (sample 6)
POOL D (sample 7)
Returned results mean SD n % recovery mean SD n % recovery
overall 101.18 7.54
11
1 98.06 137.80 15.87 110 126.68
Enz-Thio-NADH 99.89 6.59 95 96.81 141.27 15.64 94 129.87
Enz-Formazan 89.5 1.50 5 86.74 137.00 15.00 2 125.94
Enz-Formazan (Sentinel) 112.41 4.90 15 108.95 119.42 5.08 15 109.78
POOL ID URSODEOXYCHOLIC CHENODEOXYCHOLIC
µmol/L µmol/L
Spiked Target ID-GCMS Target
POOL A (sample 4)
POOL B (sample 5)
POOL C (sample 6) 77.14
POOL D (sample 7) 100
Returned results mean SD n % recovery mean SD n % recovery
overall 57.81 8.44
10
7 57.81 56.05 7.30 107 72.66
Enz-Thio-NADH 56.00 4.44 98 56.00 54.25 4.61 95 70.32
Enz-Formazan 51.50 0.5 2 51.50 51.00 2.00 2 66.11
Enz-Formazan (Sentinel) 90.47 3.33 15 90.47 77.05 2.88 12 99.88
Table 3 shows a wide variation in the performance of the commercially available methods for the analysis of total bile acids. For Cholic acid, there is improvement from the previous study, with good agreement with the ID-GCMS method for the Enz-Thio-NADH group with a negative bias of -3%. For Enz-Formazan a negative bias of -13% was, and the Sentinel group had a positive bias of +9%. For Deoxycholic acid the Enz-Thio-NADH method had a positive bias of +30%. The Enz-Formazan and ENZ-Formazan (Sentinel) had a positive bias of +26% and +10% respectively. For Chenodeoxycholic acid, these methods had a negative bias of -30% and -34% respectively, with a recovery for the
Sentinel kit of 99.9%. The data for Ursodeoxycholic acid mirrors that of Chenodeoxycholic acid. As in prevuious studies, similar specificities were observed for all the bile acid compounds for the Sentinel method with improved concordance with the GCMS method.
The study highlights the importance of using reference methods to assign target values rather than consensus mean and presents strong evidence on the variability in specificities of the methods for the different bile acids.
The full report for this experiment may be obtained on request.

Filename: SP-QL1-
BILEGUIDE0315
Authorised by:
M.A Thomas
Date of Revision:
12/03/15
Version 1.9 Page 8 of 12
4. Statistical Analysis Please refer to the accompanying Participants Manual for full details on statistical analysis and interpretation of results.
Typical Report
GCMS target value information is shown on the front of the report. See example below:

Filename: SP-QL1-
BILEGUIDE0315
Authorised by:
M.A Thomas
Date of Revision:
12/03/15
Version 1.9 Page 9 of 12
4.1 Performance Criteria
Standard deviation limits used in the report are based on precision profiles calculated over several batches and are fixed for a given level of analyte. They are reviewed yearly and reflect the state of the art of the methods used. Precision profiles A plot of the overall Standard Deviation against concentration is given over the distributions. The data reflects the interlaboratory variation and the bias between the methods currently in use.
4.2 Method Performance
Analytical performance of methods and instruments are available to participants for all Schemes on request. An overall summary of this data is issued with each distribution report. A summmary sheet example is shown overleaf:
Precision Profile (SD) - Bile Acid - updated Jan 2013
y = 0.1151x0.8595
R2 = 0.962
y = 0.0004x2 + 0.0388x + 0.9381
R2 = 0.8916
0
2
4
6
8
10
12
0 20 40 60 80 100 120
Overall mean (umol/l)
SD
Dist 1 -8
Dist 9-36
Dist 37-48
Dist 49-60
Dist 61-72
Dist 73-84
Dist 85-96
Dist 27-66
Power (Dist 85-96)
Poly. (Dist 27-66)

Filename: SP-QL1-
BILEGUIDE0315
Authorised by:
M.A Thomas
Date of Revision:
12/03/15
Version 1.9 Page 10 of 12
Distribution: BA96
Distribution Date: 26-Sep-12
Analyte: Total Bile Acids (µmol/L)
Method Instrument 1 2 3
Overall Mean 19.07 88.58 55.96
Overall SD 1.32 4.48 3.00
Est. Uncertainty of Consensus 0.120 0.418 0.276
Overall Number 121 115 118
Reference Value NS ID-GCMS 13.29 86.40 49.89
ENZ-Thio-NADH Method Mean 19.14 87.99 55.74
Method SD 1.37 4.55 3.01
Est. Uncertainty of Consensus 0.135 0.460 0.301
Number 103 98 100
Advia 1200/1650/1800/2400 Instrument Mean 19.14 85.83 54.57
Instrument SD 1.81 6.09 3.84
Number 16 16 16
AU2700/AU5400/AU5800 Instrument Mean 18.85 87.77 55.87
Instrument SD 0.89 4.74 2.60
Number 6 6 6
AU400/600/640/680 Instrument Mean 19.56 92.10 58.24
Instrument SD 0.56 3.63 2.69
Number 9 9 9
Modular Instrument Mean 18.65 85.81 54.56
Instrument SD 1.05 2.40 2.26
Number 16 16 17
Konelab 20/30/60/i Instrument Mean 17.27 79.93 50.13
Instrument SD 1.79 5.98 4.92
Number 3 3 3
Architect Instrument Mean 19.16 91.00 57.50
Instrument SD 1.10 2.08 1.80
Number 7 6 6
DX Instrument Mean 19.76 89.01 57.41
Instrument SD 1.17 2.60 1.77
Number 8 7 7
Vitros 5,1 FS Instrument Mean 19.80 90.33 57.89
Instrument SD 0.64 2.78 1.78
Number 7 7 7
Cobas C Module Instrument Mean 19.23 89.40 56.77
Instrument SD 0.63 4.34 2.08
Number 21 23 22
ENZ-FORMAZAN Modular Method Mean 17.00 82.00 50.50
Method SD 1.0 1.0 1.5
Est. Uncertainty of Consensus 0.707 0.707 1.061
Number 2 2 2
ENZ-Formazan (Sentinel) Method Mean 18.80 92.29 57.99
Method SD 0.50 2.37 1.21
Est. Uncertainty of Consensus 0.129 0.593 0.303
Number 15 16 16
Architect Instrument Mean 18.86 91.74 57.92
Instrument SD 0.46 1.93 1.26
Number 14 13 14
DX Instrument Mean 19.0 93.5 58.5
Instrument SD 1.0 2.5 0.5
Number 2 2 2
Bile Acid Summary Sheet BA96

Filename: SP-QL1-
BILEGUIDE0315
Authorised by:
M.A Thomas
Date of Revision:
12/03/15
Version 1.9 Page 11 of 12

© Copyright WEQAS 2015. All rights reserved. No part of this document may be reproduced or utilised in any form without permission from WEQAS