Embed Size (px)
Citation preview

Bilfinger SE Company Presentation
January 12 – 14, 2015
Commerzbank German Investment Seminar 2015, New York City Herbert Bodner, CEO Andreas Müller, Head of Corporate Accounting & Tax / IR Bettina Schneider, Deputy Head IR
1. Bilfinger at a glance
2. Key points of midterm corporate development
3. Facts and figures 9m 2014
4. Financial backup
Agenda
Bilfinger SE Company Presentation | January 12 - 14, 2015 page 2
2014: A difficult year for Bilfinger
▪ Building and Facility: Positive business development
▪ Industrial: Demanding environment
▪ Power: Difficult market environment due to structural problems
▪ Earnings expectations significantly lowered in the course of the year
▪ Changes in Executive Board
▪ Changes in Supervisory Board
▪ Share price has suffered significantly
Bilfinger SE Company Presentation | January 12 - 14, 2015 page 3
Latest ad-hoc release (December 22, 2014) Bilfinger sells Construction division to Implenia
Bilfinger SE Company Presentation | January 12 - 14, 2015 page 4
Implenia will acquire Construction division, which is active in Germany and other European countries Employees: nearly 1,900 Output volume: approx. €600 million Net proceeds: approx. €230 million Enterprise value: a good €100 million, EV/EBIT of approx. 6 Cash inflow: approx. €60 million (before transaction expenses) Capital gain in the low double-digit million €-range, taking into account a risk provision Transaction is subject to approval from German and international anti-trust authorities and completion is expected in Q1 2015 With regard to remaining Polish construction business, Bilfinger is in contact with other interested parties
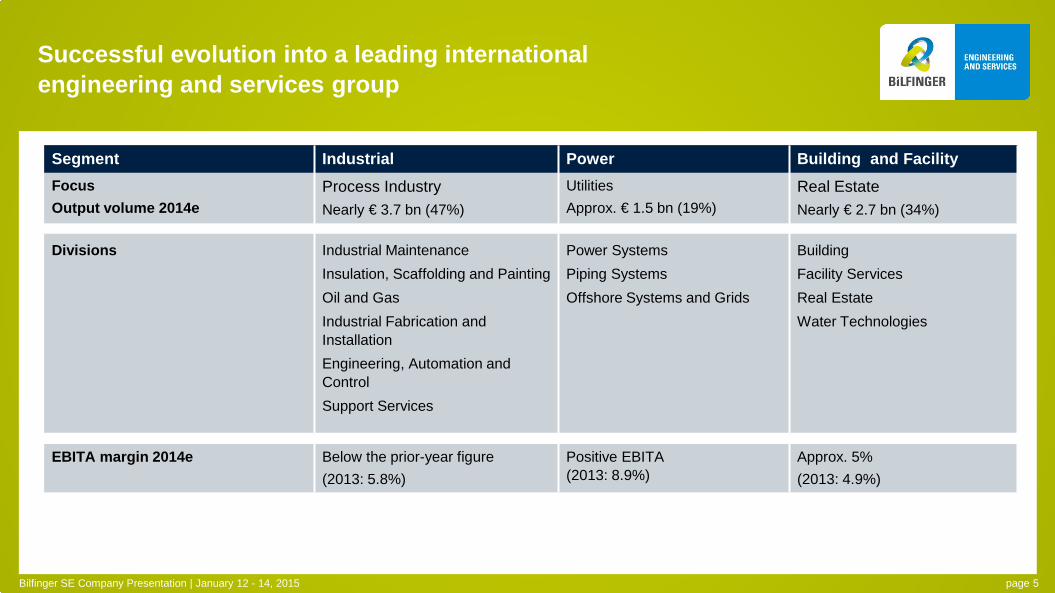
Successful evolution into a leading international engineering and services group
Segment Industrial Power Building and Facility Focus Output volume 2014e
Process Industry Nearly € 3.7 bn (47%)
Utilities Approx. € 1.5 bn (19%)
Real Estate Nearly € 2.7 bn (34%)
Divisions Industrial Maintenance Insulation, Scaffolding and Painting Oil and Gas Industrial Fabrication and Installation Engineering, Automation and Control Support Services
Power Systems Piping Systems Offshore Systems and Grids
Building Facility Services Real Estate Water Technologies
EBITA margin 2014e Below the prior-year figure (2013: 5.8%)
Positive EBITA (2013: 8.9%)
Approx. 5% (2013: 4.9%)
Bilfinger SE Company Presentation | January 12 - 14, 2015 page 5
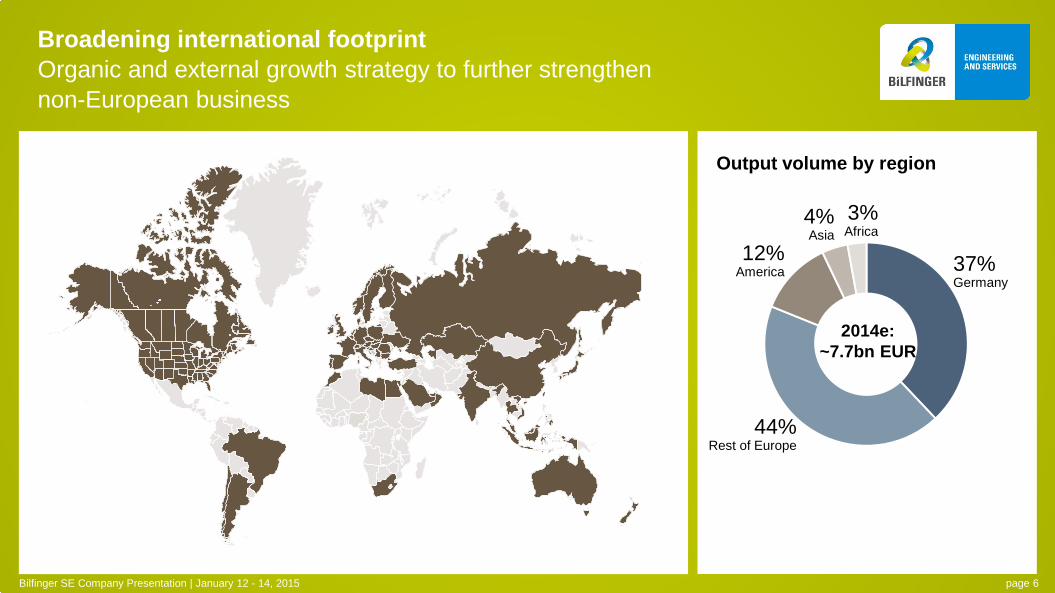
Broadening international footprint Organic and external growth strategy to further strengthen non-European business
Output volume by region
2014e: ~7.7bn EUR
37% Germany
12% America
Bilfinger SE Company Presentation | January 12 - 14, 2015 page 6
3% Africa
4% Asia
44% Rest of Europe
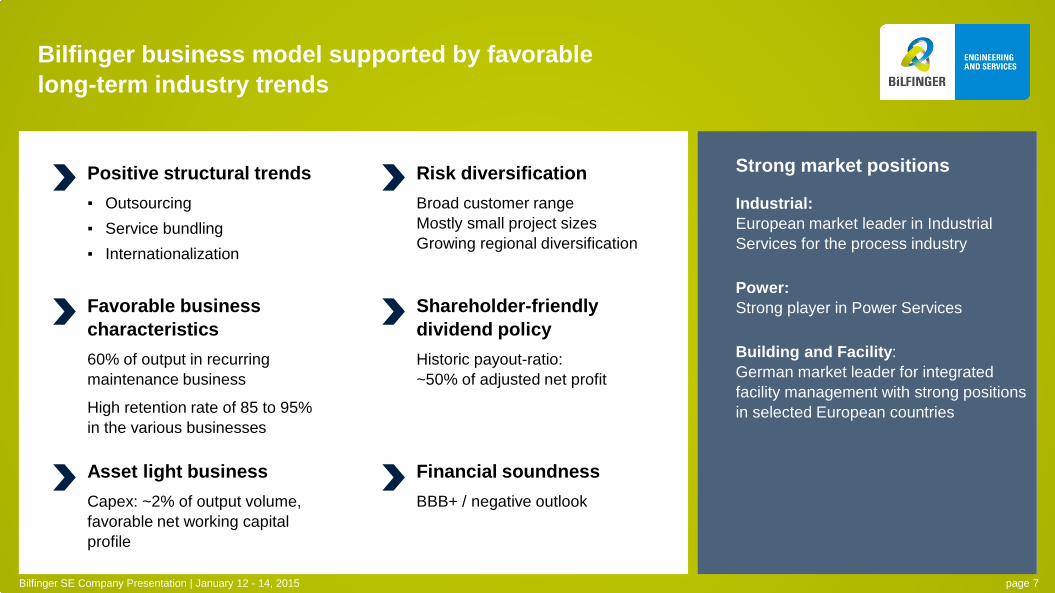
Bilfinger business model supported by favorable long-term industry trends
Bilfinger SE Company Presentation | January 12 - 14, 2015 page 7
Positive structural trends ▪ Outsourcing ▪ Service bundling ▪ Internationalization
Financial soundness BBB+ / negative outlook
Favorable business characteristics 60% of output in recurring maintenance business
High retention rate of 85 to 95% in the various businesses
Strong market positions
Industrial: European market leader in Industrial Services for the process industry
Power: Strong player in Power Services
Building and Facility: German market leader for integrated facility management with strong positions in selected European countries
Risk diversification Broad customer range Mostly small project sizes Growing regional diversification
Asset light business Capex: ~2% of output volume, favorable net working capital profile
Shareholder-friendly dividend policy Historic payout-ratio: ~50% of adjusted net profit

1. Bilfinger at a glance
2. Key points of midterm corporate development
3. Facts and figures 9m 2014
4. Financial backup
Agenda
Bilfinger SE Company Presentation | January 12 - 14, 2015 page 8
Key points of midterm corporate development Evolution into a services group largely completed
Improving the Group’s operating performance
▪ Measures taken to improve the Group’s operating performance are of key importance
▪ Measures apply above all to Power, which requires a fundamental realignment of its activities in view of market developments, and to some areas of Industrial
Development of service offering, internationalization of business activities
▪ Focusing our business operations on sectors and regional markets that offer best prospects for the future
▪ Developing ourselves into a provider of premium services through the targeted adjustment of our service range
▪ Internationalization will also play a key role In light of the weakness of several European core markets Growth opportunities above all in North America, but also in markets such as India, Turkey and the Middle East
▪ Initial focus on strengthening our current business In the future, once again, also business development via acquisitions New activities must demonstrate significant synergy potential with existing range of services
Bilfinger SE Company Presentation | January 12 - 14, 2015 page 9
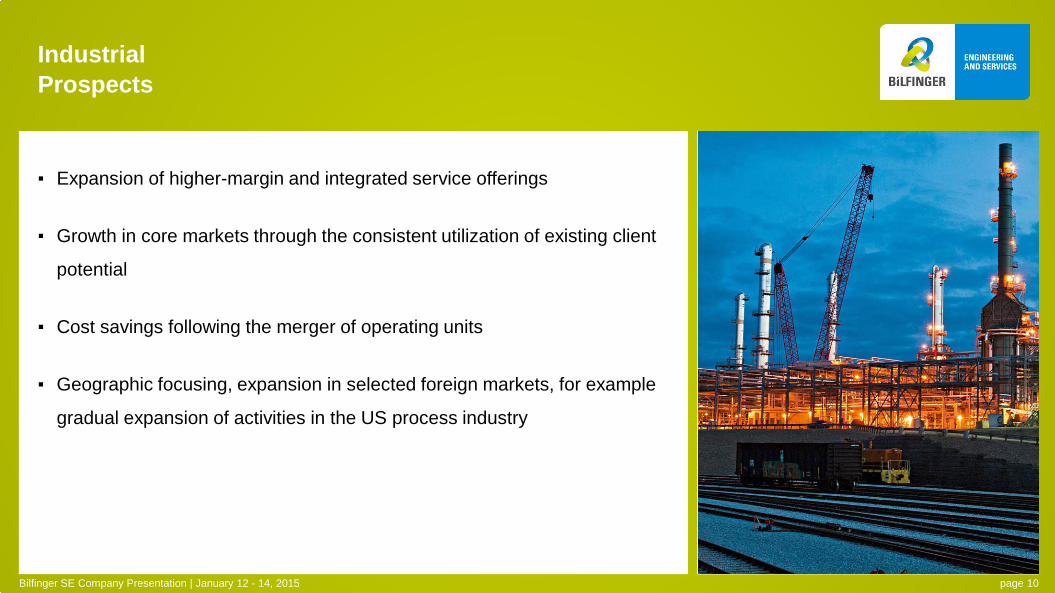
▪ Expansion of higher-margin and integrated service offerings
▪ Growth in core markets through the consistent utilization of existing client
potential
▪ Cost savings following the merger of operating units
▪ Geographic focusing, expansion in selected foreign markets, for example
gradual expansion of activities in the US process industry
Industrial Prospects
Bilfinger SE Company Presentation | January 12 - 14, 2015 page 10
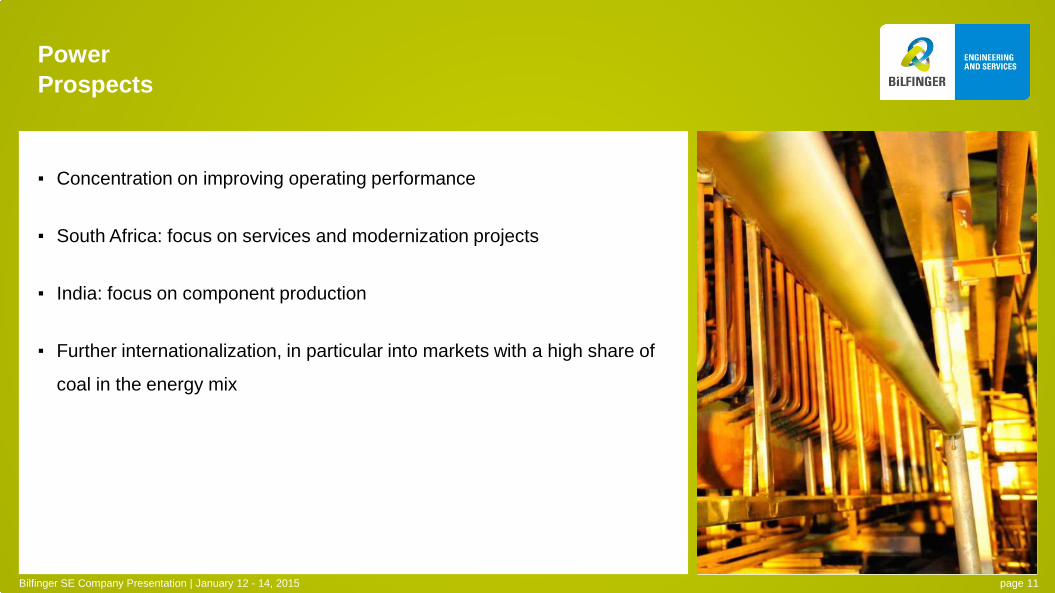
▪ Concentration on improving operating performance
▪ South Africa: focus on services and modernization projects
▪ India: focus on component production
▪ Further internationalization, in particular into markets with a high share of
coal in the energy mix
Power Prospects
Bilfinger SE Company Presentation | January 12 - 14, 2015 page 11

▪ Taking advantage of the outsourcing trend for real-estate services
• Expansion of business with premium services, for example real-estate valuation or transaction consulting
• Increased management of international real-estate portfolios in Europe
• Further expansion of facility management services for IT companies
• In Building business, increased focus on consulting, design, logistics and other specialized services
Building and Facility Prospects
Bilfinger SE Company Presentation | January 12 - 14, 2015 page 12
•
1. Bilfinger at a glance
2. Key points of midterm corporate development
3. Facts and figures 9m 2014
4. Financial backup
Agenda
Bilfinger SE Company Presentation | January 12 - 14, 2015 page 13
Stable output volume; lower EBITA, as expected Goodwill impairments lead to net loss Orders received impacted by difficult market environment Despite loss from continuing operations, operating cash flow slightly improved due to more favorable working capital development Outlook for adjusted EBITA and adjusted net profit in 2014 confirmed Sale of construction activities progressing as planned
9m 2014: Highlights
Bilfinger SE Company Presentation | January 12 - 14, 2015 page 14
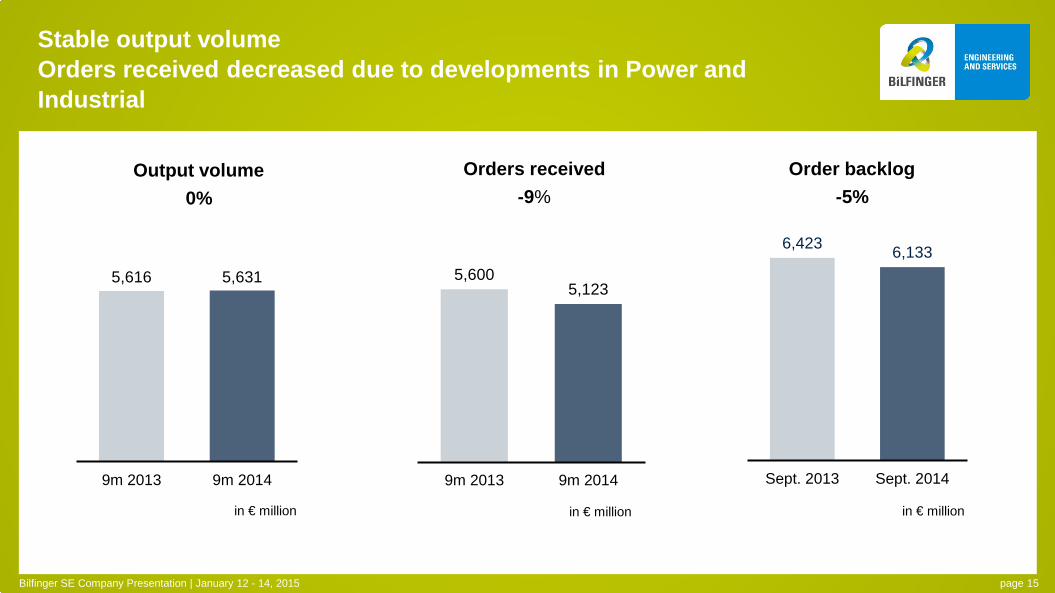
6,423 6,133
Sept. 2013 Sept. 2014
Stable output volume Orders received decreased due to developments in Power and Industrial
Order backlog -5%
Orders received -9%
Output volume 0%
5,616 5,631
9m 2013 9m 2014
5,600 5,123
9m 2013 9m 2014
in € million in € million in € million
Bilfinger SE Company Presentation | January 12 - 14, 2015 page 15
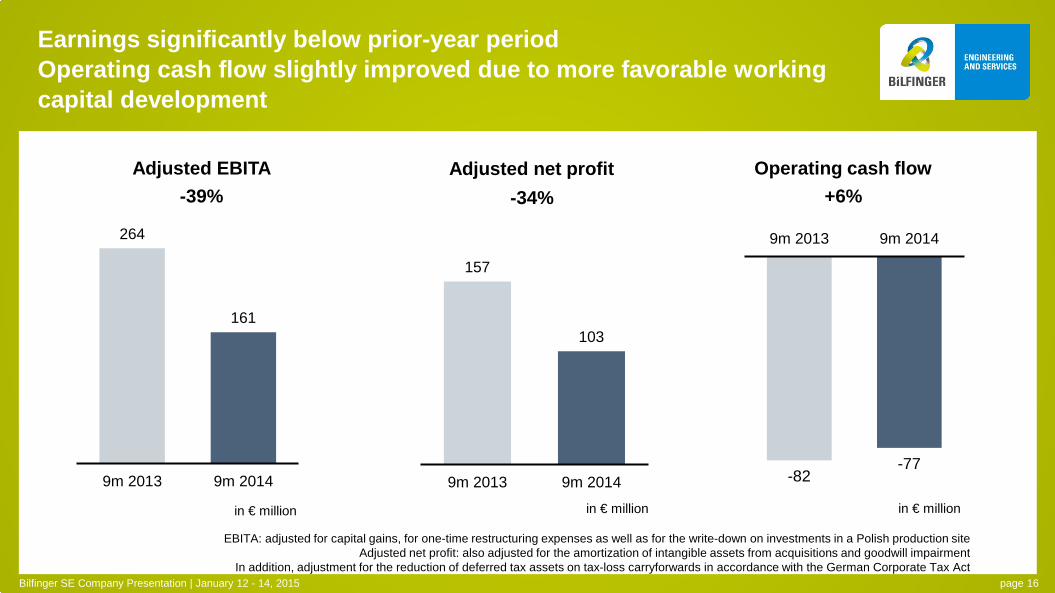
Adjusted EBITA -39%
264
161
9m 2013 9m 2014
157
103
9m 2013 9m 2014
Adjusted net profit -34%
Earnings significantly below prior-year period Operating cash flow slightly improved due to more favorable working capital development
EBITA: adjusted for capital gains, for one-time restructuring expenses as well as for the write-down on investments in a Polish production site Adjusted net profit: also adjusted for the amortization of intangible assets from acquisitions and goodwill impairment
In addition, adjustment for the reduction of deferred tax assets on tax-loss carryforwards in accordance with the German Corporate Tax Act Bilfinger SE Company Presentation | January 12 - 14, 2015 page 16
in € million in € million
-82 -77
9m 2013 9m 2014
in € million
Operating cash flow +6%
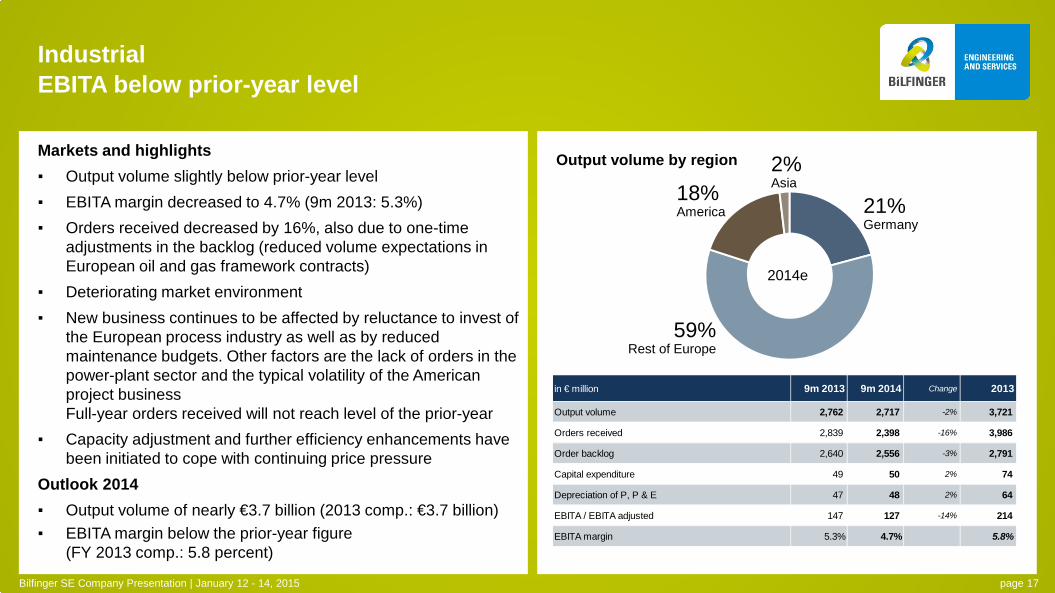
Markets and highlights ▪ Output volume slightly below prior-year level ▪ EBITA margin decreased to 4.7% (9m 2013: 5.3%) ▪ Orders received decreased by 16%, also due to one-time
adjustments in the backlog (reduced volume expectations in European oil and gas framework contracts)
▪ Deteriorating market environment ▪ New business continues to be affected by reluctance to invest of
the European process industry as well as by reduced maintenance budgets. Other factors are the lack of orders in the power-plant sector and the typical volatility of the American project business Full-year orders received will not reach level of the prior-year
▪ Capacity adjustment and further efficiency enhancements have been initiated to cope with continuing price pressure
Outlook 2014 ▪ Output volume of nearly €3.7 billion (2013 comp.: €3.7 billion) ▪ EBITA margin below the prior-year figure
(FY 2013 comp.: 5.8 percent)
Industrial EBITA below prior-year level
21% Germany
59% Rest of Europe
18% America
Output volume by region
2014e
Bilfinger SE Company Presentation | January 12 - 14, 2015 page 17
2% Asia
in € million 9m 2013 9m 2014 Change 2013
Output volume 2,762 2,717 -2% 3,721
Orders received 2,839 2,398 -16% 3,986
Order backlog 2,640 2,556 -3% 2,791
Capital expenditure 49 50 2% 74
Depreciation of P, P & E 47 48 2% 64
EBITA / EBITA adjusted 147 127 -14% 214
EBITA margin 5.3% 4.7% 5.8%
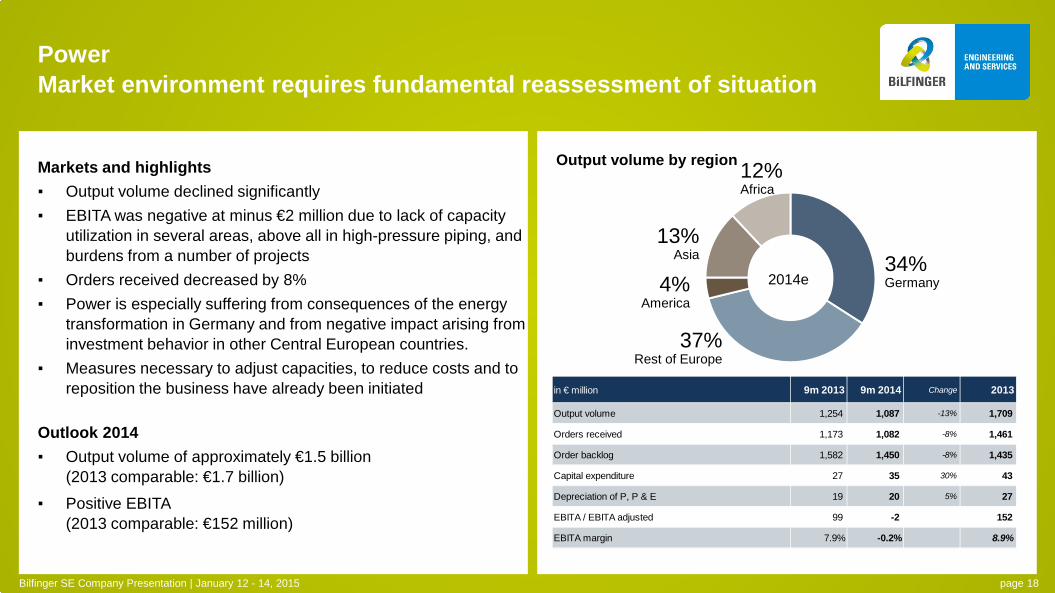
Markets and highlights ▪ Output volume declined significantly ▪ EBITA was negative at minus €2 million due to lack of capacity
utilization in several areas, above all in high-pressure piping, and burdens from a number of projects
▪ Orders received decreased by 8% ▪ Power is especially suffering from consequences of the energy
transformation in Germany and from negative impact arising from investment behavior in other Central European countries.
▪ Measures necessary to adjust capacities, to reduce costs and to reposition the business have already been initiated
Outlook 2014 ▪ Output volume of approximately €1.5 billion
(2013 comparable: €1.7 billion)
▪ Positive EBITA (2013 comparable: €152 million)
Power Market environment requires fundamental reassessment of situation
2014e
Bilfinger SE Company Presentation | January 12 - 14, 2015 page 18
37% Rest of Europe
4% America
12% Africa
13% Asia
34% Germany
Output volume by region
in € million 9m 2013 9m 2014 Change 2013
Output volume 1,254 1,087 -13% 1,709
Orders received 1,173 1,082 -8% 1,461
Order backlog 1,582 1,450 -8% 1,435
Capital expenditure 27 35 30% 43
Depreciation of P, P & E 19 20 5% 27
EBITA / EBITA adjusted 99 -2 152
EBITA margin 7.9% -0.2% 8.9%
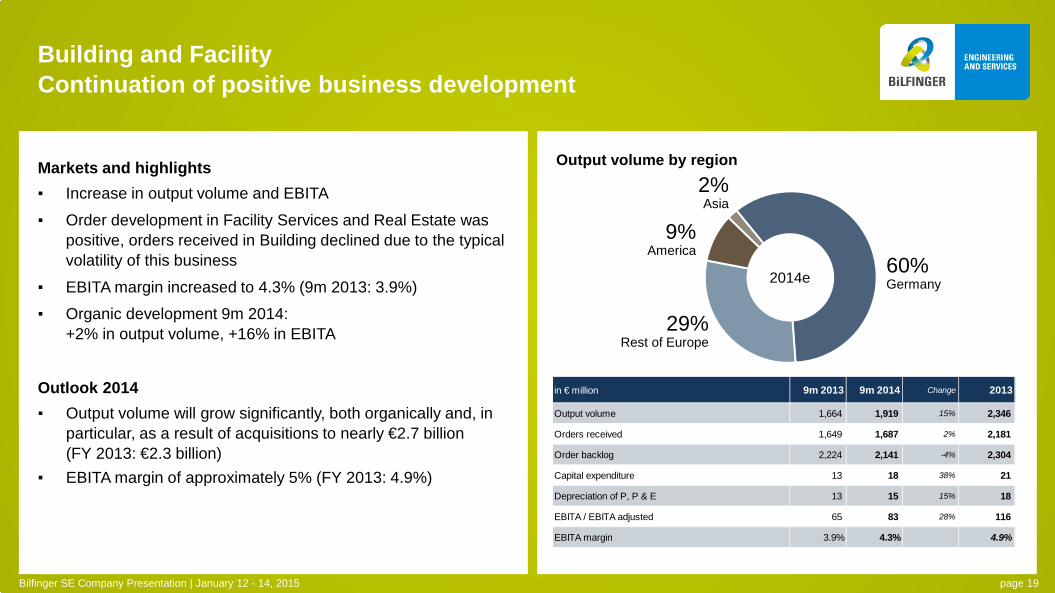
Markets and highlights ▪ Increase in output volume and EBITA
▪ Order development in Facility Services and Real Estate was positive, orders received in Building declined due to the typical volatility of this business
▪ EBITA margin increased to 4.3% (9m 2013: 3.9%)
▪ Organic development 9m 2014: +2% in output volume, +16% in EBITA
Outlook 2014 ▪ Output volume will grow significantly, both organically and, in
particular, as a result of acquisitions to nearly €2.7 billion (FY 2013: €2.3 billion)
▪ EBITA margin of approximately 5% (FY 2013: 4.9%)
Building and Facility Continuation of positive business development
2014e
Bilfinger SE Company Presentation | January 12 - 14, 2015 page 19
29% Rest of Europe
2% Asia
60% Germany
9% America
Output volume by region
in € million 9m 2013 9m 2014 Change 2013
Output volume 1,664 1,919 15% 2,346
Orders received 1,649 1,687 2% 2,181
Order backlog 2,224 2,141 -4% 2,304
Capital expenditure 13 18 38% 21
Depreciation of P, P & E 13 15 15% 18
EBITA / EBITA adjusted 65 83 28% 116
EBITA margin 3.9% 4.3% 4.9%
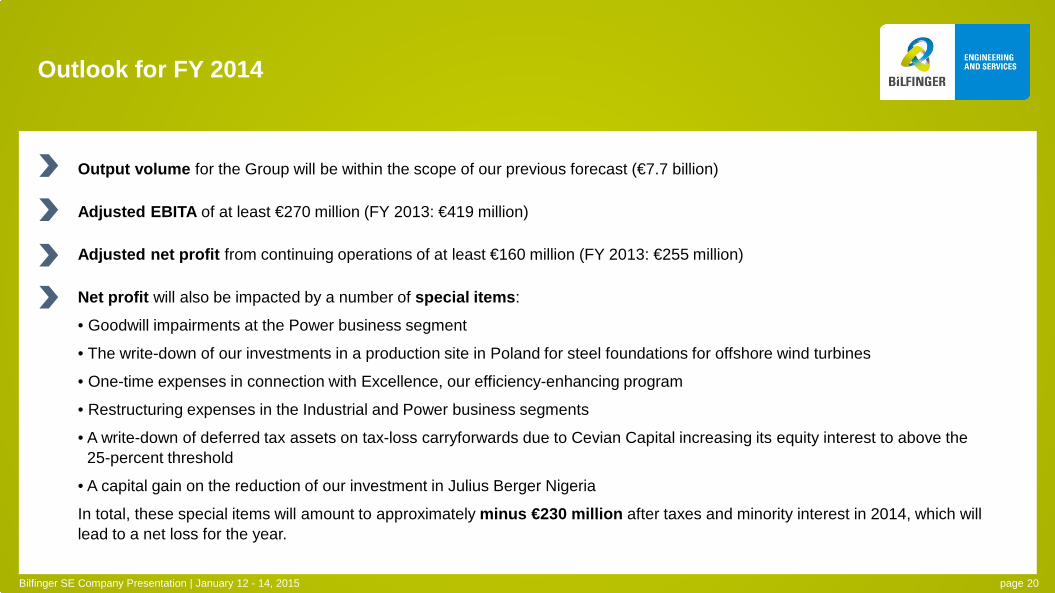
Outlook for FY 2014
Bilfinger SE Company Presentation | January 12 - 14, 2015 page 20
Output volume for the Group will be within the scope of our previous forecast (€7.7 billion)
Adjusted EBITA of at least €270 million (FY 2013: €419 million)
Adjusted net profit from continuing operations of at least €160 million (FY 2013: €255 million)
Net profit will also be impacted by a number of special items:
• Goodwill impairments at the Power business segment
• The write-down of our investments in a production site in Poland for steel foundations for offshore wind turbines
• One-time expenses in connection with Excellence, our efficiency-enhancing program
• Restructuring expenses in the Industrial and Power business segments
• A write-down of deferred tax assets on tax-loss carryforwards due to Cevian Capital increasing its equity interest to above the 25-percent threshold
• A capital gain on the reduction of our investment in Julius Berger Nigeria
In total, these special items will amount to approximately minus €230 million after taxes and minority interest in 2014, which will lead to a net loss for the year.

1. Bilfinger at a glance
2. Key points of midterm corporate development
3. Facts and figures 9m 2014
4. Financial backup
Agenda
Bilfinger SE Company Presentation | January 12 - 14, 2015 page 21
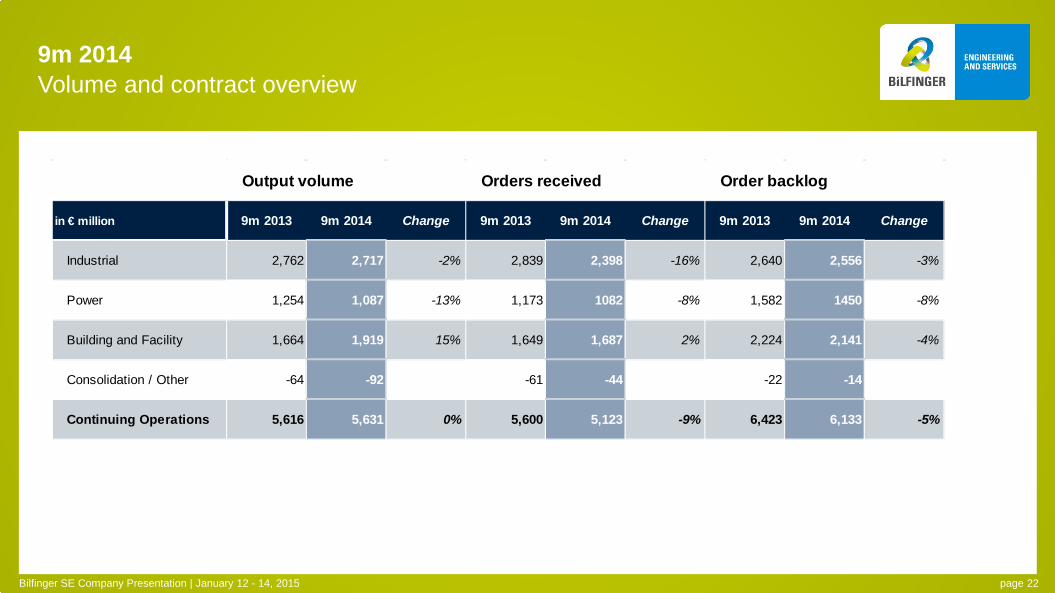
9m 2014 Volume and contract overview
Bilfinger SE Company Presentation | January 12 - 14, 2015 page 22
in € million 9m 2013 9m 2014 Change 9m 2013 9m 2014 Change 9m 2013 9m 2014 Change
Industrial 2,762 2,717 -2% 2,839 2,398 -16% 2,640 2,556 -3%
Power 1,254 1,087 -13% 1,173 1082 -8% 1,582 1450 -8%
Building and Facility 1,664 1,919 15% 1,649 1,687 2% 2,224 2,141 -4%
Consolidation / Other -64 -92 -61 -44 -22 -14
Continuing Operations 5,616 5,631 0% 5,600 5,123 -9% 6,423 6,133 -5%
Output volume Orders received Order backlog
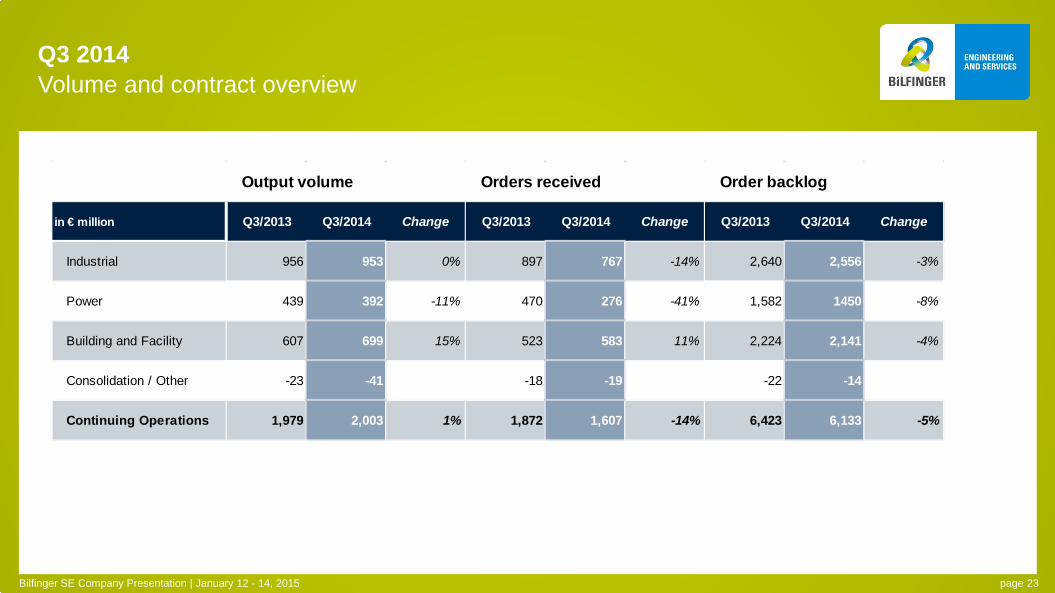
Q3 2014 Volume and contract overview
Bilfinger SE Company Presentation | January 12 - 14, 2015 page 23
in € million Q3/2013 Q3/2014 Change Q3/2013 Q3/2014 Change Q3/2013 Q3/2014 Change
Industrial 956 953 0% 897 767 -14% 2,640 2,556 -3%
Power 439 392 -11% 470 276 -41% 1,582 1450 -8%
Building and Facility 607 699 15% 523 583 11% 2,224 2,141 -4%
Consolidation / Other -23 -41 -18 -19 -22 -14
Continuing Operations 1,979 2,003 1% 1,872 1,607 -14% 6,423 6,133 -5%
Output volume Orders received Order backlog
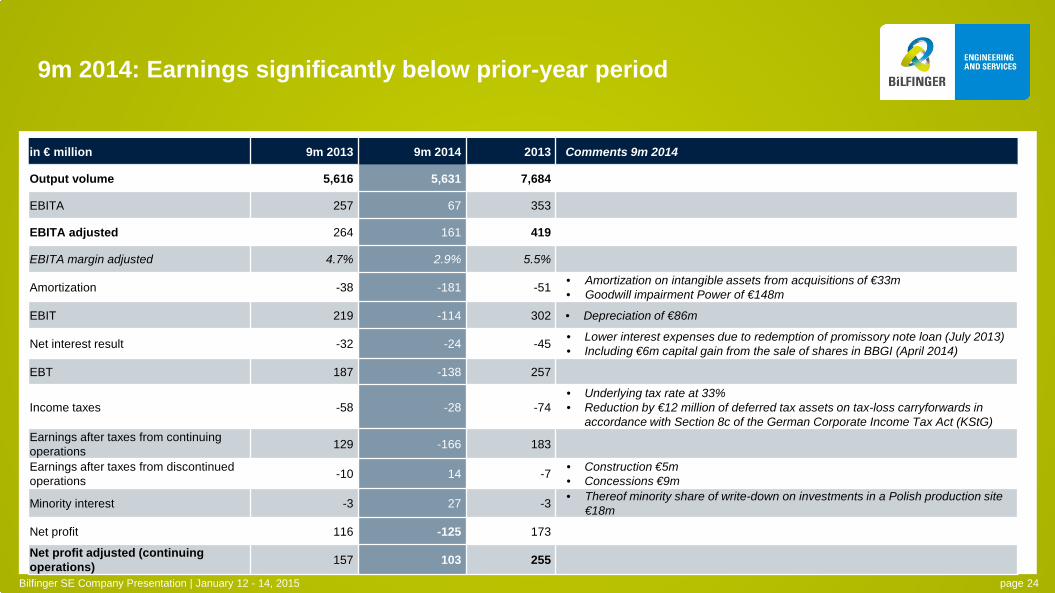
9m 2014: Earnings significantly below prior-year period
Bilfinger SE Company Presentation | January 12 - 14, 2015 page 24
in € million 9m 2013 9m 2014 2013 Comments 9m 2014
Output volume 5,616 5,631 7,684
EBITA 257 67 353
EBITA adjusted 264 161 419
EBITA margin adjusted 4.7% 2.9% 5.5%
Amortization -38 -181 -51 • Amortization on intangible assets from acquisitions of €33m • Goodwill impairment Power of €148m
EBIT 219 -114 302 • Depreciation of €86m
Net interest result -32 -24 -45 • Lower interest expenses due to redemption of promissory note loan (July 2013) • Including €6m capital gain from the sale of shares in BBGI (April 2014)
EBT 187 -138 257
Income taxes -58 -28 -74 • Underlying tax rate at 33% • Reduction by €12 million of deferred tax assets on tax-loss carryforwards in
accordance with Section 8c of the German Corporate Income Tax Act (KStG) Earnings after taxes from continuing operations 129 -166 183
Earnings after taxes from discontinued operations -10 14 -7 • Construction €5m
• Concessions €9m
Minority interest -3 27 -3 • Thereof minority share of write-down on investments in a Polish production site €18m
Net profit 116 -125 173
Net profit adjusted (continuing operations) 157 103 255
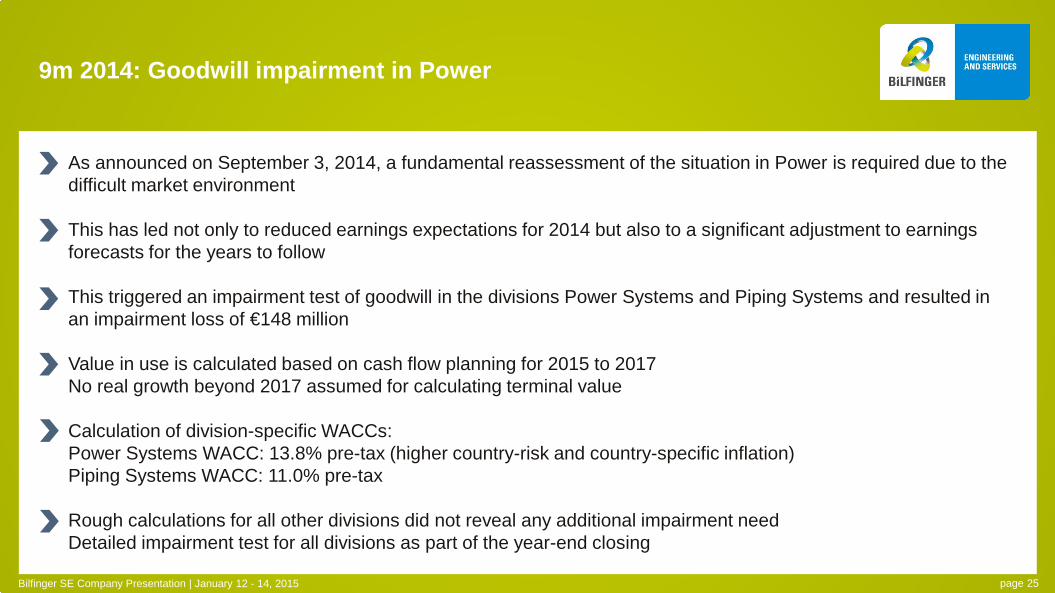
9m 2014: Goodwill impairment in Power
Bilfinger SE Company Presentation | January 12 - 14, 2015
As announced on September 3, 2014, a fundamental reassessment of the situation in Power is required due to the difficult market environment This has led not only to reduced earnings expectations for 2014 but also to a significant adjustment to earnings forecasts for the years to follow This triggered an impairment test of goodwill in the divisions Power Systems and Piping Systems and resulted in an impairment loss of €148 million Value in use is calculated based on cash flow planning for 2015 to 2017 No real growth beyond 2017 assumed for calculating terminal value Calculation of division-specific WACCs: Power Systems WACC: 13.8% pre-tax (higher country-risk and country-specific inflation) Piping Systems WACC: 11.0% pre-tax Rough calculations for all other divisions did not reveal any additional impairment need Detailed impairment test for all divisions as part of the year-end closing
page 25
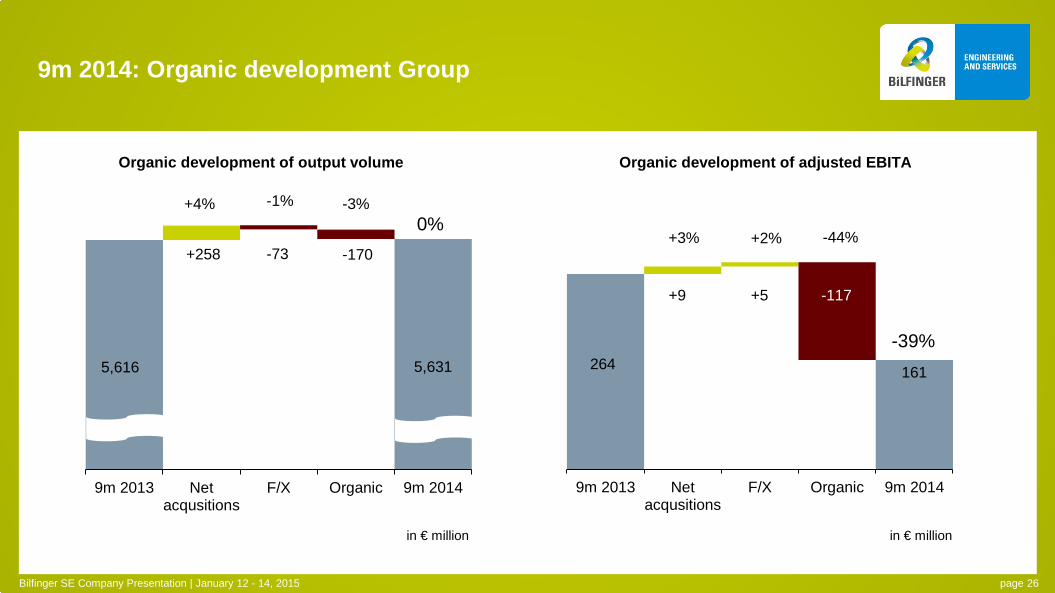
9m 2014: Organic development Group
5,616 5,631
9m 2013 Netacqusitions
F/X Organic 9m 2014
-1%
Organic development of output volume Organic development of adjusted EBITA
264 161
9m 2013 Netacqusitions
F/X Organic 9m 2014
+5
+258
+4% -3%
+9
+3% -44% -73
in € million in € million
0%
-39%
-117
+2%
Bilfinger SE Company Presentation | January 12 - 14, 2015 page 26
-170
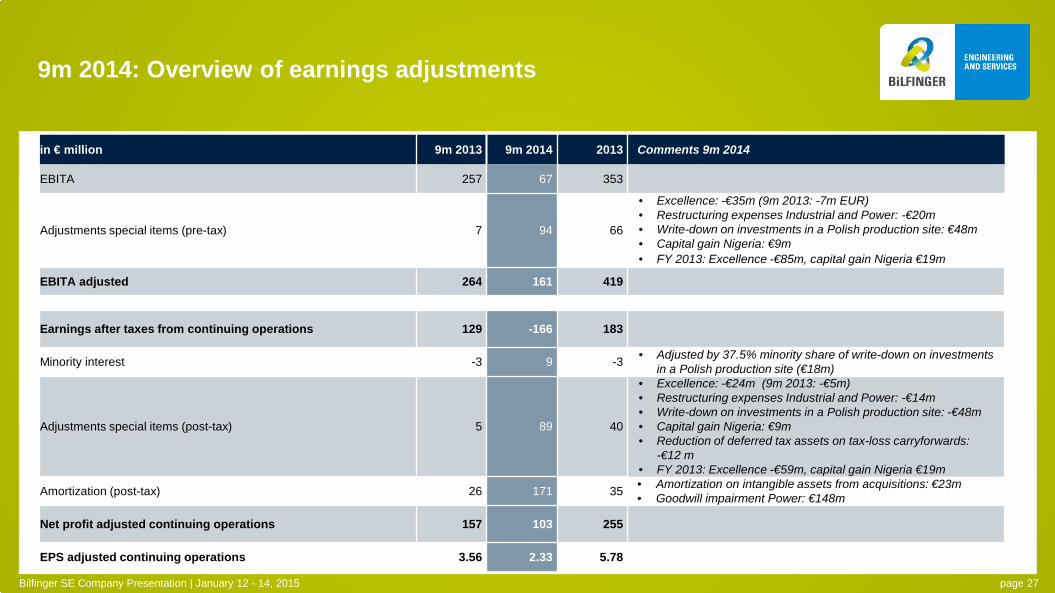
9m 2014: Overview of earnings adjustments
Bilfinger SE Company Presentation | January 12 - 14, 2015 page 27
in € million 9m 2013 9m 2014 2013 Comments 9m 2014
EBITA 257 67 353
Adjustments special items (pre-tax) 7 94 66
• Excellence: -€35m (9m 2013: -7m EUR) • Restructuring expenses Industrial and Power: -€20m • Write-down on investments in a Polish production site: €48m • Capital gain Nigeria: €9m • FY 2013: Excellence -€85m, capital gain Nigeria €19m
EBITA adjusted 264 161 419
Earnings after taxes from continuing operations 129 -166 183
Minority interest -3 9 -3 • Adjusted by 37.5% minority share of write-down on investments in a Polish production site (€18m)
Adjustments special items (post-tax) 5 89 40
• Excellence: -€24m (9m 2013: -€5m) • Restructuring expenses Industrial and Power: -€14m • Write-down on investments in a Polish production site: -€48m • Capital gain Nigeria: €9m • Reduction of deferred tax assets on tax-loss carryforwards:
-€12 m • FY 2013: Excellence -€59m, capital gain Nigeria €19m
Amortization (post-tax) 26 171 35 • Amortization on intangible assets from acquisitions: €23m • Goodwill impairment Power: €148m
Net profit adjusted continuing operations 157 103 255
EPS adjusted continuing operations 3.56 2.33 5.78
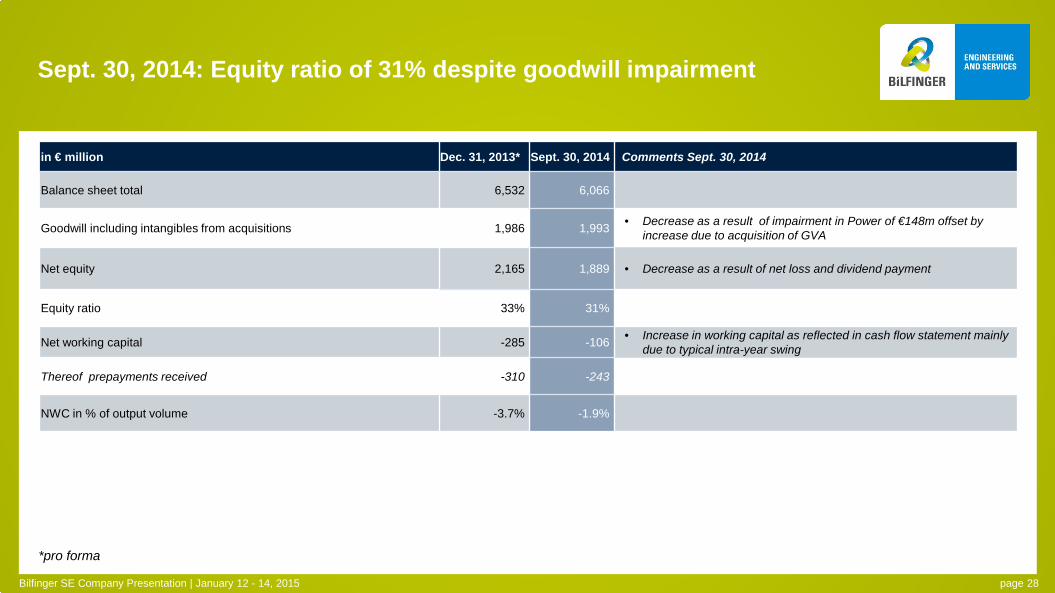
Sept. 30, 2014: Equity ratio of 31% despite goodwill impairment
page 28 Bilfinger SE Company Presentation | January 12 - 14, 2015
*pro forma
in € million Dec. 31, 2013* Sept. 30, 2014 Comments Sept. 30, 2014
Balance sheet total 6,532 6,066
Goodwill including intangibles from acquisitions 1,986 1,993 • Decrease as a result of impairment in Power of €148m offset by increase due to acquisition of GVA
Net equity 2,165 1,889 • Decrease as a result of net loss and dividend payment
Equity ratio 33% 31%
Net working capital -285 -106 • Increase in working capital as reflected in cash flow statement mainly due to typical intra-year swing
Thereof prepayments received -310 -243
NWC in % of output volume -3.7% -1.9%
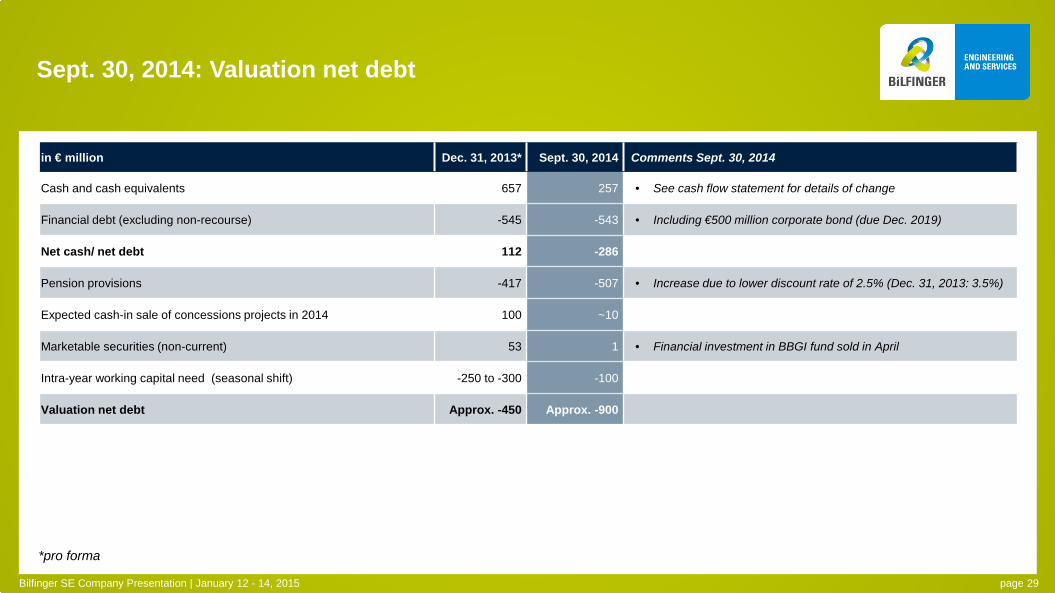
Sept. 30, 2014: Valuation net debt
Bilfinger SE Company Presentation | January 12 - 14, 2015 page 29
*pro forma
in € million Dec. 31, 2013* Sept. 30, 2014 Comments Sept. 30, 2014
Cash and cash equivalents 657 257 • See cash flow statement for details of change
Financial debt (excluding non-recourse) -545 -543 • Including €500 million corporate bond (due Dec. 2019)
Net cash/ net debt 112 -286
Pension provisions -417 -507 • Increase due to lower discount rate of 2.5% (Dec. 31, 2013: 3.5%)
Expected cash-in sale of concessions projects in 2014 100 ~10
Marketable securities (non-current) 53 1 • Financial investment in BBGI fund sold in April
Intra-year working capital need (seasonal shift) -250 to -300 -100
Valuation net debt Approx. -450 Approx. -900
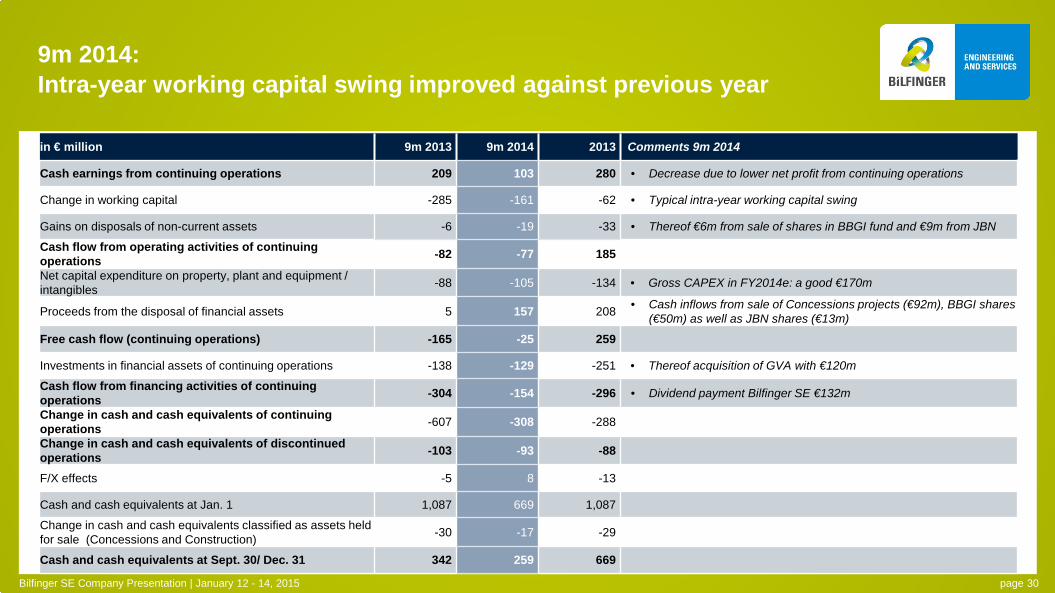
9m 2014: Intra-year working capital swing improved against previous year
page 30 Bilfinger SE Company Presentation | January 12 - 14, 2015
in € million 9m 2013 9m 2014 2013 Comments 9m 2014
Cash earnings from continuing operations 209 103 280 • Decrease due to lower net profit from continuing operations
Change in working capital -285 -161 -62 • Typical intra-year working capital swing
Gains on disposals of non-current assets -6 -19 -33 • Thereof €6m from sale of shares in BBGI fund and €9m from JBN
Cash flow from operating activities of continuing operations -82 -77 185
Net capital expenditure on property, plant and equipment / intangibles -88 -105 -134 • Gross CAPEX in FY2014e: a good €170m
Proceeds from the disposal of financial assets 5 157 208 • Cash inflows from sale of Concessions projects (€92m), BBGI shares (€50m) as well as JBN shares (€13m)
Free cash flow (continuing operations) -165 -25 259
Investments in financial assets of continuing operations -138 -129 -251 • Thereof acquisition of GVA with €120m
Cash flow from financing activities of continuing operations -304 -154 -296 • Dividend payment Bilfinger SE €132m
Change in cash and cash equivalents of continuing operations -607 -308 -288
Change in cash and cash equivalents of discontinued operations -103 -93 -88
F/X effects -5 8 -13
Cash and cash equivalents at Jan. 1 1,087 669 1,087
Change in cash and cash equivalents classified as assets held for sale (Concessions and Construction) -30 -17 -29
Cash and cash equivalents at Sept. 30/ Dec. 31 342 259 669
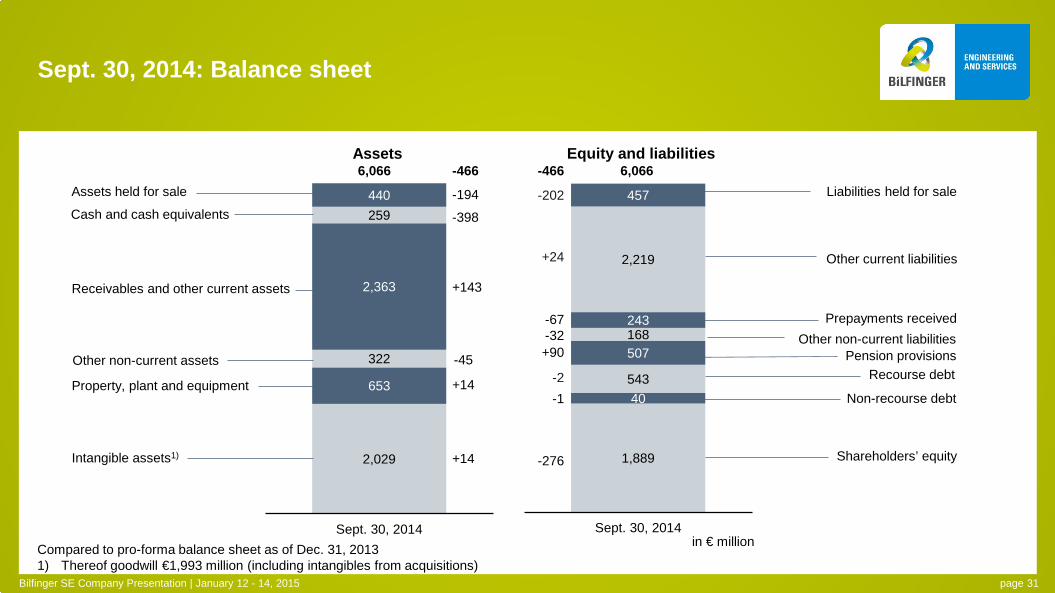
2,029
653
322
2,363
259 440
Sept. 30, 2014
-398
1,889
40 543
507 168 243
2,219
457
Sept. 30, 2014
Assets
Sept. 30, 2014: Balance sheet
6,066 6,066 Equity and liabilities
Intangible assets1)
Property, plant and equipment
Other non-current assets
Receivables and other current assets
Cash and cash equivalents
Shareholders’ equity
Non-recourse debt
Recourse debt Pension provisions
Other non-current liabilities
Prepayments received
Other current liabilities
-194
-466
+143
+14
+14
+24
-466
-67 -32 +90
-2
-276
-1
in € million
Assets held for sale Liabilities held for sale -202
-45
Bilfinger SE Company Presentation | January 12 - 14, 2015 page 31
Compared to pro-forma balance sheet as of Dec. 31, 2013 1) Thereof goodwill €1,993 million (including intangibles from acquisitions)
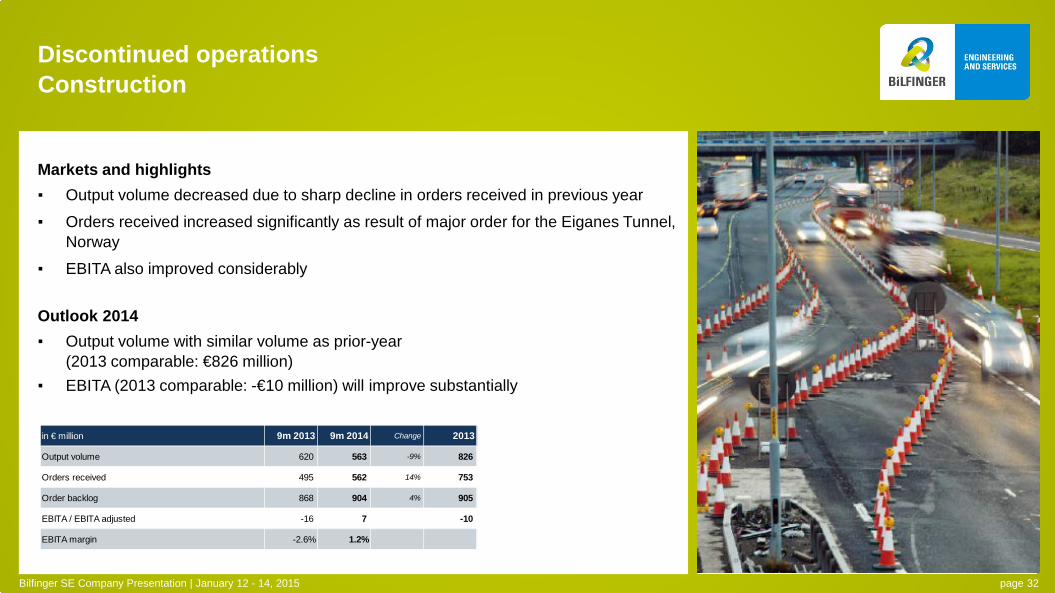
Markets and highlights ▪ Output volume decreased due to sharp decline in orders received in previous year
▪ Orders received increased significantly as result of major order for the Eiganes Tunnel, Norway
▪ EBITA also improved considerably
Outlook 2014 ▪ Output volume with similar volume as prior-year
(2013 comparable: €826 million) ▪ EBITA (2013 comparable: -€10 million) will improve substantially
Discontinued operations Construction
Bilfinger SE Company Presentation | January 12 - 14, 2015 page 32
in € million 9m 2013 9m 2014 Change 2013
Output volume 620 563 -9% 826
Orders received 495 562 14% 753
Order backlog 868 904 4% 905
EBITA / EBITA adjusted -16 7 -10
EBITA margin -2.6% 1.2%
Discontinued operations Concessions
Of five projects to be transferred in 2014, four were transferred in 9m 2014: ▪ Proceeds of €92 million ▪ Capital gain of €14 million Remaining project is expected to follow in Q4/ 2014: ▪ Proceeds of approx. €10 million ▪ Capital gain of approx. €2 million
Bilfinger SE Company Presentation | January 12 - 14, 2015 page 33
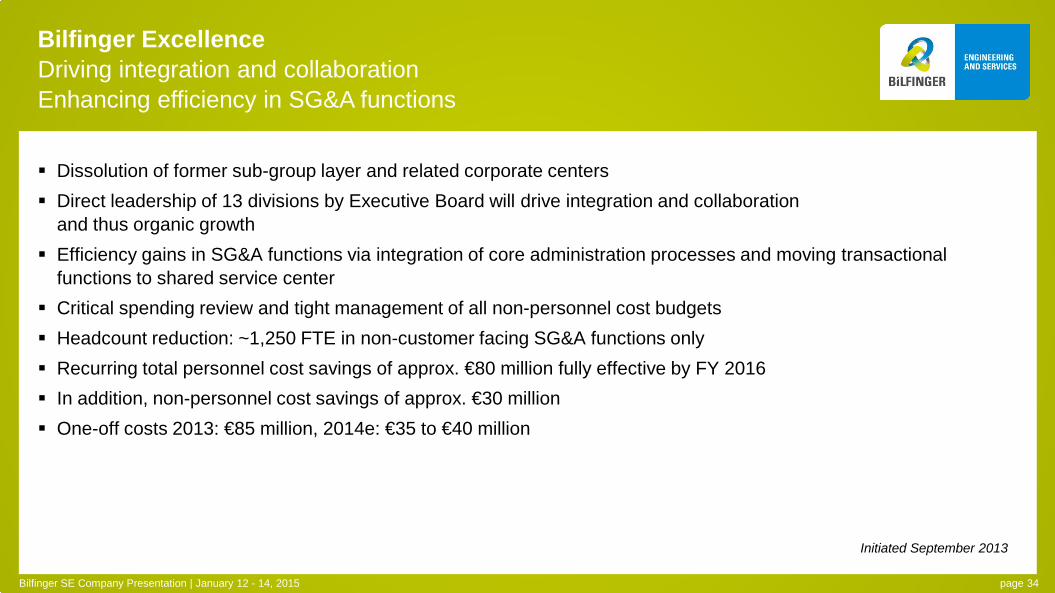
Bilfinger Excellence Driving integration and collaboration Enhancing efficiency in SG&A functions
Dissolution of former sub-group layer and related corporate centers Direct leadership of 13 divisions by Executive Board will drive integration and collaboration
and thus organic growth Efficiency gains in SG&A functions via integration of core administration processes and moving transactional
functions to shared service center Critical spending review and tight management of all non-personnel cost budgets Headcount reduction: ~1,250 FTE in non-customer facing SG&A functions only Recurring total personnel cost savings of approx. €80 million fully effective by FY 2016 In addition, non-personnel cost savings of approx. €30 million One-off costs 2013: €85 million, 2014e: €35 to €40 million
Bilfinger SE Company Presentation | January 12 - 14, 2015 page 34
Initiated September 2013
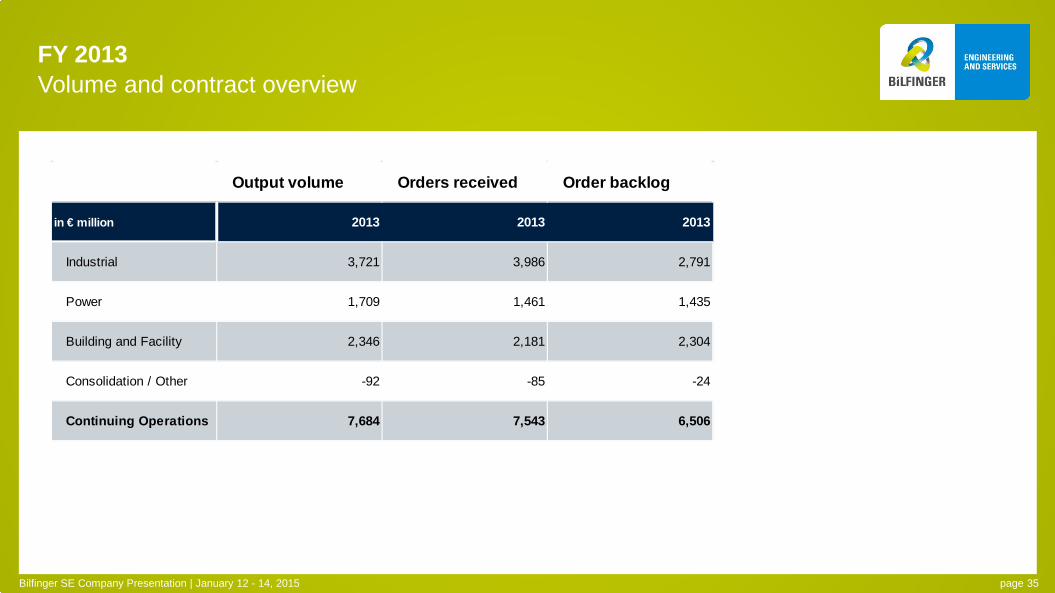
FY 2013 Volume and contract overview
Bilfinger SE Company Presentation | January 12 - 14, 2015 page 35
Output volume Orders received Order backlog
in € million 2013 2013 2013
Industrial 3,721 3,986 2,791
Power 1,709 1,461 1,435
Building and Facility 2,346 2,181 2,304
Consolidation / Other -92 -85 -24
Continuing Operations 7,684 7,543 6,506
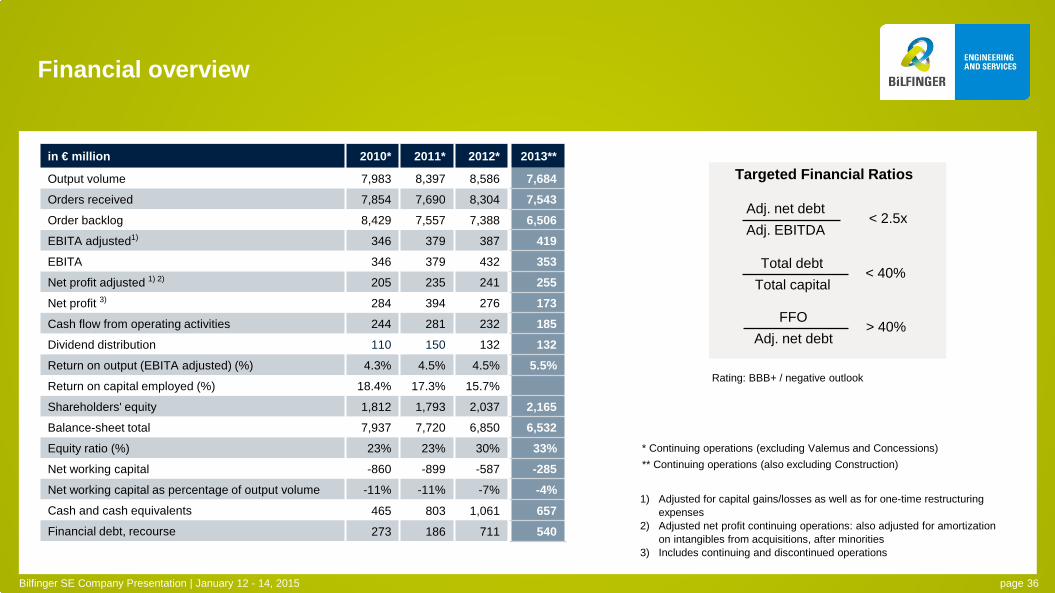
in € million 2010* 2011* 2012* 2013**
Output volume 7,983 8,397 8,586 7,684 Orders received 7,854 7,690 8,304 7,543 Order backlog 8,429 7,557 7,388 6,506 EBITA adjusted1) 346 379 387 419 EBITA 346 379 432 353 Net profit adjusted 1) 2) 205 235 241 255 Net profit 3) 284 394 276 173 Cash flow from operating activities 244 281 232 185 Dividend distribution 110 150 132 132 Return on output (EBITA adjusted) (%) 4.3% 4.5% 4.5% 5.5% Return on capital employed (%) 18.4% 17.3% 15.7%
Shareholders' equity 1,812 1,793 2,037 2,165 Balance-sheet total 7,937 7,720 6,850 6,532 Equity ratio (%) 23% 23% 30% 33% Net working capital -860 -899 -587 -285 Net working capital as percentage of output volume -11% -11% -7% -4% Cash and cash equivalents 465 803 1,061 657 Financial debt, recourse 273 186 711 540
Financial overview
1) Adjusted for capital gains/losses as well as for one-time restructuring expenses
2) Adjusted net profit continuing operations: also adjusted for amortization on intangibles from acquisitions, after minorities
3) Includes continuing and discontinued operations
Bilfinger SE Company Presentation | January 12 - 14, 2015 page 36
Rating: BBB+ / negative outlook
Targeted Financial Ratios
Adj. net debt Adj. EBITDA
< 2.5x
Total debt Total capital
< 40%
FFO Adj. net debt
> 40%
* Continuing operations (excluding Valemus and Concessions) ** Continuing operations (also excluding Construction)
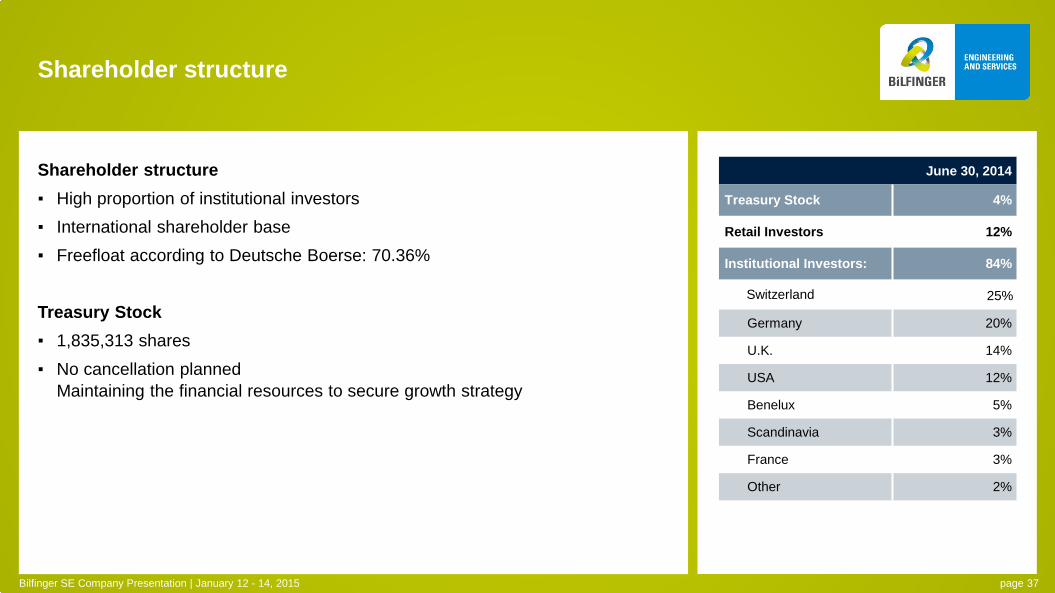
Shareholder structure ▪ High proportion of institutional investors ▪ International shareholder base ▪ Freefloat according to Deutsche Boerse: 70.36%
Treasury Stock ▪ 1,835,313 shares ▪ No cancellation planned
Maintaining the financial resources to secure growth strategy
Shareholder structure
June 30, 2014
Treasury Stock 4%
Retail Investors 12%
Institutional Investors: 84%
Switzerland
Germany 20%
U.K. 14%
USA 12%
Benelux 5%
Scandinavia 3%
France 3%
Other 2%
25%
Bilfinger SE Company Presentation | January 12 - 14, 2015 page 37
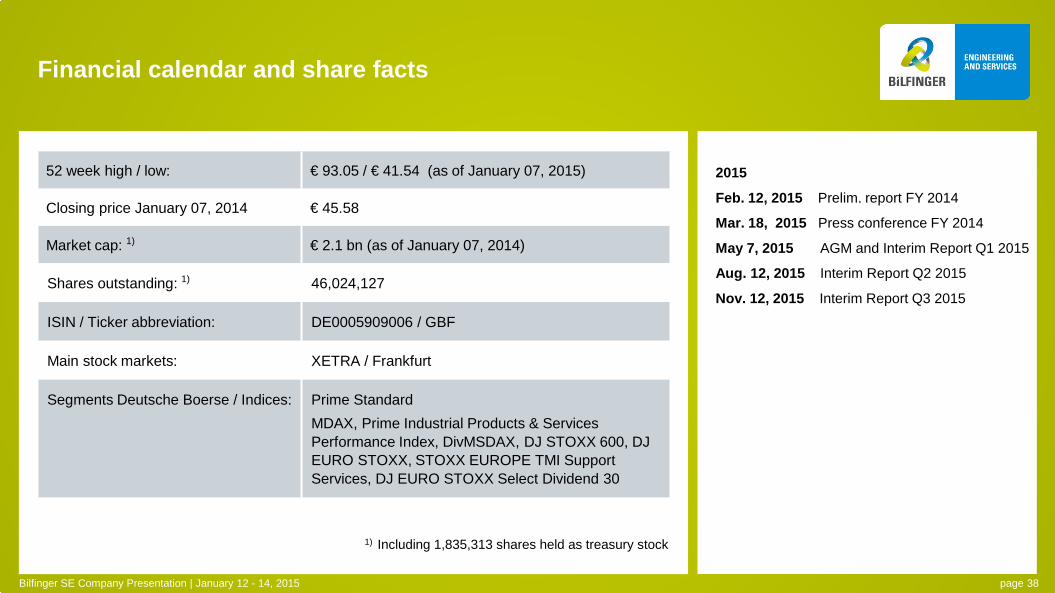
2015
Feb. 12, 2015 Prelim. report FY 2014
Mar. 18, 2015 Press conference FY 2014
May 7, 2015 AGM and Interim Report Q1 2015
Aug. 12, 2015 Interim Report Q2 2015
Nov. 12, 2015 Interim Report Q3 2015
Financial calendar and share facts
1) Including 1,835,313 shares held as treasury stock
52 week high / low: € 93.05 / € 41.54 (as of January 07, 2015)
Closing price January 07, 2014 € 45.58
Market cap: 1) € 2.1 bn (as of January 07, 2014)
Shares outstanding: 1) 46,024,127
ISIN / Ticker abbreviation: DE0005909006 / GBF
Main stock markets: XETRA / Frankfurt
Segments Deutsche Boerse / Indices:
Prime Standard MDAX, Prime Industrial Products & Services Performance Index, DivMSDAX, DJ STOXX 600, DJ EURO STOXX, STOXX EUROPE TMI Support Services, DJ EURO STOXX Select Dividend 30
Bilfinger SE Company Presentation | January 12 - 14, 2015 page 38
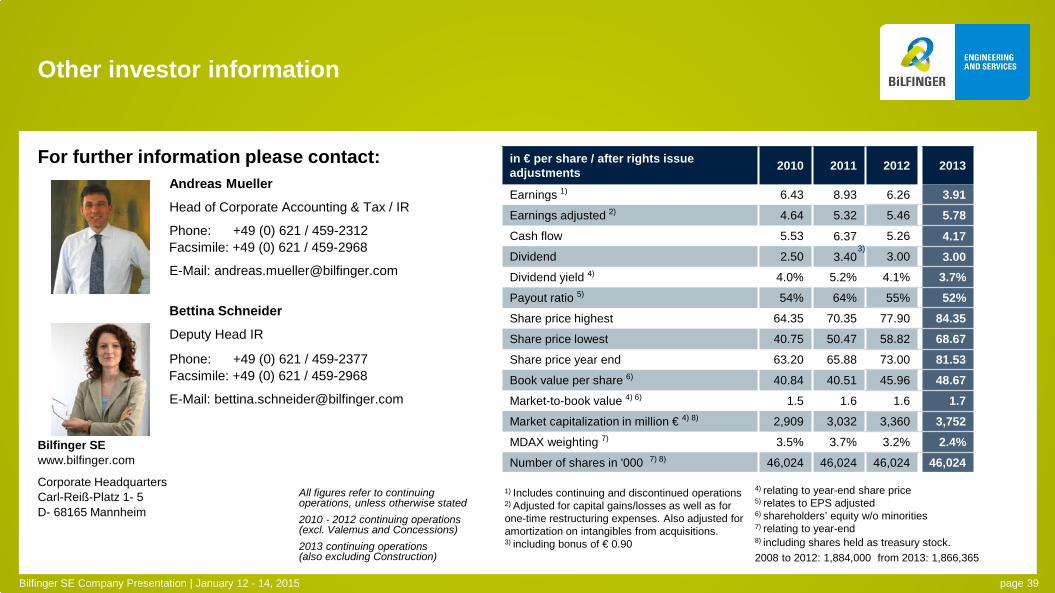
Other investor information
For further information please contact: Andreas Mueller
Head of Corporate Accounting & Tax / IR
Phone: +49 (0) 621 / 459-2312 Facsimile: +49 (0) 621 / 459-2968
E-Mail: [email protected]
Bettina Schneider
Deputy Head IR
Phone: +49 (0) 621 / 459-2377 Facsimile: +49 (0) 621 / 459-2968
E-Mail: [email protected]
Bilfinger SE www.bilfinger.com
Corporate Headquarters Carl-Reiß-Platz 1- 5 D- 68165 Mannheim
1) Includes continuing and discontinued operations
2) Adjusted for capital gains/losses as well as for one-time restructuring expenses. Also adjusted for amortization on intangibles from acquisitions. 3) including bonus of € 0.90
in € per share / after rights issue adjustments 2010 2011 2012 2013
Earnings 1) 6.43 8.93 6.26 3.91 Earnings adjusted 2) 4.64 5.32 5.46 5.78 Cash flow 5.53 6.37 5.26 4.17 Dividend 2.50 3.40 3.00 3.00 Dividend yield 4) 4.0% 5.2% 4.1% 3.7% Payout ratio 5) 54% 64% 55% 52% Share price highest 64.35 70.35 77.90 84.35 Share price lowest 40.75 50.47 58.82 68.67 Share price year end 63.20 65.88 73.00 81.53 Book value per share 6) 40.84 40.51 45.96 48.67 Market-to-book value 4) 6) 1.5 1.6 1.6 1.7 Market capitalization in million € 4) 8) 2,909 3,032 3,360 3,752 MDAX weighting 7) 3.5% 3.7% 3.2% 2.4% Number of shares in '000 7) 8) 46,024 46,024 46,024 46,024
3)
Bilfinger SE Company Presentation | January 12 - 14, 2015 page 39
4) relating to year-end share price
5) relates to EPS adjusted 6) shareholders’ equity w/o minorities 7) relating to year-end 8) including shares held as treasury stock. 2008 to 2012: 1,884,000 from 2013: 1,866,365
All figures refer to continuing operations, unless otherwise stated 2010 - 2012 continuing operations (excl. Valemus and Concessions) 2013 continuing operations (also excluding Construction)
Disclaimer
Bilfinger SE Company Presentation | January 12 - 14, 2015 page 40
This presentation has been produced for support of oral information purposes only and contains forward-looking statements which involve risks and uncertainties. Forward-looking statements are statements that are not historical facts, including statements about our beliefs and expectations. Such statements made within this document are based on plans, estimates and projections as they are currently available to Bilfinger SE. Forward-looking statements are therefore valid only as of the date they are made, and we undertake no obligation to update publicly any of them in light of new information or future events. Apart from this, a number of important factors could therefore cause actual results to differ materially from those contained in any forward-looking statement. Such factors include the conditions in worldwide financial markets as well as the factors that derive from any change in worldwide economic development.
This document does not constitute any form of offer or invitation to subscribe for or purchase any securities. In addition, the shares of Bilfinger SE have not been registered under United States Securities Law and may not be offered, sold or delivered within the United States or to U.S. persons absent registration under or an applicable exemption from the registration requirements of the United States Securities Law.