Embed Size (px)
Citation preview

Bill Shipley,département de biologieUniversité de SherbrookeSherbrooke (Qc) Canada

1 2 5 10 20 50 100 200
12
51
02
05
01
00
20
0
Number of churches per city
Nu
mb
er
of m
urd
ers
pe
r ye
ar
pe
r ci
ty
Ln(murders)=0.009+0.99*Ln(churches)
Passive prediction ONLY if the underlying causal processes are constant
Number of churches
Number of murders
Popsize
New causal context…...
Number of churches
Number of murders
Popsize

3-D Object2-D Shadow
Hidden from viewWhat the audience sees

A
B C
D
E
“3-D” causal process“2-D” correlational shadow
B & C correlated,but independent given A
A & D correlated,but independent given B & C
And so on….
What the scientist sees Hidden from view

R.A. FisherStatistical Methods for Research Workers
(1925)
Nitrogenfertilizer
Crop growth?
X
o
o
oo
15 plots with treatment (+fertilizer & water)15 plots without treatment (+water)
Treatment: 80 g 6
Control: 55 g 6T-test: p<0.0001
Nitrogen fertilizer Crop growth
X
Randomnumbers X
Experimental (observational) unit...
- the unit to which the treatment is applied
- the UNIT to which the treatment is applied
N, P, K...Worms….
N fertilizer
variable 1variable 2 …variable n

No causal inferences between variables within the experimental unit

THE PLANT
Nitrogenfertilizer
Nitrogen absorption
Photosynthetic enzymes
Carbon
fixationSeed yield

Fertilizeraddition
Nitrogenabsorption
Photosyntheticenzymes
Scenario 1
Photosyntheticenzymes
Fertilizeraddition
Nitrogenabsorption
Scenario 3
Fertilizeraddition
Photosyntheticenzymes
Nitrogenabsorption
Scenario 2


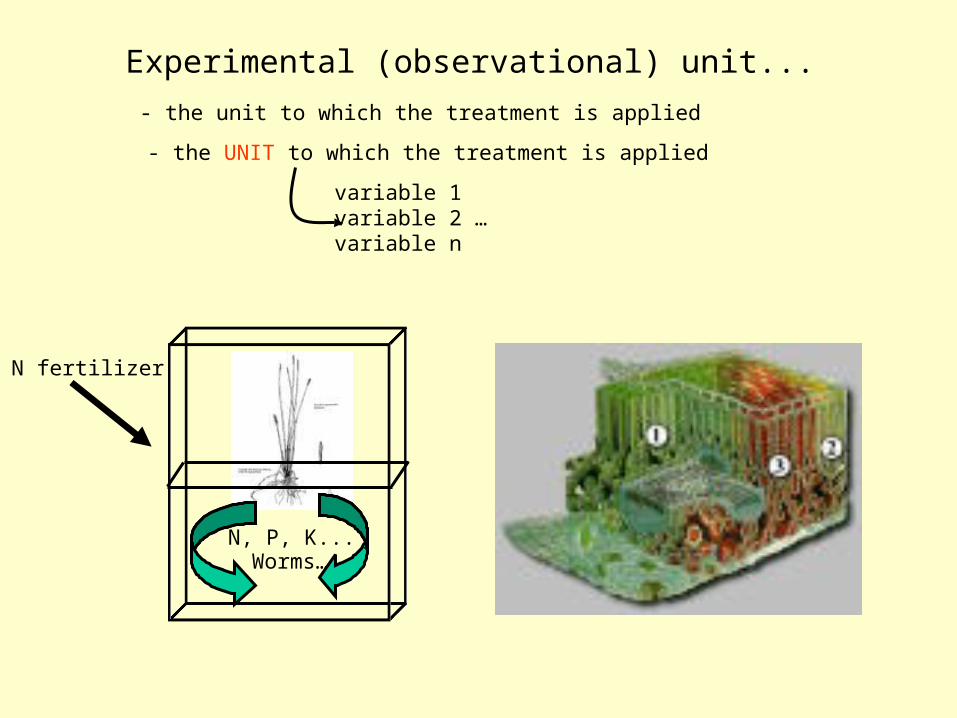
La méthode expérimentale
Claude Bernard1813 - 1878

Color of blood in renal vein before entering the kidney
Active/inactive state of the kidney
Color of blood in the renal vein upon exiting the kidney
Color of blood in renal vein before entering the kidney
Active/inactive state of the kidney
Color of blood in the renal vein upon exiting the kidney
Color of blood in renal vein before entering the kidney
Active/inactive state of the kidney
Color of blood in the renal vein upon exiting the kidney
X

1. Hypothesize a causal structure. A B C
2. Measure the correlations between the variables in their natural state.
3. Predict how these correlations will change if various physical manipulations hold constant different variables.
A B C
A B C
A B C
4. Compare the new correlations after controlling the variables to the predictions assuming the causal structure.
5. If any of the predicted changes in the correlational structure disagree with theobserved changes, then reject the causal structure.
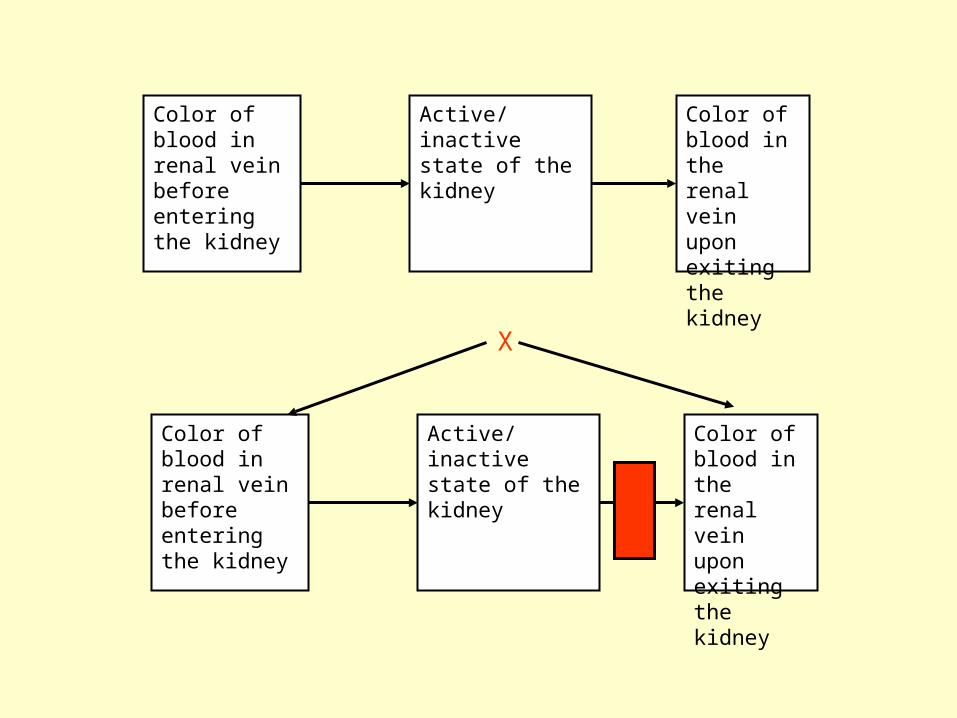
sex
Body size in autumn
Survival to spring

Causal hypothesis 1
Survivalto spring
Body sizein autumn
sex
Other causes
Other causes
Causal hypothesis 2
Survivalto spring
Body sizein autumn
sex
Other causes
Other causes

Quantity and quality of summer forage
Body weight in the autumn
Probability of survival until spring
)()(),( YfXfYXfZ
Z0.120
0.040
Y
1.5
0.0
1.5 X-1.50.0
1.5

40 50 60 70 80
34
56
7
Body mass (kg)
Am
ou
nt o
f fo
rag
e (
kg
)
40 50 60 70 80
22
24
26
28
30
Body mass (kg)
Su
rviv
al (%
)
-1.0 -0.5 0.0 0.5
-4-2
02
4
Forage quality for constant body mass
Su
rviv
al fo
r a
co
nsta
nt b
od
y m
ass
Residuals
“residuals ofY given X”


A
B C
D
E
“3-D” causal process “2-D” correlational shadow
Hypothesis testing
B & C independentgiven A
A & D independentgiven B & C
B & D independentgiven D
and so on...

A
B C
D
E
“3-D” causal process “2-D” correlational shadow
Hypothesis generation
B & C independentgiven A
A & D independentgiven B & C
B & D independentgiven D
and so on...

A
B C
D
E
B & C independentgiven A
A & D independentgiven B & C
B & D independentgiven D
and so on...

)()(),( YfXfYXfZ )()(),( YfXfYXfZ
A B
Z0.120
0.040
Y
1.5
0.0
1.5 X-1.50.0
1.5
Z
YX
0.300
0.100
0.01.5
-1.5 0.0-1.5
1.5
][1][2/1||2/)2(
1),;(
XXen
xP

•Deals only in information content conditional on other information•NOT causal relationships.•There is no notion of a causal (asymmetric) relationship in probability theory•Consistently mistranslates “X-->Y” as “Y=f(X)”
The dangers of mistranslation between languages...
French “demande” vs. English “demand”
=
Probability distributions
=

Bill Gates worth 1,000,000,000$
(machine translation into another language)
Payment request for doors in the fence worth 1,000,000,000$
(machine translation back into English)
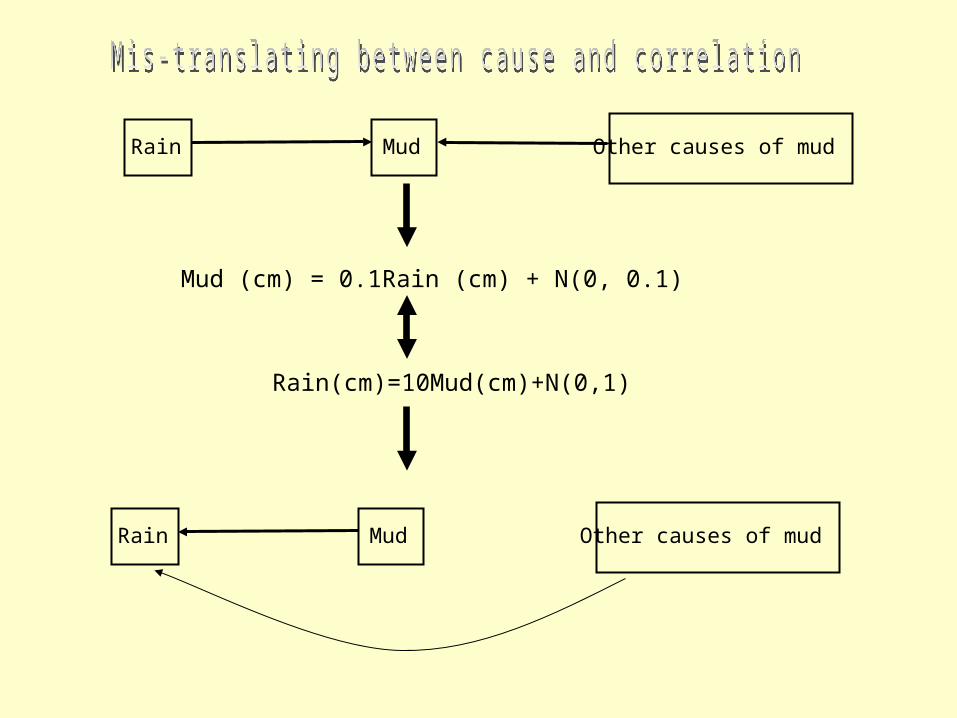
Rain Mud Other causes of mud
Mud (cm) = 0.1Rain (cm) + N(0, 0.1)
Rain(cm)=10Mud(cm)+N(0,1)
Rain Mud Other causes of mud

1. Express causal claims using graph theory (directedacyclic graphs - DAGs)Property: asymmetric relationships
A B C
2. Apply a graph-theoretic operator (d-separation)on this graph.
A_||_C|B (A is separated from C given B in the graph)
3. If two vertices (X,Y) in this DAG are d-separated given a set Qof other vertices, then variables X and Y are probabilisticallyindependent given the set Q of conditioning variables in ANYmultivariate probability distribution generated by the DAG
4. There always exists a basis set B of d-separation claims forthe DAG that together completely specify the joint probability distribution over the variables represented by the DAG.
B={A_||_C|B..} implies P(X,Y,Z)

5. Test the predicted and observed independence claimsimplied by the graphical model.
- if there are significant differences, reject the causal model;- if there aren’t significant differences, tentatively accept the causal model (and continue testing…)
6. Now, translate the graphical model into prediction equations.
7. The independence claims in the DAG are local, therefore, tochange the causal structure, simply re-write the DAG and thengo back to step 6.
A=e1
B=f(A) + e2
C=f(B) + e3
A B C
A B CA=e1
B= e2
C=f(B) + e3

1 2 5 10 20 50 100 200
12
51
02
05
01
00
20
0
Number of churches per city
Nu
mb
er
of m
urd
ers
pe
r ye
ar
pe
r ci
ty
Ln(murders)=0.009+0.99*Ln(churches)
Passive prediction ONLY if the underlying causal processes are constant
Number of churches
Number of murders
Popsize
New causal context…...
Number of churches
Number of murders
Popsize

A few definitions...
A B C D E
A B C D E
Directed path from:
A to C
E to C
NOT from A to E
NOT from E to AIf you can follow the arrows from i to j thenthere is a directed path from i to j.
A B C D E Undirected path from:
A to E
E to A
If you can go from i to j while ignoring thedirection of the arrows then there is an undirected path from i to j.

A few definitions...
A B C D E
Non-collider vertex
Unshielded collider vertex
AB
C
Sheilded collider vertex

A B C D E
Causal children of A NOT causal children of A
Causal children of E NOT causal children of E

A B C D E
Causal ancestors of C

State of a vertex:
A non-collider vertex allows causal influence to flow through it (naturally ON);conditioning (holding constant) blocks causal influence through it (turns OFF).
A B C A B C
A collider vertex prevents causal influence to flow through it (naturally OFF);conditioning (holding constant) allows causal influence through it (turns ON).
A B C A B C

A B C A B C
rain
mud
Water hose
1. It rained
2. Therefore mud
3. No idea about water hose
rain
mud
Water hose
1. It didn’t rain
2. There was mud
3. Therefore the water hose was on
Rain mud water hose

1. List all undirected paths between X and YFor each such undirected path...
Is X and Y d-separated given a set Q={A, B, …} conditioningvertices?
2. Are there any non-colliders along this path that are in Q? If yes, path is blocked;Go to next undirected path.
3. Are all colliders or causal children of colliders along this path in Q? If no, thenpath is blocked; go to next undirected path.
If all undirected paths between X and Y are blocked by Q then X and Y ared-separated by Q.
If X and Y are d-separated by Q, then they are probabilistically independent given Qin any probability distribution generated by the graph.

A
B C
D
E
Are B & Cd-separated
givenA?
B_||_C|{A}?
A
B C
D
E
YES B & C are d-separated given A therefore...
B & C will be independent conditional on A
Non-collider
Before conditioning After conditioning

A
B C
D
E
Are B & Cd-separated
givenD?
B_||_C|{D}?
A
B C
D
E
NO B & C are not d-separated given D therefore...
B & C will be dependent conditional on A
collider
Before conditioning
After conditioning

A
B C
D
E
A _||_E|{D}? YES
A_||_E|{D,B}? YES
B_||_C|{A,D}? NO
B_||_C|{A,E}? NO
D_||_A|{B}? NO
E_||_B|D? YES
… and so on for every unique pair (X,Y) conditioned onevery unique pair of remaining variables...
2
0
2
2
V
x x
VV= 10 X [1 + 3 + 3 + 1] = 80

A
B C
D
E
Basis set: the smallest set of d-separation claims in a DAGthat, together, imply all others.
If you know the basis set, then you can specify the entirestructure of the joint probability distribution that is generatedby the directed acyclic graph.
Therefore, you can test the causal structure by testing thed-separation claims given in the basis set.
Special basis set: BU= {X_||_Y|{Pa(X) U Pa(Y)}X,Y pair of vertices not directly connected.(each unique pair of non-adjacent vertices, conditioned onthe set of parents of both)
BU={A_||_D|{B,C}, A_||_E|{D}, B_||_C|{A}, B_||_E|{A,D}, C_||_E|{A,D} }

List basis set BUA
B C
D
E
A_||_D|{B,C}A_||_E|{D}B_||_C|{A}B_||_E|{A,D}C_||_E|{A,D}
Convert toprobabilisticclaims
rA,D|{B,C}=0rA,E|D=0rB,C|A=0rB,E|A,D=0rC,E|A,D=0
Calculate probabilityof each claim in data
p1=0.23p2=0.50p3=0.001p4=0.45p5=0.12
Calculate :
k
iipLnC
1
)(2
IF all d-sep claims in the graph are true in the data, thenC follows a chi-squared distribution with 2k degrees of freedom
THEREFORE if the probability of C is below the significancelevel……… the causal structure is rejected by the data.
THEREFORE if the probability of C is above the significancelevel……… the causal structure is consistent with the data.
C = 23.98k = 5
X2 of 23.98 with 10 degrees of freedom gives p=0.008 REJECT causal structure


Claude Bernard
Karl Pearson
Ronald Fisher
Sewall Wright
Clark GlymourJudea Pearl


![arXiv:1409.3970v3 [cs.CV] 31 Dec 2015Department d’Informatique´ Universite de Sherbrooke, Sherbrooke (QC), Canada, J1K 2R1´ hugo.larochelle@usherbrooke.ca January 1, 2016 Abstract](https://img.pdfslide.net/doc/110x75/5ec601bdf5348049da0327ae/arxiv14093970v3-cscv-31-dec-2015-department-dainformatique-universite-de.jpg)