Embed Size (px)
Citation preview
BIM parametric modeller Deliverable Report D2.2
Deliverable D2.2, issue date 31 August 2017
P2ENDURE Plug-and-Play product and process innovation for Energy-efficient building deep renovation
This research project has received funding from the European Union’s Programme H2020-EE-2016-PPP under Grant Agreement no
7723391.
Disclaimer
The contents of this report reflect only the author’s view and the Agency and the Commission are not responsible for any use that may be
made of the information it contains.
P2ENDURE D2.2 – BIM parametric modeller page 2 - 30
Issue Date 31 August 2017
Produced by TU Berlin
Main author Christoph Gutsche
Co-author Prof. Timo Hartmann
Version: Final
Reviewed by P2Endure Steering Committee
Approved by Rizal Sebastian (Project Coordinator)
Dissemination Public
Colophon Copyright © 2017 by P2ENDURE consortium
Use of any knowledge, information or data contained in this document shall be at the user's sole risk. Neither the P2ENDURE Consortium nor any of its members, their officers,
employees or agents shall be liable or responsible, in negligence or otherwise, for any loss, damage or expense whatever sustained by any person as a result of the use, in any
manner or form, of any knowledge, information or data contained in this document, or due to any inaccuracy, omission or error therein contained. If you notice information in
this publication that you believe should be corrected or updated, please get in contact with the project coordinator.
The authors intended not to use any copyrighted material for the publication or, if not possible, to indicate the copyright of the respective object. The copyright for any material
created by the authors is reserved. Any duplication or use of objects such as diagrams, sounds or texts in other electronic or printed publications is not permitted without the
author's agreement.
This research project has received funding from the European Union’s Programme H2020-EE-2016-PPP under Grant Agreement no 7723391.
BIM parametric modeller Deliverable Report D2.2
P2ENDURE D2.2 – BIM parametric modeller page 3 - 30
Publishable executive summary The P2Endure parametric Modeller offers the user the possibility to plan his/her renovation project before
the actual start. By adding or removing product solutions that the user finds on the P2Endure e-
Marketplace, the parameters of the existing as is BIM model can be changed. The products, which can be
added by the user to their respective as is BIM model, are described by parameters. As a result, the user
gets an overview of the thermal, energetic and financial values that can be expected for his renovation
project with the selected products.
The P2Endure parametric modeller consists of several components, which are combined into one system.
The respective subsystems operate as micro services and are interconnected via interfaces. Due to the
decoupling of the respective services, the partial processes of the P2Endure parametric modeller are easy
to maintain, scalable and expandable. This makes the parametric modeller a modern and flexible
software service that allows the user, based on the data of the as is BIM model and the added e-
Marketplace products, to predict energy performance and life-cycle cost.
This report explains the process sequence of the parametric modeller and the interaction of the individual
components. The individual processes are presented with regard to the entire system and are explained
by means of illustrations. The report also provides information on the current state of research of the
parametric modeller as well as the activities, which are necessary for the further development of the
modeller.
P2ENDURE D2.2 – BIM parametric modeller page 4 - 30
List of acronyms and abbreviations BIM – Building Information Model
CSV – Comma Separated Values
IDF – Intermediate Data Format
IFC – Industry Foundation Classes
PnP – Plug and Play
HVAC – Heating, Ventilation, and Air Conditioning
P2ENDURE D2.2 – BIM parametric modeller page 5 - 30
Contents
1. INTRODUCTION 6
2. OVERVIEW OF THE PARAMETRIC MODELLER 7
3. EXPLANATION OF THE SYSTEM USING A SAMPLE SCENARIO 9
3.1 Upload the as-is BIM 9
3.2 Presentation of the (as is) BIM model in the front end 12
3.2.1 Presentation of the diagrams in the front end 13
3.2.2 Add the parametrically described Products to the as is BIM model 14
3.2.3 Configuration of the (as is BIM) data file for the energetic, thermal and financial calculation 17
3.2.4 Display the simulated data with d3.js 19
4. EVALUATION OF THE CURRENT RESULTS 21
5. DISCUSSION AND FURTHER RESEARCH WORK 24
6. CONCLUSIONS 26
REFERENCES 27
APPENDIX 1 - CALCULATION 28
APPENDIX 2 - UML DIAGRAM 30
P2ENDURE D2.2 – BIM parametric modeller page 6 - 30
1. Introduction The P2Endure e-Marketplace is a platform for supply-chain integration and with the functionality as an
information platform. This e-Marketplace contains, as one of its core elements, the BIM parametric
modeller. This modeller allows the user to calculate real energy use and energy costs for several years. It
also allows a validation of reduced use of net primary energy, lowered embodied energy, reduced
renovation cost and time, replicability and scalability of PnP prefab solutions, improved indoor
environment quality and reduced disturbance for inhabitants during renovation. The aim is to provide the
user with an overview of the impact of renovation products on the energy balance and development of
their building.
The P2Endure parametric modeller consists of several components, which are combined into one system.
The respective subsystems operate as micro services and are interconnected via interfaces. Due to the
decoupling of the respective services, the partial processes of the P2Endure parametric modeller are easy
to maintain, scalable and expandable.
The goal of this documentation is to present the current state of the work in the development of the
parametric modeller. The main focus of the report is to look at the way in which the modeller work and
how they work. The individual elements are explained in detail. These explanations are accompanied by a
general, introductory presentation of the P2Endure e-Marketplace web front end with the integrated
modeller as well as an evaluation of the results and the consideration of future work. The demonstration
is structures as follows:
Section two provides an overview of the P2Endure parametric modeller inside the e-Marketplace. The
individual components and their mode of operation are explained here. The second section also presents
the workflow of the parametric modeller as a graphic. This workflow is used to explain the individual
components, their interfaces and the interaction with the user. In the third chapter the individual elements
of the BIM parametric modeller are considered. The individual components interlock and form a process.
Section 3 examines the individual process steps of the parametric modeller in greater detail and shows
the interaction of the respective components.
The starting point is a flowchart, which shows the entire process. In the fourth section, the existing
research results are evaluated. A presentation of the system elements, in which the implementation was
successful or caused difficulties, is given. In the fifth chapter, results so far are discussed. Based on this,
proposals are made to further improve the system. Also, an outlook on the outstanding research points
will be given. The report is closed in the sixth section by a conclusion.
P2ENDURE D2.2 – BIM parametric modeller page 7 - 30
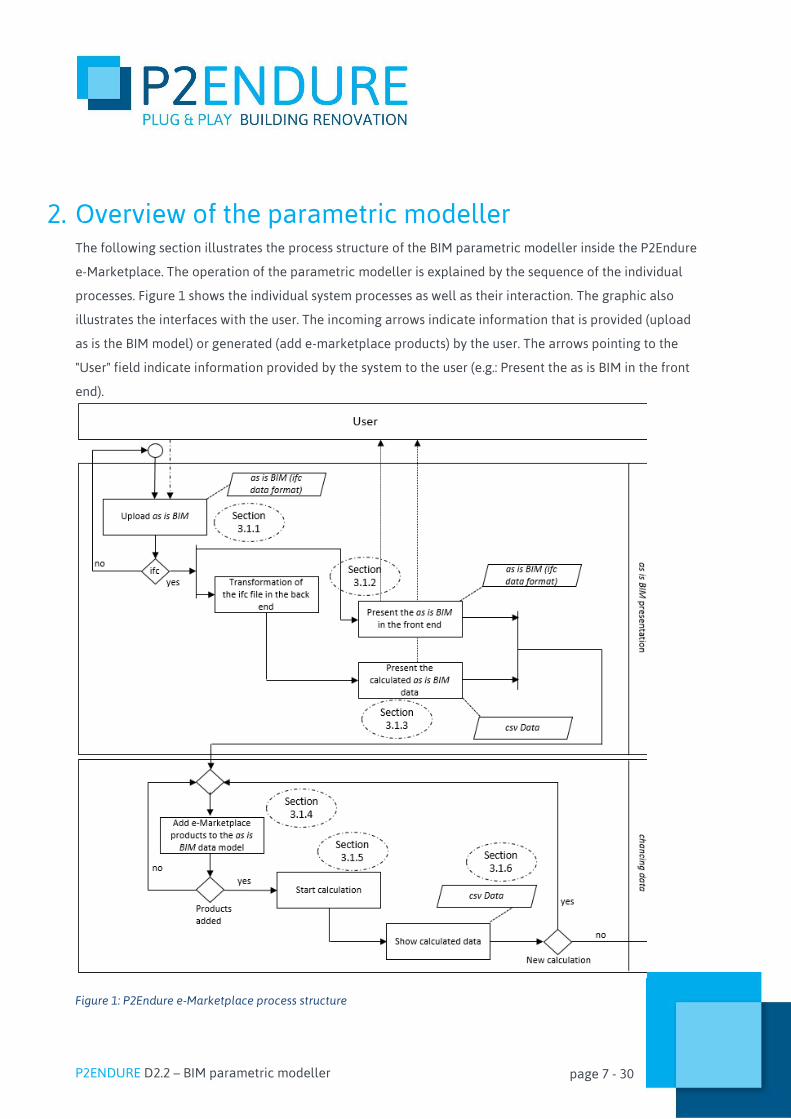
2. Overview of the parametric modeller The following section illustrates the process structure of the BIM parametric modeller inside the P2Endure
e-Marketplace. The operation of the parametric modeller is explained by the sequence of the individual
processes. Figure 1 shows the individual system processes as well as their interaction. The graphic also
illustrates the interfaces with the user. The incoming arrows indicate information that is provided (upload
as is the BIM model) or generated (add e-marketplace products) by the user. The arrows pointing to the
"User" field indicate information provided by the system to the user (e.g.: Present the as is BIM in the front
end).
Figure 1: P2Endure e-Marketplace process structure
P2ENDURE D2.2 – BIM parametric modeller page 8 - 30
For the individual process elements, the data types are specified at the time of the respective process
sequence (e.g.: as is BIM (IFC Data format)). These data types are explained during the report.
For reasons of clarity, the individual processes were divided into two process groups. The first group
describes the as is BIM presentation. Within this group, the as is BIM is made available to the system by
the P2Endure e-Marketplace user. This is followed by a transformation of the model data in the back-end
of the system. The as is BIM is displayed in Industry Foundation Classes (IFC)1 format in the front-end view
of the e-Marketplaces and is visible to the user. The energetic and thermal data are extracted from the
model and displayed in the front-end.
The second grouping is described by "chancing data". Within these process steps, the user selects the
products available on the P2Endure e-Marketplace and adds the as is BIM data. By adding these products,
the calculation of the energetic and thermal in the back end can take place. The user can then view the
result of this calculation in the front end.
In the following section, the individual steps are explained in more detail using illustrations and
descriptions.
1IFC data model is a format for describing building and construction industry data. IFC is platform neutral, open file format. IFC is common used collaboration file format for BIM (buildingSMART, 2017).
P2ENDURE D2.2 – BIM parametric modeller page 9 - 30
3. Explanation of the system using a sample scenario The P2Endure parametric modeller consists of several components, which are combined into one system.
The objective of the modeller inside the e-Marketplace is to give the user an overview of the possible
thermal, energetic and the resulting cost savings. The output data of the as is BIM, which are provided by
the user, are compared with the parameters of the respective P2Endure e-Marketplace products which
were added to the output model.
The following chapter explains the individual components as well as the process for the calculation and
presentation of the data.
3.1 Upload the as-is BIM
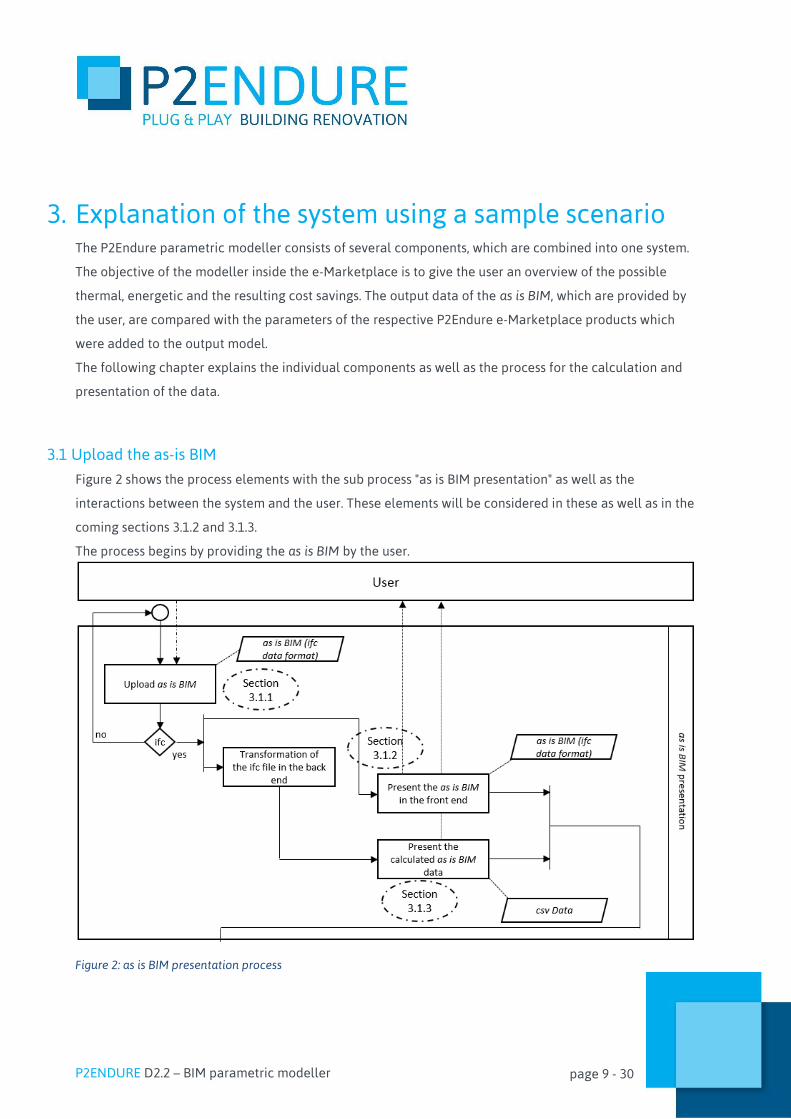
Figure 2 shows the process elements with the sub process "as is BIM presentation" as well as the
interactions between the system and the user. These elements will be considered in these as well as in the
coming sections 3.1.2 and 3.1.3.
The process begins by providing the as is BIM by the user.
Figure 2: as is BIM presentation process
P2ENDURE D2.2 – BIM parametric modeller page 10 - 30
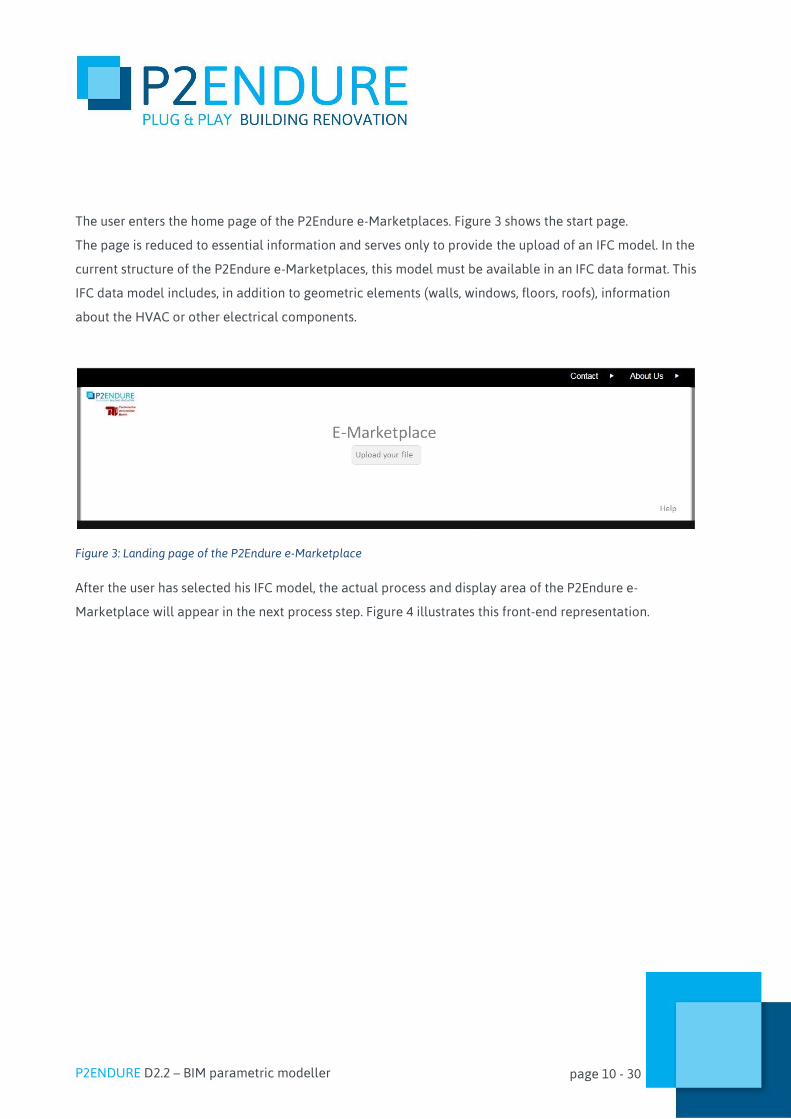
The user enters the home page of the P2Endure e-Marketplaces. Figure 3 shows the start page.
The page is reduced to essential information and serves only to provide the upload of an IFC model. In the
current structure of the P2Endure e-Marketplaces, this model must be available in an IFC data format. This
IFC data model includes, in addition to geometric elements (walls, windows, floors, roofs), information
about the HVAC or other electrical components.
Figure 3: Landing page of the P2Endure e-Marketplace
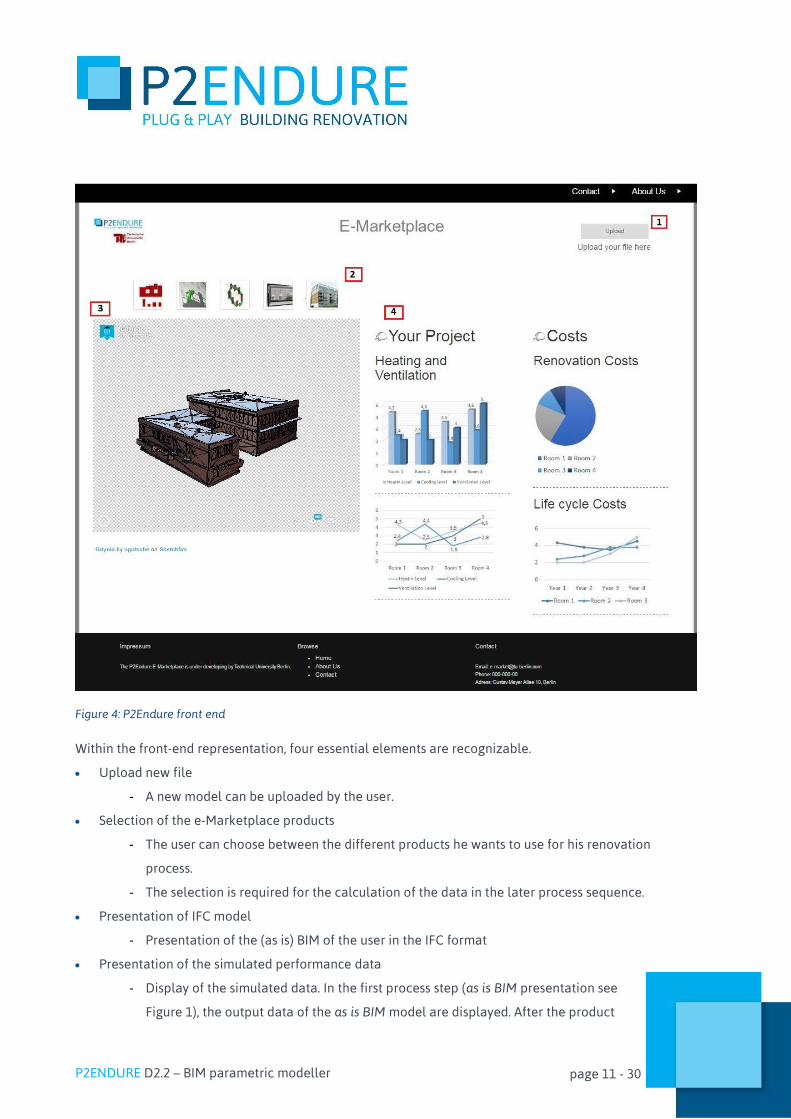
After the user has selected his IFC model, the actual process and display area of the P2Endure e-
Marketplace will appear in the next process step. Figure 4 illustrates this front-end representation.
P2ENDURE D2.2 – BIM parametric modeller page 11 - 30
Figure 4: P2Endure front end
Within the front-end representation, four essential elements are recognizable.
Upload new file
- A new model can be uploaded by the user.
Selection of the e-Marketplace products
- The user can choose between the different products he wants to use for his renovation
process.
- The selection is required for the calculation of the data in the later process sequence.
Presentation of IFC model
- Presentation of the (as is) BIM of the user in the IFC format
Presentation of the simulated performance data
- Display of the simulated data. In the first process step (as is BIM presentation see
Figure 1), the output data of the as is BIM model are displayed. After the product
P2ENDURE D2.2 – BIM parametric modeller page 12 - 30
has been added to the initial model and the calculation has been completed, the simulated
performance values are displayed.
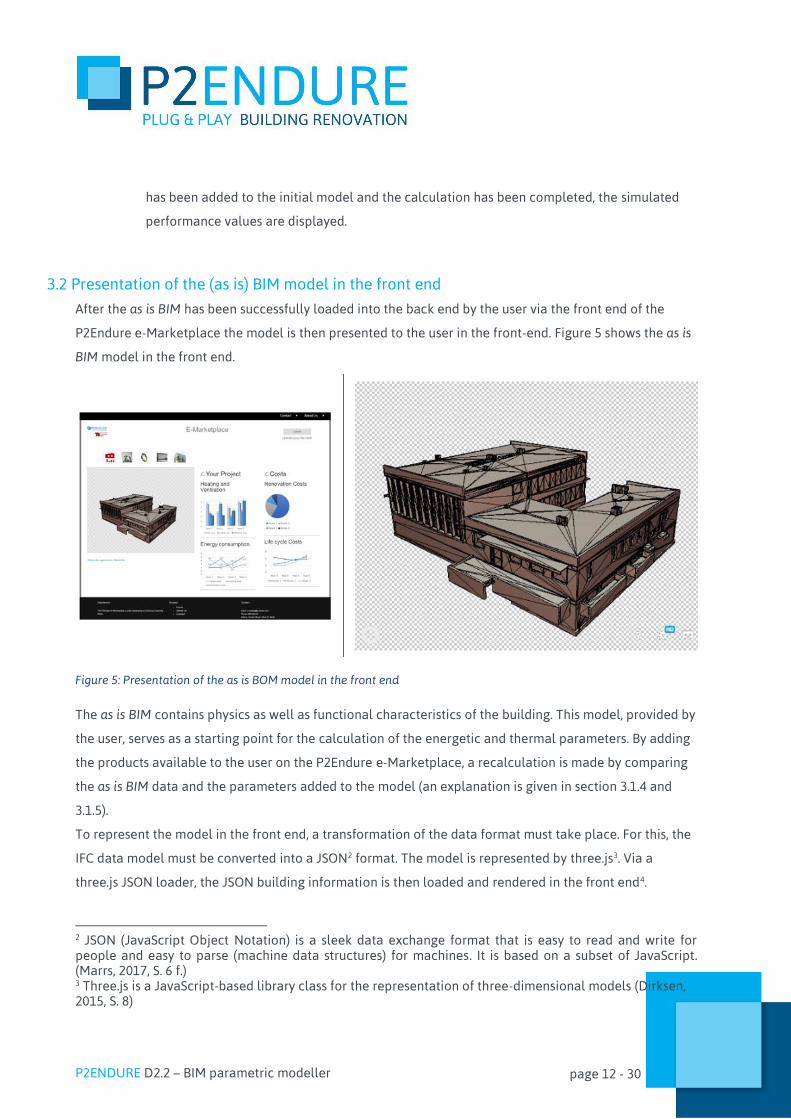
3.2 Presentation of the (as is) BIM model in the front end
After the as is BIM has been successfully loaded into the back end by the user via the front end of the
P2Endure e-Marketplace the model is then presented to the user in the front-end. Figure 5 shows the as is
BIM model in the front end.
Figure 5: Presentation of the as is BOM model in the front end
The as is BIM contains physics as well as functional characteristics of the building. This model, provided by
the user, serves as a starting point for the calculation of the energetic and thermal parameters. By adding
the products available to the user on the P2Endure e-Marketplace, a recalculation is made by comparing
the as is BIM data and the parameters added to the model (an explanation is given in section 3.1.4 and
3.1.5).
To represent the model in the front end, a transformation of the data format must take place. For this, the
IFC data model must be converted into a JSON2 format. The model is represented by three.js3. Via a
three.js JSON loader, the JSON building information is then loaded and rendered in the front end4.
2 JSON (JavaScript Object Notation) is a sleek data exchange format that is easy to read and write for people and easy to parse (machine data structures) for machines. It is based on a subset of JavaScript. (Marrs, 2017, S. 6 f.) 3 Three.js is a JavaScript-based library class for the representation of three-dimensional models (Dirksen, 2015, S. 8)
P2ENDURE D2.2 – BIM parametric modeller page 13 - 30
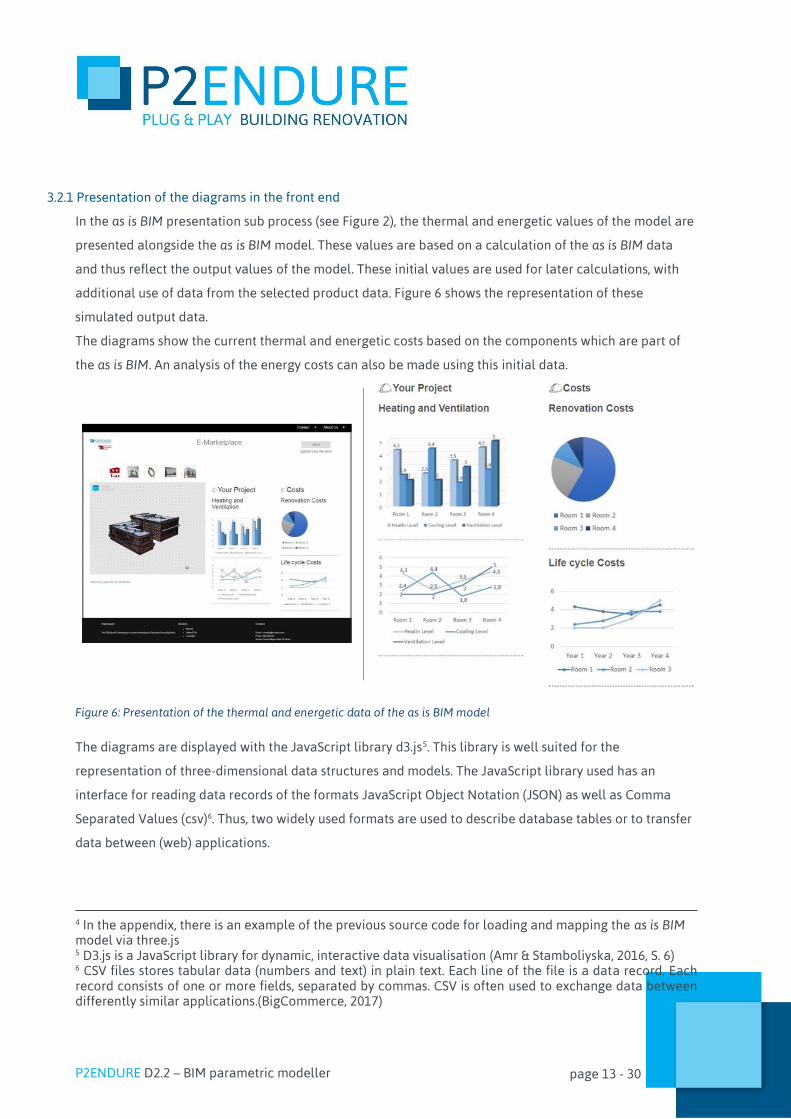
3.2.1 Presentation of the diagrams in the front end
In the as is BIM presentation sub process (see Figure 2), the thermal and energetic values of the model are
presented alongside the as is BIM model. These values are based on a calculation of the as is BIM data
and thus reflect the output values of the model. These initial values are used for later calculations, with
additional use of data from the selected product data. Figure 6 shows the representation of these
simulated output data.
The diagrams show the current thermal and energetic costs based on the components which are part of
the as is BIM. An analysis of the energy costs can also be made using this initial data.
Figure 6: Presentation of the thermal and energetic data of the as is BIM model
The diagrams are displayed with the JavaScript library d3.js5. This library is well suited for the
representation of three-dimensional data structures and models. The JavaScript library used has an
interface for reading data records of the formats JavaScript Object Notation (JSON) as well as Comma
Separated Values (csv)6. Thus, two widely used formats are used to describe database tables or to transfer
data between (web) applications.
4 In the appendix, there is an example of the previous source code for loading and mapping the as is BIM model via three.js 5 D3.js is a JavaScript library for dynamic, interactive data visualisation (Amr & Stamboliyska, 2016, S. 6) 6 CSV files stores tabular data (numbers and text) in plain text. Each line of the file is a data record. Each record consists of one or more fields, separated by commas. CSV is often used to exchange data between differently similar applications.(BigCommerce, 2017)
P2ENDURE D2.2 – BIM parametric modeller page 14 - 30
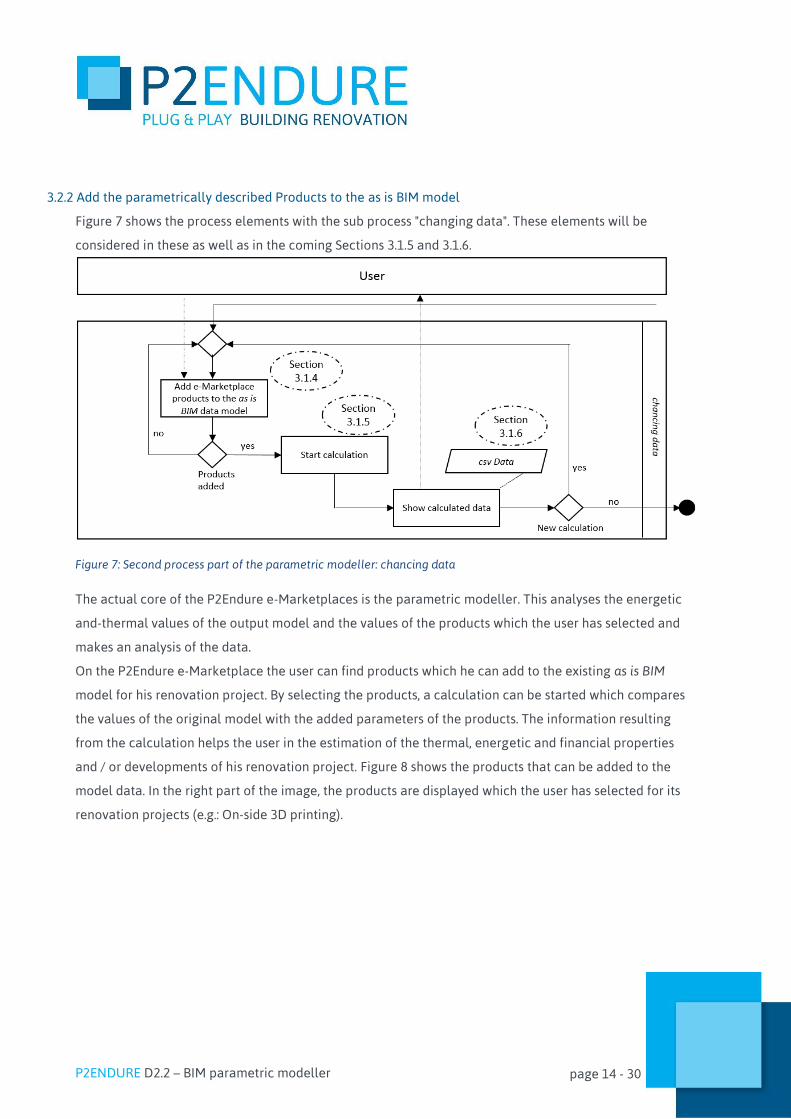
3.2.2 Add the parametrically described Products to the as is BIM model
Figure 7 shows the process elements with the sub process "changing data". These elements will be
considered in these as well as in the coming Sections 3.1.5 and 3.1.6.
Figure 7: Second process part of the parametric modeller: chancing data
The actual core of the P2Endure e-Marketplaces is the parametric modeller. This analyses the energetic
and-thermal values of the output model and the values of the products which the user has selected and
makes an analysis of the data.
On the P2Endure e-Marketplace the user can find products which he can add to the existing as is BIM
model for his renovation project. By selecting the products, a calculation can be started which compares
the values of the original model with the added parameters of the products. The information resulting
from the calculation helps the user in the estimation of the thermal, energetic and financial properties
and / or developments of his renovation project. Figure 8 shows the products that can be added to the
model data. In the right part of the image, the products are displayed which the user has selected for its
renovation projects (e.g.: On-side 3D printing).

P2ENDURE D2.2 – BIM parametric modeller page 15 - 30
Figure 8: Selection of P2Endure e-Marketplace products
Calculation is also possible with just one added product. Depending on which products were selected, the
values of the calculation change.
For the calculation to be made, the products must be described as detailed as possible by the respective
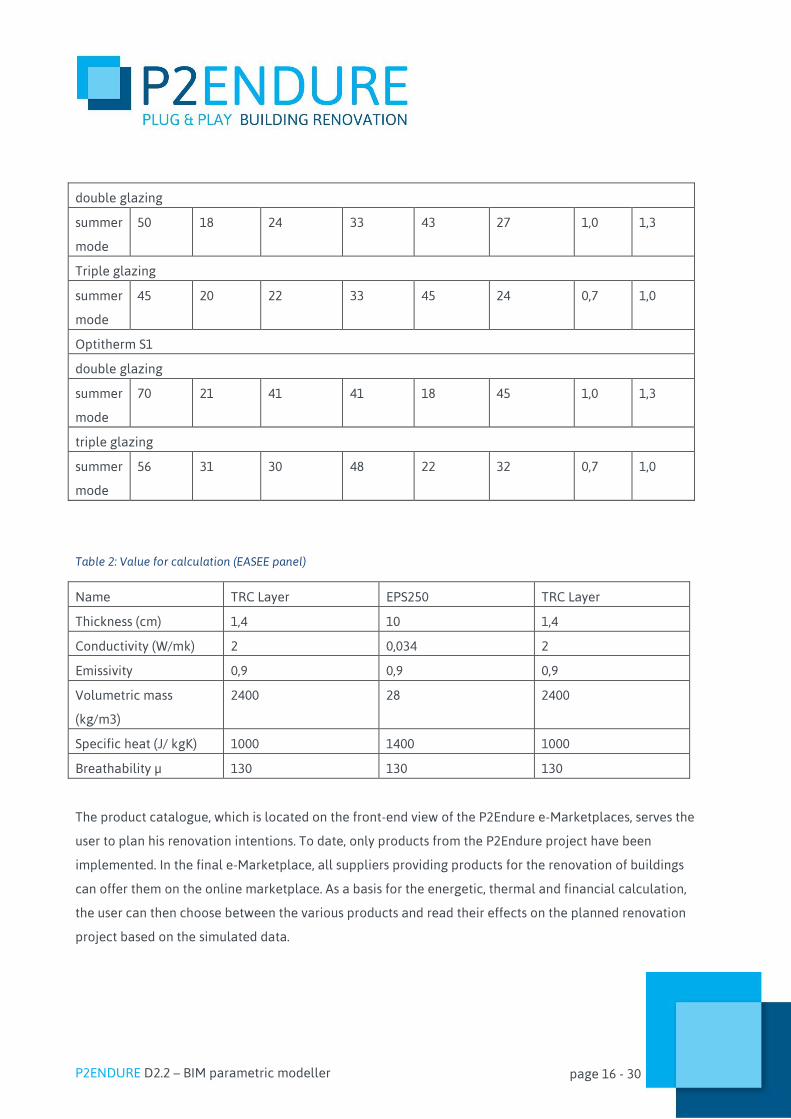
manufacturers. Table 1 and table 2 are used as an example for describing the products. Within these
tables windows (of the P2Enduer partner BGTech) as well as panels (EASEE) are described.
These parameters must be described by the manufacturers. The TU Berlin has developed a UML diagram
for the orientation of the product description in which the necessary attributes of the respective product
group can be found. Such a product description is necessary since no calculation can take place without
this. The parameterized description of the data is stored in a product catalog. The data is in a .csv data
format. These data are loaded from the back end via an interface. The interface is created as a jsx7 file.
The parameters of the products are integrated into the IDF model of the as is BIM by means of an
interface. By integrating these values, a calculation can be made between the "old" as is BIM model
parameters and the new model (with added e-Marketplace products).
Table 1: Value for the calculation (BGTec window)
Light Solar radiant heat
Gla
zing
u-V
alue
Win
dow
u-V
alue
tran
smit
tan
ce
refl
ecta
nce
Dir
ect
tran
smit
tan
ce
Ref
lect
ance
Abs
orp
tanc
e g-va
lue
(to
tal
tran
smit
tan
ce)
Suncool 50/52
7 JSX is statically typed, object oriented programming language for web browser (DeNA, 2013).
P2ENDURE D2.2 – BIM parametric modeller page 16 - 30
double glazing
summer
mode
50 18 24 33 43 27 1,0 1,3
Triple glazing
summer
mode
45 20 22 33 45 24 0,7 1,0
Optitherm S1
double glazing
summer
mode
70 21 41 41 18 45 1,0 1,3
triple glazing
summer
mode
56 31 30 48 22 32 0,7 1,0
Table 2: Value for calculation (EASEE panel)
Name TRC Layer EPS250 TRC Layer
Thickness (cm) 1,4 10 1,4
Conductivity (W/mk) 2 0,034 2
Emissivity 0,9 0,9 0,9
Volumetric mass
(kg/m3)
2400 28 2400
Specific heat (J/ kgK) 1000 1400 1000
Breathability µ 130 130 130
The product catalogue, which is located on the front-end view of the P2Endure e-Marketplaces, serves the
user to plan his renovation intentions. To date, only products from the P2Endure project have been
implemented. In the final e-Marketplace, all suppliers providing products for the renovation of buildings
can offer them on the online marketplace. As a basis for the energetic, thermal and financial calculation,
the user can then choose between the various products and read their effects on the planned renovation
project based on the simulated data.

P2ENDURE D2.2 – BIM parametric modeller page 17 - 30
3.2.3 Configuration of the (as is BIM) data file for the energetic, thermal and financial calculation
The BIM model provided under the first process step must be processed for further processing of the data.
The EnergyPlus software is used to calculate the data. This software requires an Intermediate Data Format
(IDF)8 format to evaluate the data. In the ideal case, a consistent exchange of information must ideally
implement seamless communication under various software, making manual and repeated data input
unnecessary.
The as is BIM model data, provided by the user, are in an IFC data format. For a calculation of the data, a
transformation into the IDF data format must be carried out. The aim of these microservices is to integrate
a transformation concept which converts the geometry of the building in such a way that the EnergyPlus9
calculation software can read and evaluate the data. These transformed, geometric building data contain
the information of the building material as defined in the original data.
However, EnergyPlus cannot process the complex building structure. Therefore, data must be simplified
during transformation. The data transforming concept of the TU Berlin therefore initially presents walls,
windows, façades and zones. With the successful conversion of the data formats the calculation of the
energetic data based on the building information, can be initiated.
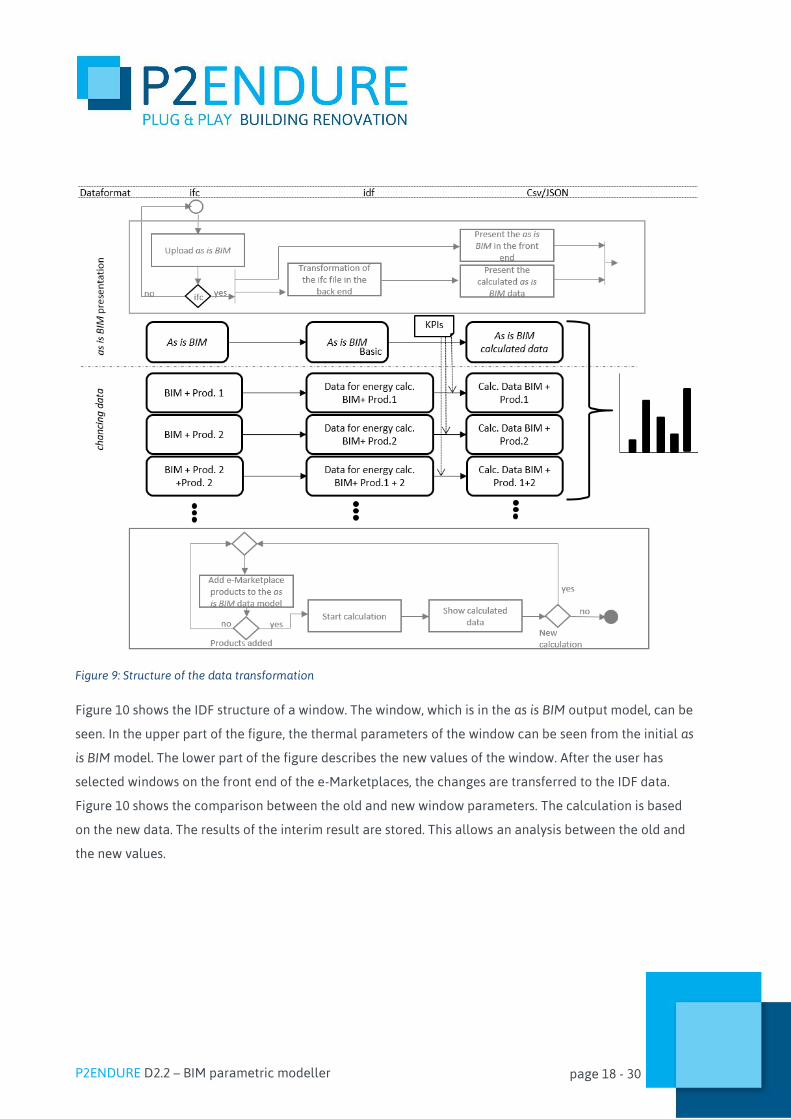
Figure 9 shows the process of transformation. The flowcharts "as is BIM presentation" and "chancing data"
are inserted above and below this process representation. They are intended to illustrate the
transformation of the data in relation to the parametric model process sequence.
The starting point is the as is BIM model in the IFC data format. The IFC model is converted into an IDF
data format by a data transformation which takes place in the back-end. This IDF format is read by the
software EnergyPlus. Based on these data the thermal and energetic calculation is carried out. The
generated calculation data are transferred to the front end as JSON or CSV data and are displayed
graphically using d3.js. After the users has added products from the P2Endure e-Marketplace to their
renovation project, the data transformation proceeds in the same way. The data are converted into an IDF
format and are thus available to the calculation software. In addition to the data of the existing system,
the software now also calculates the parameters of the products. The results are passed to the front-end.
This process of calculation is possible both for the acquisition of one product as well as for several
products.
8 The IDF data format is originally used for exchanging data between electrical and mechanical CAD/CAE systems for use in 3D design (Kehmeier, 1996, S. 1). 9 EnergyPlus is a building energy simulation program for calculating energy consumption (heating, cooling, ventilation, lighting) and water use in buildings (EnergyPlus, 2017).
P2ENDURE D2.2 – BIM parametric modeller page 18 - 30
Figure 9: Structure of the data transformation
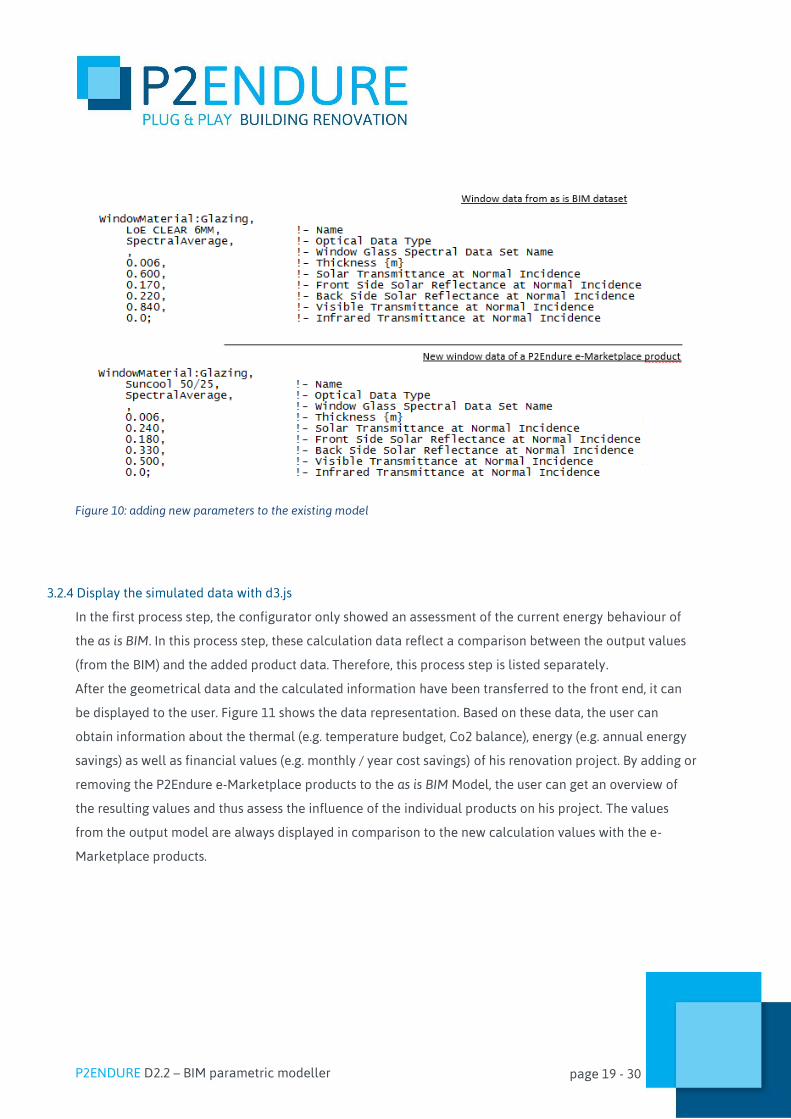
Figure 10 shows the IDF structure of a window. The window, which is in the as is BIM output model, can be
seen. In the upper part of the figure, the thermal parameters of the window can be seen from the initial as
is BIM model. The lower part of the figure describes the new values of the window. After the user has
selected windows on the front end of the e-Marketplaces, the changes are transferred to the IDF data.
Figure 10 shows the comparison between the old and new window parameters. The calculation is based
on the new data. The results of the interim result are stored. This allows an analysis between the old and
the new values.
P2ENDURE D2.2 – BIM parametric modeller page 19 - 30
Figure 10: adding new parameters to the existing model
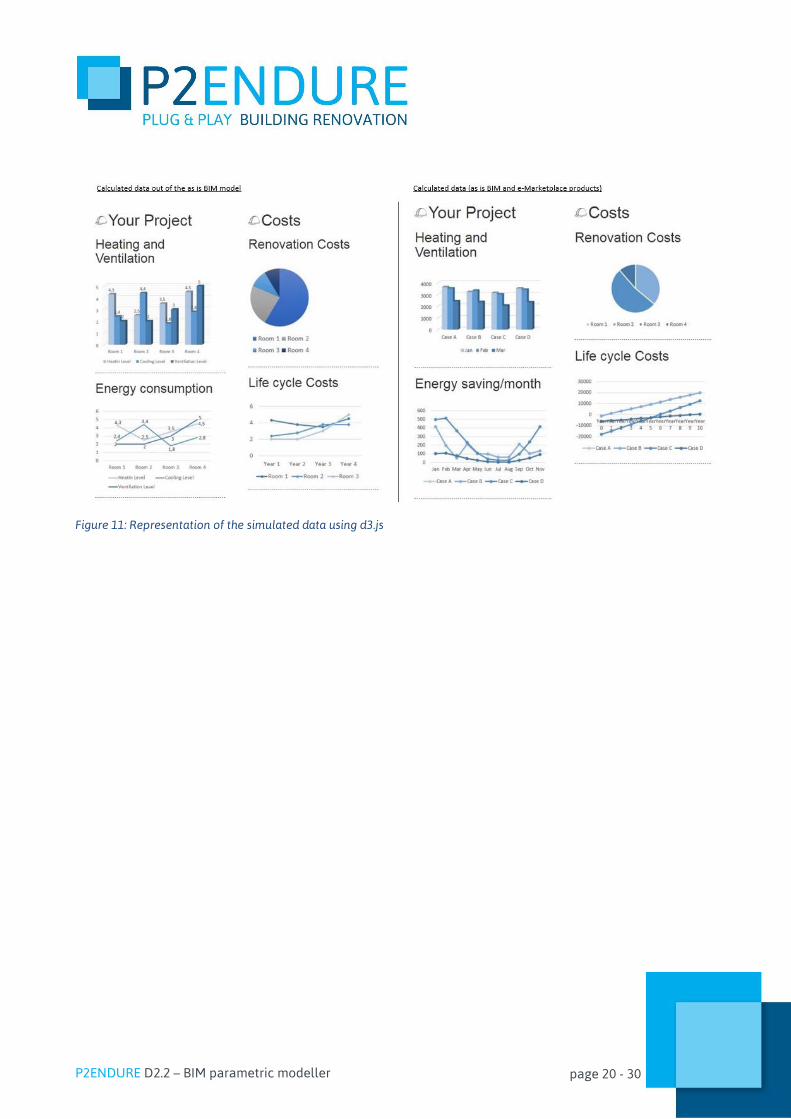
3.2.4 Display the simulated data with d3.js
In the first process step, the configurator only showed an assessment of the current energy behaviour of
the as is BIM. In this process step, these calculation data reflect a comparison between the output values
(from the BIM) and the added product data. Therefore, this process step is listed separately.
After the geometrical data and the calculated information have been transferred to the front end, it can
be displayed to the user. Figure 11 shows the data representation. Based on these data, the user can
obtain information about the thermal (e.g. temperature budget, Co2 balance), energy (e.g. annual energy
savings) as well as financial values (e.g. monthly / year cost savings) of his renovation project. By adding or
removing the P2Endure e-Marketplace products to the as is BIM Model, the user can get an overview of
the resulting values and thus assess the influence of the individual products on his project. The values
from the output model are always displayed in comparison to the new calculation values with the e-
Marketplace products.
P2ENDURE D2.2 – BIM parametric modeller page 20 - 30
Figure 11: Representation of the simulated data using d3.js
P2ENDURE D2.2 – BIM parametric modeller page 21 - 30
4. Evaluation of the current results The results so far provide a very good basis for further research work at the TU Berlin in the BIM
parametric modeller. It has been shown that a system can be created with the help of a well-thought-out
process sequence and incorporating various micro services e-Marketplaces. The parametric modeller can
create a data calculation based on parameters, which allows the user a detailed representation of the
values of his renovation project. For the system to have the best possible performance and to be scalable,
lean data formats are used to transmit the information. The individual micro services (such as the
representation of the simulated data using d3.js) are designed in such a way that they are easily
expandable. Thus, new parameters in the data transmission can be easily reacted.
The Configurator can directly influence user decision-making. Through the parametric modeller, the users
can
analyse the energy-related comparisons,
analyse the resulting costs and
select different products
thus optimally utilizing their budget for the renovation process.
To illustrate the influence, two examples are given. The P2Endure Demo cases from Warsaw and Tilburg
are used for this purpose. The energy-thermal calculation of the data should be illustrated once again10.
Table 3 shows examples of the products added to the demo cases.
Table 3: Example: Selection of products for three demo cases (selection is for illustrative purposes only)
EASEE Panel Smart Window Rooftop
retrofitting
PnP HVAC 3D printing
Warsaw X X X
Tilburg X X X
In these projects, the products marked with an X from the P2Endure e-Marketplace are to be added as an
example.
10 The P2Endure demo case from Gydnia has already been used in chapter 3.1 to illustrate the operation of the parametric modeling
P2ENDURE D2.2 – BIM parametric modeller page 22 - 30
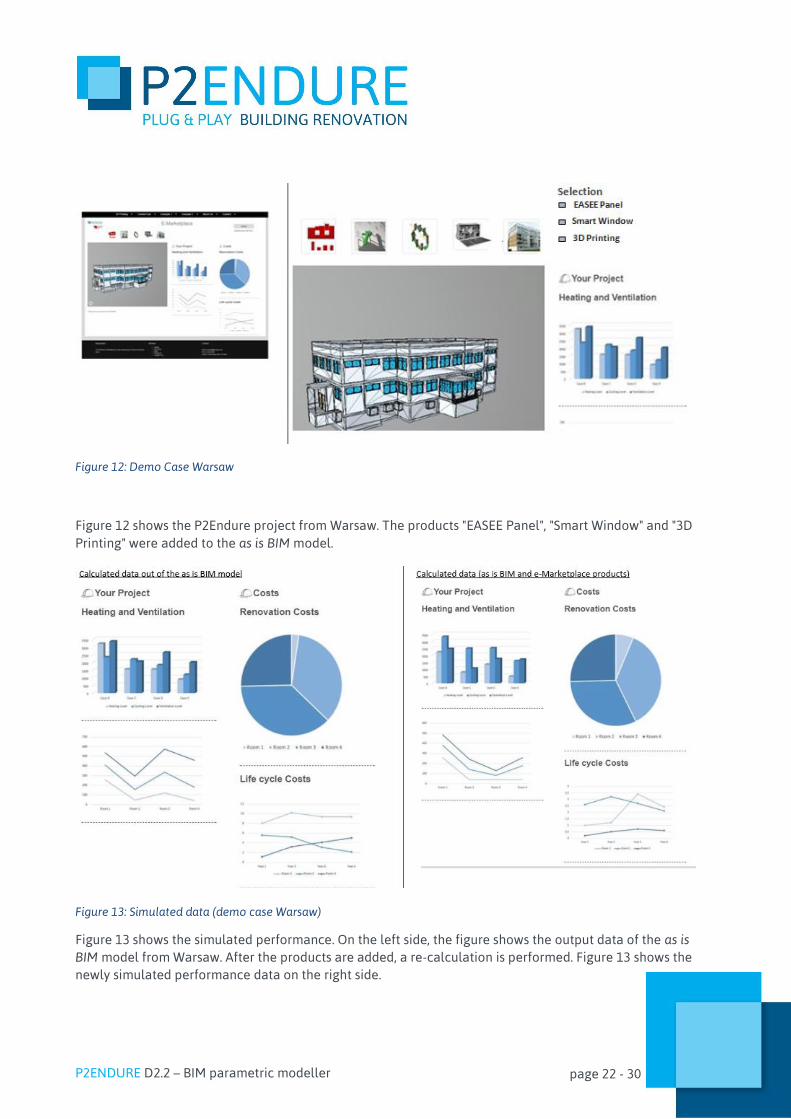
Figure 12: Demo Case Warsaw
Figure 12 shows the P2Endure project from Warsaw. The products "EASEE Panel", "Smart Window" and "3D Printing" were added to the as is BIM model.
Figure 13: Simulated data (demo case Warsaw)
Figure 13 shows the simulated performance. On the left side, the figure shows the output data of the as is BIM model from Warsaw. After the products are added, a re-calculation is performed. Figure 13 shows the newly simulated performance data on the right side.
P2ENDURE D2.2 – BIM parametric modeller page 23 - 30
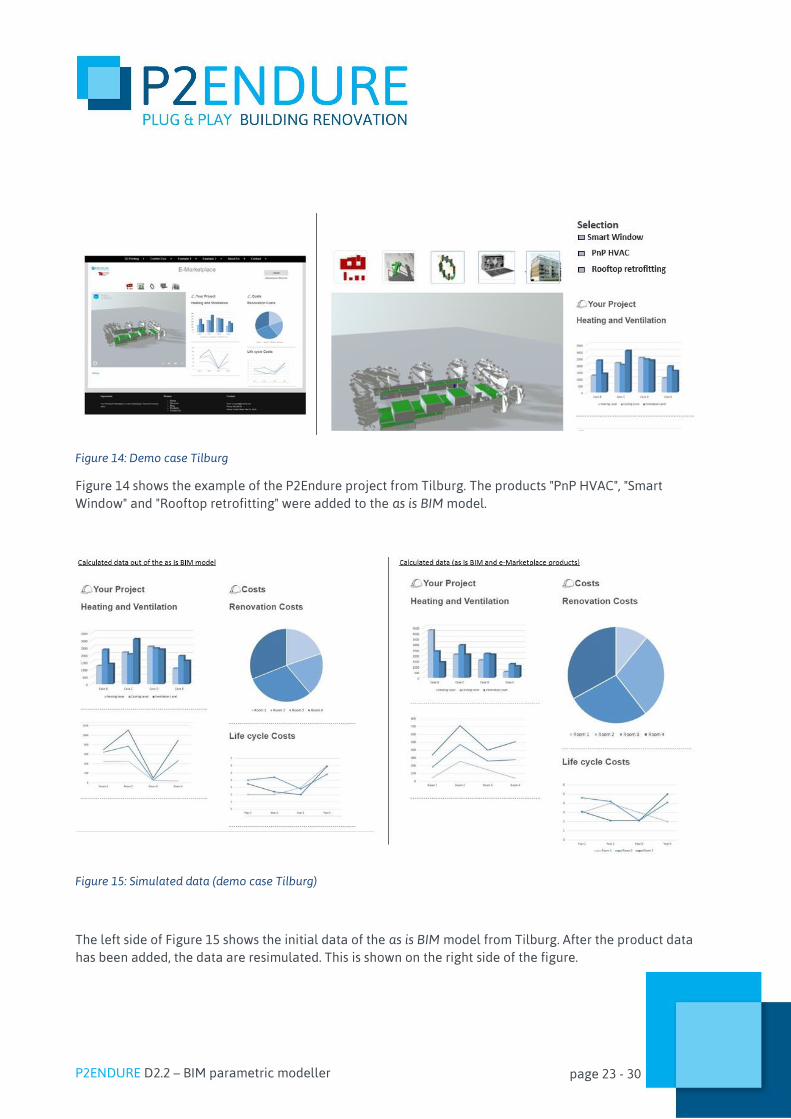
Figure 14: Demo case Tilburg
Figure 14 shows the example of the P2Endure project from Tilburg. The products "PnP HVAC", "Smart Window" and "Rooftop retrofitting" were added to the as is BIM model.
Figure 15: Simulated data (demo case Tilburg)
The left side of Figure 15 shows the initial data of the as is BIM model from Tilburg. After the product data has been added, the data are resimulated. This is shown on the right side of the figure.

P2ENDURE D2.2 – BIM parametric modeller page 24 - 30
5. Discussion and further research work The P2Endure parametric Modeller offers the user the possibility to plan his/her renovation project by
adding product solutions before the actual start with regard to the energetic, thermal and financial
parameters. The products, which can be added by the user to their respective as is BIM model, are
described by parameters and stored centrally in a product catalog. To describe the products, the
respective providers must provide the minimum requirements for product information. These
requirements were designed by the TU Berlin in the form of a UML diagram and serve as a guideline. In
the course of the project, however, these guidelines will be repeatedly questioned, checked for
consistency and, if necessary, supplemented or removed. With the help of the P2Endure partners
iteratively an optimal amount of information to the respective product groups is found.
The results obtained so far from the P2Endure parametric modeller form the basis for further research
activities. With the results so far, the TU Berlin has created a stable, scalable and high-performance
framework. The further research work will include:
Dynamic import and analysis of data
- In the representation of the simulated data by d3.js.,
- in the data transformation of IFC to IDF as well as,
- in the transformation of IDF into CSV or JSON.
In addition, the implementation of the P2Endure e-Marketplace is to be expanded in such a way that
the integration of different products by providers becomes possible. For this purpose extensive test
data are created, which can be used for simulation and testing.
Likewise, the front end is examined for errors in usability and, if necessary, improved. The back-end system
is subjected to a performance test and checked for good scalability. All components used are subject to a
good maintainability or good support.
The announcement in deliverables 2.2 (a prototypical configurator, which allows the configuration of the
data of all test cases using Autodesk software) requires two changes to be added.
In contrast to the suggestions in the initial proposal text, we decided against the implementation of the
Autodesk Dynamo software. This is mainly because the P2Endure consortium decided to use Open BIM
standards and software throughout the project. The Autodesk software is only usable under license and
therefore not open source. Thus, the broad and simple integration and provision of the parametric
modeling cannot be guaranteed. The TU Berlin has therefore decided to develop the parametric modeller
from a combination of web-based applications and the software EnergiePlus.
P2ENDURE D2.2 – BIM parametric modeller page 25 - 30
The advantage of this choice is the development of a stable, scalable open source application. This allows
the development and adaptation of the individual software elements without restriction. The future
integration and application of the software solution is also possible for the users without restrictions.
Unfortunately, at time of writing this report we were not able to show the functioning of the existing
prototypical configurator on all P2Endure Demo cases. The reason for this is the lack of energetic building
data. However, these data form the basis for the representation of a calculation. Therefore, test data are
currently being used to control the operation of the parametric modelling. However, these test data
already give an impression of the functioning of the existing prototype.
P2ENDURE D2.2 – BIM parametric modeller page 26 - 30
6. Conclusions The P2 Endure parametric modeller offers the user the opportunity to create energetic, thermal and
financial calculations. The respective micro-services form a consistent, scalable and well-maintainable
system.
The starting point of the calculation is the as is BIM model, which is provided by the user. The user can add
products, which are on the P2Endure e-Marketplace, to this model. By comparing the "old" as is BIM model
parameters and the new added product parameters, a calculation can be generated in the back end. This
calculation takes the thermal and energetic values as the starting point and thus generates information,
which provides the user in the front end as diagrams about the expected values. Based on the thermal and
energetic data, financial expectations are also provided to the user.
With the development of the P2Endure parametric modeller, TU Berlin has laid a foundation for further
research. The system and its components and the interfaces between the components have already been
defined. The basic operation of the individual components has already been worked out.
The individual micro services of the system are further refined for future research activities.
Research requirements include the conversion of IFC to IDF as well as the dynamic transfer of the product
data into existing IDF model data.
P2ENDURE D2.2 – BIM parametric modeller page 27 - 30
References
Amr, T., & Stamboliyska, R. (2016). Practical D3.js - Master the use of D3.js in the real world. New York:
Apress.
BigCommerce. (2017). What is a CSV file. Retrieved from
https://support.bigcommerce.com/articles/Public/What-is-a-CSV-file-and-how-do-I-save-my-
spreadsheet-as-one
buildingSMART. (2017). Standards. Retrieved from https://www.buildingsmart.de/bim-knowhow/standards
DeNA. (2013). What is JSX? Retrieved from https://jsx.github.io
Dirksen, J. (2015). Three.js Cookbook. Birmingham: Packt Publishing Ltd.
EnergyPlus. (2017). EnergyPlus. Retrieved from https://energyplus.net
Kehmeier, D. (1996). Intermediate Data Format - Mechanical Data Exchange Specification for the Design
and Analysis of Printed Wiring Assemblies.
Marrs, T. (2017). JSON at Work: Practical Data Integration for the Web. Sebastopol, Califonia: O'Reilly.

P2ENDURE D2.2 – BIM parametric modeller page 28 - 30
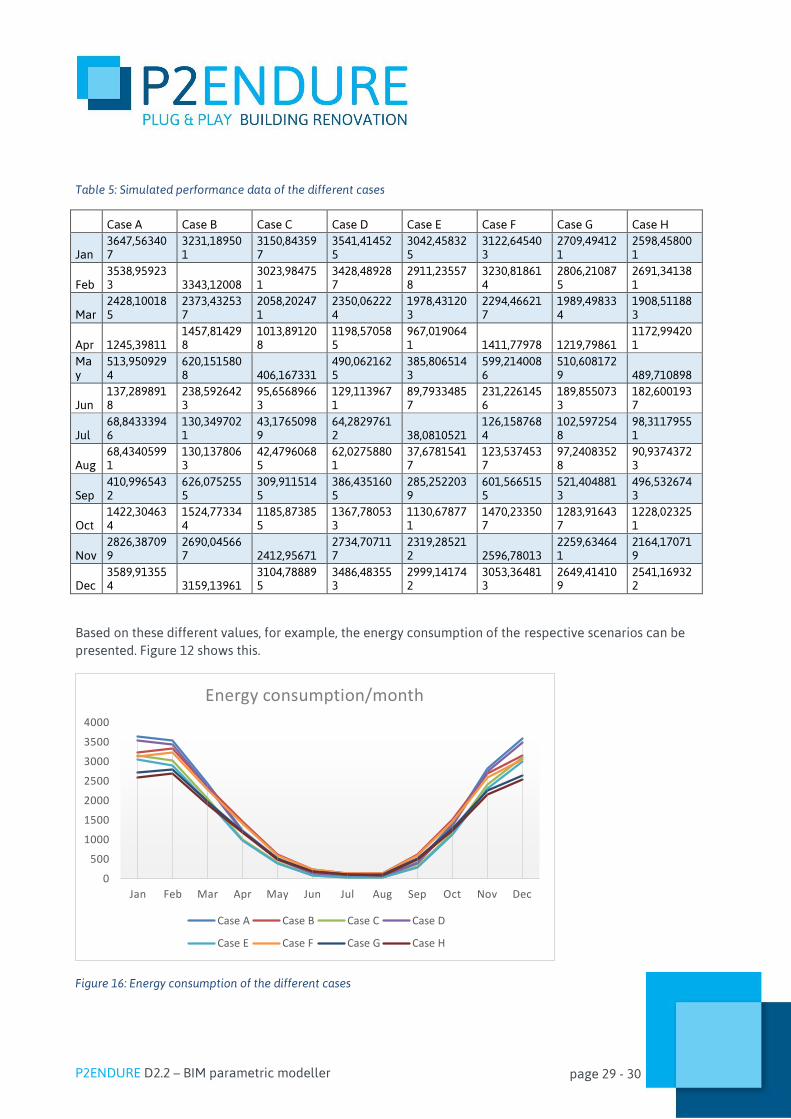
Appendix 1 - Calculation A simulation scenario is presented in Tables 3 and 4. The following elements with the respective parameters are considered:
Window:
- Single pane and double pane
Building façade
- Thermal resistance: 2.29 and 3.29 m2 k/W
Rooftop
- Thermal resistance: 5.45 and 6.45 m2 k/W
Eight different scenarios are included in the calculation. Table 3 shows these simulation cases. These
scenarios simulate the possibilities that the user has when selecting their products on the P2Endure e-
Marketplace. Depending on the choice he makes, other parameters are used in the simulation of
energetic, thermal and financial analysis. Table 4 describes the results of the calculation. These results
consider the parameters of the respective cases and generate a monthly analysis of the energy
consumption. The individual cases are combined in the diagram. The diagram shows the monthly energy
consumption using the various product parameters the user has added to the as is BIM.
Table 4: Simulation cases
Simulation cases Window Building Facade Rooftop
Case A Single Pane 2,29 5,45
Case B Double Pane 2,29 5,45
Case C Single Pane 3,29 5,45
Case D Single Pane 2,29 6,45
Case E Single Pane 3,29 6,45
Case F Double Pane 2,29 6,45
Case G Double Pane 3,29 5,45
Case H Double Pane 3,29 6,45
P2ENDURE D2.2 – BIM parametric modeller page 29 - 30
Table 5: Simulated performance data of the different cases
Case A Case B Case C Case D Case E Case F Case G Case H
Jan 3647,563407
3231,189501
3150,843597
3541,414525
3042,458325
3122,645403
2709,494121
2598,458001
Feb 3538,959233 3343,12008
3023,984751
3428,489287
2911,235578
3230,818614
2806,210875
2691,341381
Mar 2428,100185
2373,432537
2058,202471
2350,062224
1978,431203
2294,466217
1989,498334
1908,511883
Apr 1245,39811 1457,814298
1013,891208
1198,570585
967,0190641 1411,77978 1219,79861
1172,994201
May
513,9509294
620,1515808 406,167331
490,0621625
385,8065143
599,2140086
510,6081729 489,710898
Jun 137,2898918
238,5926423
95,65689663
129,1139671
89,79334857
231,2261456
189,8550733
182,6001937
Jul 68,84333946
130,3497021
43,17650989
64,28297612 38,0810521
126,1587684
102,5972548
98,31179551
Aug 68,43405991
130,1378063
42,47960685
62,02758801
37,67815417
123,5374537
97,24083528
90,93743723
Sep 410,9965432
626,0752555
309,9115145
386,4351605
285,2522039
601,5665155
521,4048813
496,5326743
Oct 1422,304634
1524,773344
1185,873855
1367,780533
1130,678771
1470,233507
1283,916437
1228,023251
Nov 2826,387099
2690,045667 2412,95671
2734,707117
2319,285212 2596,78013
2259,634641
2164,170719
Dec 3589,913554 3159,13961
3104,788895
3486,483553
2999,141742
3053,364813
2649,414109
2541,169322
Based on these different values, for example, the energy consumption of the respective scenarios can be presented. Figure 12 shows this.
Figure 16: Energy consumption of the different cases
0
500
1000
1500
2000
2500
3000
3500
4000
Jan Feb Mar Apr May Jun Jul Aug Sep Oct Nov Dec
Energy consumption/month
Case A Case B Case C Case D
Case E Case F Case G Case H
P2ENDURE D2.2 – BIM parametric modeller page 30 - 30
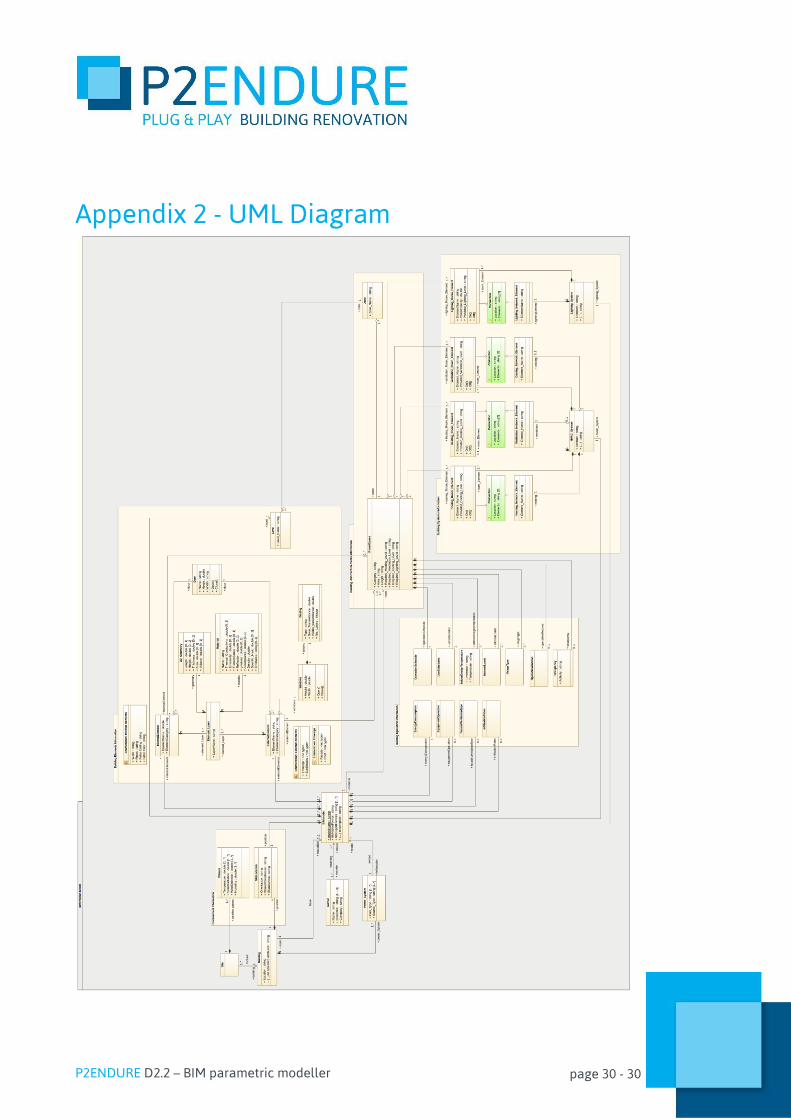
Appendix 2 - UML Diagram