Embed Size (px)
Citation preview

i
BIMODAL POROUS CERAMIC MEMBRANE VIA NANOSIZED POLYSTYRENE TEMPLATING: SYNTHESIS, CHARACTERIZATION
AND PERFORMANCE EVALUATION
by
LEO CHOE PENG
Thesis submitted in fulfillment of the requirements for the degree of
Doctor of Philosophy
May 2008

ii
ACKNOWLEDGEMENTS
On top of the list of acknowledgements, I would like to thank my parents Mr.
Leo Kim Bin and Madam Yeoh Sok Kim for giving never-ending love and support in
my life and, of course, my study. I’m grateful that I have a big family (including
Chee Hooi, Chin Tai, Choe Yin, You Foo, Choe Qun, Choe Shuang, Marcus and
Amanda) to share the sweet and sour in these years.
Apart from my family, two people have been extremely important in my
scientific development: Prof. Abdul Latif Ahmad and Dr. Syamsul Rizal Abd.
Shukor who made it possible for me to start my research in USM. Your practical
view and guidance on my study was of the utmost importance. Thank you for the
endless support throughout these three years. In addition, I would like to express my
grateful thanks to USM for providing PASCA scholarship and USM Short Term
Grant.
Also, thanks to friends in USM for their company and guidance, Ooi,
Sumathi, Derek, Siew Chun, Ramesh, Choi Yee, Pei Chin, Siang Piao, Sim, and
Sunarti. Without you all, labs and Ph. D. room are peaceful but dull. Special thanks
to Choo Weng, Ee Mee and Prof. Wahab too for encouraging me to continue study.
Not forgetting also, many thanks to the staff of School of Chemical Engineering
especially lecturers, office staff and technicians. It is a pity that it is not possible here
to thank everybody in and around USM that I got to know personally through these
years. Still, to everyone who is listed and all others that I forgot, I will miss you very
much.

iii
TABLE OF CONTENTS
Acknowledgement ii
Table of Contents iii
List of Tables ix
List of Figures xiii
List of Plates xviii
List of Symbols xix
List of Abbreviations xxv
Abstrak. xxiv
Abstract xxvi
CHAPTER 1 - INTRODUCTION
1.1 Membrane Separation Technology 1
1.1.1 Nanofiltration (NF) 3
1.1.2 Ceramic membranes with high stability 4
1.1.3 Sol-gel method for the preparation of ceramic membranes 6
1.1.4 General application of ceramic membranes in liquid phase separation
9
1.2 Problem Statements 11
1.3 Research Objectives 14
1.4 Research Scope 15
1.5 Organization of the Thesis 17
CHAPTER 2 - LITERATURE REVIEW
2.1 Membrane Support for Sol-gel Derived Membranes 21
2.1.1 Common preparation methods of membrane supports 21
2.1.2 Tape casting of asymmetric membrane supports 23
2.2 Tailoring Pores in Ceramics by Templating 27
2.2.1 Sphere templating for sol-gel derived ceramics 31
2.2.2 Sphere templates and its removal methods 34

iv
2.2.3 Ordering of spheres and interstices filling with sols 37
2.2.4 Ceramics templated by spheres and related applications 40
2.3 Sol-gel Derived Ceramic Membranes for Nanofiltration (NF) 43
2.3.1 Sol-gel derived ceramic membranes 44
2.3.2 Ceramic membranes for nanofiltration (NF) 51
2.3.2(a) Separation of neutral solutes 52
2.3.2(b) Separation of charged solutes 53
2.3.2(c) Organic molecules and electrolyte separation 58
CHAPTER 3 - NANOFILTRANTION TRANSPORT MODEL
3.1 Transport in Membranes 62
3.2 Transport equation: Extended Nernst-Planck (ENP) 63
3.3 Donnan Steric Pore Model (DSPM) for Ion Transport through NF Membranes
65
3.3.1 Model assumptions 65
3.3.2 Basic equation of Donnan Steric Pore Model (DSPM) 66
3.3.3 Equilibrium partitioning 69
3.3.4 Concentration polarization 70
3.3.5 Pore size and effective thickness/porosity determination 71
3.3.6 Effective volume charge density determination 72
3.4 Combined Film Theory-extended Nernst-Planck Equation (CF-ENP) 74
CHAPTER 4 - MATERIALS AND METHODS
4.1 Materials and Chemicals 78
4.2 Membrane Support Preparation Method 81
4.2.1 Preparation of alumina slurry 81

v
4.2.2 Doctor blade casting of alumina green tapes 81
4.2.3 Design of experiments (DOE) for studying effect of organic mixture added and casting gap on tape thickness
82
4.2.4 Pressing and sintering of α-alumina membrane support 84
4.2.5 Filtration unit and experimental rig for liquid permeation test 85
4.2.6 Water permeability test 86
4.2.7 Design of experiments (DOE) for preliminarily study on the significance of tape thickness and organic content on support permeability flux
87
4.2.8 Design of experiments (DOE) for preparing membrane support with high permeability and acceptable yield loss
88
4.2.9 Characterization of support structure using scanning electron microscope (SEM)
90
4.3 Synthesis and Characterization of Template and Bimodal Porous γ-Alumina
90
4.3.1 Synthesis of nanosized polystyrene (PS) spheres 90
4.3.2 Characterization of template using transmission electron microscope (TEM)
91
4.3.3 Preparation of boehmite sol 91
4.3.4 Preparation of γ-alumina with bimodal pore size distribution 92
4.3.5 Thermal gravimetric analysis (TGA) of boehmite sols with different quantities of templating units
93
4.3.6 Viscosity measurement for boehmite sols with different quantities of templating units
93
4.3.7 Characterization of γ-alumina using transmission electron microscope (TEM)
93
4.3.8 Characterization of γ-alumina using Fourier- transform infrared (FT-IR)
94
4.3.9 Characterization of γ-alumina using X-ray diffraction (XRD) 94
4.3.10 Study on the effect of heat treatment on templated pores 94
4.3.11 N2 adsorption/desorption 94
4.3.12 Determination of adsorption rate constant for γ-alumina with different porous structures
95

vi
4.4 Synthesis and Characterization of Bi-layered Membranes with Bimodal Porous Intermediate Layers
97
4.4.1 Synthesis of γ-alumina thin layers with bimodal pore size distribution
97
4.4.2 Characterization of supported γ-alumina layers using scanning electron microscope (SEM)
97
4.4.3 Determination of permeability and specific resistance for supported γ-alumina layers
97
4.4.4 Polyethylene glycol (PEG) retention test for pore size determination of γ-alumina thin layers
99
4.4.5 Determination of the ratio of effective membrane thickness to porosity for γ-alumina layers
99
4.4.6 Synthesis of surfactant templated silica and silica/γ-alumina bi-layered membranes
101
4.4.7 Characterization of surfactant templated silica using transmission electron microscope (TEM), X-ray diffraction (XRD) and N2 adsorption/desorption
102
4.4.8 Characterization of bi-layered membranes using scanning electron microscope (SEM) and energy dispersive X-ray microanalysis (EDX)
102
4.4.9 Water permeability test for bi-layered membranes 102
4.4.10 Determination of permeability and specific resistance for silica layers
102
4.4.11 PEG retention test for pore size determination of silica layers 102
4.4.12 Determination of the ratio of effective membrane thickness to porosity for silica layer
103
4.5 Performance Evaluation of Bi-layered Membranes in Organic and Inorganic Ions Separation
103
4.5.1 Dye separation test 103
4.5.2 Measurement of dye content 104
4.5.3 Study of flux decline due to osmotic pressure, concentration polarization and adsorption
104
4.5.4 Salt separation test 105
4.5.5 Measurement of pH 106
4.5.6 Measurement of NaCl Content 106
4.5.7 Determination of charge density (Xd) for bi-layered membranes
107
4.5.8 Determination of transport mechanism of salt through bi-layered membranes
107

vii
4.6 Performance Evaluation of Bi-layered Membranes with Bimodal Porous Intermediate Layer in Dye-Salt-Water Separation
108
4.6.1 Measurement of NaCl content in permeate samples from dye-salt-water separation
108
4.6.2 Measurement of dye content in permeate samples from dye-salt-water separation
108
4.6.3 Determination of permeate flux in permeate samples from dye-salt-water separation
109
4.6.4 Response surface method (RSM) for nanofiltration (NF) of dye-salt-water separation.
109
4.6.5 Optimization of dye-salt-water separation using nonlinear programming method
111
CHAPTER 5 – RESULTS AND DISCUSSION
5.1 Preparation of α-Alumina Support from Green Tapes 112
5.1.1 Linear model for casting green tapes with different organic contents and thicknesses
112
5.1.2 Preliminary study on significant factors affecting support permeability
119
5.1.3 Preparation of membrane supports with high permeability and acceptable yield loss
123
5.1.4 Verification of deduced quadratic models for support permeability and yield loss
129
5.2 Bimodal Porous γ-Alumina: Template, Sol and Calcined Oxide 131
5.2.1 Characteristics of nanosized polystyrene (PS) spheres 131
5.2.2 Effect of template amount on sol characteristics 133
5.2.3 Effect of template amount on calcined γ-alumina characteristics
137
5.2.4 Effect of heat treatment on templated secondary pores
142
5.2.5 Optimized templated γ-alumina – porosity and adsorption kinetic study
145
5.3 Bi-layered Membrane with Bimodal Porous Intermediate Layer: Improved Permeability
150
5.3.1 Thin layers of supported γ-alumina with different porous structures
151
5.3.2 Characteristics of templated silica 159
5.3.3 Characteristics of bi-layered membranes with different types of intermediate layers
163

viii
5.4 Organic and Inorganic Ions Transport Characteristics of Bi-layered Membranes with Different Secondary Pore Volumes
169
5.4.1 Effect of pressure and concentration on rejection in dye separation
170
5.4.2 Effect of pressure and concentration on permeate flux in dye separation
175
5.4.3 Effect of pressure, concentration and pH on salt retention and permeate flux in salt separation
180
5.4.4 Effect of secondary pore volumes in silica/γ-alumina membrane on surface charge density and transport mechanism of salt
185
5.5 Response Surface Method (RSM) for Nanofiltration (NF) of Dye and Salt Mixture in Aqueous Solution
188
5.5.1 Effect of process variables on dye rejection. 191
5.5.2 Effect of process variables on salt rejection 198
5.5.3 Effect of process variables on permeation flux 207
5.5.4 Optimization using nonlinear programming method 217
CHAPTER 6 - CONCLUSIONS AND RECOMMENDATIONS
6.1 Conclusions 221
6.2 Recommendations 226
BIBLIOGRAPHY 227
APPENDIXES
Appendix A Calibration curves and adsorption results 258
Appendix B Example of permeation data and its calculation of Rreal and concentration at the wall
264
Appendix C Nonlinear regression analysis for surface charge density determination
265
Appendix D Nonlinear regression analysis for transport mechanism of NaCl
267
LIST OF PUBLICATIONS, SEMINARS AND AWARDS 269

ix
LIST OF TABLES
Page
Table 1.1 Advantages of ceramic membranes (Lu et al., 2007) 4
Table 1.2 Preparation methods of ceramic membranes (Lu et al., 2007) 6
Table 1.3 Applications of ceramic membranes in liquid phase
separations (Tsuru, 2003)
9
Table 2.1 Examples of previously reported works using various
templates for pore templating in ceramics
31
Table 2.2 Bulk macroporous ceramics prepared using colloidal
polymer sphere templates via various synthesis methods
32
Table 2.3 Summary of publications from 1990 based on fabrication of
porous ceramics by sphere templating method (Hoa et al.,
2006)
36
Table 2.4 Bimodal porous ceramics with templated secondary pores 42
Table 2.5 Thin ceramic films with pores templated by spheres
(Guliants et al., 2004)
43
Table 2.6 Classification of pores recommended by IUPAC 44
Table 2.7 Examples of common ceramic membranes prepared by sol-
gel process (Hsieh, 1996a)
45
Table 2.8 Examples of studies on γ-alumina membrane for specific
application
46
Table 2.9 Porous ceramic membranes in market (Hsieh, 1996a) 50
Table 2.10 Retention of salt by ceramic membranes reported since 1995 54
Table 2.11 Previous works reported on the separation of dye-salt-water
mixture using NF membrane
60
Table 4.1 List of materials and chemicals used 80
Table 4.2 Full 32 factorial DOE with 4 replicates for preliminary study
on effect of organic compound and casting gap on tape
thickness
83
Table 4.3 22 factorial DOE with 3 replicates for statistical evaluation
on significance of tape thickness and organic content on
permeability
87

x
Table 4.4 Full 32 factorial DOE with 3 replicates for study on effect of
tape thickness and organic content on support permeability
89
Table 4.5 Sample designation and the ratio of sol to template for each
sample
92
Table 4.6 Designation of bi-layered membranes supported by α-
alumina support
101
Table 4.7 Experimental conditions of dye-salt-water separation 109
Table 4.8 Experimental runs for dye-salt-water separation which
were statistically chosen by Design Expert
110
Table 4.9 Constraints for optimum operation conditions of dye-salt-
water separation using A025/Si
111
Table 5.1 Full 32 factorial DOE with 4 replicates for preliminary study
on effect of organic mixture and casting gap on tape
thickness
113
Table 5.2 ANOVA result for response surface linear model for
preliminary study on effect of organic mixture and casting
gap on tape thickness
115
Table 5.3 22 factorial DOE with 3 replicates for statistical evaluation
on significance of tape thickness on permeability
120
Table 5.4 ANOVA result for 22 factorial DOE for statistical
evaluation on significance of tape thickness on permeability
122
Table 5.5 Full 32 factorial DOE with 3 replicates for study on effect of
organic content and tape thickness on support permeability
124
Table 5.6 ANOVA result for response surface reduced quadratic model
for study on effect of organic content and tape thickness on
support permeability
125
Table 5.7 ANOVA result for response surface reduced quadratic model
for study on effect of organic content and tape thickness on
support yield loss
126
Table 5.8 Characteristic of the mesoporous γ-alumina samples after
calcined at 500 ºC for 1 hr
149
Table 5.9 Pseudo-first-order and pseudo-second-order rate constants
of different types of porous material
150

xi
Table 5.10 Calculated permeability coefficients, kγ and specific
resistance, rm� for γ-alumina thin layers with different
porosity supported on α-alumina supports
155
Table 5.11 Secondary porosity in bimodal porous γ-alumina 158
Table 5.12 Overall permeability and thickness for silica/γ-alumina
membranes supported on α-alumina supports
166
Table 5.13 Permeability and specific resistance of silica layers
supported with different intermediate layers (A000, A025
and A050)
166
Table 5.14 Pore size and porosity of silica layers supported with
different intermediate layers (A000, A025 and A050)
168
Table 5.15 Characteristics of the reactive dyes used 170
Table 5.16 Estimated osmotic pressure and predicted permeate flux 178
Table 5.17 Fitting observed permeate fluxes to kinetic model calculated
from NaCl separation with different feed concentrations at
pH 7
179
Table 5.18 Effective volume charge density Xd for different bi-layered membranes
186
Table 5.19 Values of F1 and R∞ for different bi-layered membranes
calculated from NaCl separation with feed concentration of 5
mM
187
Table 5.20 Effect of membrane properties on diffusive and convective
flow (Ahmad and Ooi, 2006)
188
Table 5.21 CCD arrangement and responses for NF of dye and salt
mixture in aqueous solution
189
Table 5.22 Results of sequential model sum of squares and lack of fit
test for dye rejection
192
Table 5.23 ANOVA result of response surface linear model for dye
rejection
193
Table 5.24 ANOVA result of response surface reduced linear model for
dye rejection
194
Table 5.25 Results of sequential model sum of squares and lack of fit
test for salt rejection
199

xii
Table 5.26 ANOVA result of response surface quadratic model for salt
rejection
200
Table 5.27 ANOVA result of response surface reduced quadratic model
for salt rejection
201
Table 5.28 Results of sequential model sum of squares and lack of fit
test for permeate flux
208
Table 5.29 ANOVA result of response surface quadratic model for
permeate flux
209
Table 5.30 ANOVA result of response surface reduced quadratic model
for permeate flux
211
Table 5.31 ANOVA result of response surface final quadratic model for
permeate flux
211
Table 5.32 Solutions for optimum operation conditions of dye-salt-water
separation using A025/Si
219
Table B.1 Permeation data and calculated Rreal and concentration of
NaCl at the wall for NaCl separation using A025/Si
membrane
264

xiii
LIST OF FIGURES
Page
Figure 1.1 Membrane markets in US$ million (Atkinson, 2005). 1
Figure 1.2 The filtration spectrum (Koch Membrane Systems, 2004). 2
Figure 1.3 SEM micrograph of an asymmetric silica/γ-alumina
membrane (Samuel de Lint, 2006).
5
Figure 1.4 Preparation of ceramic membrane by the sol-gel method
(Burggraaf and Keizer, 1991).
7
Figure 2.1 Methods for assembling sphere array into colloidal crystal
template. (Adopted from Velev and Lenhoff, 2000)
37
Figure 3.1 Schematic concentration profiles layer. 66
Figure 4.1 Flow diagram of research. 79
Figure 4.2 Schematic diagram of the dead end filtration unit. 85
Figure 4.3 Schematic diagram of the experimental rig for liquid
permeation test.
86
Figure 5.1 Predicted and observed values of tape thickness 116
Figure 5.2 (a) Contour plot and (b) surface response plot for preliminary
study on the effect of organic mixture and casting gap on
tape thickness.
118
Figure 5.3 Half-normal probability plot for support permeability as
response.
121
Figure 5.4 Contour plots for effect of organic content and tape thickness
on (a) support permeability and (b) support yield loss.
128
Figure 5.5 SEM picture of membrane support cross section which has
been optimized with maximum permeability and minimum
yield loss.
131
Figure 5.6 TEM pictures of nanosized PS beads. 132
Figure 5.7 PS bead size distribution prepared by emulsion
polymerization.
133
Figure 5.8 TGA curves for A000, A025, A050 and A100 134
Figure 5.9 Viscosity of boehmite sol with different quantity of
templating units added.
135
Figure 5.10 Newtonian model fit of viscosity for different sols. 136

xiv
Figure 5.11 TEM pictures of (a) A000, (b) A025, (c) A050 and (d) A100
after calcined at 500 ºC for 1 hr.
138
Figure 5.12 FT-IR curves of (a) A000, (b) A025, (c) A050 and (d) A100
after calcined at 500 ºC for 1 hr.
140
Figure 5.13 XRD patterns of (a) A000, (b) A025, (c) A050 and (d) A100
after calcined at 500 ºC for 1 hr.
141
Figure 5.14 TEM pictures of A025 calcined at (a) 500 ºC for 1 hr, (b)
500 ºC for 3 hr, (c) 600 ºC for 1 hr, (d) 600 ºC for 3 hr, (e)
700 ºC for 1 hr and (f) 700 ºC for 3 hr.
143
Figure 5.15 TEM of A050 calcined at (a) 500 ºC for 1 hr, (b) 500 ºC for
3 hr, (c) 600 ºC for 1 hr, (d) 600 ºC for 3 hr, (e) 700 ºC for 1
hr and (f) 700 ºC for 3 hr.
144
Figure 5.16 N2 adsorption and desorption isotherms for (a) A000, (b)
A025 and (c) A050 after calcined at 500 ºC for 1 hr.
146
Figure 5.17 Pore size distribution of γ-alumina samples based on the
BJH-model for the desorption branch of the nitrogen
isotherms.
148
Figure 5.18 SEM pictures of (a) A000, (b) A025 and (c) A050 supported
on α-alumina discs.
152
Figure 5.19 Product of water flux and viscosity vs. applied pressure of γ-
alumina thin layers with different porous structures
supported on α-alumina support.
153
Figure 5.20 PEG retention curves of different γ-alumina thin layers at 4
bar.
156
Figure 5.21 TEM picture of Si. 159
Figure 5.22 XRD pattern of Si with ordered nanopores after calcinations. 160
Figure 5.23
N2 adsorption and desorption isotherms for silica after
calcined at 450 ºC for 45 min.
161
Figure 5.24 Pore size distribution of silica sample based on the BJH
model for the desorption branch of the nitrogen isotherms.
161
Figure 5.25 The t-plot of surfactant templated silica after calcined at 450
ºC for 45 min.
162

xv
Figure 5.26 SEM and EDX images of the bi-layered membrane prepared
with different intermediate layers (a) SEM image of A000/Si
membrane, (b) SEM image of A025/Si membrane, (c) SEM
image of A050/Si membrane, (d) the distribution of Si on
A000/Si membrane by EDX (e) the distribution of Si on
A025/Si membrane by EDX and (f) the distribution of Si on
A050/Si membrane by EDX.
164
Figure 5.27 Product of water flux and viscosity vs. applied pressure of
bi-layered membranes with different intermediate layers
supported on α-alumina support.
165
Figure 5.28 PEG retention curves of different membranes at 4 bar. 167
Figure 5.29 Retention of RR120, RB5 and RO16 dyes solution with
concentration of 1000 ppm at different pressure using (a)
A000/Si (b) A025/Si and (c) A50/Si membranes.
171
Figure 5.30 Retention of RR120, RB5 and RO16 dyes solution with
different concentrations at 10 bar using (a) A000/Si (b)
A025/Si and (c) A050/Si membrane.
174
Figure 5.31 Permeate flux versus time for RB5 aqueous solution with
feed concentration of 1000 ppm separated using (a) A000/Si,
(b) A025/Si and (c) A050/Si at 4 bar and 10 bar.
176
Figure 5.32 Permeate flux versus time for RB5 aqueous solution with
different feed concentrations separated using (a) A000/Si, (b)
A025/Si and (c) A050/Si at 10 bar.
177
Figure 5.33 Salt retention of (a) A000/Si, (b) A025/Si and (c) A050/Si at
different pressure for feed solutions with concentration of 5
mM and 10 mM.
181
Figure 5.34 Permeate flux of (a) A000/Si, (b) A025/Si and (c) A050/Si at
different pressure for pure water (lines) and salt feed
solutions with concentration of 5 mM (grey markers) and 10
mM (blank markers).
182
Figure 5.35 Mean retention of NaCl with concentration of 7.5 mM and
various pH values at 10 bar using different membranes.
183

xvi
Figure 5.36
Permeation flux for NaCl separation at 10 bar with feed
concentration at 7.5 mM using different membranes.
184
Figure 5.37 Predicted and observed values of dye rejection in percentage. 194
Figure 5.38 (a) Contour plot and (b) surface response plot for effect of
pressure and feed concentration of dye on dye rejection.
196
Figure 5.39 Predicted and observed values of salt retention in percentage. 202
Figure 5.40 Perturbation plot for permeate flux. 203
Figure 5.41 (a) Contour plot and (b) surface response plot for effect of
pressure and feed concentration of salt on salt rejection (Cdye
= 2 g/L).
206
Figure 5.42 (a) Contour plot and (b) surface response plot for effect of
pressure and feed concentration of dye on salt rejection (CF,
NaCl = 50 g/L).
207
Figure 5.43 Predicted and observed values of permeate flux. 212
Figure 5.44 Perturbation plot for permeate flux. 213
Figure 5.45 (a) Contour plot and (b) surface response plot for effect of
pressure and temperature on permeate flux (CF, NaCl = 50 g/L,
pH =7, CF,dye = 2 g/L).
215
Figure 5.46
(a) Contour plot and (b) surface response plot for effect of
pressure and feed concentration of salt on permeate flux
(temperature = 37.5 oC, pH = 7, CF,dye = 2 g/L).
216
Figure 5.47 (a) Contour plot and (b) surface response plot for effect of
pressure and on pH on permeate flux (temperature = 37.5 oC,
CF, NaCl = 50 g/L, CF,dye = 2 g/L).
217
Figure A.1 Calibration curve of crystal ponceau 6R concentration and
absorbance at 510 nm.
258
Figure A.2 Calibration curve of PEG concentration and absorbance at
535 nm for PEG 35000 and 20000.
258
Figure A.3 Calibration curve of PEG concentration and absorbance at
535 nm for PEG 10000 and 6000.
259
Figure A.4 Calibration curve of PEG concentration and absorbance at
535 nm for PEG 3000 and 1500.
259

xvii
Figure A.5 Calibration curve of PEG concentration and absorbance at
535 nm for PEG 600 and 400.
260
Figure A.6 Calibration curve of PEG concentration and absorbance at
535 nm for PEG 200.
260
Figure A.7 Calibration curve of dye concentration and absorbance at
530 nm for RR120.
261
Figure A.8 Calibration curve of dye concentration and absorbance at
592 nm (RB5) and 493 nm (RO16).
261
Figure A.9 Calibration curve of NaCl concentration and conductivity. 262
Figure A.10 Plot of log (qe-qt) vs. t for samples A000, A050 and A100. 262
Figure A.11 Plot of t/qt vs. t for samples A000, A050 and A100. 263

xviii
LIST OF PLATES
Page
Plate 4.1 Membrane auto-casting machine for doctor blade casting. 82
Plate 4.2
Mixing flask with temperature controller for preparing
boehmite sol.
91

xix
LIST OF SYMBOLS
A Surface area of membrane (m2)
Ak Porosity of the membrane (dimensionless)
Ak1 Primary porosity (dimensionless)
Ak2 Secondary porosity (dimensionless)
ai Activity of ions (dimensionless)
B Constant of kinetic model for permeate flux reduction (L.m-2.bar-1)
bi Convective coupling coefficient (dimensionless)
C0 Initial dye concentration in solution (mg/L)
C1,p Permeation concentration of component 1 (mol/m3)
C2,p Permeation concentration of component 2 (mol/m3)
Cb Concentration of bulk solution (mol/L)
Ci,f Bulk feed concentration of component i at the feed side (mol/m3)
Ci,p Permeate concentration of component i (mol/m3)
Ci,w Concentration at the wall (mol/m3)
Cp Concentration of permeate (mol/L)
Ct Dye concentration in solution at time t (mg/L)
cim Concentration of component i in the membrane (mol/m3)
D1,p Hindered diffusivity of component 1 (m2/s)
D2,p Hindered diffusivity of component 2 (m2/s)
Di,p Hindered diffusivity (m2/s)
Di,∞� Diffusion coefficient (m2/s)
F Faraday constant (96487 C/mol)
F1 Indicator of diffusive transport (dimensionless)
G Hydrodynamic lag coefficient (dimensionless)
g Acceleration due to gravity (m/s2)
H Liquid film thickness (m)
i Number of ions per molecule of solute (dimensionless)
J Volumetric flux of permeate (m3.m-2.s-1)
J1 Permeate flux through primary pores (m3.m-2.s-1)
J2 Permeate flux through secondary pores (m3.m-2.s-1)
Jss Steady-state flux (L.m-2.bar-1)

xx
Jt Permeate flux at time t (L.m-2.bar-1)
Jv Permeate volume flux based on membrane area (m/s)
Jw Pure water permeate flux (L.m-2.hr-1)
ji Ion flux based on membrane pore area (mol.m2.s-1)
jv Volume flux based on membrane pore area (m3.m-2.s-1)
K Time constant of kinetic model for permeate flux reduction (hr-1)
K-1 Hydrodynamic enhanced drag coefficient (dimensionless)
Kº Boltzmann’s constant (1.38 x 10⁻²³ J/K)
Ki,c, Hindrance factor for convection (dimensionless)
Ki,d Hindrance factor for diffusion (dimensionless)
k Mass transfer coefficient (m/s)
k1 Permeability coefficient of primary pores (m)
k2 Permeability coefficient of secondary pores (m)
k’ Mass transfer coefficient by Equation 3.22 (dimensionless)
kf Rate constant of pseudo-first-order model (l/min)
km Overall membrane permeability coefficients (m)
ks Rate constant of pseudo-second-order model (mg.g-1.min-0.5)
kα Permeability coefficient of α-alumina support (m)
kγ Permeability coefficients of γ-alumina layer (m)
Lm Membrane thickness determined from SEM micrograph (m)
Lp Solvent permeability of the membrane (L.m-2.bar-1)
l Membrane thickness (m)
MW Molecular weight of solute (Da)
m Mass of unsupported γ-alumina (g)
n Number of data points in dye adsorption test (dimensionless)
P Operating pressure (atm)
qe Adsorption capacity in equilibrium (mg/g)
qt Amount of dye adsorbed at time t (mg/g)
qt cal Calculated dye adsorbed value (mg/g)
qt exp Experimental dye adsorbed value (mg/g)
R Gas constant (8.314 J.K-1.mol-1 for Equation 3.2 and
0.08314 L.bar.K-1.mol-1 for Equation 4.18)
Robs Observed rejection of component i(dimensionless)

xxi
Rreal Real rejection of component i (dimensionless)
R∞ Indicator of convective transport (dimensionless)
r Molecular radius of solute (Å)
ri Stokes radius of component i (m)
rm Specific resistance membrane (m-2)
rp Pore radius (m)
rp1 Primary pore radius (m)
rp2 Secondary pore radius (m)
rr Radius of stirrer (m)
T Temperature (K)
U Withdrawal speed (m/s)
V Volume of solution in Equation 4.3 (L)
vi Volume of solution in Equation 3.4 (m3)
Xd Effective membrane volume charge (mol/m3)
w1 Initial weight of permeate (g)
w2 Final weight of permeate (g)
zi Valence of component i (dimensionless)
Greek letters
ΔF Electrical potential difference (V)
ΔP Applied pressure drop (bar)
Δq Normalized standard deviation (%)
ΔX Difference in potential (V)
Δx Effective membrane thickness (m)
ΔΨD Donnan potential difference at interface (V)
Φi Steric partition term (dimensionless)
Γ Ratio of diffusive flow to convective flow (dimensionless)
γ Shear rate (s-1)
γLV Liquid–vapor surface tension (N/m)
η Viscosity (Pa.s)
iϑ Molar mobility (mol.m2.J-1.s-1)
λ Ratio of solute to pore radius (dimensionless)

xxii
Δμ Chemical potential difference (V)
Π Osmotic pressure (bar)
ρ Density of permeate (g/cm3)
υ Kinematic viscosity (m2/s)
ω Stirring speed (s-1)
Ψ Electric potential in axial direction (V)
ψ Electrical potential (V)
ρ Density (g/m3)
σ Reflection coefficient (dimensionless)
τ Shear stress (D/cm2)
xxiii
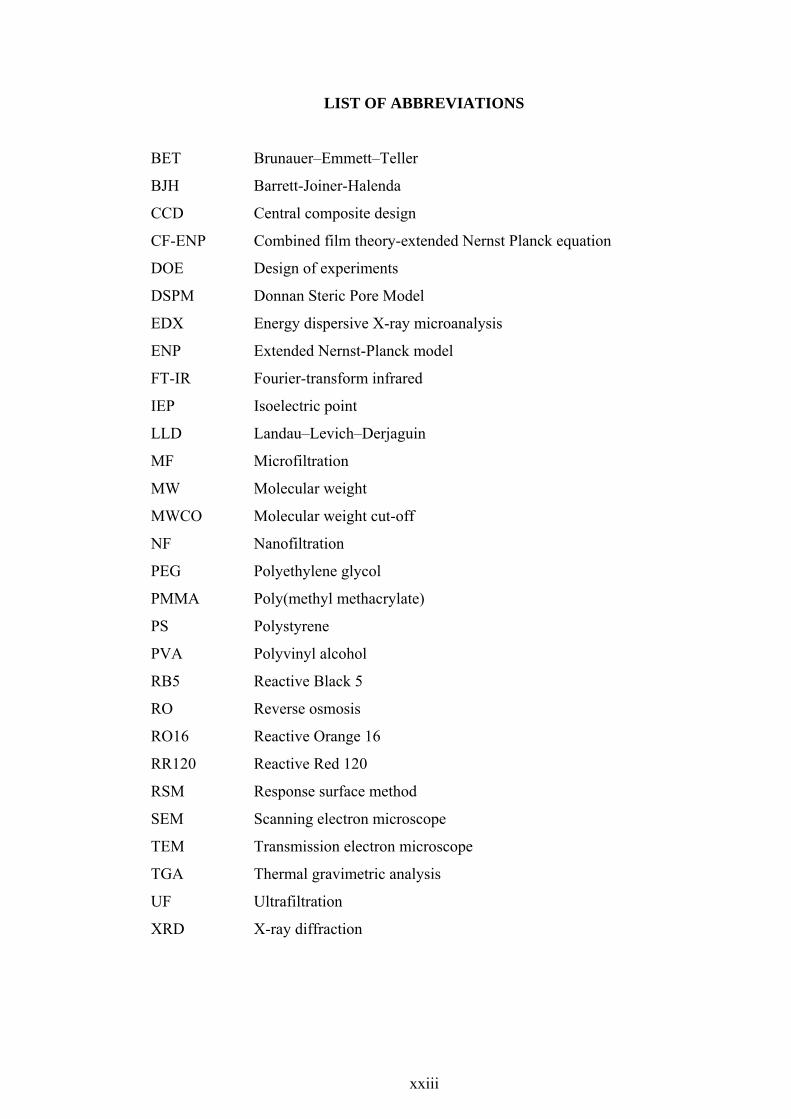
LIST OF ABBREVIATIONS
BET Brunauer–Emmett–Teller
BJH Barrett-Joiner-Halenda
CCD Central composite design
CF-ENP Combined film theory-extended Nernst Planck equation
DOE Design of experiments
DSPM Donnan Steric Pore Model
EDX Energy dispersive X-ray microanalysis
ENP Extended Nernst-Planck model
FT-IR Fourier-transform infrared
IEP Isoelectric point
LLD Landau–Levich–Derjaguin
MF Microfiltration
MW Molecular weight
MWCO Molecular weight cut-off
NF Nanofiltration
PEG Polyethylene glycol
PMMA Poly(methyl methacrylate)
PS Polystyrene
PVA Polyvinyl alcohol
RB5 Reactive Black 5
RO Reverse osmosis
RO16 Reactive Orange 16
RR120 Reactive Red 120
RSM Response surface method
SEM Scanning electron microscope
TEM Transmission electron microscope
TGA Thermal gravimetric analysis
UF Ultrafiltration
XRD X-ray diffraction
xxiv
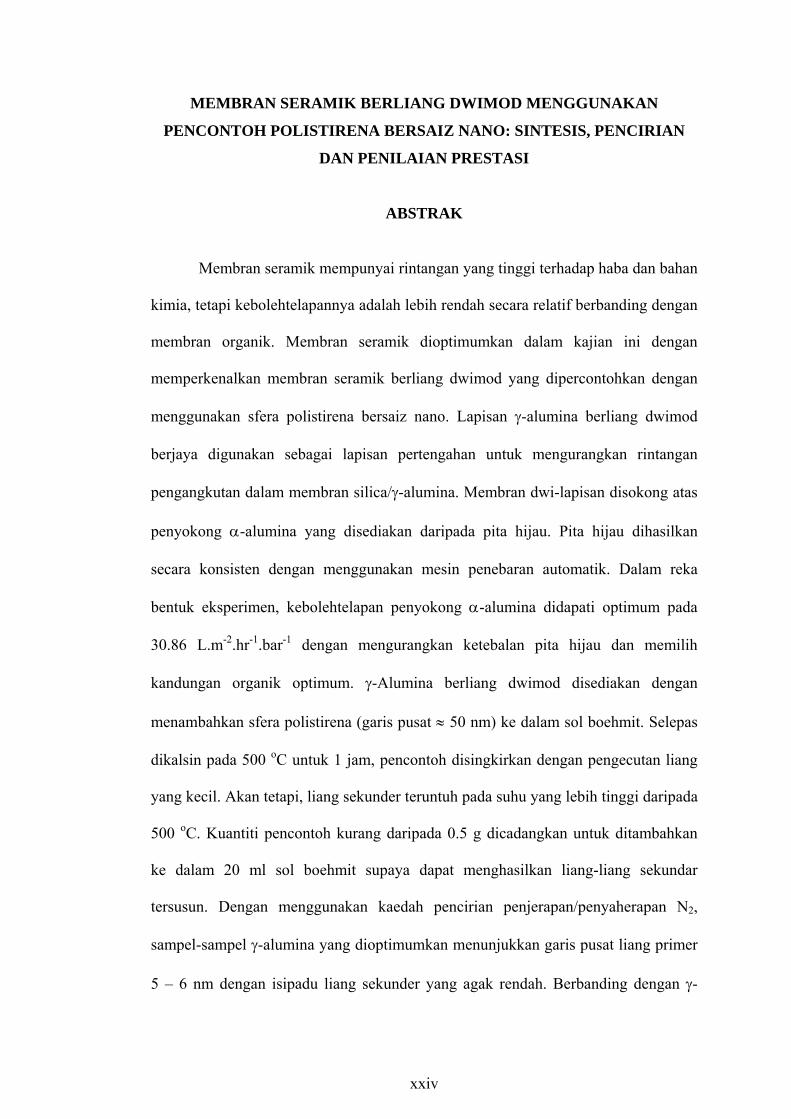
MEMBRAN SERAMIK BERLIANG DWIMOD MENGGUNAKAN
PENCONTOH POLISTIRENA BERSAIZ NANO: SINTESIS, PENCIRIAN
DAN PENILAIAN PRESTASI
ABSTRAK
Membran seramik mempunyai rintangan yang tinggi terhadap haba dan bahan
kimia, tetapi kebolehtelapannya adalah lebih rendah secara relatif berbanding dengan
membran organik. Membran seramik dioptimumkan dalam kajian ini dengan
memperkenalkan membran seramik berliang dwimod yang dipercontohkan dengan
menggunakan sfera polistirena bersaiz nano. Lapisan γ-alumina berliang dwimod
berjaya digunakan sebagai lapisan pertengahan untuk mengurangkan rintangan
pengangkutan dalam membran silica/γ-alumina. Membran dwi-lapisan disokong atas
penyokong α-alumina yang disediakan daripada pita hijau. Pita hijau dihasilkan
secara konsisten dengan menggunakan mesin penebaran automatik. Dalam reka
bentuk eksperimen, kebolehtelapan penyokong α-alumina didapati optimum pada
30.86 L.m-2.hr-1.bar-1 dengan mengurangkan ketebalan pita hijau dan memilih
kandungan organik optimum. γ-Alumina berliang dwimod disediakan dengan
menambahkan sfera polistirena (garis pusat ≈ 50 nm) ke dalam sol boehmit. Selepas
dikalsin pada 500 oC untuk 1 jam, pencontoh disingkirkan dengan pengecutan liang
yang kecil. Akan tetapi, liang sekunder teruntuh pada suhu yang lebih tinggi daripada
500 oC. Kuantiti pencontoh kurang daripada 0.5 g dicadangkan untuk ditambahkan
ke dalam 20 ml sol boehmit supaya dapat menghasilkan liang-liang sekundar
tersusun. Dengan menggunakan kaedah pencirian penjerapan/penyaherapan N2,
sampel-sampel γ-alumina yang dioptimumkan menunjukkan garis pusat liang primer
5 – 6 nm dengan isipadu liang sekunder yang agak rendah. Berbanding dengan γ-

xxv
alumina berliang unimod, γ-alumina berliang dwimod yang tidak disokong
menunjukkan kinetik resapan yang diperbaiki manakala lapisan γ-alumina berliang
dwimod yang tersokong menunjukkan pengurangan rintangan spesifik sebanyak 48
%. Lapisan γ-alumina berliang dwimod banyak mengurangkan rintangan
pengangkutan membran dwi-lapisan. Rintangan spesifik lapisan silika dikurangkan
hampir 62 % apabila disokong atas lapisan γ-alumina berliang dwimod yang
dioptimumkan. Dalam ujian pemisahan pewarna, penolakan pewarna bertambah
dengan keberatan molekul pewarna manakala fluks penelapan berubah dengan masa.
Fluks penelapan adalah lebih rendah daripada fluks air tulen; ini boleh dikaitkan
kepada kombinasi pengutuban kepekatan dan penjerapan. Dalam ujian pemisahan
garam, penolakan garam berkurang apabila komposisi garam suapan meningkat
disebabkan kesan Donnan. Prestasi pemisahan adalah agak malar bagi membran
berliang unimod: penahanan sistem dua lapisan dalam seluruh julat pH berubah di
antara 60 % dan 70 %. Tambahan pula, penahanan NaCl berkurang dengan
pertambahan isipadu liang sekunder. Model Nernst-Planck Lanjutan digunakan untuk
mencirikan membran dwi-lapisan dengan struktur liang yang berlainan dalam istilah
ketumpatan cas isipadu efektif (Xd) dan mekanisme pengangkutan ion. Kaedah
respons permukaan dengan rekabentuk komposit pusat dijalankan untuk mengkaji
pengaruh keadaan operasi umum ke atas kualiti dan kuantiti telapan apabila
membran silika/γ-alumina dengan lapisan pertengahan berliang dwimod yang
dioptimumkan diaplikasikan dalam penapisan-nano campuran pewarna-garam-air.
Penolakan perwarna yang dicapai melebihi 90 %. Model mencadangkan penahanan
garam dipengaruhi oleh tekanan, kepekatan suapan pewarna dan garam. Akan tetapi,
fluks telapan merosot disebabkan pengutuban kepekatan dan kekotoran.

xxvi
BIMODAL POROUS CERAMIC MEMBRANE VIA NANOSIZED
POLYSTYRENE TEMPLATING: SYNTHESIS, CHARACTERIZATION
AND PERFORMANCE EVALUATION
ABSTRACT
Ceramic membranes possess great resistance toward heat and chemicals, but
the permeability of ceramic membranes is relatively low compared to polymeric
membranes. The ceramic membrane was optimized in this study by introducing
bimodal porous ceramic membrane templated using nanosized polystyrene spheres.
Bimodal porous γ-alumina layer was successfully utilized as intermediate layer in
order to reduce transport resistance in silica/γ-alumina membrane. The bi-layered
membrane was supported on α-alumina support which was prepared from green
tapes. The green tapes were uniformly fabricated using auto-casting machine. In the
design of experiments, permeability of α-alumina support was found to be optimum
at 30.86 L.m-2.hr-1.bar-1 by reducing tape thickness and choosing optimum organic
content. Bimodal porous γ-alumina was tailored by adding polystyrene spheres
(diameter ≈ 50 nm) into boehmite sol. After calcined at 500 oC for 1 hr, template was
removed with small pore shrinkage. However, secondary pores were demolished at
higher temperature than 500 oC. Template quantity less than 0.5 g was recommended
to be added into 20 ml boehmite sol for creating ordered secondary pores. From the
characterization results using N2 adsorption/desorption, the optimized γ-alumina
samples showed primary pore diameter of 5 - 6 nm with relatively low secondary
pore volume. Compared to unimodal porous γ-alumina, unsupported bimodal porous
γ-alumina showed improved adsorption kinetic while supported bimodal porous γ-
alumina layers showed more than 48 % reduction in the specific resistance. Bimodal

xxvii
porous γ-alumina layer reduced the transport resistance of bi-layered ceramic
membrane greatly. Specific resistance of silica layer reduced nearly 62 % when
supported on the optimized bimodal porous γ-alumina layer. In dye separation test,
the rejection of dye increased with molecular weight of dyes while the permeate flux
varied with time. The permeate flux was lower than the corresponding pure water
flux; which could be related to a combination of concentration polarization and
adsorption. In the salt retention test, the salt rejection decreased when the feed salt
composition increased due to the Donnan effect. The separation performance was
relatively constant for unimodal porous membrane: the retention of the two-layer
system over the whole pH range varied between 60 % - 70 %. Moreover, the
retention of NaCl reduced with the increment of secondary pore volume. Extended
Nernst-Planck model was used to characterize the bi-layered membrane with
different porous structures in term of the effective volume charge density (Xd) and
the transport mechanism of ions. Response surface method with central composite
design was performed to study the influence of common operating conditions on the
quality and quantity of permeate when the optimized silica/γ-alumina membrane
with bimodal porous intermediate layer was applied in the nanofiltration of dye-salt-
water mixture. The rejection of dye achieved was more than 90 %. The model
suggested that the salt retention was affected by pressure, the feed concentration of
dye and salt. However, the separation was susceptible to flux decline due to
concentration polarization and fouling.

1
CHAPTER 1
INTRODUCTION
1.1 Membrane Separation Technology
Advances in membrane separation technologies have been largely driven by
the increasing environmental regulations enacted and the rising demand of
desalinated water (Atkinson, 2005, Voutchkov, 2005). In comparison to conventional
filters, distillation systems and ion exchange resins, membrane separation systems
provide high quality products with acceptable energy consumption. An additional
factor is the economic advantage of using membranes, as they reduce waste disposal
expenditure and allow for increased opportunities for material recovery and
recycling. Due to these reasons, the use of membrane in variety market places, such
as water and wastewater treatment, as well as food and beverage processing is
expanding significantly as shown in Fig. 1.1. In USA, the demand for membrane is
forecasted to grow up to US$ 2.9 billion in 2010 (Atkinson, 2005).
Fig. 1.1 Membrane markets in US$ million (Atkinson, 2005).
0 200 400 600 800
1000 1200 1400 1600 1800
Year 2006 Year 2010
Mem
bran
e de
man
d
(US
$ m
illio
n)
Wat
er &
w
aste
wat
er
Food
&
beve
raga
te
Phar
mac
eutic
al
& m
edic
al
Che
mic
al
prod
uctio
n
Indu
stria
l gas
Oth
ers

2
There are four main types of membrane system commonly used in industry
(Aptel and Buckley, 1996):
(a) Microfiltration (MF) is widely applied in particulate removal process and
maintains degreasing.
(b) Ultrafiltration (UF) is generally used for oil, water and emulsion separations;
paint recovery; and the separation of fats, oils or greases in the food industry.
(c) Reverse osmosis (RO) and nanofiltration (NF) are used extensively for water
purification, desalination and disinfection.
The classification of the membranes for MF, UF, NF and RO is illustrated in Fig.
1.2. The figure also shows the relative size of common retained materials, the
membrane pore size and the approximated molecular weight cut-off (MWCO) of the
membranes.
Fig. 1.2 The filtration spectrum (Koch Membrane Systems, 2004).

3
Using membrane separation correctly can provide financial savings and conserve
resources. Maximum benefits are obtained when one or both the output streams from
the membrane system are recycled or re-used, thereby reducing process materials
requirement and minimizing waste disposal costs.
1.1.1 Nanofiltration (NF)
NF is a pressure driven membrane separation process which is characterized
by a membrane pore size ranging from 1 nm to 10 nm (Van Rijn, 2004). NF is
categorized to be between conventional RO and UF as it can achieve high organic
removal and moderate inorganic removals. Operating at moderate pressures (10 - 34
bar), NF membranes have high retention coefficients for neutral molecules with a
molecular mass > 300 Da. NF membranes also have a surface electrostatic charge
which gives them great selectivity with respect to ions or charged molecules (Henry
et al., 1997). Thus, NF is widely used in applications such as color removal,
demineralization and desalination (Van Rijn, 2004).
Although NF membranes are able to separate ions from water, a high
retention for multivalent ions is frequently combined with a moderate retention for
monovalent ions. The removal of monovalent ions using NF membranes varies
between 50 % to 90 % depending on the material and manufacture of the membrane
(Oumar Anne et al., 2001). Due to this reason, there are variety of NF membranes
available, from physical solids (metal, ceramic, etc.), homogeneous films (polymer,
metal, etc.) and heterogeneous solids (polymer mixes, mixed glasses, etc.).
Polymeric membranes dominate the market because they are well developed and
quite competitive in separation performance and economic (Atkinson, 2005).

4
However, inorganic membranes, including ceramic membranes, have been utilized to
some extent in practical applications such as food, beverage and biotechnology
(Hsieh, 1996b).
1.1.2 Ceramic membranes with high stability
Ceramic membranes are made of inorganic materials such as alumina, titania,
zirconia oxides or some glassy materials (American Ceramic Society, 1920).
Although ceramic membranes are considered to be costly due to the expensive
starting materials, the complex fabrication process, and low membrane surface area
per volume of a membrane module; ceramic membranes still have a lot of other
advantages over polymeric membranes. Contrast to polymeric membranes, ceramic
membranes possess benefits of thermal stability, resistance to solvent and chemical
as listed in Table 1.1. Other advantages of ceramic membranes are high mechanical
strength and long term durability (Bugraaf and Keizer, 1991, Hsieh, 1996b).
However, it has to be noted that the advantages are dependent on the types of
ceramics.
Table 1.1 Advantages of ceramic membranes (Lu et al., 2007)
Advantages Applications and comments Thermal stability • Separation at high temperature, steam
sterilization Resistance to organic solvents • Separation of non-aqueous systems, separation
of oil Resistance to chemicals acidic and basic pH
• Chemical cleaning, recovery of acid/base
Resistance to peroxide • Chemical cleaning, application of textile processing
Mechanical strength • Backwashing Long life-span Uniform pore size • Dependent upon preparation methods

5
In general, ceramic membranes consist of thin ceramic layers supported on
porous ceramic supports as shown in Fig. 1.3. Macroporous membrane supports
which provide the major mechanical strength for pressure driven separation
processes, are usually manufactured using oxide powders by extrusion or tape
casting (Lindqvist and Liden, 1997, Terpstra et al., 1998). The pore size of supports
is usually larger than a micrometer and the support thickness is generally in order of
few millimeters. An intermediate layer is coated on the support layer in order to
reduce the pore size of coating surface for further coating of top layer. Meanwhile,
the top layer which has the separation ability needs to possess controlled pore size
which is suitable for the specific separation (Tsai et al., 2000).
Fig. 1.3 SEM micrograph of an asymmetric silica/γ-alumina membrane (Samuel de Lint et al., 2006).
In such structural design, the pore size of an asymmetric ceramic membrane shows a
gradient structure from the porous supports to the separation layer, so as to minimize
the resistance to permeation across the membrane. There are several methods to
prepare intermediate layers and separating layers as listed in Table 1.2. The selection
Separating layer (Silica)
Intermediate layer (γ-Alumina)
Support (α-Alumina)

6
of a preparation method depends on the desired membrane structure and the
application of the membrane. For example, sol-gel route is prominent in preparing
nanoporous ceramic membranes while chemical-vapor deposition is well-known in
producing dense ceramic membranes (Lin, 2001).
Table 1.2 Preparation methods of ceramic membranes (Lu et al., 2007)
1.1.3 Sol-gel method for the preparation of ceramic membranes
Sol-gel method is the most common approach of creating ceramic thin films.
The high and keen interest in sol-gel synthesized materials is contributed by a
number of apparent reasons. Highly porous materials and nanocrystalline materials
can be created with controlled pore size, porosity and desired pore wall chemistry. In
addition, liquid precursors are used so it is possible to cast ceramic membrane into
desired modules without involvement of extremely high temperature. Addition of
organic species may serve as templates for creation of pores with preferred size and
shape as well (Wright and Sommerdijk, 2001).
Sol-gel methods are classified into two categories, colloidal sol method and
polymeric sol method depending on formation route of the sol (Anderson et al.,
Process Materials
Sol-gel γ-Al2O3 , SiO2,, TiO2 , ZrO2
Chemical vapor deposition SiO2
Pyrolysis SiC, Si3N4
Hydrothermal treatment Silicalite
Anodic oxidation Al2O3 (Amorphous)
Phase separation/ leaching SiO2
Dynamic membranes ZrO2 (Amorphous)

7
1988, Buggraaf and Keizer, 1991, Larbot et al., 1988). The processes are shown
schematically in Fig 1.4. In the colloidal sol route, a metal alkoxide dissolved in
alcohol is hydrolyzed by addition of excess water or acid. The resulted precipitate is
maintained as a hot solution for an extended period in order to form a stable colloidal
solution. The colloidal solution is then cooled and coated onto the membrane
support. The liquid film ought to be carefully dried to avoid defects such as cracks
and pinholes. The metal oxide films are formed after sintering at 500 - 800 oC.
Fig. 1.4 Preparation of ceramic membrane by the sol-gel method (Burggraaf and Keizer, 1991).
Alkoxide in Alcohol
Hydroxide Precipitation
Coat
Dry
Sintering 500 - 800 ºC
Excess Water
Acid
Dropwise water
Particulate sols Polymeric sols
Clear Sol
Heat 85 - 95 ºCColloidal
suspension
Alkoxide in Alcohol

8
For instance, the overall process for the preparation of γ-alumina membrane using
colloidal route can be represented as (Baker, 2000):
Precipitation: Al(OR)3+ H2O→Al(OH)2
Peptization: Al(OH)2→γ-Al2O3·H2O (Boehmite)
Sintering: γ- Al2O3·H2O→Al2O3+ H2O
In the polymeric sol-gel process, partial hydrolysis of a metal alkoxide
dissolved in alcohol is accomplished by adding the minimum of water to the
solution. The active hydroxyl groups on the alkoxides react to form an inorganic
polymer molecule which can be coated on membrane supports. On drying and
sintering, the metal oxide film forms. Chemically the polymeric sol-gel process for
titania membrane can be represented as follows (Baker, 2000):
Hydrolysis: Ti(OR)4 +H2O→Ti(OR)2(OH)2+ROH
Polymerization: nTi(OR)2(OH)2→ -[-Ti(OR)2-O-]-n +H2O
O I Crosslinking: –[-Ti(OR)2-O-]-n→-[-Ti(OR)2-O-]--[-Ti(OR)2-O-]-
The pore size of sol-gel derived membranes is most influenced by the size of
the sols in both methods. For the case of the colloidal sol route, pore size is
controlled by the void spaces among the packed colloidal particles. Meanwhile, the
size of the gel network determines the membrane pore size when the polymeric gel is
used. Compared to colloidal sol, the polymeric sol is more suitable to form
microporous membranes since the size of the gel network is smaller than the size of
colloidal sols. In general, the pore size of sol-gel derived membranes can be
controlled in the range of 0.5 – 50 nm depending on the sol properties and other

9
factors such as addition of binder and heat treatment (Lambert and Gonzalez, 1999).
For creation of hierarchical porous structure, secondary pores can be generated by
adding template in the sol and removing template in the solidification step (Hoa et
al., 2006). In this case, primary pores are void spaces among the packed colloidal
particles or gel networks while the secondary pores are templated using additional
templating units.
1.1.4 General application of ceramic membranes in liquid phase separation
Ceramic membranes have been extensively applied in areas such as food and
beverage industry; biotechnology and pharmaceutical industry; chemical and
industrial applications; recovery and recycling as summarized in Table 1.3. The
ability of ceramic membranes to uniquely address the distinct needs of frequent
cleaning, high resistance of harsh operating conditions and continuous flow in these
areas is the main reason why ceramic membranes are preferred choice over other
types of membranes (Finley, 2005).
Table 1.3 Applications of ceramic membranes in liquid phase separations (Tsuru, 2003)
Area Process Application examples
Food and beverage industry
MF and UF
• Concentration of milk, concentration of protein, clarification of fruit juice, clarification of wine, bacteria removal, microorganism separation from fermented.
Biotechnology and pharmaceutical industry
MF and UF
• Microorganism separation and cell debris filtration, plasma separation.
Chemical and industrial applications
MF and UF
• Oil-water separation, purification of used oil, removal of precipitated heavy metals and solids.
Recovery and recycling
UF and NF
• Drinking water and wastewater treatment.

10
MF and UF ceramic membranes have been used in a wide variety of filtration
processes such as separation of microorganism, proteins and colloidal solutes
(Cheryan, 1998, Sondhi et al., 2003). NF on the other hand, has the largest
applications in water treatment, including wastewater containing heavy metals and
synthetic dyes (Bougen et al., 2001, Duke et al., 2007, Voigt et al., 2001b). For
wastewater treatment, nanoporous ceramic membranes with charged surface not only
retain electrolytes under steric effects but also Donnan effects (Combe et al., 1997).
Ion separation is primarily due to the electrostatic interaction between ions and
surface charge. The co-ions with the same charge as the membrane surface, create
repulsive force from the membrane surface which is termed as Donnan exclusion.
Hence, ion separation can be successfully carried out using NF membranes even
though the ions are much smaller than membrane pores (Rios et al., 1996, Tsuru et
al., 1998a).
In addition, the application of ceramic membranes has also been extended to
non-aqueous solution separation especially in petrochemical processing where
organic membranes cannot be utilized. Alumina, silica and zirconia UF membranes
have been applied to the separation of asphaltene from crude oil in the temperature
range of 155 – 180 oC (Guizard et al., 1993). The treated oils are reported to be
considered as clean oils owing to the effective removal of heavy metals such as
copper, lead, chromium and iron (Higgins et al., 1993). The permeation properties
through porous membranes are determined by the affinity between feed solutions
with the membrane surface. Unlike UF and MF, the mechanism through inorganic
porous membranes in the NF range is an activated process and does not obey the
viscous flow mechanism (Tsuru, 2003). Another interesting application is the use of

11
ceramic membranes for separation and concentration of organic solvent such as
ethanol and hexane (Tsuru et al., 2001b, Wu and Lee, 1999). Silica and silica–
zirconia membranes, prepared by a sol–gel process, have been successfully utilized
in separating non-aqueous solvent mixtures (Asaeda et al., 1998, Tsuru et al.,
2001b). Furthermore, ceramic membranes can be applied in supercritical fluids
separation especially supercritical CO2 (Sarrade et al., 1996) and supercritical
alcohol (Brasseur-Tilmant et al., 2000).
Although ceramic membranes can be applied in various applications, NF
using ceramic membranes is not widely practiced campared to organic membranes. It
is due to few problem statements which are further discussed in the next section.
1.2 Problem Statements
The preparation of sol-gel derived ceramic membranes is of tremendous
importance since the utilization of ceramic membranes can be extended beyond
separation and purification such as membrane reactor. Despite all the advantages as
mentioned in Section 1.4, sol-gel method is not without limitations. Particular
ageing, drying and sintering are required for a desired porous structure. Although
membrane pores can be tailored precisely by incorporating solid template, this
method is rarely adopted for the preparation of membrane. Besides that, proper
calcination for template removal is important to prevent pore shrinkage or even pore
collapse. Such details of sol-gel method with additional template definitely need a
full understanding in order to exploit the advantages of templating method in
membrane preparation where it cannot be attained by other methods.

12
Even though ceramic membranes possess high resistance against heat and
chemicals, the permeability to liquid and gases is relatively low compared to organic
membranes. The attempt to reduce the membrane thickness is always restricted by
the occurance of defects. Therefore, the ceramic membrane performance has to be
optimized in such a way that the permeability improvement does not impair the other
advantage features of membranes. In this study, the templated pores occur as
secondary pores which have been proven to enhance adsorption. It is certainly a
neccessity to investigate the possiblility of permeability increment by introducing
secondary pores into ceramic membrane since it has not been studied widely
elsewhere.
In order to form ceramic thin layers through sol-gel method, consistent and
reproducible supports are required. The membrane supports also have to introduce
minimum resistance to permeation and persist well in the pressure driven separation.
The membrane supports are prepared by sintering the pelletized green tapes which
offers fine surface for coating. Thus, this study has to include design of experiments
to study the effects of green tape characteristics on the support permeability.
Before preparation of thin ceramic layers with templated pores, it is also
important to decide the suitable quantity of templating units and calcination
conditions in order to avoid defects such as disorder pore arrangement, pore
shrinkage and pore collapse. For certain ceramics such as γ-alumina, solid templating
method usually results in serious pore shrinkage and collapse of pore wall after
calcinations. Although γ-alumina is often the most favorable porous ceramics in
catalysis and membrane technology owing to the high pore volume, large surface

13
area and great catalytic properties, not much related work has been reported in the
past about the preparation of bimodal porous γ-alumina. Due to these reasons, a
preliminary study with the purpose of tailoring secondary pores precisely in γ-
alumina is definitely a must in this research.
In this research, bimodal porous γ-alumina is employed as intermediate layer
in silica/γ-alumina membrane to improve membrane permeability. In order to gauge
the effectiveness of the newly developed membranes, phenomenological properties
of bi-layered membranes such as pure water permeability and MWCO are essential.
These properties need to be determined for bi-layered ceramic membranes to
understand the effects of secondary pore volume in the intermediate layer. However,
having this information alone is not sufficient as they are not related to the
mechanistic structure of a membrane. As a result, the membrane performance is
structurally impractical to be optimized. Thus, the research has to focus on the
membrane structural properties such as pore size, effective thickness/porosity and
effective volume charge density which are evaluated from the membrane separation
performance in the retention test of uncharged solutes and charged solutes.
Once the effects of secondary pore volume on the structural properties and
the separation performance is fully understood, the optimized membrane needs to be
properly tested in the separation of dye-salt-mixture. This is because optimized
ceramic membrane possesses great potential to be applied in textile wastewater
containing water soluble reactive dye which is difficult to be removed using
conventional method. Besides that, the treatment process usually involves hot
effluent and frequent cleaning. It is highly important to study and gather some initial

14
information on the separation performance of nanoporous ceramic membranes which
is most suitable for textile wastewater treatment. The information is crucial for
further improvement of membrane application especially in module selection and
separation design in the future.
1.3 Research Objectives
The present research has the following objectives:
1. To synthesize nanoporous ceramic membrane with ordered pores using
templating method.
2. To increase permeability of sol-gel derived ceramic membrane by introducing
secondary pores.
3. To develop ceramic supports with improved permeability by controlling
green tape characteristics for supporting membrane efficiently.
4. To develop nanoporous ceramic with bimodal pore size distribution and
enhanced diffusive transportation through sol-gel method with addition of
templates.
5. To study the effect of secondary pores in intermediate layer on separating
layer formation and membrane properties such as pore size, effective
thickness/porosity and effective charge density.
6. To investigate the performance of bi-layered membrane with different
secondary pore volume in the separation of organic ions (dyes) and inorganic
ions (salt).
7. To study optimal operating conditions for improved bi-layered membrane in
separating dye-salt-water system.

15
1.4 Research Scope
The present research includes the preparation of α-alumina supports with
improved permeability. The membrane supports are prepared by sintering the pressed
alumina green tapes. In order to form supports with high permeability, influences of
tape characteristics such as thickness (0.025 - 0.035 mm) and organic content (10.61
- 14.24 %) are studied.
The technique to produce the supported γ-alumina thin layer with ordered
secondary pores using nanosized polystyrene (PS) beads is disclosed. Before being
engineered into thin layer, the effect of template quantity (0 - 0.05 g/ml sol) on sol
characteristics is investigated. The template quantity chosen is to make sure the
formation of defect free thin layer of γ-alumina with ordered secondary pores. The
thermogravimetric behavior and the sol viscosity are the sol characteristics changes
which are interesting to be studied. The calcined unsupported oxides with different
secondary pore volumes are characterized using transmission electron microscope
(TEM), Fourier-transform infrared (FT-IR) and X-ray diffraction (XRD). The heat
treatment effect on the templated porosity is also investigated. Under appropriate
calcination treatment, the optimized templated γ-alumina is prepared for porosity and
adsorption kinetic study.
The supported γ-alumina thin layers with different pore volumes are further
studied using scanning electron microscope (SEM) for thickness comparison.
Besides determining the membrane permeability using dead end stirred cell,
individual layer permeability and specific resistance of bimodal porous membrane is
calculated. Polyethylene glycol (PEG) retention test is carried out to determine basic

16
characteristics of supported γ-alumina layers such as MWCO, pore size and ratio of
effective thickness to porosity.
The research is continued with the coating of surfactant templated silica sol
on supported γ-alumina thin layers. The main objective is to improve the
permeability of silica/γ-alumina membrane by utilizing bimodal porous intermediate
layer. The effect of secondary pore volume on the separating layer characteristics is
explored in this study. The possible structure and permeability changes of silica layer
are not only analyzed using energy dispersive X-ray microanalysis (EDX) but also
studied through water permeation test and PEG retention test.
Membrane is generally high in permeability but low in rejection or vice versa.
Organic ions and inorganic ions are employed to test the separation performance of
improved bi-layered membranes regarding the steric effect and Donnan effect in
separation. The selected organic ions are reactive dyes with various molecular
weights (617.54 Da, 991.80 Da and 1469.98 Da (Sigma-Aldrich, 2007)) which are
higher than the MWCO of silica/γ-alumina membranes. Process variables such as
pressure (4 – 10 bar), dye concentration (0.25 - 1.00 g/L) and type of dyes (Reactive
Orange 16 (RO16), Reactive Black 5 (RB5) and Reactive Red 120 (RR120)) are
studied. On the other hand, NaCl is the chosen inorganic salt where the ion hydrated
size (for Na+ = 0.42 nm and Cl- = 0.39 nm) is smaller than the membrane pore size.
The variables such as pressure (6 – 10 bar), salt concentration (5 mM and 10 mM)
and pH (pH 4 - 10) are studied. Besides that, the effective surface charge volumes of
bi-layered membranes with different pore volume are determined by fitting salt
separation results to Donnan Steric Pore Model (DSPM). The effective charge

17
volume is the membrane charge along the surface and through the pores which is
responsible for Donnan effect. The salt separation results are also further analyzed
using Extended Nernst-Planck Model (ENP) for studying the changes of salt
transport mechanism.
In the last part of this research, separation of dye-salt-water mixtures is
carried out using the bi-layered membrane with improved permeability. Response
surface method (RSM) with central composite design (CCD) is performed to study
influences of common operating conditions on the quality and quantity of permeate.
The CCD is composed of five factors: temperature (25 – 50 oC), feed concentration
of dye (1 - 3 g/L), feed concentration of salt (20 – 80 g/L), pH (pH 5 - 9) and
pressure (5 - 10 bar). The responses which are of interest in this study are the
percentage retention of dye, the percentage retention of salt, and the permeate flux.
Polynomial models are used to represent the significant effects of the operational
conditions on the interested responses. It is important to determine optimum
conditions for achieving high rejection of dye and permeate flux. However, the worst
salt rejection has to be predicted at the same time for designing the subsequent
desalting step. The information helps in bimodal porous membrane application
especially in module selection and separation design.
1.5 Organization of the Thesis
The thesis consists of six chapters as listed in Table of Contents. A brief
introduction on membrane separation technology with emphasis on NF is given in
Chapter 1 (Introduction). The introduction of ceramic membranes and their
preparation method as well as their general application in liquid phase are also

18
included in this chapter. The first chapter also includes the problem statements in
order to provide some basis and rationale to identify the research directions to be
followed in this study. On the basis of problem statement defined, the specific
objectives of the research are then elaborated in detail together with the research
scope. The organization of thesis is given in the last section of this chapter.
Chapter 2 (Literature Review) provides essential information of ceramic
membranes. The preparation methods of ceramic support especially tape casting are
analyzed in the beginning of the chapter. Sphere templating method in preparing
porous ceramics is then chronologically discussed in the subsequent section. The
third section of the chapter includes the development of sol-gel derived ceramic
membranes. The application of ceramic membranes in the separation of neutral
solutes and charged solutes is also discussed. In the last part of literature review,
special emphasis on dye-salt-water is included.
The sumary of the transport model used in this study is available in Chapter 3
(Nanofiltration Transport Model). First part of the chapter includes transport
equations in the ENP. DSPM is then discussed in detail including equilibrium
partitioning and concentration polarization. Combined Film Theory- extended Nernst
Planck Equation (CF-ENP) is explained briefly in the last part of the chapter.
Chapter 4 (Materials and Method) presents the detail of materials and
chemicals used in the present study. This is followed by the detailed experimental
procedures, which include the membrane preparation method, characterization
methods and analytical techniques. The synthesis method for both membrane support

19
and sol-gel derived membrane are discussed in detail, which include the preparation
of template. The characterization method for membrane physicochemical properties
such as thermogravimetric behavior, types of interatomic bonds, crystalline phase
and porous structure are also outlined in Chapter 4. Details of the experimental set-
up are then elaborated in this chapter. The procedure to carry out the permeation test
in dead-end filtration unit is explained in detail. The permeation test includes water,
PEG in aqueous solution, dye solutions, salt solutions and dye-salt-water mixtures
for determination of membrane pore size, effective thickness/porosity, effective
volume charge density and morphology.
Chapter 5 (Results and Discussion) is the core of this thesis, which presents,
discusses and explains of the five main studies as listed in Table of Contents. In the
first section, the effects of green tape characteristics on the supports permeability is
studied to produce suitable supports with reduced resistance. The characteristics of
unsupported ceramic with bimodal pore size distribution are explored in the second
section. After selecting appropriate template quantity and heat treatment conditions,
the supported γ-alumina thin layers with different pore volumes are further studied in
the third section. The bimodal porous γ-alumina is utilized in bi-layered membrane
for permeability improvement. The fourth study mainly focuses on the effects of
secondary pore volume on the separating layer characteristics and separation
performance in dye and salt solutions. DSPM and ENP model are used to study the
effects of secondary pore on separation performance of the membrane. The last study
includes the finding of optimum conditions for the improved membrane in separation
of dye-salt-water mixtures.

20
The study’s findings are recapitulated in Chapter 6 (Conclusions and
Recommendations). The primary findings in Chapter 5 which include the effects of
secondary pores on membrane formation, membrane characteristics and separation
performance are summarized and concluded in this chapter. Based on the findings,
recommendations for future research are suggested. Finally, closing remarks are
stated in the last section of this chapter.

21
CHAPTER 2
LITERATURE REVIEW
2.1 Membrane Supports for Sol-gel Derived Membranes
Ceramic supports are available commercially in various geometries such as
disc, tube, multi-channel tube and honeycomb monolith. In general, alumina is the
dominant material used for ceramic supports due to its high stability and inert feature
(Grangeon and Lescoche, 1998). A proper ceramic support for sol-gel derived
membrane must possesses high permeability, great mechanical strength, fine
finishing, large porosity and defined pore size (Luyten et al., 2000). The pore size
distribution of supports varied largely from 0.1 μm to 15 μm. Supports with average
pore diameters larger than 1 μm are considered as macroparticle filters (Morgart et
al., 1993). Recent publication on support layer preparation is relatively lean in the
open literature even though synthesis methods of micro to nano-filter ceramic layers
are reported extensively. This is possibly because traditional shaping processes are
well adopted in most cases for the preparation of ceramic membrane support.
2.1.1 Common preparation methods of membrane supports
The most common shaping processes used in traditional ceramic products are
dry pressing, extrusion and tape casting. The choice of traditional ceramic processing
method for preparing membrane supports is selected based on the desired geometry
and microstructure of the ultimate products. Different processing techniques give
different effects on the microstructural development of ceramic supports during
sintering and will lead to different characteristics (Ribeiro et al., 2004). Most
methods begin with the preparation of ceramic formulations which involves wet

22
dispersion of ceramic powder in solvent with 30 – 70 wt % of solid loading and some
additives such as binder. After milling the mixture, it is usually followed by shaping,
dehydration and sintering (Ribeiro et al., 2004).
Macroporous ceramic supports with symmetric structure are mainly produced
by dry pressing and extruding methods. Dry compaction of ceramics for the
synthesis of such supports has been reported by a few researchers (Chao and Chou,
1996, Chou et al., 1998, Falamaki et al., 2004, Liang et al., 2006). They have
investigated the effects of the ceramic particle size, binder quantity, pressing pressure
and sintering temperature on support microstructure, i.e. porosity, pore size
distribution and tortuosity. The support properties in terms of permeability and
flexural strength were also measured and found to be related to both processing and
microstructure parameters. In further comparison with other processing methods
such as extrusion and slip casting, it was learnt that different degrees of homogeneity
and particle packing achieved in the green state affect the final microstructures and
material properties (Maarten Biesheuvel and Verweij, 1999, Ribeiro et al., 2004).
Compared to dry pressed supports, extruded ceramic supports not only possess better
homogeneity and particle packing but they also offer the preferable tubular geometry
which can be integrated in the cross flow separation systems. Besides tubular
geometry, extrusion method can even be used to synthesize multi-channel tubular
membrane supports (Ismagilov, 1997) and ceramic hollow fibers with larger surface
area per unit packing volume (Vercauteren et al., 1998). Recently, Isobe and co-
workers (2007a, 2007b) have successfully increased the permeability of ceramic
supports by tailoring uni-directionally oriented pores using plastic substance as a
pore former via extrusion. Although macroporous supports prepared by dry pressing

23
and extrusion are low in cost, inhomogeneous packing results in ceramic products
with lower tensile strength and poor surface smoothness (Maarten Biesheuvel and
Verweij, 1999). The macroporous support is usually further dip coated or slip coated
for producing asymmetric structure which is more applicable for sol coating of
membrane (Luyten et al., 2000).
Since additional modification step is needed, the mentioned traditional
ceramics processing methods are time and cost consuming. Preparation of
asymmetric ceramic supports in a single step has been the subject of interest.
Centrifugal casting was reported in preparing tubular ceramics with gradient pore
size (Biesheuvel et al., 1998, Fukui, 1990). Nevertheless, this preparation method is
not widely described in the literature because of its limitation in mass production.
Tape casting, a conventional ceramics processing method in electronic industry is
more suitable in producing asymmetric membrane supports over centrifugal casting
as discussed below.
2.1.2 Tape casting of asymmetric membrane supports
Tape casting is well established for the production of multilayer capacitors,
insulating substrates and packages in electronic industry. This technique has been
adopted in membrane technology to produce membrane supports typically ceramic
substrates in flat configuration with thickness in order of few millimeters (Hsieh,
1996a). The preparation of ceramic supports using tape casting method has been well
disclosed in the open literature. The greatest advantage of tape casting supports is the
fine finished surface for sol coating without defects. Stacking tapes with increasing
pore former quantity creates asymmetric porous structure which features largely in

24
porous structure of tape casting supports. The asymmetric structure is preferable as
transport resistance is lower, especially in liquid filtration.
Tape casting methodology starts with the formulation stage where slurries are
prepared by dispersing ceramic powder in solvent. Studies showed that ceramic
powder with smaller particle size is preferable for high quality of finishing surface
and smaller pore size (Das and Maiti, 1999); however, higher concentration of
additives is required to prevent serious tape shrinkage (Pagnoux et al., 1998). Since
the last decade, non-aqueous slurries containing organic solvents such as alcohols,
ketones and hydrocarbons have been replaced gradually by aqueous based slurries in
most tape casting processes due to environmental and health concern. Although
physical properties of green tapes from both types of slurries are similar, the aqueous
system is more sensitive to process perturbations (Nahass et al., 1990). A tape
casting slurry must be adjusted in order to yield green tapes with satisfactory
flexibility, cohesion, homogeneity and mechanical strength after sintering. This
requires careful selection of the slurry additives together with accurate control of
processing parameters. The ceramics powder and additives (i.e. dispersant, binder,
plasticizer) should be added in a proper sequence to produce homogenous slurry with
minimum agglomerates (Nahass et al., 1990). The slurry preparation step frequently
starts with a milling procedure in which ceramic powder is mixed with a solvent
containing dispersant. Then a mixing and homogenization step occurs in which
binders and plasticizers are added to the low viscosity slurry.
Since well-dispersed slurry is a prerequisite in the preparation of
homogeneous and dense tape using tape casting method, dispersant which is also


![[T3CON12CA] TYPO3 Phoenix Templating Workshop](https://img.pdfslide.net/doc/110x75/5550fda4b4c90572478b4be3/t3con12ca-typo3-phoenix-templating-workshop.jpg)