Embed Size (px)
Citation preview

8/10/2019 Binder1 (1).pdf
http://slidepdf.com/reader/full/binder1-1pdf 1/10
14.387 Spring 2014
Problem Set 2 Solutions
1.
(a) Fits and residuals:
x i = zi π
ξ i = x i −x i
cov x i , ξ i = 0
Plug these in to the IV estimand:
β IV = cov (yi , x i )
cov (x i , x i )
= cov (yi , x i )
cov x i + ξ i , x i
= cov (yi , x i )
cov (x i , x i ) + cov ξ, x i
= cov (yi , x i )
var (x i )= β 2 SLS
(b) Fits:
x i = zi π
x ∗
i = zi π
Preliminaries:
π p
→ π1N
Z Z p
→ QZ Z
1N
Z ξ p
→ 0
1√ N
Z η d
→ N (0, ΩZ η )
Using these we get:
β IV = X X − 1
Xy
= ( π Z X )− 1
π Z y
= ( π Z (Zπ + ξ ))− 1
π Z (Xβ + η)
= β + ( π Z Zπ + π Z ξ )− 1
π Z η
1

8/10/2019 Binder1 (1).pdf
http://slidepdf.com/reader/full/binder1-1pdf 2/10
√ N β IV −β = √ N (π Z Zπ + π Z ξ )− 1
π Z η
= π 1N
Z Zπ + π 1N
Z ξ − 1
π 1√ N
Z η
d
→ (π Q Z Z π )− 1
π N (0, ΩZ η )
= N 0, (π Q Z Z π )− 1
π ΩZ η π (π Q Z Z π )− 1
β ∗IV = X ∗ X − 1
X ∗ y
= ( π Z X )− 1
π Z y
= ( π Z (Zπ + ξ ))− 1
π Z (Xβ + η)
= β + ( π Z Zπ + π Z ξ )− 1
π Z η
√ N β ∗IV −β = √ N (π Z Zπ + π Z ξ )− 1
π Z η
= π 1N
Z Zπ + π 1N
Z ξ − 1
π 1√ N
Z η
d
→ (π Q Z Z π )− 1
π N (0, ΩZ η )
= N 0, (π Q Z Z π )− 1
π ΩZ η π (π Q Z Z π )− 1
Thus, the limiting distributions of β IV and β ∗IV are the same. We know that β IV and β 2 SLS are the same, andthus also the limiting distributions of β ∗IV and β 2 SLS are the same.
(c) Reduced form:
yi
= ziπβ + ν
iν i = ξ i β + ηi
Preliminaries:
1N
Z Z p
→ QZ Z
1√ N
Z ξ d
→ N (0, ΩZ ξ )
1√ N
Z ν d
→ N (0, ΩZ ν )
Using these we get:
β ∗2 SLS = X ∗ X ∗− 1
X ∗ y
= ( π Z Zπ )− 1
π Z y
= ( π Z Zπ )− 1
π Z (Zπβ + ν )
= β + ( π Z Zπ )− 1
π Z ν
2
8/10/2019 Binder1 (1).pdf
http://slidepdf.com/reader/full/binder1-1pdf 3/10
√ N β ∗2 SLS −β = √ N (π Z Zπ )− 1
π Z ν
= π 1N
Z Zπ− 1
π 1√ N
Z ν
d
→ (π Q Z Z π )− 1
π N (0, ΩZ ν )
= N (π Q Z Z π )− 1
π ΩZ ν π (π Q Z Z π )− 1
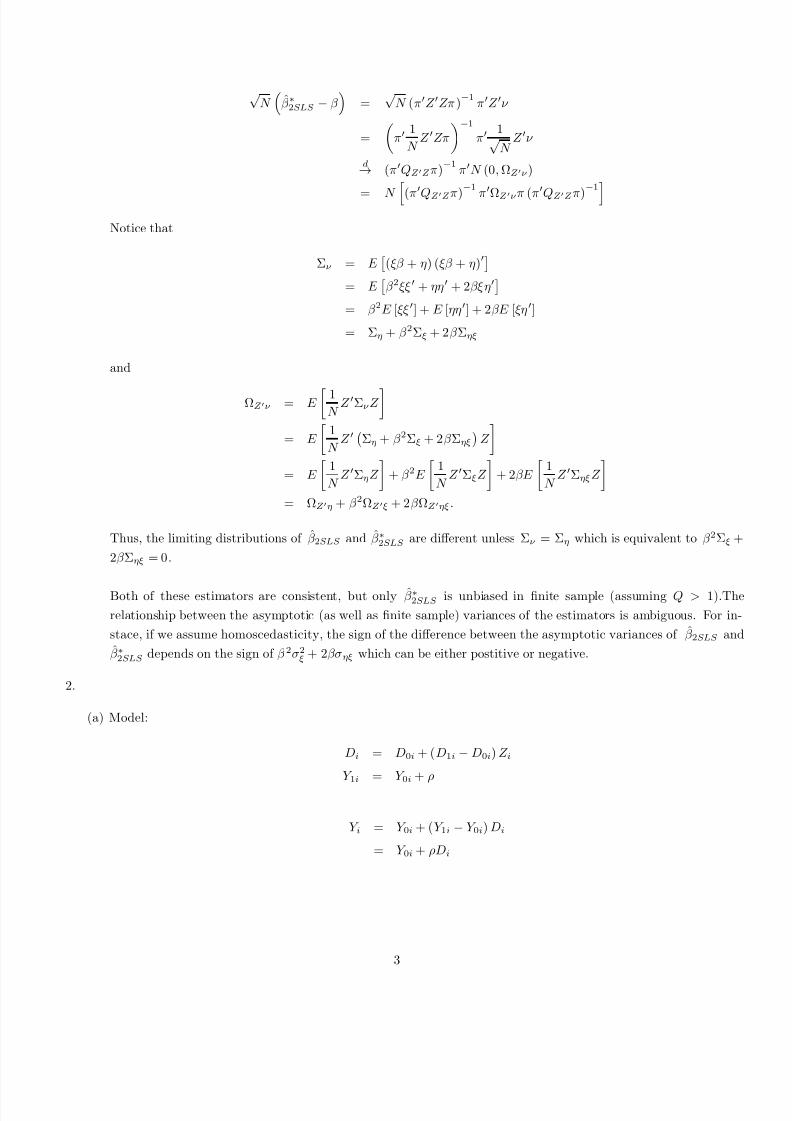
Notice that
Σ ν = E (ξβ + η) (ξβ + η)
= E β 2 ξξ + ηη + 2 βξη
= β 2 E [ξξ ] + E [ηη ] + 2βE [ξη ]
= Σ η + β 2 Σ ξ + 2 β Σ ηξ
and
ΩZ ν = E 1N
Z Σ ν Z
= E 1N
Z Σ η + β 2 Σ ξ + 2 β Σ ηξ Z
= E 1N
Z Σ η Z + β 2 E 1N
Z Σ ξ Z + 2 βE 1N
Z Σ ηξ Z
= Ω Z η + β 2 ΩZ ξ + 2 β ΩZ ηξ .
Thus, the limiting distributions of β 2 SLS and β ∗2 SLS are different unless Σν = Σ η which is equivalent to β 2 Σ ξ +2β Σ ηξ = 0 .
Both of these estimators are consistent, but only β ∗2 SLS is unbiased in nite sample (assuming Q > 1).Therelationship between the asymptotic (as well as nite sample) variances of the estimators is ambiguous. For in-stace, if we assume homoscedasticity, the sign of the difference between the asymptotic variances of β 2 SLS andβ ∗2 SLS depends on the sign of β 2 σ 2
ξ + 2βσ ηξ which can be either postitive or negative.
2.
(a) Model:
D i = D 0 i + ( D 1 i −D 0 i ) Z i
Y 1 i = Y 0 i + ρ
Y i = Y 0 i + ( Y 1 i −Y 0 i ) D i
= Y 0 i + ρD i
3

8/10/2019 Binder1 (1).pdf
http://slidepdf.com/reader/full/binder1-1pdf 4/10
Wald estimand:
E [Y i |Z i = 1] −E [Y i |Z i = 0]E [D i |Z i = 1] −E [D i |Z i = 0]
= E [Y 0 i + ρD i |Z i = 1] −E [Y 0 i + ρD i |Z i = 0]
E [D 0 i + ( D 1 i −D 0 i ) Z i |Z i = 1] −E [D 0 i + ( D 1 i −D 0 i ) Z i |Z i = 0]
= E [ρD 1 i ]−E [ρD 0 i ]
E [D 1 i
−D 0 i ]
= ρ E [D 1 i −D 0 i ]E [D 1 i −D 0 i ]
= ρ
Notice that monotonicity played no role above.
Bias formula in the general case:
E [Y i |Z i = 1] −E [Y i |Z i = 0]E [D i |Z i = 1] −E [D i |Z i = 0]
= E [Y 0 i + ( Y 1 i −Y 0 i ) D i |Z i = 1] −E [Y 0 i + ( Y 1 i −Y 0 i ) D i |Z i = 0]E [D 0 i + ( D 1 i −D 0 i ) Z i |Z i = 1] −E [D 0 i + ( D 1 i −D 0 i ) Z i |Z i = 0]
= E [(Y 1 i −Y 0 i ) (D 1 i −D 0 i )]
E [D 1 i −D 0 i ]= E [Y 1 i −Y 0 i |D 1 i > D 0 i ]
P [D 1 i > D 0 i ]P [D 1 i > D 0 i ]−P [D 1 i < D 0 i ]
−E [Y 1 i −Y 0 i |D 1 i < D 0 i ] P [D 1 i < D 0 i ]
P [D 1 i > D 0 i ]−P [D 1 i < D 0 i ]= E [Y 1 i −Y 0 i |D 1 i > D 0 i ]
+ P [D 1 i < D 0 i ]
P [D 1 i > D 0 i ]−P [D 1 i < D 0 i ]
×E [Y 1 i −Y 0 i |D 1 i > D 0 i ]−E [Y 1 i −Y 0 i |D 1 i < D 0 i ]
WALD −LATE =
P [D 1 i < D 0 i ]P [D 1 i > D 0 i ]−P [D 1 i < D 0 i ]
= ×E [Y 1 i −Y 0 i |D 1 i > D 0 i ]−E [Y 1 i −Y 0 i |D 1 i < D 0 i ]Thus, the failure of monotonicity is not a huge concern if either E [Y 1 i −Y 0 i |D 1 i > D 0 i ] ≈E [Y 1 i −Y 0 i |D 1 i < D 0 i
or P [D 1 i > D 0 i ] is large relative to P [D 1 i < D 0 i ].
(b) Notice that in general
E [Y i |Z i = 1] −E [Y i |Z i = 0] = E [Y 1 i −Y 0 i |D 1 i > D 0 i ]P [D 1 i > D 0 i ]
−E [Y 1 i −Y 0 i |D 1 i < D 0 i ]P [D 1 i < D 0 i ] .
Suppose Y 1 i −Y 0 i > 0 for all i . Then,
E [Y i |Z i = 1] −E [Y i |Z i = 0] ≤ 0
⇔ E [Y 1 i −Y 0 i |D 1 i > D 0 i ]E [Y 1 i −Y 0 i |D 1 i < D 0 i ] ≤
P [D 1 i < D 0 i ]P [D 1 i > D 0 i ]
.
4

8/10/2019 Binder1 (1).pdf
http://slidepdf.com/reader/full/binder1-1pdf 5/10
(c) No always-takers: D 0 i = 0 for all i which implies that D i = 1⇔D 1 i = 1 , Z i = 1 . Thus,
E [Y 1 i −Y 0 i |D 1 i > D 0 i ] = E [Y 1 i −Y 0 i |D 1 i = 1]
= E [Y 1 i −Y 0 i |D 1 i = 1 , Z i = 1]
= E [Y 1 i
−Y 0 i
|D i = 1] .
No never-takers: D 1 i = 1 for all i which implies that D i = 0⇔D 0 i = 1 , Z i = 0 . Thus,
E [Y 1 i −Y 0 i |D 1 i > D 0 i ] = E [Y 1 i −Y 0 i |D 0 i = 0]
= E [Y 1 i −Y 0 i |D 0 i = 1 , Z i = 0]
= E [Y 1 i −Y 0 i |D i = 0] .
3.
(a) Difficulties in determining the causal effect of female employment on divorce:
• Reverse causality (divorce causing employment)
• Confounding factors
Experiment to capture the causal effect of interest:
• Ideally would like to randomize the employment status of married women
• More realistically need an instrument that affects employment probability (rst stage) but does not affectdivorce probability directly or through any other channel (exclusion restriction)
(b) Notation:
• D i : divorce dummy
• E i : employment dummy
• X i : covariate vector
• Z i : instrument dummy
• i , ν i : unobserved random errors
Observed divorce and employment status:
D i = 1 [X i β 0 + β 1 E i > i ]
E i = 1 [X i γ 0 + γ 1 Z i > ν i ]
Potential divorce and employment status:
D 1 i = 1 [X i β 0 + β 1 > i ]D 0 i = 1 [X i β 0 > i ]
E 1 i = 1 [X i γ 0 + γ 1 > ν i ]
E 0 i = 1 [X i γ 0 > ν i ]
(c)
5

8/10/2019 Binder1 (1).pdf
http://slidepdf.com/reader/full/binder1-1pdf 6/10
• The population for the study should be working-aged married women (panel data) or working-aged ever-married women (cross-sectional data).
• In the structural model the endogeneity of employment means that i and ν i are correlated.
• In the causal model the endogeneity of employment means that potential outcomes E 0 i and E 1 i are not(mean-)independent of the treatment status D i .
(d) Distributional assumption:
i
ν i
iid∼ N
00
, σ2 ρσ ν
ρσ ν σ2ν
Notation:
• Φ (·)= CDF of standard univariate normal distribution
• Φb (·, ·)= CDF of standard bivariate normal distributions
AT E = E [D 1 i −D 0 i ]
= E 1 [X i β 0 + β 1 > i ]−1 [X i β 0 > i ]= E E 1
X i β 0 + β 1σ
> i
σ | X i −E 1X i β 0
σ>
i
σ | X i
= E ΦX i β 0 + β 1
σ −ΦX i β 0
σ
ET T = E [D 1 i −D 0 i |E i = 1]
= E 1 [X i β 0 + β 1 > i ]−1 [X i β 0 > i ] | X i γ 0 + γ 1 Z i > ν i= E E 1
X i β 0 + β 1σ
> i
σ | X i , Z i , X i γ 0 + γ 1 Z i
σν >
ν iσν
−E E 1X i β 0
σ>
i
σ | X i , Z i , X i γ 0 + γ 1 Z i
σν >
ν iσν
= E Φb
X i β 0 + β 1
σ , X i γ 0 + γ 1 Z iσ ν −Φb
X i β 0
σ , X i γ 0 + γ 1 Z iσ ν
Φ X i γ 0 + γ 1 Z iσ ν
LATE = E [D 1 i −D 0 i |E 1 i > E 0 i ]
= E 1 [X i β 0 + β 1 > i ]−1 [X i β 0 > i ] | X i γ 0 + γ 1 > ν i > X i γ 0 = E E 1
X i β 0 + β 1σ
> i
σ | X i , X i γ 0 + γ 1
σν >
ν iσν
> X i γ 0
σν
−E E 1X i β 0
σ>
i
σ | X i , X i γ 0 + γ 1
σν >
ν iσν
> X i γ 0
σν
= E Φb
X i β 0 + β 1
σ , X i βγ 0 + γ 1σ ν −Φb
X i β 0 + β 1
σ , X i β + γ 0σ ν − Φb
X i β 0
σ , X i βγ 0 + γ 1σ ν −Φb
X i β 0
σ , X i
Φ X i βγ 0 + γ 1σ ν −Φ X i β + γ 0
σ ν
ATE is a weighted average of ETT and the average effect on the untreated. ETT is a weighted average of LATE and the average effect on the always-takers. In general we cannot say anything about the relative
6

8/10/2019 Binder1 (1).pdf
http://slidepdf.com/reader/full/binder1-1pdf 7/10
magnitudes of ATE, ETT and LATE.
(e) See attached code.
4.
(a) Model:
yit = α i + x it β + it
where i = 1 , . . . , N and t = 1 , 2.
Notation:
yit = yit −yi
x it = x it −x i
∆ yi = yi 2 −yi 1
∆ x i = x i 2 −x i 1
Notice that
x i 1 = x i 1 − 12
(x i 1 + x i 2 )
= 1
2 (x i 1 −x i 2 )
= −12
∆ x i
x i 2 = x it 2 − 12 (x i 1 + x i 2 )
= 1
2 (x i 2 −x i 1 )
= 1
2∆ x i
yi 1 = yi 1 − 12
(yi 1 + yi 2 )
= 1
2 (yi 1 −yi 2 )
= −12
∆ yi
˜y
i 2 = y
it 2 − 1
2 (y
i 1 +y
i 2 )=
12
(yi 2 −yi 1 )
= 1
2∆ yi .
7

8/10/2019 Binder1 (1).pdf
http://slidepdf.com/reader/full/binder1-1pdf 8/10
Using this we get
β F E = N
i =1
x i 1 x i 1 + x i 2 x i 2
− 1 N
i =1
x i 1 yi 1 + x i 2 yi 2
=
N
i =1
14∆ x i ∆ x i +
14∆ x i ∆ x i
− 1 N
i =1
14∆ x i ∆ yi +
14∆ x i ∆ yi
= N
i =1
∆ x i ∆ x i
− 1 N
i =1
∆ x i ∆ yi
= β F D .
(b) Notation:
• Y ist : employment dummy for individual i in state s in year t
• F A s : fraction of teenagers in the affected wage range in state s
• D t : dummy for year 1990
Micro-level model:
Y ist = γ s + λ t + δ (F A s ·D t ) + ist
Since all the variables live on the state-year level, we can average over individuals (teenagers) within state-yearcells without any loss of information (need to weight by cell sizes to match exactly):
Y st = γ s + λ t + δ (F A s ·D t ) + ¯ st
We can get rid of the state xed effect by rst-differencing the data:
Y s, 1990 − Y s, 1989 = ( λ 1990 −λ 1989 ) + δF A s + (¯ s, 1990 − s, 1989 )
∆ Y s = λ∗ + δF A s + ∆¯ s
Card (1992) weights the differenced equation according to the average sample size in the two periods. Runningthe FE model and weighting according to the sample sizes in each state-year cell might work better (althoughunlikely to matter much in practice).
5. See attached code.
8

8/10/2019 Binder1 (1).pdf
http://slidepdf.com/reader/full/binder1-1pdf 9/10
cd " H: \ Teachi ng\ 14. 387_Spri ng_2014\ Pr obl em_Set_ 2"
/ ***************// * EXCERCI SE 3 *// ***************/
/ * P a r t ( e ) * /
use "m_d_806. dt a", cl eardesccountdest ri ng, repl ace
r epl ace qt r mar=qtr mar - 1gen yom = yobm+ agemar i f qt r bthm <= qtr marrepl ace yom = yobm + agemar + 1 i f qt rbthm> qt r margen dom_q = yom + ( qt r mar/ 4)gen do1b_q = yobk + ( qt r bki d/ 4)gen i l l egi t = 1 i f ( dom_q- do1b_q)>0
gen boy1st = ( sexk == 0)gen boy2nd = ( SEX2ND == 0)gen boys2 = ( ( sexk == 0) & ( SEX2ND == 0) )gen gi r l s2 = ( ( sexk == 1) & ( SEX2ND == 1) )
gen samesex = ( ( boys2 == 1) | ( gi r l s2 == 1) )gen yobd = 80 - aged i f qt r bt hd == 0r epl ace yobd = 79 - aged i f qt r bt hd ! = 0
gen ageqm = 4*( 80- yobm) - qt r bt hm- 1gen ageqd = 4*( 80- yobd) - qtr bthdgen agefst m = i nt ( ( ageqm- ageqk)/ 4)gen agefst d = i nt ( ( ageqd- ageqk)/ 4)
gen mul t i 2nd = ( AGEQ2ND == AGEQ3RD)gen moreki ds = ki dcount > 2gen workedm = ( weeksm > 0)
gen educm = gradem- 3repl ace educm= gr adem - 2 i f f i ngradm == 2 | f i ngradm == 1repl ace educm= 0 i f educm< 0
gen hsgrad = ( educm == 12)gen moret hs = ( educm > 12)gen col l egegr ad = ( educm >= 16)
gen bl ackm = ( r acem == 2)gen hi spm = ( racem == 12)
keep i f aged ! = .keep i f t i mesmar == 1keep i f mari t al == 0keep i f i l l egi t ! = 1keep i f agef st m >= 15keep i f agef st d >= 15
keep i f agem >= 21 & agem <= 35keep i f ki dcount >= 2 & ki dcount ! = .keep i f AGEQ2ND > 4keep i f asex == 0 & aage == 0 & ASEX2ND == 0 & AAGE2ND == 0 & aqt r br t h == 0
count
gl obal covs = " ageqm agef st m boy1st boy2nd"
est cl earr eg wor kedm mor eki deststoprobi t workedm moreki dsmf xeststo

8/10/2019 Binder1 (1).pdf
http://slidepdf.com/reader/full/binder1-1pdf 10/10
r eg wor kedm mor eki ds $covseststoprobi t workedm moreki ds $covsmf xeststoest t ab, b( 3) s e( 3) compress margi n keep( moreki ds)
est cl ear
i vr eg2 workedm ( moreki ds = samesex)eststobi pr obi t ( workedm = moreki ds) ( moreki ds = samesex)mf x comput e, predi ct ( pcond1)eststoi vr eg2 workedm ( moreki ds = samesex) $covseststobi pr obi t ( workedm = moreki ds $covs) ( moreki ds = samesex $covs)mf x comput e, predi ct ( pcond1)eststoest t ab, b( 3) s e( 3) compress margi n keep( moreki ds)
/ ***************// * EXCERCI SE 5 *// ***************/
use " i ndi vi d_f i nal . dta" , c l ear
gen above = ( di f shar e >= 0)gen above_di f shar e = above*di f shar ef orval i = 2/ 4
gen di f share`i ' = di f share^ i 'gen above_di f shar e`i ' = above*di f share^ i '
l ogi t myout comenext above di f shar e* above_di f shar e*mf x, at ( zero)
r d myout comenext di f shar e, c( 0)
l ocal h_opt = . 1514835257991828gen l ambda = ( 1 - abs( di f shar e/ `h_opt ' ) ) *( abs( di f shar e/ `h_opt ' ) <= 1)r eg myout comenext above di f shar e above_di f shar e [ aw = l ambda] , r obust


![Binder1[1] - Hili AFS 2018.pdf · +1-260,270 . Title: Binder1[1] Created Date: 4/25/2019 4:37:25 PM](https://img.pdfslide.net/doc/110x75/5f61f4c36f00037b1316fc77/binder11-hili-afs-2018pdf-1-260270-title-binder11-created-date-4252019.jpg)