Embed Size (px)
Citation preview

Binding Free Energy Calculations for Lead Optimization: Assessmentof Their Accuracy in an Industrial Drug Design ContextNadine Homeyer,† Friederike Stoll,§ Alexander Hillisch,§ and Holger Gohlke*,†
†Institute for Pharmaceutical and Medicinal Chemistry, Department of Mathematics and Natural Sciences, Heinrich-Heine-UniversityDusseldorf, Universitatsstr.1, 40225 Dusseldorf, Germany§Global Drug Discovery, Medicinal Chemistry, Bayer Pharma AG, Aprather Weg 18A, 42113 Wuppertal, Germany
*S Supporting Information
ABSTRACT: Correctly ranking compounds according totheir computed relative binding affinities will be of greatvalue for decision making in the lead optimization phase ofindustrial drug discovery. However, the performance ofexisting computationally demanding binding free energycalculation methods in this context is largely unknown. Weanalyzed the performance of the molecular mechanicscontinuum solvent, the linear interaction energy (LIE), andthe thermodynamic integration (TI) approach for three sets ofcompounds from industrial lead optimization projects. Thedata sets pose challenges typical for this early stage of drugdiscovery. None of the methods was sufficiently predictive when applied out of the box without considering these challenges.Detailed investigations of failures revealed critical points that are essential for good binding free energy predictions. When dataset-specific features were considered accordingly, predictions valuable for lead optimization could be obtained for all approachesbut LIE. Our findings lead to clear recommendations for when to use which of the above approaches. Our findings also stress theimportant role of expert knowledge in this process, not least for estimating the accuracy of prediction results by TI, usingindicators such as the size and chemical structure of exchanged groups and the statistical error in the predictions. Such knowledgewill be invaluable when it comes to the question which of the TI results can be trusted for decision making.
■ INTRODUCTION
The costs spent per approved drug have increased tremen-dously over the last decades and were recently estimated toamount to 4 billion U.S. dollars.1,2 Lead optimization alonecosts approximately 150 million U.S. dollars per new molecularentity3 such that the pharmaceutical industry will greatly benefitfrom methods that help increasing the efficiency of this earlyphase of drug development. Predicting binding affinities ofcompounds to their primary target (or at least correctly rankingthem) would be one such approach as it allows concentratingsynthesis efforts to more promising compounds then. However,although various approaches are available today,4 which haveproved useful for computing relative binding affinities of smallmolecules in certain studies,5,6 these methods are still notroutinely applied in industrial drug development.7,8 Besides thecomputational expenses and the complex setup of suchcalculations, it is the lack of studies that demonstrate theirvalue for industrial drug discovery projects that leads toreluctance to use these methods more widely. In fact, whilebinding free energy calculations have been successfully appliedin numerous cases to study individual ligand data sets, with theligands often originating from different sources, or a fewinteresting drug-candidate molecules, information about theaccuracy of binding free energy calculations on series of ligandsthat are typical for later stages of drug design is largely missing.
This provided the incentive for us to test the performance ofbinding free energy calculations on protein−ligand data setsthat originate from drug design pipelines and pose “day-to-day”challenges such as the lack of experimentally determinedbinding modes, unusual protein−ligand interactions, largestructural diversity of the ligands, ligands with varying totalcharges, uncertainty of protonation states, unspecified/inferredstereochemistry, and modeled and/or mobile target structures.In terms of computing time, end-point free energy methods
are the most efficient approaches for computing binding freeenergies because they only consider the free and the boundstates of the system. The molecular mechanics Poisson−Boltzmann surface area (MM-PBSA), the molecular mechanicsgeneralized Born surface area (MM-GBSA),9,10 and the linearinteraction energy (LIE)11 approaches are likely the most well-known and widely applied methods in this class. MM-PBSAand MM-GBSA estimate the binding free energy from changesin the gas-phase energy, solvation free energy, and configura-tional entropy upon complex formation. The solvation freeenergy is determined by a continuum solvent model and a termaccounting for the nonpolar contribution to solvation. Incontrast, the LIE approach considers water interactions
Received: January 14, 2014Published: June 6, 2014
Article
pubs.acs.org/JCTC
© 2014 American Chemical Society 3331 dx.doi.org/10.1021/ct5000296 | J. Chem. Theory Comput. 2014, 10, 3331−3344
explicitly and estimates the binding free energy from changes inthe electrostatic and van der Waals interactions of the ligandwith its environment upon transfer from solution to thereceptor binding site.6,12 Both approaches commonly considerconformational effects by averaging over the energies ofstructural ensembles of the end-points generated by moleculardynamics (MD) simulations. Pathway methods such asthermodynamic integration (TI) and free energy perturbation
(FEP) are usually more accurate but are also more time-consuming than the end-point approaches. This is because theyrequire sampling of unphysical intermediate states in order tocompute free energies along a transition path from an initial toa final state. With respect to efficiency, TI has the advantagethat the precision of binding free energy predictions can beincreased by subsequently including additional intermediatestates.7 Thus, this method offers the opportunity to start
Table 1. Studied Protein−Ligand Systems
target protein template complex structure no. of ligandsno. of charged
ligandschallenges of data
seta
factor Xa (FXa) X-ray structure of FXa−F5b complex of Roehrig et al.15 2515 0 I, II, VIcyclin-dependent kinase 2 (CDK2) X-ray structure of CDK2−C37Sb complex of Jautelat et al.16 2916 10 I, III, IVmineralocorticoid receptor (MR) MR−M38b,c complex structure modeled based on X-ray data 29 (+12)d,18 (2)e I, IV, V, VII, VIIIaChallenges of the data set for binding free energy predictions: (I) experimentally determined binding modes missing for the majority of the ligands;(II) uncommon protein−ligand interactions; (III) ligands structurally diverse; (IV) ligands with different total charges; (V) protonation state notknown for all ligands; (VI) orientation of central ring moiety of ligands undetermined; (VII) stereochemistry of some ligands uncertain; (VIII)partially modeled receptor structure. bInvestigated ligands and their aliases are given in Tables S1−S3. cThe structure of the MR bound to M38 wasmodeled based on MR agonist bound X-ray structures84,85 and an active antagonist/partial agonist conformation of helix 12 from the glucocorticoidreceptor.86 dA subset of 12 MR antagonists was investigated in a blind test, without a priori knowledge of the IC50 values.
eCompounds 8 and 24were considered in two alternative protonation (charge) states.
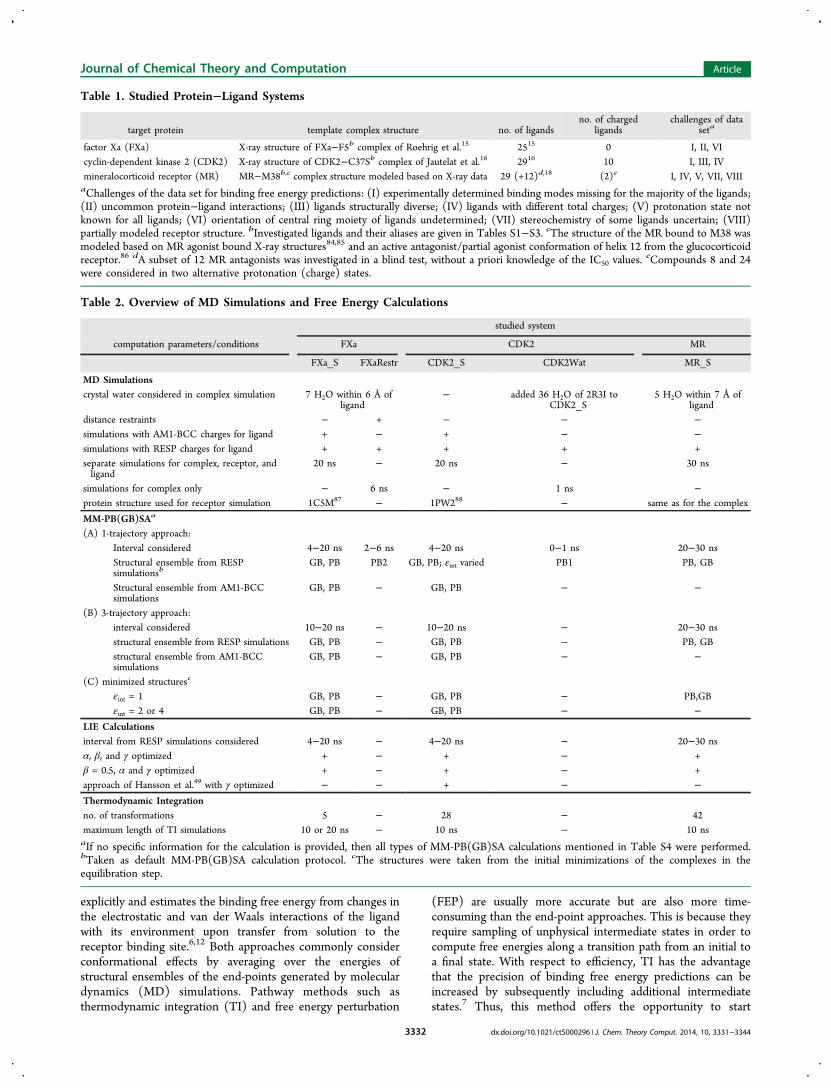
Table 2. Overview of MD Simulations and Free Energy Calculations
studied system
computation parameters/conditions FXa CDK2 MR
FXa_S FXaRestr CDK2_S CDK2Wat MR_S
MD Simulationscrystal water considered in complex simulation 7 H2O within 6 Å of
ligand− added 36 H2O of 2R3I to
CDK2_S5 H2O within 7 Å of
liganddistance restraints − + − − −simulations with AM1-BCC charges for ligand + − + − −simulations with RESP charges for ligand + + + + +separate simulations for complex, receptor, andligand
20 ns − 20 ns − 30 ns
simulations for complex only − 6 ns − 1 ns −protein structure used for receptor simulation 1C5M87 − 1PW288 − same as for the complex
MM-PB(GB)SAa
(A) 1-trajectory approach:Interval considered 4−20 ns 2−6 ns 4−20 ns 0−1 ns 20−30 nsStructural ensemble from RESPsimulationsb
GB, PB PB2 GB, PB; εint varied PB1 PB, GB
Structural ensemble from AM1-BCCsimulations
GB, PB − GB, PB − −
(B) 3-trajectory approach:interval considered 10−20 ns − 10−20 ns − 20−30 nsstructural ensemble from RESP simulations GB, PB − GB, PB − PB, GBstructural ensemble from AM1-BCCsimulations
GB, PB − GB, PB − −
(C) minimized structuresc
εint = 1 GB, PB − GB, PB − PB,GBεint = 2 or 4 GB, PB − GB, PB − −
LIE Calculationsinterval from RESP simulations considered 4−20 ns − 4−20 ns − 20−30 nsα, β, and γ optimized + − + − +β = 0.5, α and γ optimized + − + − +approach of Hansson et al.49 with γ optimized − − + − −Thermodynamic Integrationno. of transformations 5 − 28 − 42maximum length of TI simulations 10 or 20 ns − 10 ns − 10 nsaIf no specific information for the calculation is provided, then all types of MM-PB(GB)SA calculations mentioned in Table S4 were performed.bTaken as default MM-PB(GB)SA calculation protocol. cThe structures were taken from the initial minimizations of the complexes in theequilibration step.
Journal of Chemical Theory and Computation Article
dx.doi.org/10.1021/ct5000296 | J. Chem. Theory Comput. 2014, 10, 3331−33443332
calculations at the lower limit of precision and only conductadditional sampling where necessary. This is especially valuablebecause of the inverse relationship between accuracy andrequired computing time usually found for binding free energycalculations,12 which requires one to find an optimal trade-offbetween prediction quality and computational demand.We investigated the performance of MM-PB(GB)SA, LIE,
and TI on data sets from the lead optimization phase ofindustrial drug design projects with a special focus on efficiency.As lead optimization cycles typically cover only a few weeks,13
we set ourselves a time limit of 2 weeks for the binding freeenergy calculations on a state of the art compute cluster with 32cores available per ligand. Within this limit we calculated therelative binding free energies of three medium-size sets ofligands binding to the serine protease factor Xa (FXa),14,15 thecyclin-dependent kinase 2 (CDK2),16 and the mineralocorti-coid receptor (MR).17,18 All of these data sets pose one ormultiple of the above-mentioned challenges (Table 1).Performing binding free energy calculations on these datasets will provide information about how to cope with thesechallenges and the accuracy of predictions that can be reachedin such cases. Based on these results, we propose rules forbinding free energy calculations that shall be of value for theprocess of lead optimization in an industrial context.
■ METHODSStructure Preparation. Three data sets were used in this
study (Table 1). For each system a complex structure of thetarget protein with a representative ligand was obtained eitherfrom X-ray crystallography or modeled based on availablestructural and experimental information. The other compoundsof the respective data set were modeled into the binding pocketby a combination of docking and manual adjustment of theligand molecule by an expert modeler.The structures were prepared for free energy analyses using
the programs Sybyl,19 SwissPDBViewer,20,21 Pymol,22 andAMBER11.23 In addition to the protein−ligand complexstructures, we also prepared apo structures of FXa and CDK2obtained from the Protein Data Bank.24 These structures wereused as models for the ligand free proteins to account forstructural changes taking place upon binding.In order to ensure that water molecules located close to the
binding site are placed within this region in the startingstructure of a bound system, these water molecules wereretained from the complex structures of FXa and MR. ForCDK2 it has been reported that it is important to considerwater interactions between the protein and the ligands.25 Thus,in addition to a bound-state CDK2 structure without water, astructure with water molecules was prepared, referred to in thefollowing as CDK2Wat. A detailed description of thepreparation of all systems is provided in the SupportingInformation.Regarding ligand structures, two alternative starting config-
urations were generated for FXa inhibitors F4, F6, F8, F10, andF12 because the position of the fluorine atom at the central ringof these inhibitors was not known from experimental studies; inthe alternative structures the fluorine atom at the central ringpointed either toward or away from the protein surface. As itwas found that the central ring turned around freely during theMD simulations, the free energies calculated for the alternativestarting configurations were averaged before evaluation.MD Simulations. Conformational ensembles for the MM-
PB(GB)SA calculations and LIE analyses were generated by
MD simulations in explicit water. A summary of all conductedsimulations is provided in Table 2. Force field parameters forthe ligands were taken from the general AMBER force field.26
Ligand atomic charges were either determined by the AM1-BCC method27,28 with SQM and the AMBER tool Ante-chamber or calculated by the restraint electrostatic potential fitprocedure29 using Gaussian0330 and Antechamber. Proteinsystems and structurally bound ions were described by theff99SB force field.31,32 Model systems of complexes, receptors,and ligands were generated based on the prepared structureswith LEaP. After neutralization by adding Na+ or Cl−
counterions, the systems were placed in a box of TIP3P33
water molecules extending at least 11 Å in each direction fromthe solute. The solvated systems served as input structures forthe simulations. All simulations were conducted withAMBER11.23 A detailed simulation protocol is provided inthe Supporting Information.
MM-PBSA and MM-GBSA. Binding free energy calcu-lations were carried out with the mm_pbsa.pl script ofAMBER1123 using structures extracted in 20 ps intervalsfrom the MD simulations, or structures of the minimizedsystems, from which water and counterions had been stripped(Table 2). The sampling frequency of 20 ps is well above acorrelation time of 1−5 ps of MM-PB(GB)SA effective energiesfound in previous studies.34,35
In the MM-PB(GB)SA approach the free energy of amolecule is obtained from the sum of the molecular mechanicsenergy, solvation free energy, and configurational entropy (eq1). If the free energy is determined from a conformationalensemble, the individual energetic contributions are averagedover all structures of the ensemble.
= + −G E G TSmolecule MM solv (1)
The binding free energy is then computed from the freeenergies of the complex, receptor, and ligand according to eq 2.
Δ = − −G G G Gbinding complex receptor ligand (2)
In this study solvation free energies were determined usingfive flavors of implicit solvation models (Table S4). The GBSAmethod I of Onufriev et al.36 (GB2) and PBSA calculationswith mbondi37 and Parse38 radii (PB1&2) yielded overall thebest results. Only these three methods will thus be consideredbelow.Previous performance studies of the MM-PB(GB)SA method
have revealed that taking into account entropic contributionscalculated by the quasiharmonic (QH) or the normal mode(NM) approach introduces a significant uncertainty in theprediction of the binding free energy.34,39−41 Furthermore, ithas been reported that considering entropic contributions doesnot always lead to a gain in accuracy for relative binding freeenergy predictions.40,42,43 Consistent with these findings weobserved no improvement in the relative binding free energypredictions for the FXa inhibitors when entropies calculated bythe QH or NM approaches based on the FXa_S simulationswere taken into account. In the case of the QH analyses, eventhe entropies of some of the ligands were found to be notconverged after 20 ns of simulation time, let alone the entropiesof the receptor structures. Therefore, we decided to neglectcontributions due to changes in the configurational entropy asis often done if relative binding free energies are com-puted.44−46 Consistent with previous definitions,34 the bindingenergies computed by MM-PB(GB)SA as the sum of gas-phase
Journal of Chemical Theory and Computation Article
dx.doi.org/10.1021/ct5000296 | J. Chem. Theory Comput. 2014, 10, 3331−33443333
energies and solvation free energies are referred to as “effectivebinding energies” below.Snapshots for the generation of conformational ensembles
can either be obtained from a single trajectory of the complex(1-trajectory approach) or from individual trajectories of thecomplex, receptor, and ligand (3-trajectory approach). Bothpossibilities were tested in our study. Probably due to a largernoise caused by the usage of different conformations forcomplex, receptor, and ligand, which precludes the cancellationof internal energies,40 the performance of the 3-trajectoryapproach was inferior compared to the one of the 1-trajectoryapproach for all three data sets. Hence, only the 1-trajectoryalternative is considered here.In order to test the influence of the atomic charges of the
ligand on the binding free energy predictions, MM-PB(GB)SAcalculations were carried out using conformational ensemblesfrom simulations with AM1-BCC27,28 or RESP29 charges forthe ligand. Overall slightly better predictions were obtained inthe case of RESP charges, and only these results are reportedbelow. As determining such charges is no longer hampered bythe computational demand of the calculations, and automatedtools facilitate the computation of charges for sets of multipleligands,47 we recommend to use RESP charges in general.In summary, unless denoted otherwise, default MM-PB-
(GB)SA analyses were conducted using conformationalensembles extracted from the complex simulations with RESPcharges and employing the 1-trajectory approach.LIE Analyses. Binding free energy calculations according to
the LIE approach were carried out using snapshots fromsimulations of the solvated complex and the solvated ligand(Table 2). First, for each snapshot single point molecularmechanics energy calculations were conducted for the totalsystem as well as for its individual components using Sander ofAMBER11.23 Then the electrostatic and van der Waals (vdW)interaction energies of the ligand were determined as thedifference between the total energies and the individual energycontributions (eq 3).
= − − = |E E E E i electrostatic vdWi itotal
iligand
irest
(3)
Electrostatic and vdW interaction energies were averagedover all snapshots of the respective conformational ensembleand then used to estimate the binding free energy ΔG by amultiple linear regression to experimental binding affinitiesaccording to eq 4 employing the program R.48
α
β γ
Δ = ⟨ ⟩ − ⟨ ⟩
+ ⟨ ⟩ − ⟨ ⟩ +
G E E
E E
( )
( )
binding vdWbound
vdWfree
elecbound
elecfree
(4)
It has been a matter of discussion what scaling factors are tobe used to weight the differences in the electrostatic and thevdW interactions, and multiple values have been sug-gested.6,49−51 In order to investigate this influence threedifferent settings were tested in this study (Table 2).Thermodynamic Integration. TI transformations of one
ligand into another were conducted by performing simulationsat discrete λ steps, where λ couples the potential functions ofthe two states, V0 and V1 (eq 5).
λ λ λ= − +V V V( ) (1 ) 0 1 (5)
The free energy difference ΔG for the transformation wascomputed by integration over the average dV/dλ valuesobtained at each λ step (eq 6).
∫ λλ
λΔ = ∂∂ λ
GV( )
d0
1
(6)
To determine the difference in the binding free energy ΔΔGbetween two ligands, transformations were performed for boththe complex-bound ligands and the solvated ligands. ΔΔG wasthen calculated as the difference between the respective freeenergies (eq 7).
ΔΔ = Δ − ΔG G Gbound solvated (7)
Pairs of ligands for TI transformations were selected basedon their similarity. For each set of ligands a similarity matrixwas computed employing the TanimotoCombo score ofROCS.52,53 Then, by means of the algorithm of Kruskal,54
those transformations were identified that require overall thesmallest structural changes. For all data sets except the FXa set,transformations between all identified “optimal” pairs ofcompounds were carried out (Table 2). For the FXa set, onlytransformations starting from the compound present in thecrystal complex structure were performed (see below).As all TI calculations for a data set were to be conducted
within the scope of 2 weeks, transformation simulations wererun at four λ values (λ = 0.2, 0.4, 0.6, and 0.8) applying the dualtopology, 1-step softcore approach.7,55 This approach hasrecently been successfully used in an investigation of FXainhibitors.56 As this study reported a mean absolute deviation<1 kJ mol−1 for relative binding free energies determined withthree λ steps versus those determined with nine λ steps andconcluded that it is usually sufficient to consider three λ steps insuch TI calculations, we expected to obtain reasonable relativebinding free energy predictions with four λ steps. However, wenote that the employed number of λ steps is at the lower limit.Thus, we tested whether including additional λ values improvesthe accuracy of the ΔΔG predictions by also performingtransformation simulations at λ = 0.1, 0.3, 0.5, 0.7, and 0.9 forthe 20 ligand transformations with the highest similarity withinthe CDK2 data set.In transformations involving a change in the total ligand
charge, the overall non-neutral systems were not explicitlyneutralized. In these cases a uniform neutralizing plasma,present in periodic boundary particle mesh Ewald simulationsin AMBER, ensured the neutrality of the systems.57 Underthese conditions, no correction for the self-energy, i.e., theenergy caused by the interaction of the charged site with itsown periodic image and with the neutralizing plasma, needs tobe applied. Further effects due to the finite system size havebeen found to be marginal if, as in all our TI simulations, morethan 922 water molecules are present within the periodic box.57
In addition, any inaccuracies caused by changing the net chargeof the system should largely cancel because we calculate onlyrelative binding free energies, and the effect of the chargechange should be similar in the transformation of the ligand inthe bound state and in the transformation of the ligand free insolution.ΔG (eq 6) was computed by numerical integration
employing the calculation approaches with and without linearextrapolation to the end states at λ = 0 and 1 available in thefree energy workflow tool FEW.47 We found that significantlybetter ΔΔG predictions (eq 7) were obtained withoutextrapolation. Likely, this results from the uncertainty in theextrapolation, which generally increases for nonlinear dV/dλcurves with the λ step size. In addition, it has been reported forone-step softcore TI calculations that kinks can appear in the
Journal of Chemical Theory and Computation Article
dx.doi.org/10.1021/ct5000296 | J. Chem. Theory Comput. 2014, 10, 3331−33443334
dV/dλ curve.55 If such kinks occur at the terminal λ steps usedfor the extrapolation this can decrease the accuracy of thebinding free energy predictions further. Consequently, we onlyreport ΔΔG predictions obtained without extrapolation below.A detailed description of the TI simulation procedure is given
in the Supporting Information.Bennett Acceptance Ratio (BAR) and Multistate
Bennett Acceptance Ratio (MBAR) Calculations. Produc-tion simulations were conducted with Sander of AMBER1123 asspecified above for the TI calculations, and potential energies atthe specific λ value as well as potential energies of aconfiguration at all other considered λ values (λ = 0.2, 0.4,0.6, and 0.8) were recorded. The potential energies wereextracted from the Sander output files and converted into theformat required for the BAR calculations using a modifiedversion of the mdout2pymbar.pl script provided withAmberTools12.58 Calculations according to the BAR and theMBAR methods were conducted with the pyMBAR program,version 2.0 beta, of Shirts and Chodera59 obtained fromhttps://simtk.org/home/pymbar and using a temperature ofT = 300 K.Error Estimation. Standard errors of the mean (σMSE) of
computed effective binding energies (ΔGeffective) were calcu-lated according to eq 8
σ =∑ Δ − Δ− = G G
n
( )n i
ni
MSE
11 1 effective, effective
2
(8)
where n is the number of effective binding energies considered,i.e., the number of snapshots taken into account in thecalculation.For LIE the statistical error in ΔGLIE was calculated from the
σMSE of the electrostatic (ele) and van der Waals (vdW) energycontributions of the bound and solvated ligands according to eq9.
σ σ σ σ σ= + + +( )LIE ele,bound2
ele,solvated2
vdW,bound2
vdW,solvated2
(9)
For TI the statistical error in ΔG (eq 6) denoted σΔG wasestimated according to reference,55 and the error in ΔΔG (eq7) denoted σΔΔG was calculated according to eq 10.
σ σ σ= +ΔΔ Δ Δ( )G G G,solvated2
,bound2
(10)
The respectively largest error in ΔGeffective, ΔGLIE, or ΔΔGfound for a data set is denoted as σmax below.Quality Measures. The degree of linear dependence
between experimental and computed binding free energieswas evaluated by Pearson’s correlation coefficient (r2), and thesignificance of the linear correlation was determined from thep-value (p) of a two-tailed Student’s t test. We consider acorrelation with p < 0.05 significant. Both r2 and p werecomputed with the R program.48 As a quality measure for thecorrect relative ranking of ligands by binding free energy, weused the predictive index (PI) of Pearlman.60 The best r2
obtained in a specific analysis is denoted r2max below, and thecorresponding PI is denoted PImax. Bootstrapped 95%confidence intervals for r2max were computed with the boot61
package of R48 performing 10,000 bootstrap replications andemploying bias-corrected, accelerated percentile intervals. Forevaluating the accuracy of the computed ΔΔG values we usedthe root-mean-square deviation (RMSD) computed accordingto eq 11
∑= ΔΔ − ΔΔn
G GRMSD1
( )experiment calculated2
(11)
where n is the number of ligands in a data set, and ΔΔGexperimentwas calculated from ΔΔG = −RT ln(IC50
ligand 1 / IC50ligand 2)
with T = 300 K. Detailed listings of all computed qualitymeasures are provided in the Supporting Information.
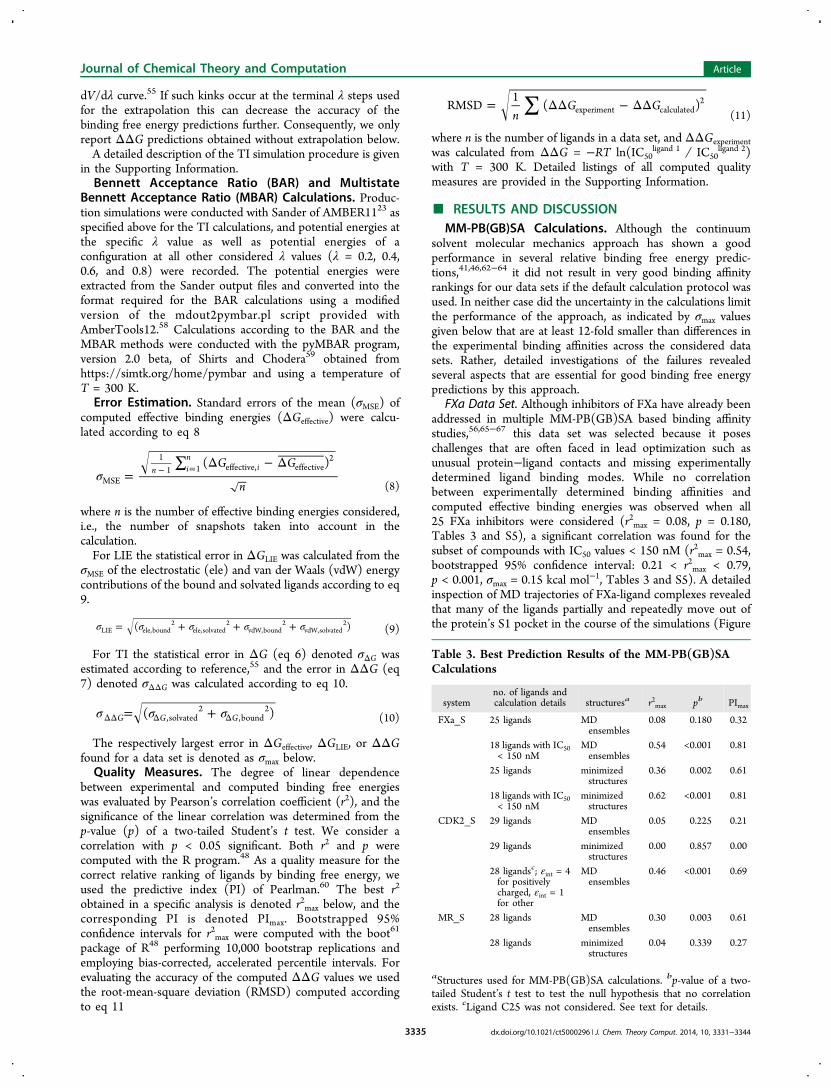
■ RESULTS AND DISCUSSIONMM-PB(GB)SA Calculations. Although the continuum
solvent molecular mechanics approach has shown a goodperformance in several relative binding free energy predic-tions,41,46,62−64 it did not result in very good binding affinityrankings for our data sets if the default calculation protocol wasused. In neither case did the uncertainty in the calculations limitthe performance of the approach, as indicated by σmax valuesgiven below that are at least 12-fold smaller than differences inthe experimental binding affinities across the considered datasets. Rather, detailed investigations of the failures revealedseveral aspects that are essential for good binding free energypredictions by this approach.
FXa Data Set. Although inhibitors of FXa have already beenaddressed in multiple MM-PB(GB)SA based binding affinitystudies,56,65−67 this data set was selected because it poseschallenges that are often faced in lead optimization such asunusual protein−ligand contacts and missing experimentallydetermined ligand binding modes. While no correlationbetween experimentally determined binding affinities andcomputed effective binding energies was observed when all25 FXa inhibitors were considered (r2max = 0.08, p = 0.180,Tables 3 and S5), a significant correlation was found for thesubset of compounds with IC50 values < 150 nM (r2max = 0.54,bootstrapped 95% confidence interval: 0.21 < r2max < 0.79,p < 0.001, σmax = 0.15 kcal mol−1, Tables 3 and S5). A detailedinspection of MD trajectories of FXa-ligand complexes revealedthat many of the ligands partially and repeatedly move out ofthe protein’s S1 pocket in the course of the simulations (Figure
Table 3. Best Prediction Results of the MM-PB(GB)SACalculations
systemno. of ligands andcalculation details structuresa r2max pb PImax
FXa_S 25 ligands MDensembles
0.08 0.180 0.32
18 ligands with IC50< 150 nM
MDensembles
0.54 <0.001 0.81
25 ligands minimizedstructures
0.36 0.002 0.61
18 ligands with IC50< 150 nM
minimizedstructures
0.62 <0.001 0.81
CDK2_S 29 ligands MDensembles
0.05 0.225 0.21
29 ligands minimizedstructures
0.00 0.857 0.00
28 ligandsc; εint = 4for positivelycharged, εint = 1for other
MDensembles
0.46 <0.001 0.69
MR_S 28 ligands MDensembles
0.30 0.003 0.61
28 ligands minimizedstructures
0.04 0.339 0.27
aStructures used for MM-PB(GB)SA calculations. bp-value of a two-tailed Student’s t test to test the null hypothesis that no correlationexists. cLigand C25 was not considered. See text for details.
Journal of Chemical Theory and Computation Article
dx.doi.org/10.1021/ct5000296 | J. Chem. Theory Comput. 2014, 10, 3331−33443335
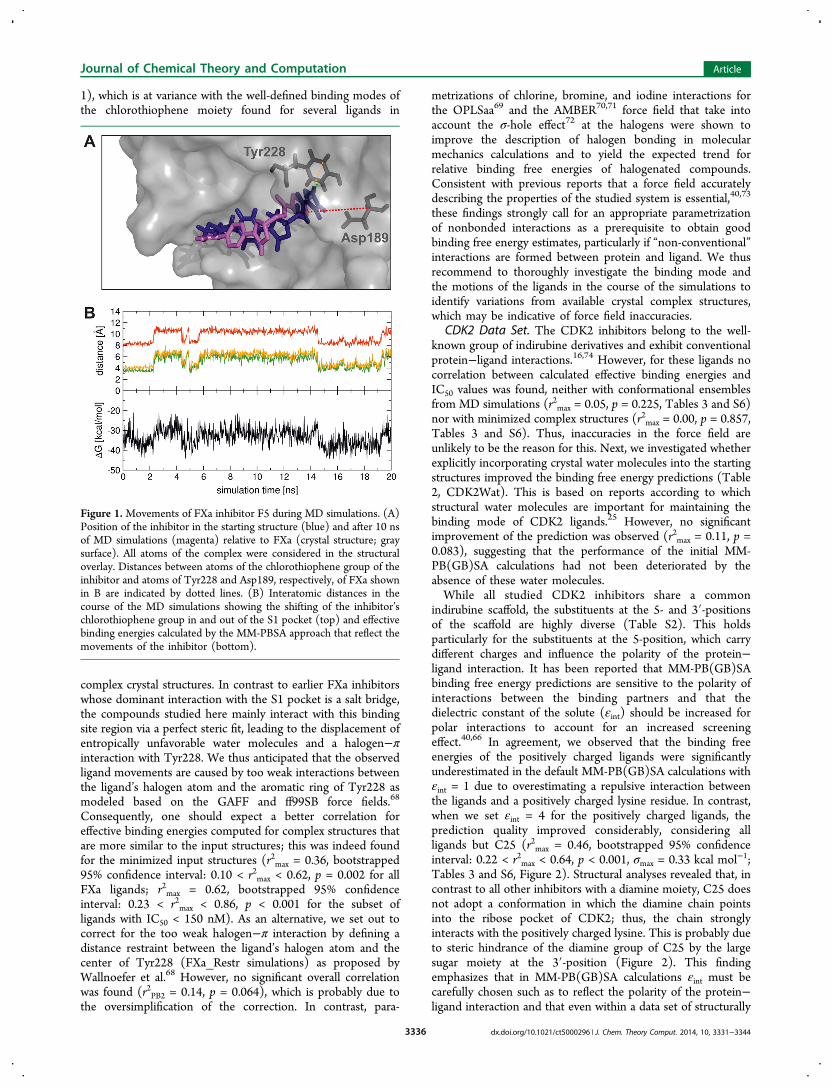
1), which is at variance with the well-defined binding modes ofthe chlorothiophene moiety found for several ligands in
complex crystal structures. In contrast to earlier FXa inhibitorswhose dominant interaction with the S1 pocket is a salt bridge,the compounds studied here mainly interact with this bindingsite region via a perfect steric fit, leading to the displacement ofentropically unfavorable water molecules and a halogen−πinteraction with Tyr228. We thus anticipated that the observedligand movements are caused by too weak interactions betweenthe ligand’s halogen atom and the aromatic ring of Tyr228 asmodeled based on the GAFF and ff99SB force fields.68
Consequently, one should expect a better correlation foreffective binding energies computed for complex structures thatare more similar to the input structures; this was indeed foundfor the minimized input structures (r2max = 0.36, bootstrapped95% confidence interval: 0.10 < r2max < 0.62, p = 0.002 for allFXa ligands; r2max = 0.62, bootstrapped 95% confidenceinterval: 0.23 < r2max < 0.86, p < 0.001 for the subset ofligands with IC50 < 150 nM). As an alternative, we set out tocorrect for the too weak halogen−π interaction by defining adistance restraint between the ligand’s halogen atom and thecenter of Tyr228 (FXa_Restr simulations) as proposed byWallnoefer et al.68 However, no significant overall correlationwas found (r2PB2 = 0.14, p = 0.064), which is probably due tothe oversimplification of the correction. In contrast, para-
metrizations of chlorine, bromine, and iodine interactions forthe OPLSaa69 and the AMBER70,71 force field that take intoaccount the σ-hole effect72 at the halogens were shown toimprove the description of halogen bonding in molecularmechanics calculations and to yield the expected trend forrelative binding free energies of halogenated compounds.Consistent with previous reports that a force field accuratelydescribing the properties of the studied system is essential,40,73
these findings strongly call for an appropriate parametrizationof nonbonded interactions as a prerequisite to obtain goodbinding free energy estimates, particularly if “non-conventional”interactions are formed between protein and ligand. We thusrecommend to thoroughly investigate the binding mode andthe motions of the ligands in the course of the simulations toidentify variations from available crystal complex structures,which may be indicative of force field inaccuracies.
CDK2 Data Set. The CDK2 inhibitors belong to the well-known group of indirubine derivatives and exhibit conventionalprotein−ligand interactions.16,74 However, for these ligands nocorrelation between calculated effective binding energies andIC50 values was found, neither with conformational ensemblesfrom MD simulations (r2max = 0.05, p = 0.225, Tables 3 and S6)nor with minimized complex structures (r2max = 0.00, p = 0.857,Tables 3 and S6). Thus, inaccuracies in the force field areunlikely to be the reason for this. Next, we investigated whetherexplicitly incorporating crystal water molecules into the startingstructures improved the binding free energy predictions (Table2, CDK2Wat). This is based on reports according to whichstructural water molecules are important for maintaining thebinding mode of CDK2 ligands.25 However, no significantimprovement of the prediction was observed (r2max = 0.11, p =0.083), suggesting that the performance of the initial MM-PB(GB)SA calculations had not been deteriorated by theabsence of these water molecules.While all studied CDK2 inhibitors share a common
indirubine scaffold, the substituents at the 5- and 3′-positionsof the scaffold are highly diverse (Table S2). This holdsparticularly for the substituents at the 5-position, which carrydifferent charges and influence the polarity of the protein−ligand interaction. It has been reported that MM-PB(GB)SAbinding free energy predictions are sensitive to the polarity ofinteractions between the binding partners and that thedielectric constant of the solute (εint) should be increased forpolar interactions to account for an increased screeningeffect.40,66 In agreement, we observed that the binding freeenergies of the positively charged ligands were significantlyunderestimated in the default MM-PB(GB)SA calculations withεint = 1 due to overestimating a repulsive interaction betweenthe ligands and a positively charged lysine residue. In contrast,when we set εint = 4 for the positively charged ligands, theprediction quality improved considerably, considering allligands but C25 (r2max = 0.46, bootstrapped 95% confidenceinterval: 0.22 < r2max < 0.64, p < 0.001, σmax = 0.33 kcal mol−1;Tables 3 and S6, Figure 2). Structural analyses revealed that, incontrast to all other inhibitors with a diamine moiety, C25 doesnot adopt a conformation in which the diamine chain pointsinto the ribose pocket of CDK2; thus, the chain stronglyinteracts with the positively charged lysine. This is probably dueto steric hindrance of the diamine group of C25 by the largesugar moiety at the 3′-position (Figure 2). This findingemphasizes that in MM-PB(GB)SA calculations εint must becarefully chosen such as to reflect the polarity of the protein−ligand interaction and that even within a data set of structurally
Figure 1. Movements of FXa inhibitor F5 during MD simulations. (A)Position of the inhibitor in the starting structure (blue) and after 10 nsof MD simulations (magenta) relative to FXa (crystal structure; graysurface). All atoms of the complex were considered in the structuraloverlay. Distances between atoms of the chlorothiophene group of theinhibitor and atoms of Tyr228 and Asp189, respectively, of FXa shownin B are indicated by dotted lines. (B) Interatomic distances in thecourse of the MD simulations showing the shifting of the inhibitor’schlorothiophene group in and out of the S1 pocket (top) and effectivebinding energies calculated by the MM-PBSA approach that reflect themovements of the inhibitor (bottom).
Journal of Chemical Theory and Computation Article
dx.doi.org/10.1021/ct5000296 | J. Chem. Theory Comput. 2014, 10, 3331−33443336
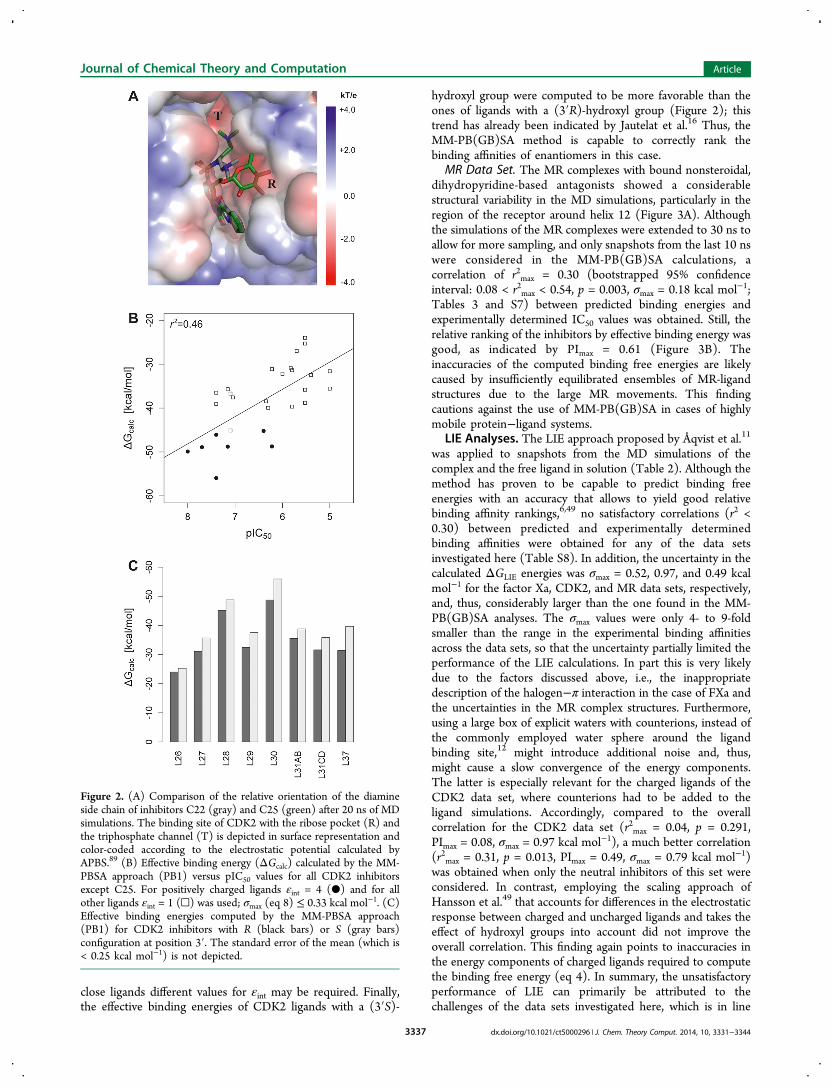
close ligands different values for εint may be required. Finally,the effective binding energies of CDK2 ligands with a (3′S)-
hydroxyl group were computed to be more favorable than theones of ligands with a (3′R)-hydroxyl group (Figure 2); thistrend has already been indicated by Jautelat et al.16 Thus, theMM-PB(GB)SA method is capable to correctly rank thebinding affinities of enantiomers in this case.
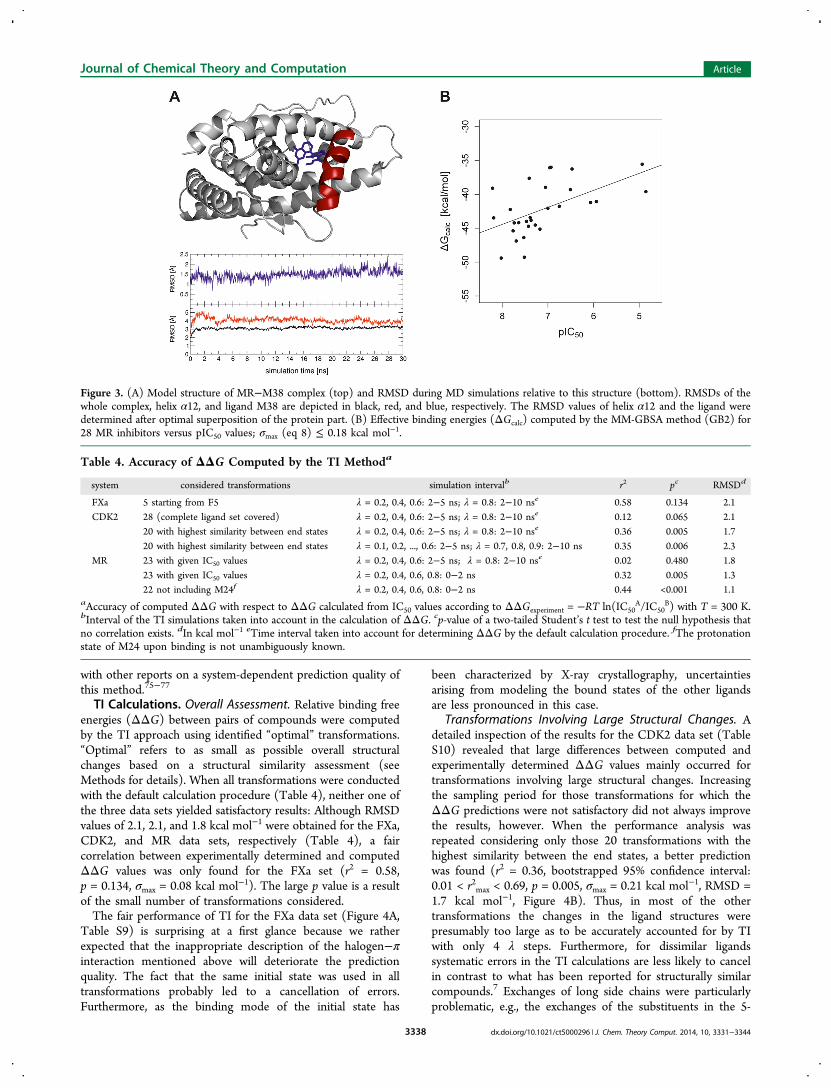
MR Data Set. The MR complexes with bound nonsteroidal,dihydropyridine-based antagonists showed a considerablestructural variability in the MD simulations, particularly in theregion of the receptor around helix 12 (Figure 3A). Althoughthe simulations of the MR complexes were extended to 30 ns toallow for more sampling, and only snapshots from the last 10 nswere considered in the MM-PB(GB)SA calculations, acorrelation of r2max = 0.30 (bootstrapped 95% confidenceinterval: 0.08 < r2max < 0.54, p = 0.003, σmax = 0.18 kcal mol−1;Tables 3 and S7) between predicted binding energies andexperimentally determined IC50 values was obtained. Still, therelative ranking of the inhibitors by effective binding energy wasgood, as indicated by PImax = 0.61 (Figure 3B). Theinaccuracies of the computed binding free energies are likelycaused by insufficiently equilibrated ensembles of MR-ligandstructures due to the large MR movements. This findingcautions against the use of MM-PB(GB)SA in cases of highlymobile protein−ligand systems.
LIE Analyses. The LIE approach proposed by Åqvist et al.11
was applied to snapshots from the MD simulations of thecomplex and the free ligand in solution (Table 2). Although themethod has proven to be capable to predict binding freeenergies with an accuracy that allows to yield good relativebinding affinity rankings,6,49 no satisfactory correlations (r2 <0.30) between predicted and experimentally determinedbinding affinities were obtained for any of the data setsinvestigated here (Table S8). In addition, the uncertainty in thecalculated ΔGLIE energies was σmax = 0.52, 0.97, and 0.49 kcalmol−1 for the factor Xa, CDK2, and MR data sets, respectively,and, thus, considerably larger than the one found in the MM-PB(GB)SA analyses. The σmax values were only 4- to 9-foldsmaller than the range in the experimental binding affinitiesacross the data sets, so that the uncertainty partially limited theperformance of the LIE calculations. In part this is very likelydue to the factors discussed above, i.e., the inappropriatedescription of the halogen−π interaction in the case of FXa andthe uncertainties in the MR complex structures. Furthermore,using a large box of explicit waters with counterions, instead ofthe commonly employed water sphere around the ligandbinding site,12 might introduce additional noise and, thus,might cause a slow convergence of the energy components.The latter is especially relevant for the charged ligands of theCDK2 data set, where counterions had to be added to theligand simulations. Accordingly, compared to the overallcorrelation for the CDK2 data set (r2max = 0.04, p = 0.291,PImax = 0.08, σmax = 0.97 kcal mol−1), a much better correlation(r2max = 0.31, p = 0.013, PImax = 0.49, σmax = 0.79 kcal mol−1)was obtained when only the neutral inhibitors of this set wereconsidered. In contrast, employing the scaling approach ofHansson et al.49 that accounts for differences in the electrostaticresponse between charged and uncharged ligands and takes theeffect of hydroxyl groups into account did not improve theoverall correlation. This finding again points to inaccuracies inthe energy components of charged ligands required to computethe binding free energy (eq 4). In summary, the unsatisfactoryperformance of LIE can primarily be attributed to thechallenges of the data sets investigated here, which is in line
Figure 2. (A) Comparison of the relative orientation of the diamineside chain of inhibitors C22 (gray) and C25 (green) after 20 ns of MDsimulations. The binding site of CDK2 with the ribose pocket (R) andthe triphosphate channel (T) is depicted in surface representation andcolor-coded according to the electrostatic potential calculated byAPBS.89 (B) Effective binding energy (ΔGcalc) calculated by the MM-PBSA approach (PB1) versus pIC50 values for all CDK2 inhibitorsexcept C25. For positively charged ligands εint = 4 (●) and for allother ligands εint = 1 (□) was used; σmax (eq 8) ≤ 0.33 kcal mol−1. (C)Effective binding energies computed by the MM-PBSA approach(PB1) for CDK2 inhibitors with R (black bars) or S (gray bars)configuration at position 3′. The standard error of the mean (which is< 0.25 kcal mol−1) is not depicted.
Journal of Chemical Theory and Computation Article
dx.doi.org/10.1021/ct5000296 | J. Chem. Theory Comput. 2014, 10, 3331−33443337
with other reports on a system-dependent prediction quality ofthis method.75−77
TI Calculations. Overall Assessment. Relative binding freeenergies (ΔΔG) between pairs of compounds were computedby the TI approach using identified “optimal” transformations.“Optimal” refers to as small as possible overall structuralchanges based on a structural similarity assessment (seeMethods for details). When all transformations were conductedwith the default calculation procedure (Table 4), neither one ofthe three data sets yielded satisfactory results: Although RMSDvalues of 2.1, 2.1, and 1.8 kcal mol−1 were obtained for the FXa,CDK2, and MR data sets, respectively (Table 4), a faircorrelation between experimentally determined and computedΔΔG values was only found for the FXa set (r2 = 0.58,p = 0.134, σmax = 0.08 kcal mol−1). The large p value is a resultof the small number of transformations considered.The fair performance of TI for the FXa data set (Figure 4A,
Table S9) is surprising at a first glance because we ratherexpected that the inappropriate description of the halogen−πinteraction mentioned above will deteriorate the predictionquality. The fact that the same initial state was used in alltransformations probably led to a cancellation of errors.Furthermore, as the binding mode of the initial state has
been characterized by X-ray crystallography, uncertaintiesarising from modeling the bound states of the other ligandsare less pronounced in this case.
Transformations Involving Large Structural Changes. Adetailed inspection of the results for the CDK2 data set (TableS10) revealed that large differences between computed andexperimentally determined ΔΔG values mainly occurred fortransformations involving large structural changes. Increasingthe sampling period for those transformations for which theΔΔG predictions were not satisfactory did not always improvethe results, however. When the performance analysis wasrepeated considering only those 20 transformations with thehighest similarity between the end states, a better predictionwas found (r2 = 0.36, bootstrapped 95% confidence interval:0.01 < r2max < 0.69, p = 0.005, σmax = 0.21 kcal mol−1, RMSD =1.7 kcal mol−1, Figure 4B). Thus, in most of the othertransformations the changes in the ligand structures werepresumably too large as to be accurately accounted for by TIwith only 4 λ steps. Furthermore, for dissimilar ligandssystematic errors in the TI calculations are less likely to cancelin contrast to what has been reported for structurally similarcompounds.7 Exchanges of long side chains were particularlyproblematic, e.g., the exchanges of the substituents in the 5-
Figure 3. (A) Model structure of MR−M38 complex (top) and RMSD during MD simulations relative to this structure (bottom). RMSDs of thewhole complex, helix α12, and ligand M38 are depicted in black, red, and blue, respectively. The RMSD values of helix α12 and the ligand weredetermined after optimal superposition of the protein part. (B) Effective binding energies (ΔGcalc) computed by the MM-GBSA method (GB2) for28 MR inhibitors versus pIC50 values; σmax (eq 8) ≤ 0.18 kcal mol−1.
Table 4. Accuracy of ΔΔG Computed by the TI Methoda
system considered transformations simulation intervalb r2 pc RMSDd
FXa 5 starting from F5 λ = 0.2, 0.4, 0.6: 2−5 ns; λ = 0.8: 2−10 nse 0.58 0.134 2.1CDK2 28 (complete ligand set covered) λ = 0.2, 0.4, 0.6: 2−5 ns; λ = 0.8: 2−10 nse 0.12 0.065 2.1
20 with highest similarity between end states λ = 0.2, 0.4, 0.6: 2−5 ns; λ = 0.8: 2−10 nse 0.36 0.005 1.720 with highest similarity between end states λ = 0.1, 0.2, ..., 0.6: 2−5 ns; λ = 0.7, 0.8, 0.9: 2−10 ns 0.35 0.006 2.3
MR 23 with given IC50 values λ = 0.2, 0.4, 0.6: 2−5 ns; λ = 0.8: 2−10 nse 0.02 0.480 1.823 with given IC50 values λ = 0.2, 0.4, 0.6, 0.8: 0−2 ns 0.32 0.005 1.322 not including M24f λ = 0.2, 0.4, 0.6, 0.8: 0−2 ns 0.44 <0.001 1.1
aAccuracy of computed ΔΔG with respect to ΔΔG calculated from IC50 values according to ΔΔGexperiment = −RT ln(IC50A/IC50
B) with T = 300 K.bInterval of the TI simulations taken into account in the calculation of ΔΔG. cp-value of a two-tailed Student’s t test to test the null hypothesis thatno correlation exists. dIn kcal mol−1 eTime interval taken into account for determining ΔΔG by the default calculation procedure. fThe protonationstate of M24 upon binding is not unambiguously known.
Journal of Chemical Theory and Computation Article
dx.doi.org/10.1021/ct5000296 | J. Chem. Theory Comput. 2014, 10, 3331−33443338
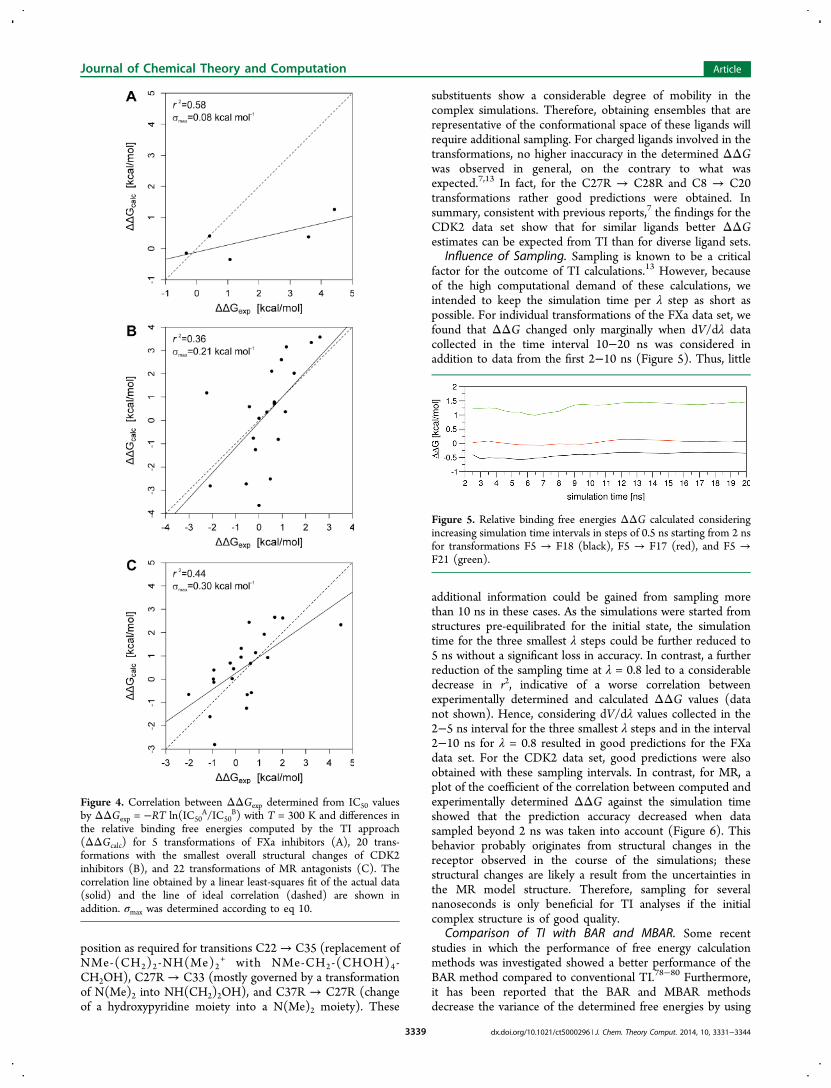
position as required for transitions C22→ C35 (replacement ofNMe-(CH2)2-NH(Me)2
+ with NMe-CH2-(CHOH)4-CH2OH), C27R → C33 (mostly governed by a transformationof N(Me)2 into NH(CH2)2OH), and C37R → C27R (changeof a hydroxypyridine moiety into a N(Me)2 moiety). These
substituents show a considerable degree of mobility in thecomplex simulations. Therefore, obtaining ensembles that arerepresentative of the conformational space of these ligands willrequire additional sampling. For charged ligands involved in thetransformations, no higher inaccuracy in the determined ΔΔGwas observed in general, on the contrary to what wasexpected.7,13 In fact, for the C27R → C28R and C8 → C20transformations rather good predictions were obtained. Insummary, consistent with previous reports,7 the findings for theCDK2 data set show that for similar ligands better ΔΔGestimates can be expected from TI than for diverse ligand sets.
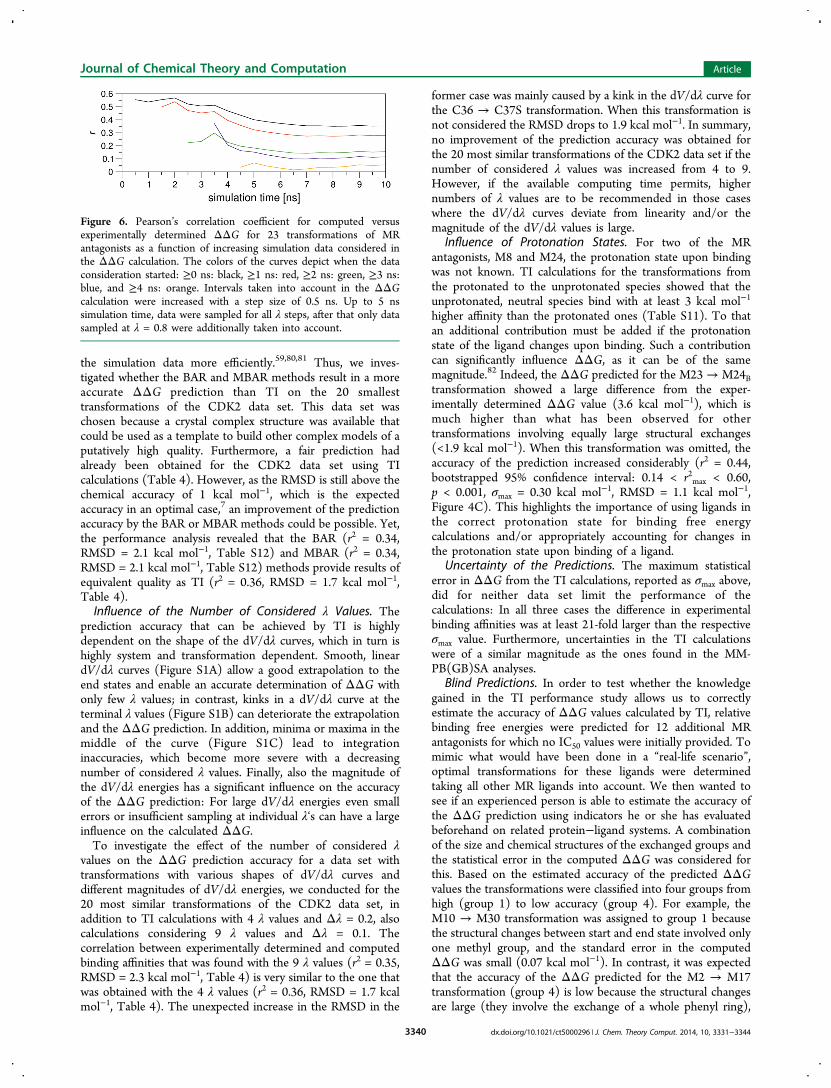
Influence of Sampling. Sampling is known to be a criticalfactor for the outcome of TI calculations.13 However, becauseof the high computational demand of these calculations, weintended to keep the simulation time per λ step as short aspossible. For individual transformations of the FXa data set, wefound that ΔΔG changed only marginally when dV/dλ datacollected in the time interval 10−20 ns was considered inaddition to data from the first 2−10 ns (Figure 5). Thus, little
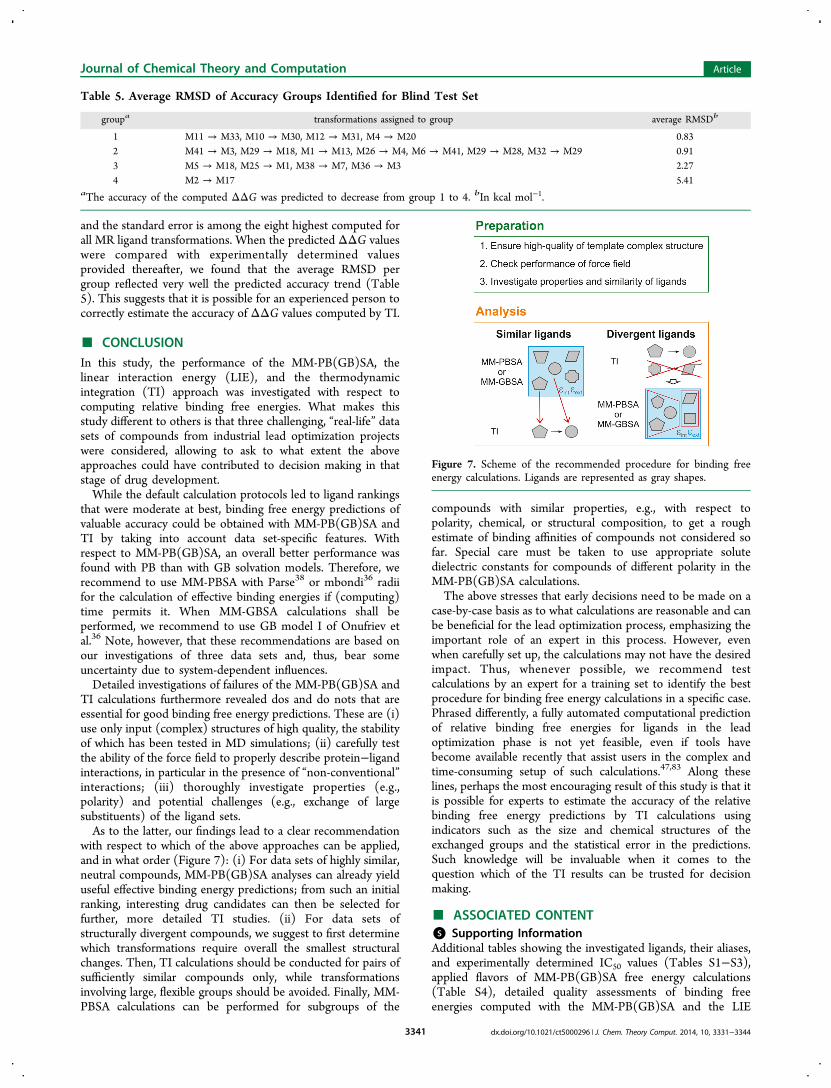
additional information could be gained from sampling morethan 10 ns in these cases. As the simulations were started fromstructures pre-equilibrated for the initial state, the simulationtime for the three smallest λ steps could be further reduced to5 ns without a significant loss in accuracy. In contrast, a furtherreduction of the sampling time at λ = 0.8 led to a considerabledecrease in r2, indicative of a worse correlation betweenexperimentally determined and calculated ΔΔG values (datanot shown). Hence, considering dV/dλ values collected in the2−5 ns interval for the three smallest λ steps and in the interval2−10 ns for λ = 0.8 resulted in good predictions for the FXadata set. For the CDK2 data set, good predictions were alsoobtained with these sampling intervals. In contrast, for MR, aplot of the coefficient of the correlation between computed andexperimentally determined ΔΔG against the simulation timeshowed that the prediction accuracy decreased when datasampled beyond 2 ns was taken into account (Figure 6). Thisbehavior probably originates from structural changes in thereceptor observed in the course of the simulations; thesestructural changes are likely a result from the uncertainties inthe MR model structure. Therefore, sampling for severalnanoseconds is only beneficial for TI analyses if the initialcomplex structure is of good quality.
Comparison of TI with BAR and MBAR. Some recentstudies in which the performance of free energy calculationmethods was investigated showed a better performance of theBAR method compared to conventional TI.78−80 Furthermore,it has been reported that the BAR and MBAR methodsdecrease the variance of the determined free energies by using
Figure 4. Correlation between ΔΔGexp determined from IC50 valuesby ΔΔGexp = −RT ln(IC50
A/IC50B) with T = 300 K and differences in
the relative binding free energies computed by the TI approach(ΔΔGcalc) for 5 transformations of FXa inhibitors (A), 20 trans-formations with the smallest overall structural changes of CDK2inhibitors (B), and 22 transformations of MR antagonists (C). Thecorrelation line obtained by a linear least-squares fit of the actual data(solid) and the line of ideal correlation (dashed) are shown inaddition. σmax was determined according to eq 10.
Figure 5. Relative binding free energies ΔΔG calculated consideringincreasing simulation time intervals in steps of 0.5 ns starting from 2 nsfor transformations F5 → F18 (black), F5 → F17 (red), and F5 →F21 (green).
Journal of Chemical Theory and Computation Article
dx.doi.org/10.1021/ct5000296 | J. Chem. Theory Comput. 2014, 10, 3331−33443339
the simulation data more efficiently.59,80,81 Thus, we inves-tigated whether the BAR and MBAR methods result in a moreaccurate ΔΔG prediction than TI on the 20 smallesttransformations of the CDK2 data set. This data set waschosen because a crystal complex structure was available thatcould be used as a template to build other complex models of aputatively high quality. Furthermore, a fair prediction hadalready been obtained for the CDK2 data set using TIcalculations (Table 4). However, as the RMSD is still above thechemical accuracy of 1 kcal mol−1, which is the expectedaccuracy in an optimal case,7 an improvement of the predictionaccuracy by the BAR or MBAR methods could be possible. Yet,the performance analysis revealed that the BAR (r2 = 0.34,RMSD = 2.1 kcal mol−1, Table S12) and MBAR (r2 = 0.34,RMSD = 2.1 kcal mol−1, Table S12) methods provide results ofequivalent quality as TI (r2 = 0.36, RMSD = 1.7 kcal mol−1,Table 4).Influence of the Number of Considered λ Values. The
prediction accuracy that can be achieved by TI is highlydependent on the shape of the dV/dλ curves, which in turn ishighly system and transformation dependent. Smooth, lineardV/dλ curves (Figure S1A) allow a good extrapolation to theend states and enable an accurate determination of ΔΔG withonly few λ values; in contrast, kinks in a dV/dλ curve at theterminal λ values (Figure S1B) can deteriorate the extrapolationand the ΔΔG prediction. In addition, minima or maxima in themiddle of the curve (Figure S1C) lead to integrationinaccuracies, which become more severe with a decreasingnumber of considered λ values. Finally, also the magnitude ofthe dV/dλ energies has a significant influence on the accuracyof the ΔΔG prediction: For large dV/dλ energies even smallerrors or insufficient sampling at individual λ‘s can have a largeinfluence on the calculated ΔΔG.To investigate the effect of the number of considered λ
values on the ΔΔG prediction accuracy for a data set withtransformations with various shapes of dV/dλ curves anddifferent magnitudes of dV/dλ energies, we conducted for the20 most similar transformations of the CDK2 data set, inaddition to TI calculations with 4 λ values and Δλ = 0.2, alsocalculations considering 9 λ values and Δλ = 0.1. Thecorrelation between experimentally determined and computedbinding affinities that was found with the 9 λ values (r2 = 0.35,RMSD = 2.3 kcal mol−1, Table 4) is very similar to the one thatwas obtained with the 4 λ values (r2 = 0.36, RMSD = 1.7 kcalmol−1, Table 4). The unexpected increase in the RMSD in the
former case was mainly caused by a kink in the dV/dλ curve forthe C36 → C37S transformation. When this transformation isnot considered the RMSD drops to 1.9 kcal mol−1. In summary,no improvement of the prediction accuracy was obtained forthe 20 most similar transformations of the CDK2 data set if thenumber of considered λ values was increased from 4 to 9.However, if the available computing time permits, highernumbers of λ values are to be recommended in those caseswhere the dV/dλ curves deviate from linearity and/or themagnitude of the dV/dλ values is large.
Influence of Protonation States. For two of the MRantagonists, M8 and M24, the protonation state upon bindingwas not known. TI calculations for the transformations fromthe protonated to the unprotonated species showed that theunprotonated, neutral species bind with at least 3 kcal mol−1
higher affinity than the protonated ones (Table S11). To thatan additional contribution must be added if the protonationstate of the ligand changes upon binding. Such a contributioncan significantly influence ΔΔG, as it can be of the samemagnitude.82 Indeed, the ΔΔG predicted for the M23 → M24Btransformation showed a large difference from the exper-imentally determined ΔΔG value (3.6 kcal mol−1), which ismuch higher than what has been observed for othertransformations involving equally large structural exchanges(<1.9 kcal mol−1). When this transformation was omitted, theaccuracy of the prediction increased considerably (r2 = 0.44,bootstrapped 95% confidence interval: 0.14 < r2max < 0.60,p < 0.001, σmax = 0.30 kcal mol−1, RMSD = 1.1 kcal mol−1,Figure 4C). This highlights the importance of using ligands inthe correct protonation state for binding free energycalculations and/or appropriately accounting for changes inthe protonation state upon binding of a ligand.
Uncertainty of the Predictions. The maximum statisticalerror in ΔΔG from the TI calculations, reported as σmax above,did for neither data set limit the performance of thecalculations: In all three cases the difference in experimentalbinding affinities was at least 21-fold larger than the respectiveσmax value. Furthermore, uncertainties in the TI calculationswere of a similar magnitude as the ones found in the MM-PB(GB)SA analyses.
Blind Predictions. In order to test whether the knowledgegained in the TI performance study allows us to correctlyestimate the accuracy of ΔΔG values calculated by TI, relativebinding free energies were predicted for 12 additional MRantagonists for which no IC50 values were initially provided. Tomimic what would have been done in a “real-life scenario”,optimal transformations for these ligands were determinedtaking all other MR ligands into account. We then wanted tosee if an experienced person is able to estimate the accuracy ofthe ΔΔG prediction using indicators he or she has evaluatedbeforehand on related protein−ligand systems. A combinationof the size and chemical structures of the exchanged groups andthe statistical error in the computed ΔΔG was considered forthis. Based on the estimated accuracy of the predicted ΔΔGvalues the transformations were classified into four groups fromhigh (group 1) to low accuracy (group 4). For example, theM10 → M30 transformation was assigned to group 1 becausethe structural changes between start and end state involved onlyone methyl group, and the standard error in the computedΔΔG was small (0.07 kcal mol−1). In contrast, it was expectedthat the accuracy of the ΔΔG predicted for the M2 → M17transformation (group 4) is low because the structural changesare large (they involve the exchange of a whole phenyl ring),
Figure 6. Pearson’s correlation coefficient for computed versusexperimentally determined ΔΔG for 23 transformations of MRantagonists as a function of increasing simulation data considered inthe ΔΔG calculation. The colors of the curves depict when the dataconsideration started: ≥0 ns: black, ≥1 ns: red, ≥2 ns: green, ≥3 ns:blue, and ≥4 ns: orange. Intervals taken into account in the ΔΔGcalculation were increased with a step size of 0.5 ns. Up to 5 nssimulation time, data were sampled for all λ steps, after that only datasampled at λ = 0.8 were additionally taken into account.
Journal of Chemical Theory and Computation Article
dx.doi.org/10.1021/ct5000296 | J. Chem. Theory Comput. 2014, 10, 3331−33443340
and the standard error is among the eight highest computed forall MR ligand transformations. When the predicted ΔΔG valueswere compared with experimentally determined valuesprovided thereafter, we found that the average RMSD pergroup reflected very well the predicted accuracy trend (Table5). This suggests that it is possible for an experienced person tocorrectly estimate the accuracy of ΔΔG values computed by TI.
■ CONCLUSIONIn this study, the performance of the MM-PB(GB)SA, thelinear interaction energy (LIE), and the thermodynamicintegration (TI) approach was investigated with respect tocomputing relative binding free energies. What makes thisstudy different to others is that three challenging, “real-life” datasets of compounds from industrial lead optimization projectswere considered, allowing to ask to what extent the aboveapproaches could have contributed to decision making in thatstage of drug development.While the default calculation protocols led to ligand rankings
that were moderate at best, binding free energy predictions ofvaluable accuracy could be obtained with MM-PB(GB)SA andTI by taking into account data set-specific features. Withrespect to MM-PB(GB)SA, an overall better performance wasfound with PB than with GB solvation models. Therefore, werecommend to use MM-PBSA with Parse38 or mbondi36 radiifor the calculation of effective binding energies if (computing)time permits it. When MM-GBSA calculations shall beperformed, we recommend to use GB model I of Onufriev etal.36 Note, however, that these recommendations are based onour investigations of three data sets and, thus, bear someuncertainty due to system-dependent influences.Detailed investigations of failures of the MM-PB(GB)SA and
TI calculations furthermore revealed dos and do nots that areessential for good binding free energy predictions. These are (i)use only input (complex) structures of high quality, the stabilityof which has been tested in MD simulations; (ii) carefully testthe ability of the force field to properly describe protein−ligandinteractions, in particular in the presence of “non-conventional”interactions; (iii) thoroughly investigate properties (e.g.,polarity) and potential challenges (e.g., exchange of largesubstituents) of the ligand sets.As to the latter, our findings lead to a clear recommendation
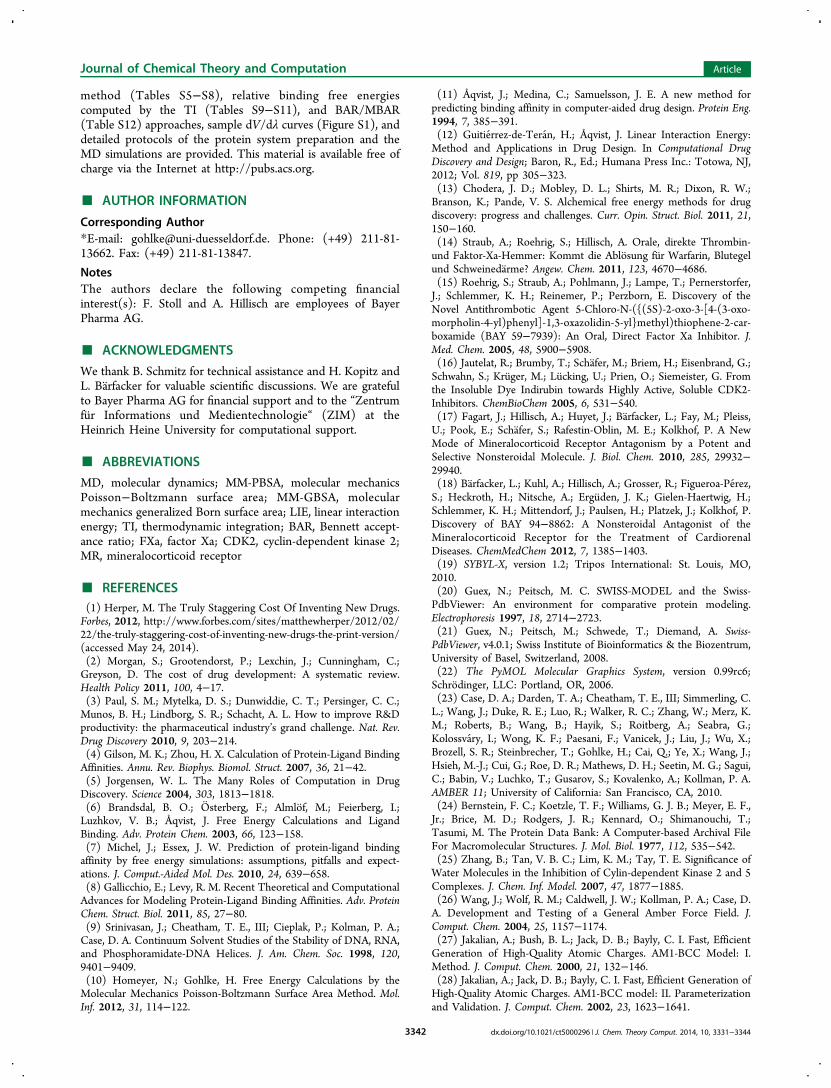
with respect to which of the above approaches can be applied,and in what order (Figure 7): (i) For data sets of highly similar,neutral compounds, MM-PB(GB)SA analyses can already yielduseful effective binding energy predictions; from such an initialranking, interesting drug candidates can then be selected forfurther, more detailed TI studies. (ii) For data sets ofstructurally divergent compounds, we suggest to first determinewhich transformations require overall the smallest structuralchanges. Then, TI calculations should be conducted for pairs ofsufficiently similar compounds only, while transformationsinvolving large, flexible groups should be avoided. Finally, MM-PBSA calculations can be performed for subgroups of the
compounds with similar properties, e.g., with respect topolarity, chemical, or structural composition, to get a roughestimate of binding affinities of compounds not considered sofar. Special care must be taken to use appropriate solutedielectric constants for compounds of different polarity in theMM-PB(GB)SA calculations.The above stresses that early decisions need to be made on a
case-by-case basis as to what calculations are reasonable and canbe beneficial for the lead optimization process, emphasizing theimportant role of an expert in this process. However, evenwhen carefully set up, the calculations may not have the desiredimpact. Thus, whenever possible, we recommend testcalculations by an expert for a training set to identify the bestprocedure for binding free energy calculations in a specific case.Phrased differently, a fully automated computational predictionof relative binding free energies for ligands in the leadoptimization phase is not yet feasible, even if tools havebecome available recently that assist users in the complex andtime-consuming setup of such calculations.47,83 Along theselines, perhaps the most encouraging result of this study is that itis possible for experts to estimate the accuracy of the relativebinding free energy predictions by TI calculations usingindicators such as the size and chemical structures of theexchanged groups and the statistical error in the predictions.Such knowledge will be invaluable when it comes to thequestion which of the TI results can be trusted for decisionmaking.
■ ASSOCIATED CONTENT*S Supporting InformationAdditional tables showing the investigated ligands, their aliases,and experimentally determined IC50 values (Tables S1−S3),applied flavors of MM-PB(GB)SA free energy calculations(Table S4), detailed quality assessments of binding freeenergies computed with the MM-PB(GB)SA and the LIE
Table 5. Average RMSD of Accuracy Groups Identified for Blind Test Set
groupa transformations assigned to group average RMSDb
1 M11 → M33, M10 → M30, M12 → M31, M4 → M20 0.832 M41 → M3, M29 → M18, M1 → M13, M26 → M4, M6 → M41, M29 → M28, M32 → M29 0.913 M5 → M18, M25 → M1, M38 → M7, M36 → M3 2.274 M2 → M17 5.41
aThe accuracy of the computed ΔΔG was predicted to decrease from group 1 to 4. bIn kcal mol−1.
Figure 7. Scheme of the recommended procedure for binding freeenergy calculations. Ligands are represented as gray shapes.
Journal of Chemical Theory and Computation Article
dx.doi.org/10.1021/ct5000296 | J. Chem. Theory Comput. 2014, 10, 3331−33443341
method (Tables S5−S8), relative binding free energiescomputed by the TI (Tables S9−S11), and BAR/MBAR(Table S12) approaches, sample dV/dλ curves (Figure S1), anddetailed protocols of the protein system preparation and theMD simulations are provided. This material is available free ofcharge via the Internet at http://pubs.acs.org.
■ AUTHOR INFORMATION
Corresponding Author*E-mail: [email protected]. Phone: (+49) 211-81-13662. Fax: (+49) 211-81-13847.
NotesThe authors declare the following competing financialinterest(s): F. Stoll and A. Hillisch are employees of BayerPharma AG.
■ ACKNOWLEDGMENTS
We thank B. Schmitz for technical assistance and H. Kopitz andL. Barfacker for valuable scientific discussions. We are gratefulto Bayer Pharma AG for financial support and to the “Zentrumfur Informations und Medientechnologie“ (ZIM) at theHeinrich Heine University for computational support.
■ ABBREVIATIONS
MD, molecular dynamics; MM-PBSA, molecular mechanicsPoisson−Boltzmann surface area; MM-GBSA, molecularmechanics generalized Born surface area; LIE, linear interactionenergy; TI, thermodynamic integration; BAR, Bennett accept-ance ratio; FXa, factor Xa; CDK2, cyclin-dependent kinase 2;MR, mineralocorticoid receptor
■ REFERENCES(1) Herper, M. The Truly Staggering Cost Of Inventing New Drugs.Forbes, 2012, http://www.forbes.com/sites/matthewherper/2012/02/22/the-truly-staggering-cost-of-inventing-new-drugs-the-print-version/(accessed May 24, 2014).(2) Morgan, S.; Grootendorst, P.; Lexchin, J.; Cunningham, C.;Greyson, D. The cost of drug development: A systematic review.Health Policy 2011, 100, 4−17.(3) Paul, S. M.; Mytelka, D. S.; Dunwiddie, C. T.; Persinger, C. C.;Munos, B. H.; Lindborg, S. R.; Schacht, A. L. How to improve R&Dproductivity: the pharmaceutical industry’s grand challenge. Nat. Rev.Drug Discovery 2010, 9, 203−214.(4) Gilson, M. K.; Zhou, H. X. Calculation of Protein-Ligand BindingAffinities. Annu. Rev. Biophys. Biomol. Struct. 2007, 36, 21−42.(5) Jorgensen, W. L. The Many Roles of Computation in DrugDiscovery. Science 2004, 303, 1813−1818.(6) Brandsdal, B. O.; Osterberg, F.; Almlof, M.; Feierberg, I.;Luzhkov, V. B.; Åqvist, J. Free Energy Calculations and LigandBinding. Adv. Protein Chem. 2003, 66, 123−158.(7) Michel, J.; Essex, J. W. Prediction of protein-ligand bindingaffinity by free energy simulations: assumptions, pitfalls and expect-ations. J. Comput.-Aided Mol. Des. 2010, 24, 639−658.(8) Gallicchio, E.; Levy, R. M. Recent Theoretical and ComputationalAdvances for Modeling Protein-Ligand Binding Affinities. Adv. ProteinChem. Struct. Biol. 2011, 85, 27−80.(9) Srinivasan, J.; Cheatham, T. E., III; Cieplak, P.; Kolman, P. A.;Case, D. A. Continuum Solvent Studies of the Stability of DNA, RNA,and Phosphoramidate-DNA Helices. J. Am. Chem. Soc. 1998, 120,9401−9409.(10) Homeyer, N.; Gohlke, H. Free Energy Calculations by theMolecular Mechanics Poisson-Boltzmann Surface Area Method. Mol.Inf. 2012, 31, 114−122.
(11) Åqvist, J.; Medina, C.; Samuelsson, J. E. A new method forpredicting binding affinity in computer-aided drug design. Protein Eng.1994, 7, 385−391.(12) Guitierrez-de-Teran, H.; Åqvist, J. Linear Interaction Energy:Method and Applications in Drug Design. In Computational DrugDiscovery and Design; Baron, R., Ed.; Humana Press Inc.: Totowa, NJ,2012; Vol. 819, pp 305−323.(13) Chodera, J. D.; Mobley, D. L.; Shirts, M. R.; Dixon, R. W.;Branson, K.; Pande, V. S. Alchemical free energy methods for drugdiscovery: progress and challenges. Curr. Opin. Struct. Biol. 2011, 21,150−160.(14) Straub, A.; Roehrig, S.; Hillisch, A. Orale, direkte Thrombin-und Faktor-Xa-Hemmer: Kommt die Ablosung fur Warfarin, Blutegelund Schweinedarme? Angew. Chem. 2011, 123, 4670−4686.(15) Roehrig, S.; Straub, A.; Pohlmann, J.; Lampe, T.; Pernerstorfer,J.; Schlemmer, K. H.; Reinemer, P.; Perzborn, E. Discovery of theNovel Antithrombotic Agent 5-Chloro-N-({(5S)-2-oxo-3-[4-(3-oxo-morpholin-4-yl)phenyl]-1,3-oxazolidin-5-yl}methyl)thiophene-2-car-boxamide (BAY 59−7939): An Oral, Direct Factor Xa Inhibitor. J.Med. Chem. 2005, 48, 5900−5908.(16) Jautelat, R.; Brumby, T.; Schafer, M.; Briem, H.; Eisenbrand, G.;Schwahn, S.; Kruger, M.; Lucking, U.; Prien, O.; Siemeister, G. Fromthe Insoluble Dye Indirubin towards Highly Active, Soluble CDK2-Inhibitors. ChemBioChem 2005, 6, 531−540.(17) Fagart, J.; Hillisch, A.; Huyet, J.; Barfacker, L.; Fay, M.; Pleiss,U.; Pook, E.; Schafer, S.; Rafestin-Oblin, M. E.; Kolkhof, P. A NewMode of Mineralocorticoid Receptor Antagonism by a Potent andSelective Nonsteroidal Molecule. J. Biol. Chem. 2010, 285, 29932−29940.(18) Barfacker, L.; Kuhl, A.; Hillisch, A.; Grosser, R.; Figueroa-Perez,S.; Heckroth, H.; Nitsche, A.; Erguden, J. K.; Gielen-Haertwig, H.;Schlemmer, K. H.; Mittendorf, J.; Paulsen, H.; Platzek, J.; Kolkhof, P.Discovery of BAY 94−8862: A Nonsteroidal Antagonist of theMineralocorticoid Receptor for the Treatment of CardiorenalDiseases. ChemMedChem 2012, 7, 1385−1403.(19) SYBYL-X, version 1.2; Tripos International: St. Louis, MO,2010.(20) Guex, N.; Peitsch, M. C. SWISS-MODEL and the Swiss-PdbViewer: An environment for comparative protein modeling.Electrophoresis 1997, 18, 2714−2723.(21) Guex, N.; Peitsch, M.; Schwede, T.; Diemand, A. Swiss-PdbViewer, v4.0.1; Swiss Institute of Bioinformatics & the Biozentrum,University of Basel, Switzerland, 2008.(22) The PyMOL Molecular Graphics System, version 0.99rc6;Schrodinger, LLC: Portland, OR, 2006.(23) Case, D. A.; Darden, T. A.; Cheatham, T. E., III; Simmerling, C.L.; Wang, J.; Duke, R. E.; Luo, R.; Walker, R. C.; Zhang, W.; Merz, K.M.; Roberts, B.; Wang, B.; Hayik, S.; Roitberg, A.; Seabra, G.;Kolossvary, I.; Wong, K. F.; Paesani, F.; Vanicek, J.; Liu, J.; Wu, X.;Brozell, S. R.; Steinbrecher, T.; Gohlke, H.; Cai, Q.; Ye, X.; Wang, J.;Hsieh, M.-J.; Cui, G.; Roe, D. R.; Mathews, D. H.; Seetin, M. G.; Sagui,C.; Babin, V.; Luchko, T.; Gusarov, S.; Kovalenko, A.; Kollman, P. A.AMBER 11; University of California: San Francisco, CA, 2010.(24) Bernstein, F. C.; Koetzle, T. F.; Williams, G. J. B.; Meyer, E. F.,Jr.; Brice, M. D.; Rodgers, J. R.; Kennard, O.; Shimanouchi, T.;Tasumi, M. The Protein Data Bank: A Computer-based Archival FileFor Macromolecular Structures. J. Mol. Biol. 1977, 112, 535−542.(25) Zhang, B.; Tan, V. B. C.; Lim, K. M.; Tay, T. E. Significance ofWater Molecules in the Inhibition of Cylin-dependent Kinase 2 and 5Complexes. J. Chem. Inf. Model. 2007, 47, 1877−1885.(26) Wang, J.; Wolf, R. M.; Caldwell, J. W.; Kollman, P. A.; Case, D.A. Development and Testing of a General Amber Force Field. J.Comput. Chem. 2004, 25, 1157−1174.(27) Jakalian, A.; Bush, B. L.; Jack, D. B.; Bayly, C. I. Fast, EfficientGeneration of High-Quality Atomic Charges. AM1-BCC Model: I.Method. J. Comput. Chem. 2000, 21, 132−146.(28) Jakalian, A.; Jack, D. B.; Bayly, C. I. Fast, Efficient Generation ofHigh-Quality Atomic Charges. AM1-BCC model: II. Parameterizationand Validation. J. Comput. Chem. 2002, 23, 1623−1641.
Journal of Chemical Theory and Computation Article
dx.doi.org/10.1021/ct5000296 | J. Chem. Theory Comput. 2014, 10, 3331−33443342
(29) Bayly, C. I.; Cieplak, P.; Cornell, W. D.; Kollman, P. A. A Well-Behaved Electrostatic Potential Based Method Using ChargeRestraints for Deriving Atomic Charges: The RESP Model. J. Phys.Chem. 1993, 97, 10269−10280.(30) Frisch, M. J.; Trucks, G. W.; Schlegel, H. B.; Scuseria, G. E.;Robb, M. A.; Cheeseman, J. R.; Montgomery, J. A., Jr.; Vreven, T.;Kudin, K. N.; Burant, J. C.; Millam, J. M.; Iyengar, S. S.; Tomasi, J.;Barone, V.; Mennucci, B.; Cossi, M.; Scalmani, G.; Rega, N.;Petersson, G. A.; Nakatsuji, H.; Hada, M.; Ehara, M.; Toyota, K.;Fukuda, R.; Hasegawa, J.; Ishida, M.; Nakajima, T.; Honda, Y.; Kitao,O.; Nakai, H.; Klene, M.; Li, X.; Knox, J. E.; Hratchian, H. P.; Cross, J.B.; Bakken, V.; Adamo, C.; Jaramillo, J.; Gomperts, R.; Stratmann, R.E.; Yazyev, O.; Austin, A. J.; Cammi, R.; Pomelli, C.; Ochterski, J. W.;Ayala, P. Y.; Morokuma, K.; Voth, G. A.; Salvador, P.; Dannenberg, J.J.; Zakrzewski, V. G.; Dapprich, S.; Daniels, A. D.; Strain, M. C.;Farkas, O.; Malick, D. K.; Rabuck, A. D.; Raghavachari, K.; Foresman,J. B.; Ortiz, J. V.; Cui, Q.; Baboul, A. G.; Clifford, S.; Cioslowski, J.;Stefanov, B. B.; Liu, G.; Liashenko, A.; Piskorz, P.; Komaromi, I.;Martin, R. L.; Fox, D. J.; Keith, T.; Al-Laham, M. A.; Peng, C. Y.;Nanayakkara, A.; Challacombe, M.; Gill, P. M. W.; Johnson, B.; Chen,W.; Wong, M. W.; Gonzalez, C.; Pople, J. A. Gaussian 03; Gaussian,Inc.: Wallingford, CT, 2004.(31) Cornell, W. D.; Cieplak, P.; Bayly, C. I.; Gould, I. R.; Merz, K.M.; Ferguson, D. M.; Spellmeyer, D. C.; Fox, T.; Caldwell, J. W.;Kollman, P. A. A Second Generation Force Field for the Simulation ofProteins, Nucleic Acids, and Organic Molecules. J. Am. Chem. Soc.1995, 117, 5179−5197.(32) Hornak, V.; Abel, R.; Okur, A.; Strockbine, B.; Roitberg, A.;Simmerling, C. Comparison of Multiple Amber Force Fields andDevelopment of Improved Protein Backbone Parameters. Proteins:Struct., Funct., Bioinf. 2006, 65, 712−725.(33) Jorgensen, W. L.; Chandrasekhar, J.; Madura, J. D.; Impey, R.W.; Klein, M. L. Comparison of simple potential functions forsimulating liquid water. J. Chem. Phys. 1983, 79, 926−935.(34) Gohlke, H.; Case, D. A. Converging Free Energy Estimates:MM-PB(GB)SA Studies on the Protein-Protein Complex Ras-Raf. J.Comput. Chem. 2004, 25, 238−250.(35) Genheden, S.; Ryde, U. How to Obtain Statistically ConvergedMM/GBSA Results. J. Comput. Chem. 2010, 31, 837−846.(36) Onufriev, A.; Bashford, D.; Case, D. A. Exploring Protein NativeStates and Large-Scale Conformational Changes with a ModifiedGeneralized Born Model. Proteins: Struct., Funct., Bioinf. 2004, 55,383−394.(37) Tsui, V.; Case, D. A. Theory and Applications of theGeneralized Born Solvation Model in Macromolecular Simulations.Biopolymers 2001, 56, 275−291.(38) Sitkoff, D.; Sharp, K. A.; Honig, B. Accurate Calculation ofHydration Free Energies Using Macroscopic Solvent Models. J. Phys.Chem. 1994, 98, 1978−1988.(39) Weis, A.; Katebzadeh, K.; Soderhjelm, P.; Nilsson, I.; Ryde, U.Ligand Affinities Predicted with the MM/PBSA Method: Dependenceon the Simulation Method and the Force Field. J. Med. Chem. 2006,49, 6596−6606.(40) Hou, T.; Wang, J.; Li, Y.; Wang, W. Assessing the Performanceof the MM/PBSA and MM/GBSA Methods. 1. The Accuracy ofBinding Free Energy Calculations Based on Molecular DynamicsSimulations. J. Chem. Inf. Model. 2011, 51, 69−82.(41) Kuhn, B.; Kollman, P. A. Binding of a Diverse Set of Ligands toAvidin and Atreptavidin: An Accurate Quantitative Prediction of TheirRelative Affinities by a Combination of Molecular Mechanics andContinuum Solvent Models. J. Med. Chem. 2000, 43, 3786−3791.(42) Genheden, S.; Kuhn, O.; Mikulskis, P.; Hoffmann, D.; Ryde, U.The Normal-Mode Entropy in the MM/GBSA Method: Effect ofSystem Truncation, Buffer Region, and Dielectric Constant. J. Chem.Inf. Model. 2012, 52, 2079−2088.(43) Hou, T.; Yu, R. Molecular dynamics and Free Energy Studies onthe Wild-type and Double Mutant HIV-1 Protease Complexed withAmprenavir and Two Amprenavir-related Inhibitors: Mechanism forBinding and Drug Resistance. J. Med. Chem. 2007, 50, 1177−1188.
(44) Ferrari, A. M.; Degliesposti, G.; Sgobba, M.; Rastelli, G.Validation of an automated procedure for the prediction of relativefree energies of binding on a set of aldose reductase inhibitors. Bioorg.Med. Chem. 2007, 15, 7865−7877.(45) Del Rio, A.; Baldi, B. F.; Rastelli, G. Activity Prediction andStructural Insights of Extracellular Signal-Regulated Kinase 2 Inhibitorswith Molecular Dynamics Simulations. Chem. Biol. Drug Des. 2009, 74,630−635.(46) Brown, S. P.; Muchmore, S. W. Rapid Estimation of RelativeProtein-Ligand Binding Affinities Using a High-Throughput Versionof MM-PBSA. J. Chem. Inf. Model. 2007, 47, 1493−1503.(47) Homeyer, N.; Gohlke, H. FEW: A Workflow Tool for FreeEnergy Calculations of Ligand Binding. J. Comput. Chem. 2012, 34,965−973.(48) R: A Language and Environment for Statistical Computing; R CoreTeam, R Foundation for Statistical Computing: Vienna, Austria, 2010,http://www.R-project.org (accessed date October 8, 2010).(49) Hansson, T.; Marelius, J.; Åqvist, J. Ligand binding affinityprediction by linear interaction energy methods. J. Comput.-Aided Mol.Des. 1998, 12, 27−35.(50) Wang, W.; Wang, J.; Kollman, P. A. What Determines the vander Waals Coefficient β in the LIE (Linear Interaction Energy)Method to Estimate Binding Free Energies Using Molecular DynamicsSimulations? Proteins: Struct., Funct., Bioinf. 1999, 34, 395−402.(51) Valiente, P. A.; Gil L, A.; Batista, P. R.; Caffarena, E. R.; Pons,T.; Pascutti, P. G. New Parameterization Approaches of the LIEMethod to Improve Free Energy Calculations of PlmII-InhibitorsComplexes. J. Comput. Chem. 2010, 31, 2723−2734.(52) ROCS, version 3.1.1; OpenEye Scientific Software: Santa Fe,NM, http://www.eyesopen.com.(53) Hawkins, P. C.; Skillman, A. G.; Nicholls, A. Comparison ofShape-Matching and Docking as Virtual Screening Tools. J. Med.Chem. 2007, 50, 74−82.(54) Kruskal, J. B. On the shortest spanning subtree of a graph andthe traveling salesman problem. Proc. Am. Math. Soc. 1956, 7, 48−50.(55) Steinbrecher, T.; Joung, I.; Case, D. A. Soft-Core Potentials inThermodynamic Integration: Comparing One- and Two-step Trans-formations. J. Comput. Chem. 2011, 32, 3253−3263.(56) Genheden, S.; Nilsson, I.; Ryde, U. Binding Affinities of FactorXa Inhibitors Estimated by Thermodynamic Integration and MM/GBSA. J. Chem. Inf. Model. 2011, 51, 947−958.(57) Darden, T.; Pearlman, D. A.; Pedersen, L. G. Ionic charging freeenergies: Spherical versus periodic boundary conditions. J. Chem. Phys.1998, 109, 10921−10935.(58) Case, D. A.; Darden, T. A.; Cheatham, T. E., III; Simmerling, C.L.; Wang, J.; Duke, R. E.; Luo, R.; Walker, R. C.; Zhang, W.; Merz, K.M.; Roberts, B.; Hayik, S.; Roitberg, A.; Seabra, G.; Swails, J.; Gotz, A.W.; Kolossvary, I.; Wong, K. F.; Paesani, F.; Vanicek, J.; Wolf, R. M.;Liu, J.; Wu, X.; Brozell, S. R.; Steinbrecher, T.; Gohlke, H.; Cai, Q.; Ye,X.; Wang, J.; Hsieh, M.-J.; Cui, G.; Roe, D. R.; Mathews, D. H.; Seetin,M. G.; Salomon-Ferrer, R.; Sagui, C.; Babin, V.; Luchko, T.; Gusarov,S.; Kovalenko, A.; Kollman, P. A. AmberTools; University of California:San Francisco, CA, 2012.(59) Shirts, M. R.; Chodera, J. D. Statistically optimal analysis ofsamples from multiple equilibrium states. J. Chem. Phys. 2008, 129,124105.(60) Pearlman, D. A.; Charifson, P. S. Are Free Energy CalculationsUseful in Practice? A Comparison with Rapid Scoring Functions forthe p38 MAP Kinase Protein System. J. Med. Chem. 2001, 44, 3417−3423.(61) Canty, A.; Ripley, B. boot: Bootstrap Functions, version 1.3.9,2013, http://cran.r-project.org/web/packages/boot/index.html (ac-cessed date September 9, 2013).(62) Hou, T.; Guo, S.; Xu, X. Predictions of Binding of a Diverse Setof Ligands to Gelatinase-A by a Combination of Molecular Dynamicsand Continuum Solvent Models. J. Phys. Chem. B 2002, 106, 5527−5535.(63) Huo, S.; Wang, J.; Cieplak, P.; Kollman, P. A.; Kuntz, I. D.Molecular dynamics and Free Energy Analyses of Cathepsin D-
Journal of Chemical Theory and Computation Article
dx.doi.org/10.1021/ct5000296 | J. Chem. Theory Comput. 2014, 10, 3331−33443343
inhibitor Interactions: Insight into Structure-Based Ligand Design. J.Med. Chem. 2002, 45, 1412−1419.(64) Rastelli, G.; Del Rio, A.; Degliesposti, G.; Sgobba, M. Fast andAccurate Predictions of Binding Free Energies using MM-PBSA andMM-GBSA. J. Comput. Chem. 2010, 31, 797−810.(65) Guimaraes, C. R. W.; Mathiowetz, A. M. Addressing Limitationswith the MM-GB/SA Scoring Procedure using the WaterMap Methodand Free Energy Perturbation Calculations. J. Chem. Inf. Model. 2010,50, 547−559.(66) Yang, T.; Wu, J. C.; Yan, C.; Wang, Y.; Luo, R.; Gonzales, M. B.;Dalby, K. N.; Ren, P. Virtual screening using molecular simulations.Proteins: Struct., Funct., Bioinf. 2011, 79, 1940−1951.(67) Genheden, S.; Ryde, U. Comparison of end-point continuum-solvation methods for the calculation of protein-ligand binding freeenergies. Proteins: Struct., Funct., Bioinf. 2012, 80, 1326−1342.(68) Wallnoefer, H. G.; Fox, T.; Liedl, K. R.; Tautermann, C. S.Dispersion dominated halogen−π interactions: energies and locationsof minima. Phys. Chem. Chem. Phys. 2010, 12, 14941−14949.(69) Jorgensen, W. L.; Schyman, P. Treatment of Halogen Bondingin the OPLS-AA Force Field: Application to Potent Anti-HIV Agents.J. Chem. Theory Comput. 2011, 8, 3895−3901.(70) Ibrahim, M. A. Molecular mechanical study of halogen bondingin drug discovery. J. Comput. Chem. 2011, 32, 2564−2574.(71) Rendine, S.; Pieraccini, S.; Forni, A.; Sironi, M. Halogenbonding in ligand-receptor systems in the framework of classical forcefields. Phys. Chem. Chem. Phys. 2011, 13, 19508−19516.(72) Clark, T.; Hennemann, M.; Murray, J. S.; Politzer, P. Halogenbonding: the σ-hole. J. Mol. Model. 2007, 13, 291−296.(73) Wang, J.; Hou, T.; Yu, X. Recent Advances in Free EnergyCalculations with a Combination of Molecular Mechanics andContinuum Models. Curr. Comput.-Aided Drug Des. 2006, 2, 95−103.(74) Eisenbrand, G.; Hippe, F.; Jakobs, S.; Muehlbeyer, S. Molecularmechanisms of indirubine and its derivatives: novel anticancermolecules with their origin in traditional Chinese phytomedicine. J.Cancer Res. Clin. Oncol. 2004, 130, 627−635.(75) Stjernschantz, E.; Marelius, J.; Medina, C.; Jacobsson, M.;Vermeulen, N. P. E.; Oostenbrink, C. Are Automated MolecularDynamics Simulations and Binding Free Energy Calculations RealisticTools in Lead Optimization? An Evaluation of the Linear InteractionEnergy (LIE) Method. J. Chem. Inf. Model. 2006, 46, 1972−1983.(76) Mikulskis, P.; Genheden, S.; Rydberg, P.; Sandberg, L.; Olsen,L.; Ryde, U. Binding affinities in the SAMPL3 trypsin and host-guestblind tests estimated with the MM/PBSA and LIE methods. J.Comput.-Aided Mol. Des. 2011, 26, 527−541.(77) Genheden, S. MM/GBSA and LIE estimates of host-guestaffinities: dependence on charges and solvation model. J. Comput.-Aided Mol. Des. 2011, 25, 1085−1093.(78) Bruckner, S.; Boresch, S. Efficiency of Alchemical Free EnergySimulations. I. A Practical Comparison of the Exponential Formula,Thermodynamic Integration, and Bennett’’s Acceptance RatioMethod. J. Comput. Chem. 2011, 32, 1303−1319.(79) Bruckner, S.; Boresch, S. Efficiency of Alchemical Free EnergySimulations. II. Improvements for Thermodynamic Integration. J.Comput. Chem. 2011, 32, 1320−1333.(80) Shirts, M. R.; Pande, V. S. Comparison of efficiency and bias offree energies computed by exponential averaging, the Bennettacceptance ratio, and thermodynamic integration. J. Chem. Phys.2005, 122, 144107.(81) Kaus, J. W.; Pierce, L. T.; Walker, R. C.; McCammont, J. A.Improving the Efficiency of Free Energy Calculations in the AmberMolecular Dynamics Package. J. Chem. Theory Comput. 2013, 9,4131−4139.(82) Onufriev, A. V.; Alexov, E. Protonation and pK changes inprotein-ligand binding. Q. Rev. Biophys. 2013, 46, 181−209.(83) Wang, L.; Deng, Y.; Knight, J. L.; Wu, Y.; Kim, B.; Sherman, W.;Shelley, J. C.; Lin, T.; Abel, R. Modeling Local StructuralRearrangements Using FEP/REST: Application to Relative BindingAffinity Predictions of CDK2 Inhibitors. J. Chem. Theory Comput.2013, 9, 1282−1293.
(84) Huyet, J.; Pinon, G. M.; Fay, M. R.; Fagart, J.; Rafestin-Oblin,M. E. Structural Basis of Spirolactone Recognition by theMineralocorticoid Receptor. Mol. Pharmacol. 2007, 72, 563−571.(85) Li, Y.; Suino, K.; Daugherty, J.; Xu, H. E. Structural andBiochemical Mechanisms for the Specificity of Hormone Binding andCoactivator Assembly by Mineralocorticoid Receptor. Mol. Cell 2005,19, 367−380.(86) Schoch, G. A.; D’Arcy, B.; Stihle, M.; Burger, D.; Bar, D.; Benz,J.; Thoma, R.; Ruf, A. Molecular Switch in the GlucocorticoidReceptor: Active and Passive Antagonist Conformations. J. Mol. Biol.2010, 395, 568−577.(87) Katz, B. A.; Mackman, R.; Luong, C.; Radika, K.; Martelli, A.;Sprengeler, P. A.; Wang, J.; Chan, H.; Wong, L. Structural basis forselectivity of a small molecule, S1-binding, submicromolar inhibitor ofurokinase-type plasminogen activator. Chem. Biol. (Oxford, U. K.)2000, 7, 299−312.(88) Wu, S. Y.; McNae, I.; Kontopidis, G.; McClue, S. J.; McInnes,C.; Stewart, K. J.; Wang, S.; Zheleva, D. I.; Marriage, H.; Lane, D. P.;Taylor, P.; Fischer, P. M.; Walkinshaw, M. D. Discovery of a NovelFamily of CDK Inhibitors with the Program LIDAEUS: StructuralBasis for Ligand-Induced Disordering of the Activation Loop. Structure2003, 11, 399−410.(89) Baker, N. A.; Sept, D.; Joseph, S.; Holst, M. J.; McCammon, J.A. Electrostatics of nanosystems: Application to microtubules and theribosome. Proc. Natl. Acad. Sci. U.S.A. 2001, 98, 10037−10041.
Journal of Chemical Theory and Computation Article
dx.doi.org/10.1021/ct5000296 | J. Chem. Theory Comput. 2014, 10, 3331−33443344


![Binding free energy, energy and entropy calculations using ...of free energy calculations [10, 11]. Here, an attempt is made to estimate DG, DH and DS of binding for two simple host](https://img.pdfslide.net/doc/110x75/5f8d321e6b16ae3f7a54b199/binding-free-energy-energy-and-entropy-calculations-using-of-free-energy-calculations.jpg)

![Large-scale first principles and tight-binding density ... · the tight-binding DFT calculations, we used the DFTB+ code [25]. ONETEP [1] is a linear-scaling approach for DFT calculations,](https://img.pdfslide.net/doc/110x75/5f58478819c084702320ff1b/large-scale-first-principles-and-tight-binding-density-the-tight-binding-dft.jpg)