Embed Size (px)
Citation preview
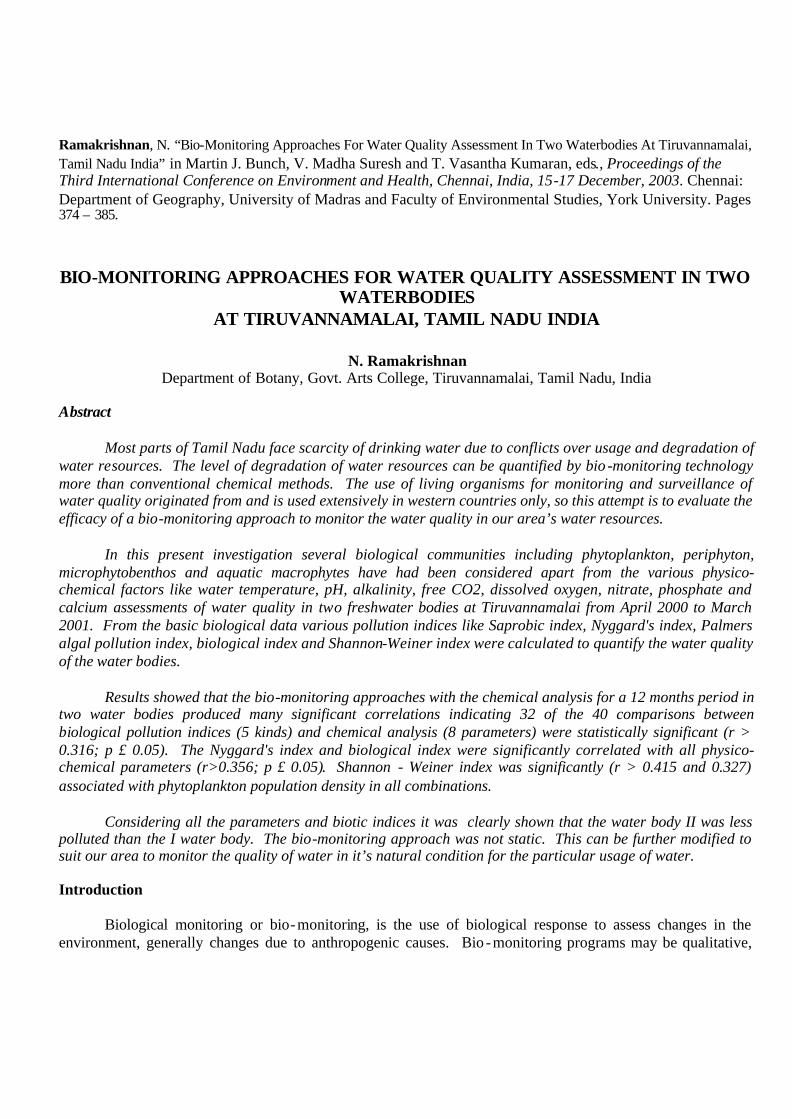
Ramakrishnan, N. “Bio-Monitoring Approaches For Water Quality Assessment In Two Waterbodies At Tiruvannamalai, Tamil Nadu India” in Martin J. Bunch, V. Madha Suresh and T. Vasantha Kumaran, eds., Proceedings of the Third International Conference on Environment and Health, Chennai, India, 15-17 December, 2003. Chennai: Department of Geography, University of Madras and Faculty of Environmental Studies, York University. Pages 374 – 385.
BIO-MONITORING APPROACHES FOR WATER QUALITY ASSESSMENT IN TWO
WATERBODIES AT TIRUVANNAMALAI, TAMIL NADU INDIA
N. Ramakrishnan Department of Botany, Govt. Arts College, Tiruvannamalai, Tamil Nadu, India
Abstract Most parts of Tamil Nadu face scarcity of drinking water due to conflicts over usage and degradation of water resources. The level of degradation of water resources can be quantified by bio -monitoring technology more than conventional chemical methods. The use of living organisms for monitoring and surveillance of water quality originated from and is used extensively in western countries only, so this attempt is to evaluate the efficacy of a bio-monitoring approach to monitor the water quality in our area’s water resources. In this present investigation several biological communities including phytoplankton, periphyton, microphytobenthos and aquatic macrophytes have had been considered apart from the various physico-chemical factors like water temperature, pH, alkalinity, free CO2, dissolved oxygen, nitrate, phosphate and calcium assessments of water quality in two freshwater bodies at Tiruvannamalai from April 2000 to March 2001. From the basic biological data various pollution indices like Saprobic index, Nyggard's index, Palmers algal pollution index, biological index and Shannon-Weiner index were calculated to quantify the water quality of the water bodies. Results showed that the bio-monitoring approaches with the chemical analysis for a 12 months period in two water bodies produced many significant correlations indicating 32 of the 40 comparisons between biological pollution indices (5 kinds) and chemical analysis (8 parameters) were statistically significant (r > 0.316; p £ 0.05). The Nyggard's index and biological index were significantly correlated with all physico-chemical parameters (r>0.356; p £ 0.05). Shannon - Weiner index was significantly (r > 0.415 and 0.327) associated with phytoplankton population density in all combinations. Considering all the parameters and biotic indices it was clearly shown that the water body II was less polluted than the I water body. The bio-monitoring approach was not static. This can be further modified to suit our area to monitor the quality of water in it’s natural condition for the particular usage of water. Introduction Biological monitoring or bio-monitoring, is the use of biological response to assess changes in the environment, generally changes due to anthropogenic causes. Bio -monitoring programs may be qualitative,

semi-quantitative or quantitative. Bio-monitoring is a valuable assessment tool that is receiving increased use in water quality monitoring programs of all types (Kennish, 1992). Bio-monitoring involves the use of indicators, indicator species or indicator communities. Generally benthic macro invertebrates, fish / or algae are used. Certain aquatic plants have also been used as indicator species for pollutants including nutrient enrichment (Philips and Rainbow, 1993; Batiuk et al., 1992). The presence or absence of the indicator or of an indicator species or indicator community reflects environmental conditions. Absence of a species is not as meaningful as it might seem as there may be reasons, other than pollution, that result in its absence [eg. Predation, competition or geographic barriers which prevented it from ever being at the site]. Absence of multiple species of different orders with similar tolerance levels that were present previously at the same site is more indicative of pollution than absence of a single species. It is necessary to know which species should be found at the site or in the system. A great deal of work has been done on using algae as bio-indicators of pollution (Mohanty, 1983; Reddy and Venkateswarlu, 1986; Tripathy, 1989; Mohapatra & Mohanty, 1992). Algal growth is dependent on sunlight and nutrient concentrations. An abundance of algae is indicative of nutrient pollution (De Lange, 1994). Moreover algae are sensitive to some pollutants at levels which may not visibly affect other organisms in the short term or may affect other communities at higher conce ntrations (Mitchell & Stapp, 1992).
Advantages In the present investigation algae is used as indicator organisms because of the following advantages, Ø Algae have very short life cycles and rapid reproduction. Ø Algae tend to be most directly affected by physical and chemical environmental factors. Ø Sampling is easy and inexpensive which requires few persons for assessment and has a lesser impact on
other organisms. Ø Standard methods exist. (Plafkin et al., 1989).
For a number of years there has been a series of proposals indicating that one or more algae could be used as organisms indicative of water quality (Palmer, 1959). He also demonstrated that algal assemblages could be used as indicators of clean water or polluted water. Later, Patrick (1971) also described a technique which could be useful in determining water quality. She proposed that an examination of the diatom flora would give a good idea of the water quality of a water body. Nevertheless, clean water would support a great diversity of organisms, whereas polluted water would yield just a few organisms, with one or few dominant forms (Trainor, 1984). In this venture, the microalgae have great potential for monitoring and evolving the water quality of the water bodies in our area (Venkataraman et al., 1994).
Considering all the above facts, the present study was undertaken in two natural freshwater bodies in Tiruvannamalai for the determination of water quality using algae as bio-monitors.
Problem of the Present Investigation
One method is to routinely survey the various algal species occurring in lakes, wetlands, rivers, and streams in order to evaluate the biological health, or biological integrity, of the resource surveyed. This type of survey is called biomonitoring or biosurveying.
Comprehensive pollution assessment requires various types of data. Biosurvey techniques (ie biomonitoring), are best used for detecting aquatic life impairments and assessing their relative severity. Once an impairment is detected, however, additional ecological data, such as chemical and biological (toxicity) testing is helpful to identify the causative agent, its source, and to implement appropriate mitigation. Integrating information from these data types as well as from habitat assessments, hydrological investigations, and knowledge of land use is helpful to provide a comprehensive diagnostic assessment of impacts from the 5 principal factors affecting biological health in aquatic systems (water quality, habitat structure, energy source, flow regime, and bio tic interaction factors).
Following mitigation, biosurveys are important for evaluating the effectiveness of such control measures. Biosurveys may be used within a planning and management framework to prioritize water quality problems for more stringent assessments and to document "environmental recovery" following control action and rehabilitation activities. Some of the advantages of using biosurveys for this type of monitoring are:
• Biological communities reflect overall ecological integrity (i.e., chemical, physical, and biological integrity). Therefore, biosurvey results directly assess the status of a water body relative to the primary goal of the Clean Water Act (CWA).
• Biological communities integrate the effects of different stressors and thus provide a broad measure of their aggregate impact.
• Communities integrate the stresses over time and provide an ecological measure of fluctuating environmental conditions.
• Routine monitoring of biological communities can be relatively inexpensive, particularly when compared to the cost of assessing toxic pollutants, either chemically or with toxicity tests.
• The status of biological communities is of direct interest to the public as a measure of a pollution free environment.
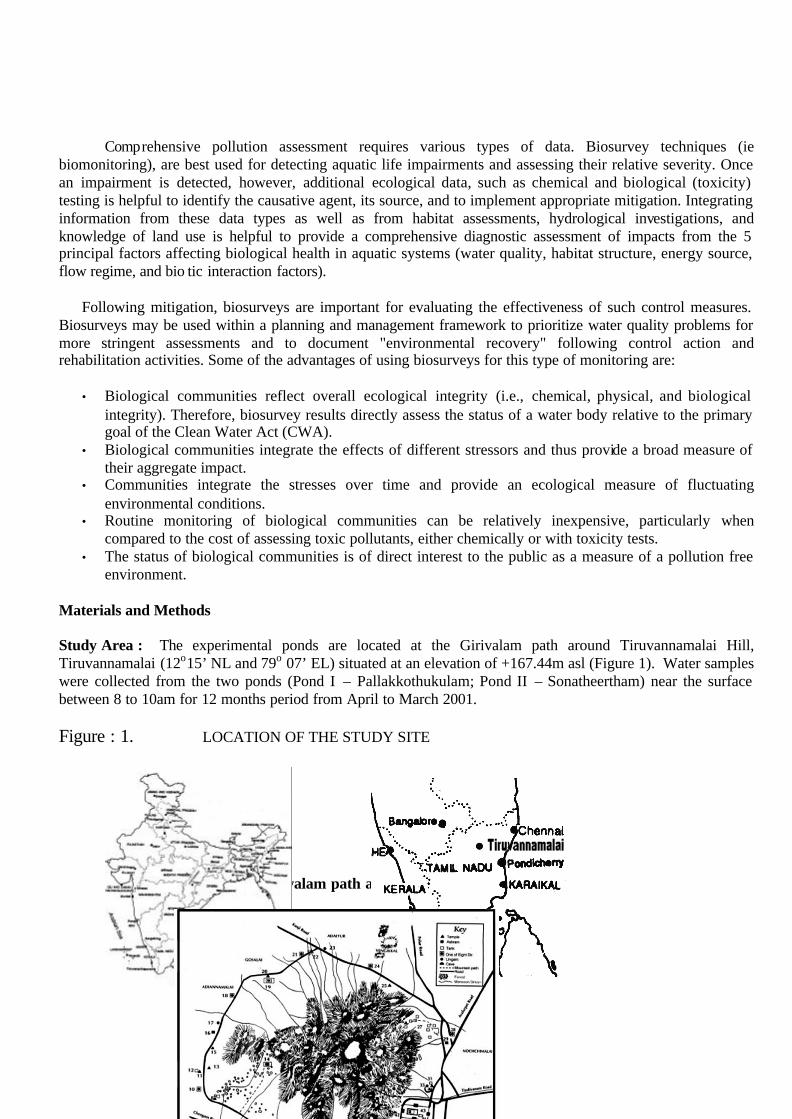
Materials and Methods Study Area : The experimental ponds are located at the Girivalam path around Tiruvannamalai Hill, Tiruvannamalai (12o15’ NL and 79o 07’ EL) situated at an elevation of +167.44m asl (Figure 1). Water samples were collected from the two ponds (Pond I – Pallakkothukulam; Pond II – Sonatheertham) near the surface between 8 to 10am for 12 months period from April to March 2001. Figure : 1. LOCATION OF THE STUDY SITE
Girivalam path around Tiruvannamalai Hill
Materials and Methods
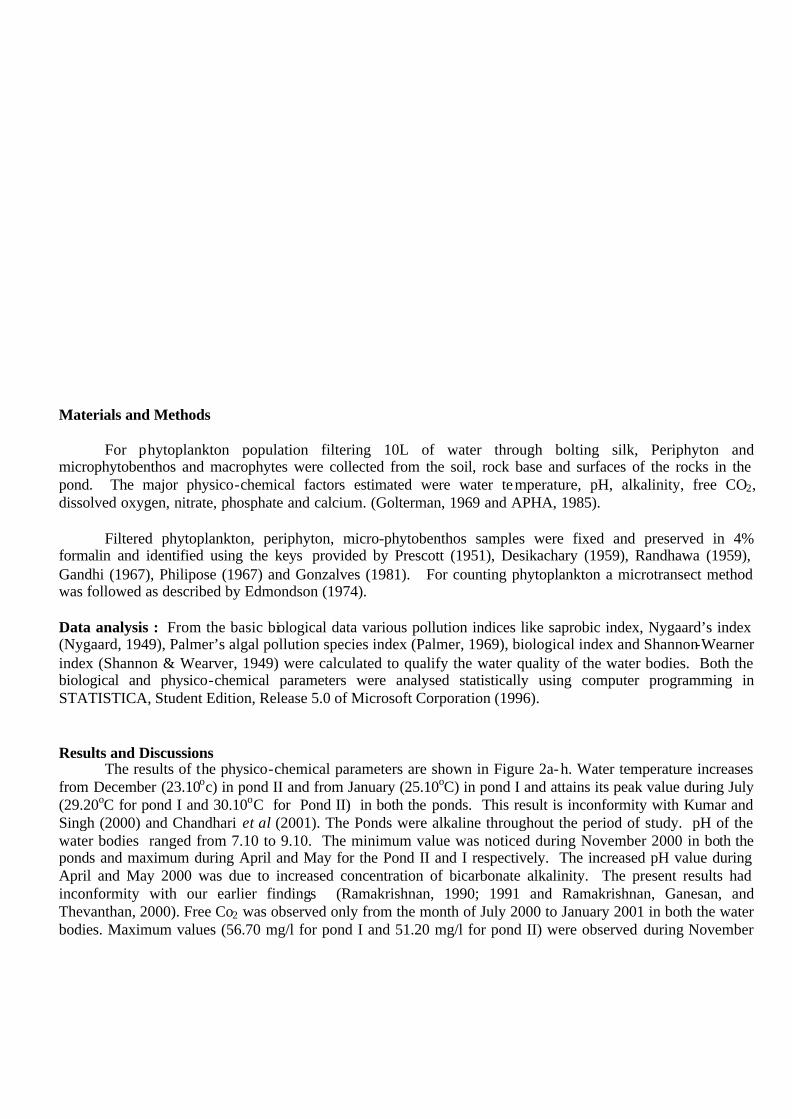
For phytoplankton population filtering 10L of water through bolting silk, Periphyton and
microphytobenthos and macrophytes were collected from the soil, rock base and surfaces of the rocks in the pond. The major physico-chemical factors estimated were water temperature, pH, alkalinity, free CO2, dissolved oxygen, nitrate, phosphate and calcium. (Golterman, 1969 and APHA, 1985). Filtered phytoplankton, periphyton, micro-phytobenthos samples were fixed and preserved in 4% formalin and identified using the keys provided by Prescott (1951), Desikachary (1959), Randhawa (1959), Gandhi (1967), Philipose (1967) and Gonzalves (1981). For counting phytoplankton a microtransect method was followed as described by Edmondson (1974). Data analysis : From the basic biological data various pollution indices like saprobic index, Nygaard’s index (Nygaard, 1949), Palmer’s algal pollution species index (Palmer, 1969), biological index and Shannon-Wearner index (Shannon & Wearver, 1949) were calculated to qualify the water quality of the water bodies. Both the biological and physico-chemical parameters were analysed statistically using computer programming in STATISTICA, Student Edition, Release 5.0 of Microsoft Corporation (1996). Results and Discussions The results of the physico-chemical parameters are shown in Figure 2a-h. Water temperature increases from December (23.10oc) in pond II and from January (25.10oC) in pond I and attains its peak value during July (29.20oC for pond I and 30.10oC for Pond II) in both the ponds. This result is inconformity with Kumar and Singh (2000) and Chandhari et al (2001). The Ponds were alkaline throughout the period of study. pH of the water bodies ranged from 7.10 to 9.10. The minimum value was noticed during November 2000 in both the ponds and maximum during April and May for the Pond II and I respectively. The increased pH value during April and May 2000 was due to increased concentration of bicarbonate alkalinity. The present results had inconformity with our earlier findings (Ramakrishnan, 1990; 1991 and Ramakrishnan, Ganesan, and Thevanthan, 2000). Free Co2 was observed only from the month of July 2000 to January 2001 in both the water bodies. Maximum values (56.70 mg/l for pond I and 51.20 mg/l for pond II) were observed during November
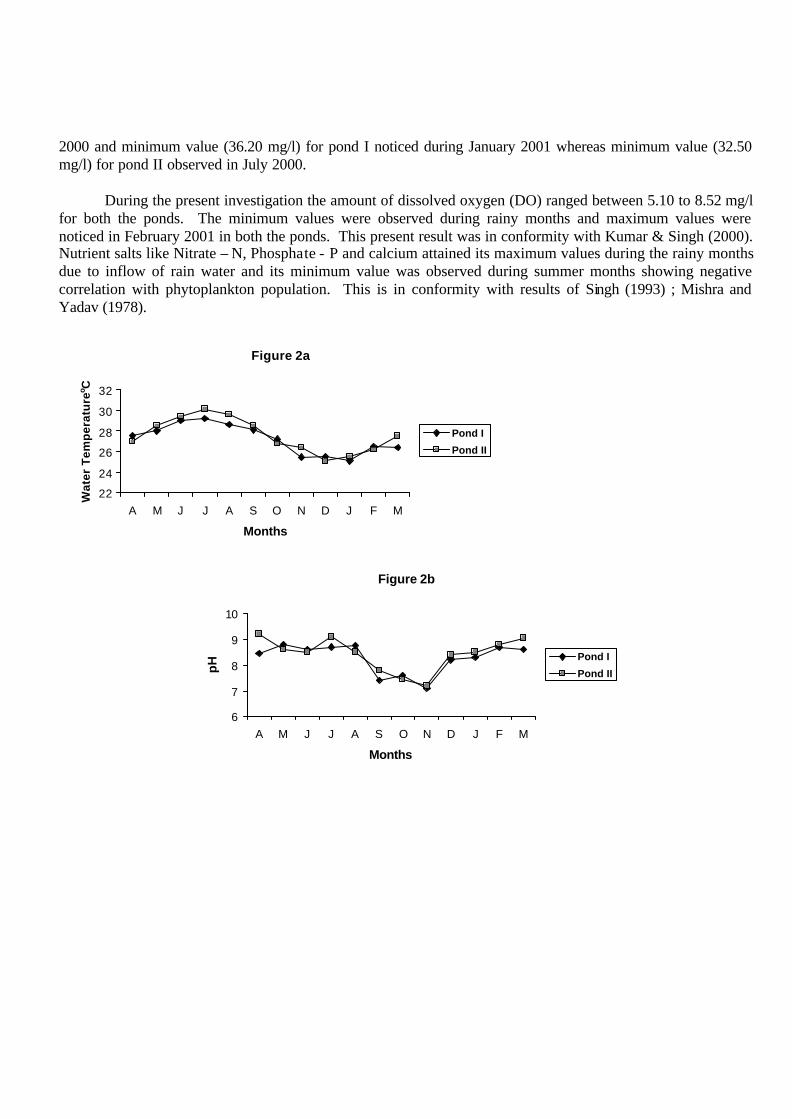
2000 and minimum value (36.20 mg/l) for pond I noticed during January 2001 whereas minimum value (32.50 mg/l) for pond II observed in July 2000.
During the present investigation the amount of dissolved oxygen (DO) ranged between 5.10 to 8.52 mg/l for both the ponds. The minimum values were observed during rainy months and maximum values were noticed in February 2001 in both the ponds. This present result was in conformity with Kumar & Singh (2000). Nutrient salts like Nitrate – N, Phosphate - P and calcium attained its maximum values during the rainy months due to inflow of rain water and its minimum value was observed during summer months showing negative correlation with phytoplankton population. This is in conformity with results of Singh (1993) ; Mishra and Yadav (1978).
Figure 2a
22
24
26
28
30
32
A M J J A S O N D J F M
Months
Wat
er T
emp
erat
ure
o C
Pond I
Pond II
Figure 2b
6
7
8
9
10
A M J J A S O N D J F M
Months
pH Pond I
Pond II
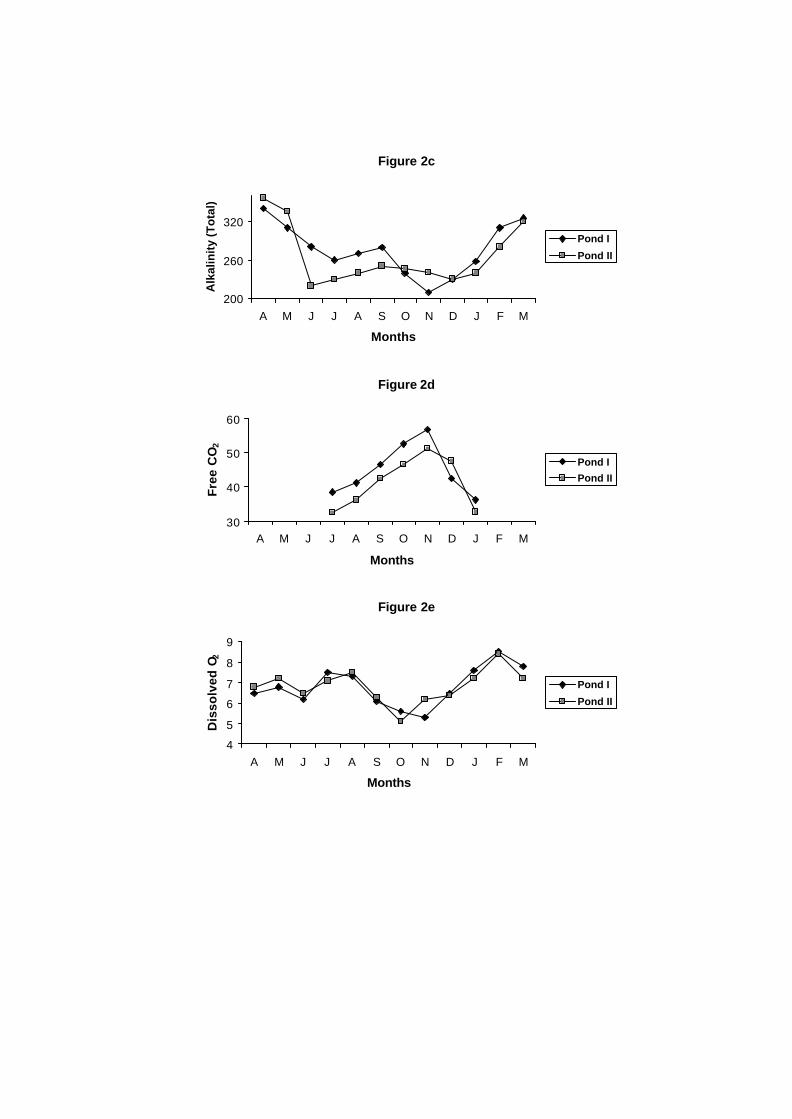
Figure 2c
200
260
320
A M J J A S O N D J F M
Months
Alk
alin
ity
(To
tal)
Pond I
Pond II
Figure 2d
30
40
50
60
A M J J A S O N D J F M
Months
Fre
e C
O2
Pond I
Pond II
Figure 2e
4
5
6
7
8
9
A M J J A S O N D J F M
Months
Dis
solv
ed O
2
Pond I
Pond II
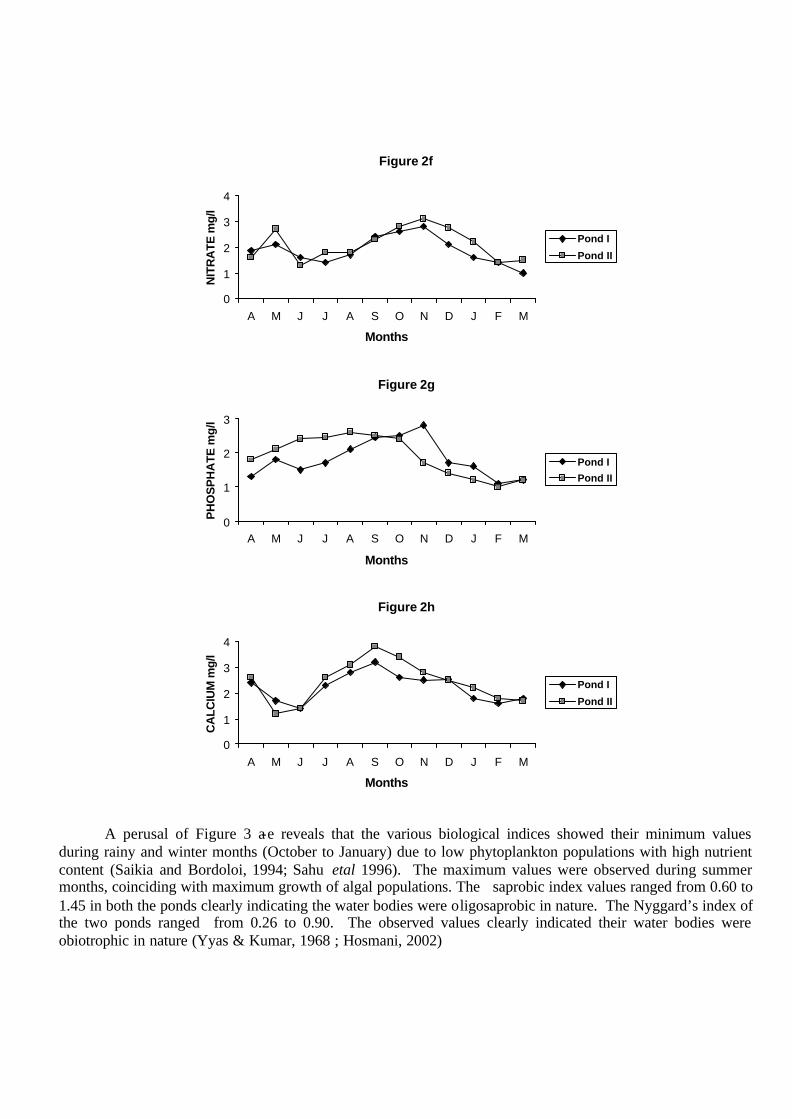
Figure 2f
0
1
2
3
4
A M J J A S O N D J F M
Months
NIT
RA
TE m
g/l
Pond I
Pond II
Figure 2g
0
1
2
3
A M J J A S O N D J F M
Months
PH
OS
PH
ATE
mg/
l
Pond I
Pond II
Figure 2h
0
1
2
3
4
A M J J A S O N D J F M
Months
CA
LCIU
M m
g/l
Pond I
Pond II
A perusal of Figure 3 a-e reveals that the various biological indices showed their minimum values
during rainy and winter months (October to January) due to low phytoplankton populations with high nutrient content (Saikia and Bordoloi, 1994; Sahu etal 1996). The maximum values were observed during summer months, coinciding with maximum growth of algal populations. The saprobic index values ranged from 0.60 to 1.45 in both the ponds clearly indicating the water bodies were oligosaprobic in nature. The Nyggard’s index of the two ponds ranged from 0.26 to 0.90. The observed values clearly indicated their water bodies were obiotrophic in nature (Yyas & Kumar, 1968 ; Hosmani, 2002)
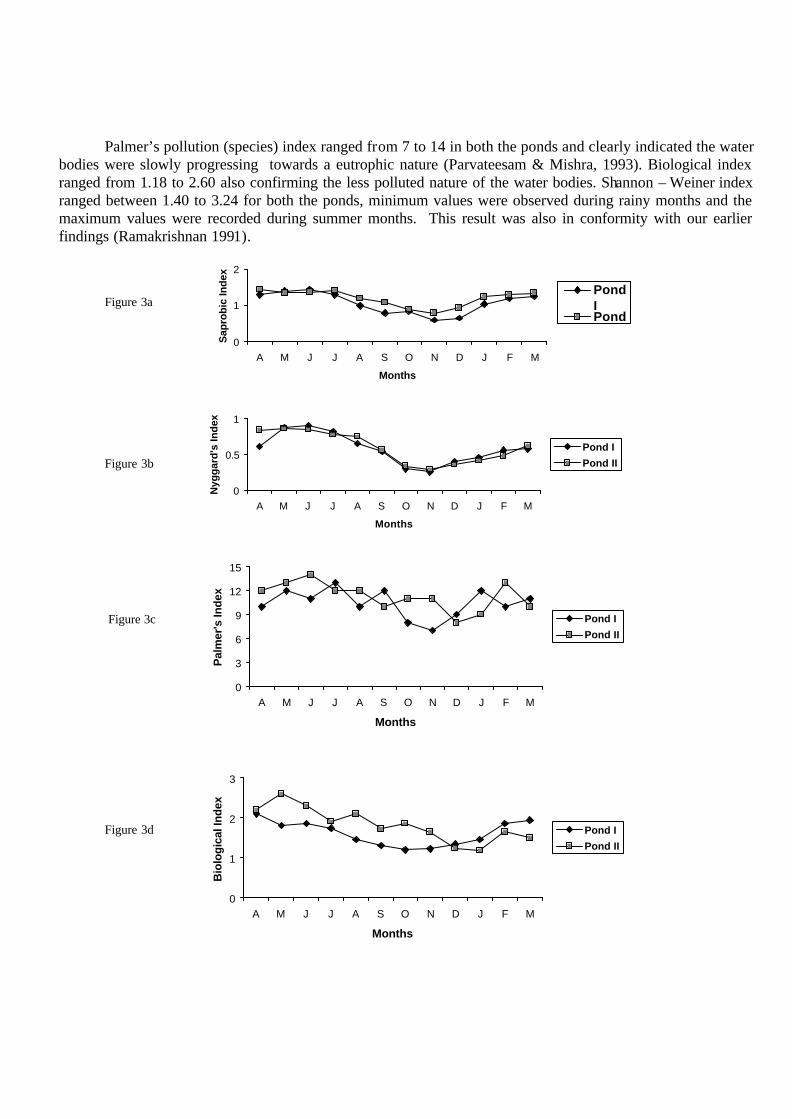
Palmer’s pollution (species) index ranged from 7 to 14 in both the ponds and clearly indicated the water bodies were slowly progressing towards a eutrophic nature (Parvateesam & Mishra, 1993). Biological index ranged from 1.18 to 2.60 also confirming the less polluted nature of the water bodies. Shannon – Weiner index ranged between 1.40 to 3.24 for both the ponds, minimum values were observed during rainy months and the maximum values were recorded during summer months. This result was also in conformity with our earlier findings (Ramakrishnan 1991).
Figure 3a
Figure 3b
Figure 3c
Figure 3d
0
0.5
1
A M J J A S O N D J F M
Months
Nyg
gar
d's
Ind
ex
Pond I
Pond II
0
3
6
9
12
15
A M J J A S O N D J F M
Months
Pal
mer
's In
dex
Pond I
Pond II
0
1
2
3
A M J J A S O N D J F M
Months
Bio
logi
cal I
ndex
Pond I
Pond II
0
1
2
A M J J A S O N D J F M
Months
Sap
robi
c In
dex
PondIPondII
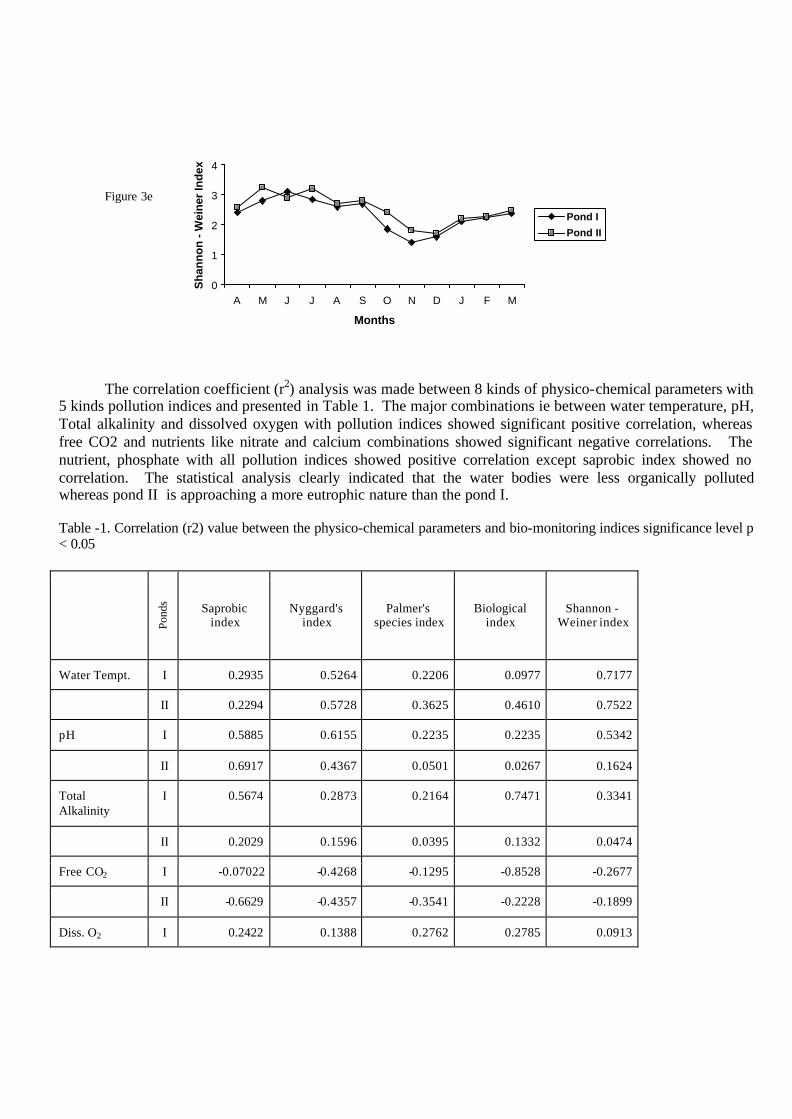
Figure 3e
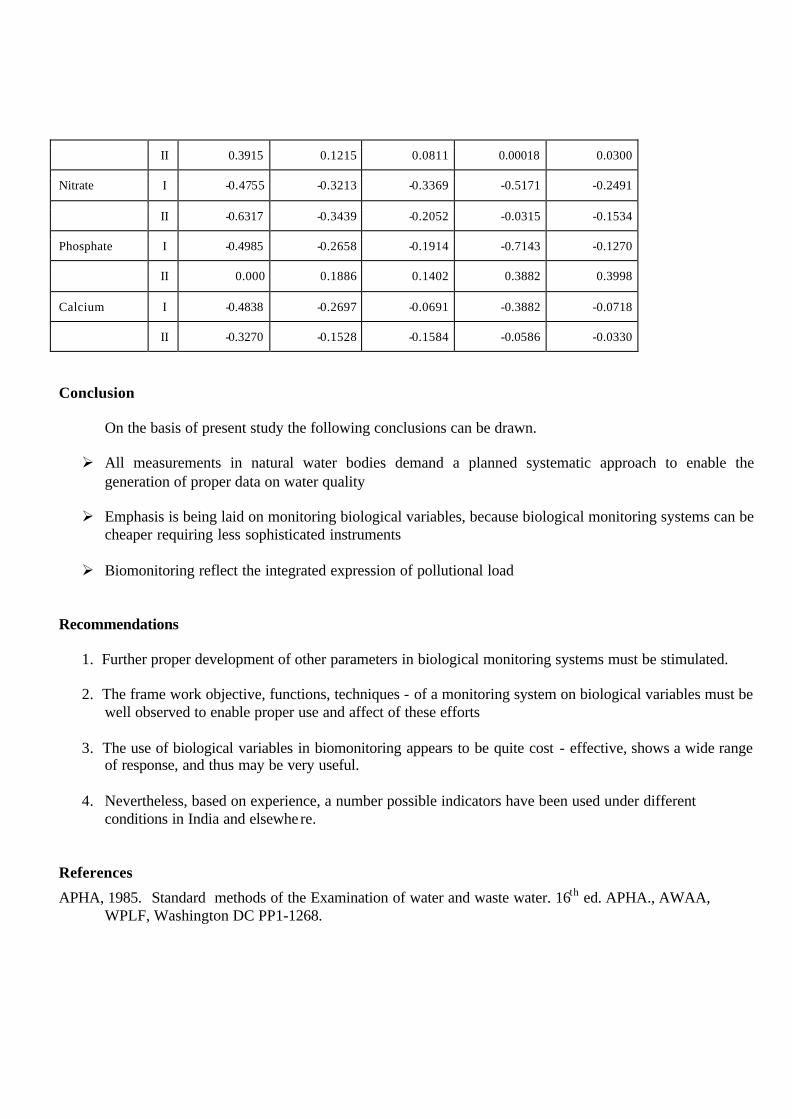
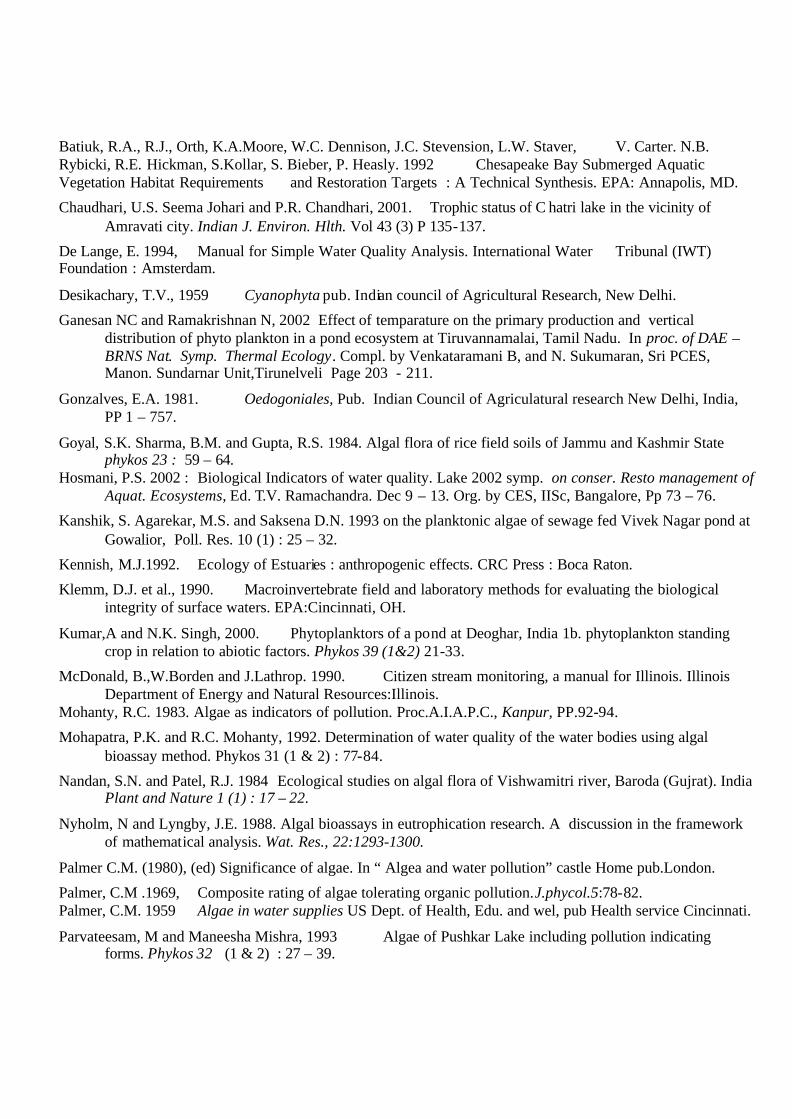
The correlation coefficient (r2) analysis was made between 8 kinds of physico-chemical parameters with
5 kinds pollution indices and presented in Table 1. The major combinations ie between water temperature, pH, Total alkalinity and dissolved oxygen with pollution indices showed significant positive correlation, whereas free CO2 and nutrients like nitrate and calcium combinations showed significant negative correlations. The nutrient, phosphate with all pollution indices showed positive correlation except saprobic index showed no correlation. The statistical analysis clearly indicated that the water bodies were less organically polluted whereas pond II is approaching a more eutrophic nature than the pond I. Table -1. Correlation (r2) value between the physico-chemical parameters and bio-monitoring indices significance level p < 0.05
Pond
s Saprobic index
Nyggard's index
Palmer's species index
Biological index
Shannon - Weiner index
Water Tempt. I 0.2935 0.5264 0.2206 0.0977 0.7177
II 0.2294 0.5728 0.3625 0.4610 0.7522
pH I 0.5885 0.6155 0.2235 0.2235 0.5342
II 0.6917 0.4367 0.0501 0.0267 0.1624
Total Alkalinity
I 0.5674 0.2873 0.2164 0.7471 0.3341
II 0.2029 0.1596 0.0395 0.1332 0.0474
Free CO2 I -0.07022 -0.4268 -0.1295 -0.8528 -0.2677
II -0.6629 -0.4357 -0.3541 -0.2228 -0.1899
Diss. O2 I 0.2422 0.1388 0.2762 0.2785 0.0913
0
1
2
3
4
A M J J A S O N D J F M
Months
Sh
ann
on
- W
ein
er In
dex
Pond I
Pond II
II 0.3915 0.1215 0.0811 0.00018 0.0300
Nitrate I -0.4755 -0.3213 -0.3369 -0.5171 -0.2491
II -0.6317 -0.3439 -0.2052 -0.0315 -0.1534
Phosphate I -0.4985 -0.2658 -0.1914 -0.7143 -0.1270
II 0.000 0.1886 0.1402 0.3882 0.3998
Calcium I -0.4838 -0.2697 -0.0691 -0.3882 -0.0718
II -0.3270 -0.1528 -0.1584 -0.0586 -0.0330
Conclusion On the basis of present study the following conclusions can be drawn. Ø All measurements in natural water bodies demand a planned systematic approach to enable the
generation of proper data on water quality Ø Emphasis is being laid on monitoring biological variables, because biological monitoring systems can be
cheaper requiring less sophisticated instruments Ø Biomonitoring reflect the integrated expression of pollutional load
Recommendations
1. Further proper development of other parameters in biological monitoring systems must be stimulated.
2. The frame work objective, functions, techniques - of a monitoring system on biological variables must be well observed to enable proper use and affect of these efforts
3. The use of biological variables in biomonitoring appears to be quite cost - effective, shows a wide range
of response, and thus may be very useful.
4. Nevertheless, based on experience, a number possible indicators have been used under different conditions in India and elsewhere.
References
APHA, 1985. Standard methods of the Examination of water and waste water. 16th ed. APHA., AWAA, WPLF, Washington DC PP1-1268.
Batiuk, R.A., R.J., Orth, K.A.Moore, W.C. Dennison, J.C. Stevension, L.W. Staver, V. Carter. N.B. Rybicki, R.E. Hickman, S.Kollar, S. Bieber, P. Heasly. 1992 Chesapeake Bay Submerged Aquatic Vegetation Habitat Requirements and Restoration Targets : A Technical Synthesis. EPA: Annapolis, MD.
Chaudhari, U.S. Seema Johari and P.R. Chandhari, 2001. Trophic status of C hatri lake in the vicinity of Amravati city. Indian J. Environ. Hlth. Vol 43 (3) P 135-137.
De Lange, E. 1994, Manual for Simple Water Quality Analysis. International Water Tribunal (IWT) Foundation : Amsterdam.
Desikachary, T.V., 1959 Cyanophyta pub. Indian council of Agricultural Research, New Delhi.
Ganesan NC and Ramakrishnan N, 2002 Effect of temparature on the primary production and vertical distribution of phyto plankton in a pond ecosystem at Tiruvannamalai, Tamil Nadu. In proc. of DAE – BRNS Nat. Symp. Thermal Ecology. Compl. by Venkataramani B, and N. Sukumaran, Sri PCES, Manon. Sundarnar Unit,Tirunelveli Page 203 - 211.
Gonzalves, E.A. 1981. Oedogoniales, Pub. Indian Council of Agriculatural research New Delhi, India, PP 1 – 757.
Goyal, S.K. Sharma, B.M. and Gupta, R.S. 1984. Algal flora of rice field soils of Jammu and Kashmir State phykos 23 : 59 – 64.
Hosmani, P.S. 2002 : Biological Indicators of water quality. Lake 2002 symp. on conser. Resto management of Aquat. Ecosystems, Ed. T.V. Ramachandra. Dec 9 – 13. Org. by CES, IISc, Bangalore, Pp 73 – 76.
Kanshik, S. Agarekar, M.S. and Saksena D.N. 1993 on the planktonic algae of sewage fed Vivek Nagar pond at Gowalior, Poll. Res. 10 (1) : 25 – 32.
Kennish, M.J.1992. Ecology of Estuaries : anthropogenic effects. CRC Press : Boca Raton.
Klemm, D.J. et al., 1990. Macroinvertebrate field and laboratory methods for evaluating the biological integrity of surface waters. EPA:Cincinnati, OH.
Kumar,A and N.K. Singh, 2000. Phytoplanktors of a pond at Deoghar, India 1b. phytoplankton standing crop in relation to abiotic factors. Phykos 39 (1&2) 21-33.
McDonald, B.,W.Borden and J.Lathrop. 1990. Citizen stream monitoring, a manual for Illinois. Illinois Department of Energy and Natural Resources:Illinois.
Mohanty, R.C. 1983. Algae as indicators of pollution. Proc.A.I.A.P.C., Kanpur, PP.92-94.
Mohapatra, P.K. and R.C. Mohanty, 1992. Determination of water quality of the water bodies using algal bioassay method. Phykos 31 (1 & 2) : 77-84.
Nandan, S.N. and Patel, R.J. 1984 Ecological studies on algal flora of Vishwamitri river, Baroda (Gujrat). India Plant and Nature 1 (1) : 17 – 22.
Nyholm, N and Lyngby, J.E. 1988. Algal bioassays in eutrophication research. A discussion in the framework of mathematical analysis. Wat. Res., 22:1293-1300.
Palmer C.M. (1980), (ed) Significance of algae. In “ Algea and water pollution” castle Home pub.London.
Palmer, C.M .1969, Composite rating of algae tolerating organic pollution.J.phycol.5:78-82. Palmer, C.M. 1959 Algae in water supplies US Dept. of Health, Edu. and wel, pub Health service Cincinnati.
Parvateesam, M and Maneesha Mishra, 1993 Algae of Pushkar Lake including pollution indicating forms. Phykos 32 (1 & 2) : 27 – 39.
Patrick, R 1971 Diatom communities. In “The structure and Function of Fresh – water Microbial communities” (Cairns, J., ed) pp 151 –164. Res. Div. Mon. 3, Viriginia Polytechnic Institute and state university, Blacksburg.
Phillipose, M.T. 1967 Chlorococales. Pub. Indian Council of Agr iculatural Research, New Delhi, India.
Phillips, D.J.H., P.S. Rainbow. 1993. Biomonitoring of Trace Aquatic Contaminants. Elsevier Applied Science:New York, NY.
Plafkin, J.L.M.T. Barbour, K.D. Porter, S.K. Gross, R.M. Hughes. 1989. Rapid Assessment Protocols for Use in Streams and Rivers : Benthic Macroinvertebrates and Fish. EPA: Washington, D.C. Rosenberg, D.M., V.H.Resh(eds). 1993. Freshwater Biomonitoring and Benthic Macroinvertebrates. Chapman & Hall:New York, NY.
Ramakrishan, N., N.C. Ganesan and R. Thevanathan, 2000 Distribution of plank tonic algae in three different fresh water bodies of Tiruvannamalai, Tiruvannamalai District, Tamil Nadu, Nat. Symp. on phycology in the New Millennium org.in CAS, Univ. of Madras, Chennai (March 1-3) Abstract book page 45.
Ramakrishnan, N and Kannan, L. 1992 Blue green algal flora of Muthupet, Tamil Nadu phykos. 31 : 169 – 171.
Ramakrishnan, N. 1991 Primary production of two Man – made fresh water reservoirs at Annamalai Nagar, Tamil Nadu, International on Land – water Interaction (8-13 December) NIE, New Delhi. Abstract Page 61.
RAMAKRISHNAN. N 1990. Water quality assessment of two drinking water ponds using algae as indicators at Tiruvannamalai Town, Tamil Nadu. In Nat. Symp. on Biomonitoring Indicators in an Aquat. Ecosystem, Erode Oct 24 – 26. Abstract No : 07.
Randhawa, M.S. 1959. Zygnemaceae Pub. Indian Council of Agricultural Research, New Delhi, PP. 471. Redy, P.M. and Venkateshwarlu, V. 1986. Ecology of algae in the paper mill effluents and their impact on the
river Tungabhadra. J. Environ. Biol., 7:215-223. Shannon, C.E. and Weaver, W. 1949. The Mathematical theory of communi cation. Urbans III Univ. of
Illinosis Chicago.
Singh, N.K. 1993. studies on density, productivity and species composition of phytoplankton in relation to abiotic spectrum of the Ganges of sahibganj. J. Fresh water Biol. 5 (1) : 1 – 8.
Statistica 1996. Statistica Students Edition Release 5.0 Window operating systems ; SPSS & SAS Printed in USA web:http://www.statsoft.com
Trainor, F.R, 1984 Indicator Algal Assay Laboratory and fields approaches. In “Algae as Ecological Indicators. Ed. Shubert, Academic press London. Pp 3 – 14.
Tripathy, C.K.M. 1989. Phytoplanktons as indicators of water pollution in river Ganga at Varanasi, Biol, Mem;, 15:65-72.
Trivedi, R.K. and Goel, P.K. 1986, Chemical and Biological Methods for water pollution studies – pub. Envir. Pub. Karad (India)
Venkataraman, L.V. M.K.Krishi and G. suvarnalatha, 1994. Algae as tool for biomonitoring and abatemnent of pesticide pollution in aqnatic system. Phykos 33 (1 & 2) 171-193.
Vyas, L.N. and Kumar, H.D. 1968 Studies on the phytoplankton and other algae of Indrasagar tank, udaipur. Hydrobiologia 31 (3/4) : 421 – 434.