Embed Size (px)
Citation preview

1
13.05.2004 BIO4530 våren 2004 1
Risikoevaluering med dataprogrammer – BMDS, ToxTools
Risikoevaluering med Risikoevaluering med dataprogrammer dataprogrammer –– BMDS, BMDS, ToxToolsToxTools
BIO4530 BIO4530 RegulatoriskRegulatorisktoksikologi toksikologi Steinar ØvrebøSteinar Øvrebø
13.05.2004 BIO4530 våren 2004 2
Course ObjectiveAfter completing this course you should:
1. Understand Benchmark Dose methods and terminology used by EPA;2. Understand the purpose and capabilities of EPA's Benchmark Dose Software
(BMDS);3. Be able to use BMDS to perform Benchmark Software (BMDS) dose
assessments of dichotomous, nested dichotomous and continuous data.B.History
1. 1995 - EPA initiated the development of BMDS2. 1999 - Public Review of Version 1.1b3. 1999 - Quality Assurance Testing of Version 1.24. 2000 - Public Release of Version 1.25. 2000 - Development of Draft Benchmark Dose Technical Guidance Document6. 2001 - Release of Version 1.37. 2002 - Release of Version 1.3.1
C.What's Coming?1. 2002 - Final BMD Technical Guidance Document2. 2003 - Categorical Regression Model3. 2004 - Neurotoxicity Models4. 2004 - Improved Continuous Models (e.g., Hybrid Option)5. 2005 - Time-to-Tumor Cancer Model6. 2006 - Tools for the Analysis of Human Data
I. Course Introduction
http://www.epa.gov/NCEA/bmds_training/introduction/introo.htm
13.05.2004 BIO4530 våren 2004 3
Benchmark Dose BMDBenchmark Dose lower confidence limits BMDLs
BMD og BMC dose og concentrationBMDS BMD software
13.05.2004 BIO4530 våren 2004 4
13.05.2004 BIO4530 våren 2004 5
POD - Point of departureExtrapolation from POD to low health relevant exposure levels
BMD vs NOAEL/LOAEL
13.05.2004 BIO4530 våren 2004 6
Benchmark Dose erstatter NOAEL/LOAEL for terskel toksikologi
Cancer: EPA vil også bruke BMD for kreftevaluering i fremtiden
BMD har vært benyttet istedenfor NOAEL/LOAELEPA – However, it is likely that there will continue to be endpoints that are not amenable to modeling and for which a NOAEL/LOAEL approach must be used there
All studies that show a graded Monotonic response with dose likely to will be useful for BMD analysis, and the minimum data set for calculating a BMD should at least show a significant dose-related trend in the selected-endpoint

2
13.05.2004 BIO4530 våren 2004 7
Three types of Endpoint data:DichotomousContinuousCategorical
% d
yrmed
can
cer
Dose
Dichotomous
Mea
n va
lue
–he
mat
ocrit
Dose
Continuous
Mild
, mod
erat
e an
d se
vere
Dose
Categorical
13.05.2004 BIO4530 våren 2004 8
Are the data appropriate for BMD analysis?
a) There must be at least a statistically or biologically significant dose-related trend in the selected endpoint
b) Not the same response in all non-control doses. The BMD may be just below the first dose , or orders of magnitude lower. Limitation with Weibull when maximum response is less than 100%. And goodness of fit provides no help in selecting among the possibilities.
c) Quantal data (dichotomous). Selection of BMR. An excess risk of 10% is the default BMR since the 10% response is at or near the limit of sensitivity in most cancer bioassay and in some non-cancer bioassays as well. With greater sensitivity lower BMR. Reproductive and development studies 5%, Epidemiology 1%,
d) Continuous data ….equal to a change in the mean response equal to one control standard deviation from the control mean should also be presented for comparison purposes
13.05.2004 BIO4530 våren 2004 9
http://www.epa.gov/NCEA/bmds_training/software/overp.htm13.05.2004 BIO4530 våren 2004 10
’additional risk’r(d) = P(d) – P(0)
’multiplicative risk’r(d) = (P(d) – P(0))/ 1 – P(0)
Excess risk
13.05.2004 BIO4530 våren 2004 11 13.05.2004 BIO4530 våren 2004 12
Quantal Quadratic Model The form of the probability function is:
P[response] = background + (1-background)*[1-EXP(-slope*dose^2)]
3
13.05.2004 BIO4530 våren 2004 13 13.05.2004 BIO4530 våren 2004 14
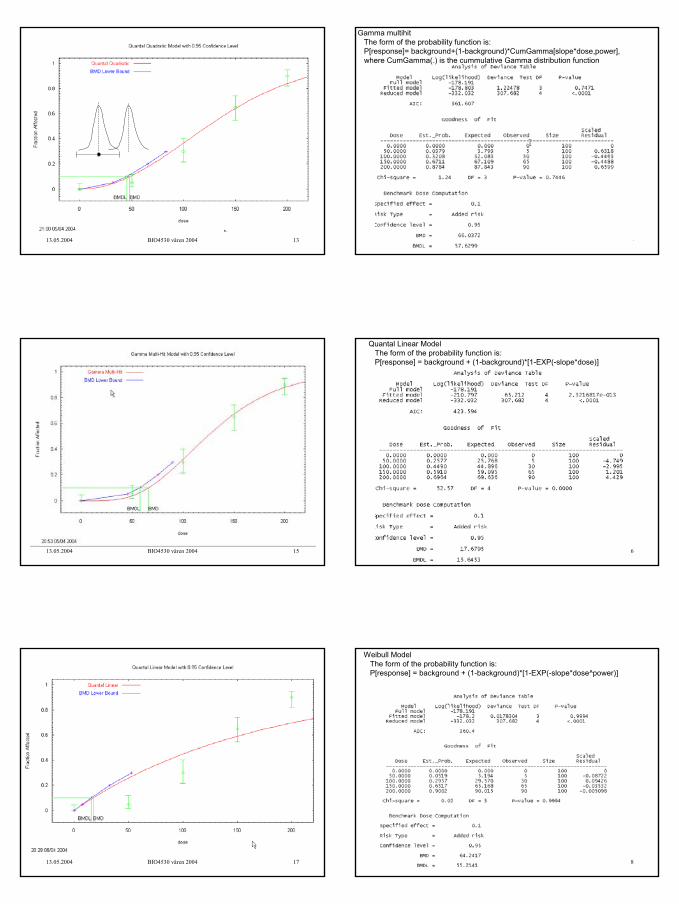
Gamma multihitThe form of the probability function is: P[response]= background+(1-background)*CumGamma[slope*dose,power],where CumGamma(.) is the cummulative Gamma distribution function
13.05.2004 BIO4530 våren 2004 15 13.05.2004 BIO4530 våren 2004 16
Quantal Linear ModelThe form of the probability function is: P[response] = background + (1-background)*[1-EXP(-slope*dose)]
13.05.2004 BIO4530 våren 2004 17 13.05.2004 BIO4530 våren 2004 18
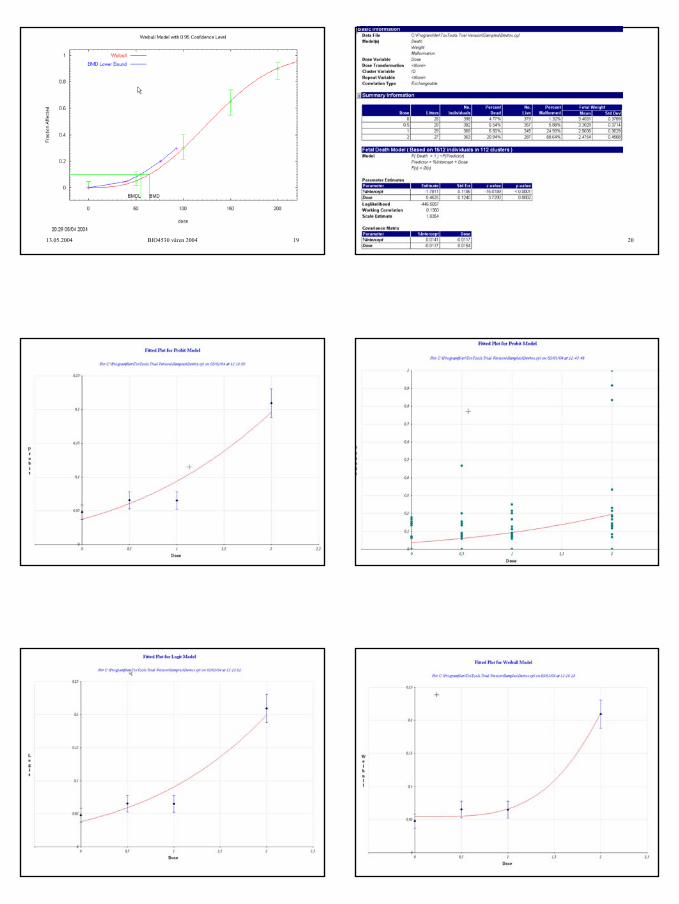
Weibull ModelThe form of the probability function is: P[response] = background + (1-background)*[1-EXP(-slope*dose^power)]
4
13.05.2004 BIO4530 våren 2004 19 13.05.2004 BIO4530 våren 2004 20
13.05.2004 BIO4530 våren 2004 21 13.05.2004 BIO4530 våren 2004 22
13.05.2004 BIO4530 våren 2004 23 13.05.2004 BIO4530 våren 2004 24

5
13.05.2004 BIO4530 våren 2004 25 13.05.2004 BIO4530 våren 2004 26
13.05.2004 BIO4530 våren 2004 27 13.05.2004 BIO4530 våren 2004 28
13.05.2004 BIO4530 våren 2004 29 13.05.2004 BIO4530 våren 2004 30
6
13.05.2004 BIO4530 våren 2004 31 13.05.2004 BIO4530 våren 2004 32
13.05.2004 BIO4530 våren 2004 33 13.05.2004 BIO4530 våren 2004 34
13.05.2004 BIO4530 våren 2004 35 13.05.2004 BIO4530 våren 2004 36
7
13.05.2004 BIO4530 våren 2004 37 13.05.2004 BIO4530 våren 2004 38
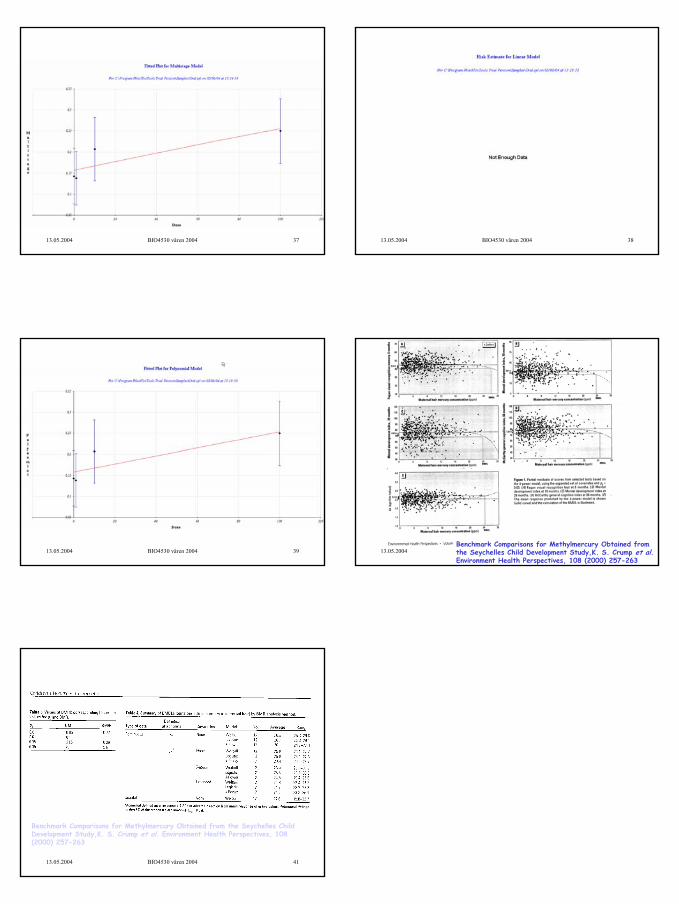
13.05.2004 BIO4530 våren 2004 39 13.05.2004 BIO4530 våren 2004 40Benchmark Comparisons for Methylmercury Obtained from the Seychelles Child Development Study,K. S. Crump et al.Environment Health Perspectives, 108 (2000) 257-263
13.05.2004 BIO4530 våren 2004 41
Benchmark Comparisons for Methylmercury Obtained from the Seychelles ChildDevelopment Study,K. S. Crump et al. Environment Health Perspectives, 108 (2000) 257-263

1
13.05.2004 BIO4530 våren 2004 1
Struktur og aktivitet -SAR/QSAR(Quantitative Structure ActivityRelationship)
Struktur og aktivitet Struktur og aktivitet --SAR/QSARSAR/QSAR((QuantitativeQuantitative StructureStructure ActivityActivityRelationshipRelationship))
457
8
9
10
L Region K-Region
BayRegion
7811
12
1314
FjordRegion
CH3
CH3
12
3
4
Distorted Bay Region
Benzo(a)pyrene Dibenzo(a,l)pyrene 7,12 Dimethyl-benz(a)anthracene
O
OH
OH .
..
O
OH
OH
.
.
.BIO4530 BIO4530 RegulatoriskRegulatoriskToksikologiToksikologiSteinar ØvrebøSteinar Øvrebø
13.05.2004 BIO4530 våren 2004 2
Hvorfor teste med QSAR/SAR?
- Prisen for å teste et stoff i et karsinogenisitetsbioassay med gnager er 7 – 14 millioner NOK og det tar fra 3 til 5 år
- Prisen for å komme fram til første trinn i markedsføringen av legemidler svært høy. Og syntese og aktivitets testing av mulige legemidler er svært kostbart
- QSAR som en metode isteden for dyreforsøk, er også ønskelig fra et dyreetisk perspektiv
13.05.2004 BIO4530 våren 2004 3
Quantitative Structure Activity Relationship(QSAR)
• Metode til å forutsi toksisiteten til et stoff• Metode til å anslå farmakologiske egenskaper av et stoff• Adsorption, distribution, metabolism and elimination (ADME)
13.05.2004 BIO4530 våren 2004 4
SAR og QSAR
• Structure activity relationaship er basert på at strukturen til en forbindelse er related(henger sammen med - står i forhold til) forbindelsen sin struktur• SAR har vært benyttet i farmasøytisk industri for forutsi reseptor binding• Eksempel influensamedisin, Relenza• QSAR - basert på LD50 fra over 2000 stoffer kunne forutsi LD50 innenfor en faktor på 8 den ’virkelige’ for 95% av forbindelsene
13.05.2004 BIO4530 våren 2004 5
Depiction of interaction of Relenza (GG 167) in the neuraminidase binding site
13.05.2004 BIO4530 våren 2004 6
• QSAR brukes til forutsi toksisiteten når det ikke finnes eksperimentelle- eller observasjonsdata om stoffets toksisitet• Spesielt aktuelt når det er behov for vurdering etter en ulykke• Også ved vurdering av toksistiteten når eksponeringen er svært lav
Når er det aktuelt å benytte QSAR

2
13.05.2004 BIO4530 våren 2004 7
• Struktur• Løselighet• Stabilitet• pH følsomhet• Elektrofilisitet• Flyktighet• Kjemisk reaktivitet
Faktorer med betydning for biologisk aktivitet
13.05.2004 BIO4530 våren 2004 8
13.05.2004 BIO4530 våren 2004 9
Benzo[a]pyreneO
Benzo[a]pyrene-7,8-epoxide
OH
OH
H4-Benzo[a]pyrene-7,8-diol
H4-Benzo[a]pyrene-7,8-oxide
O
OH
OH
Benzo[a]pyrene-7,8-dihydrodiol
Ulik
e B[
Ulik
e B[
aa ]P ]P
met
abolitte
rs
met
abolitte
rs
kref
tfre
mka
llkr
eftf
remka
llen
de e
vne
ende
evn
e
13.05.2004 BIO4530 våren 2004 10
(a) alkyl esters (b) aromatic nitro (c) aromatic azo groups (d) aromatic ring N-oxides (e) aromatic mono- and dialkylamino (i) alkyl hydrazines (g)alkylaldehydes, (h) N-methylol derivatives (i) monohaloalkenes (j) a large family of N and S mustards (k) N-chloramines (l) propiolactones and propiosultones (m) aromatic and aliphatic (n) both aromatic and aliphatic substituted M
utage nici ty
13.05.2004 BIO4530 våren 2004 11
Bay region
L region K region
Bay, l and K region of PAH compounds
OOH
OH
O
OH
OH
O
OHOH
OOH
OHO
OHOH
CH3
CH3
O
OH
OH
Phenanthrenediol-epoxide
Benz[a]anthracenediol-epoxide
Chrysenediol-epoxide
7,12-Dimethyl Benz[a]anthracene diol-epoxide
Benzo[a]pyrenediol-epoxide
Dibenz[a,h]anthracenediol-epoxide
Bay region Bay regionBay region
Bay region
Bay regionBay region Bay region
OHOH
O
O
OHOH
Bay region
Bay-region BaP-diolepoxide Non-bay-region BaP-diolepoxide
Structures of bay-region diol-epoxides of several PAHs
EpoxiderEpoxidernær nær baybayregionen regionen antas å være antas å være kreftkreft--fremkallende fremkallende
IL+ SS+ LL+
SS+ SS+ pluss
13.05.2004 BIO4530 våren 2004 12
Cl
Cl
Cl Cl
Cl
Cl
O
Cl
ClCl
Cl
O
OCl
Cl Cl
Cl
TEF TEF -- ToxicologicalToxicological EquivalenceEquivalence FactorFactor

3
13.05.2004 BIO4530 våren 2004 13
PAH-forbindelse Nisbet ogLaGoy, 1992
Thorslund ogFarrer, 1991
US EPA(1984)1
Larsen ogLarsen, 1998
OEHHA,1994
Naftalen 0,001 ND 0Acenaftylen 0,001 ND 0Acenaften 0,001 ND 0Fluoren 0,001 ND 0Fenantren 0,001 ND 0 0,0005Antracen 0,01 ND 0 0,0005Fluoranten 0,001 ND 0 0,05Pyren 0,001 ND 0 0,001Benz[c]fenantren 0,023Benzo[a]antracen 0,1 0,145 1 0,005 0,1Krysen 0,01 0,0044 1 0,03 0,01Benzo[a]pyren 1 1 1 1 1Benzo[e]pyren 0,002Dibenzo[a,h]antrazen 1 1,11 1 1,1Antantren 0,3Benzo[ghi]perylen 0,01| 0,021 1 0,02Benzo[b]fluoranten 0,1 0,12 1 0,1 0,1Benzo[j]fluoranten 0,1 0,12 1 0,05 0,1Benzo[k]fluoranten 0,1 0,052 1 0,02 0,1Cyclopenta[cd]pyrene 0,02Dibenz[a,h]acridin 0,1Dibenz[a,j]acridin 0,17H-Dibenzo[c,g]carbazol 1,0Dibenzo[a,e]pyren 0,2 1,0Dibenzo[a,h]pyren 1 10Dibenzo[a,i]pyren 0,1 10Dibenzo[a,l]pyren 1 10Indeno[1,2,3-c,d]pyren 0,1 0,278 1 0,1 0,15-Methylkrysen 1,06-Nitrokrysen 101-Nitropyren 0,14-Nitropyren 0,12-Nitrofluoren 0,01
TEF for PAH
TEF for PAH
13.05.2004 BIO4530 våren 2004 14
Basic Concepts and Aims of QSAR-Studies W. KarcherQUANTITATIVE STRUCTURE/ACTIVITY RELATIONSHIPS (QSAR) IN TOXICOIOCYPavia, May 24-25, 1991Edited by T. Coccini, L Glannonl, W. Karcher, L. Manzo, R. Rol JOINT RESEARCH CENTRE COMMISSION OF THE EUROPEAN COMMUNITIES
13.05.2004 BIO4530 våren 2004 15
FactualData banks
LiteratureData bases
Physiochemical Properties
- log P- water solubility- vapour pressure- Henry coefficient- etc
Biological Activities
- acute toxicity- bioaccumulation- biodegradation
Limitingfactors- sample size- accuracy- experimental
conditions
Training Set
13.05.2004 BIO4530 våren 2004 16
MolecularDescriptors
TopologicalDescriptors Advantages Disadvantages
- molecularconnectivity- information content- (autocorrelationvectors)
PhysochemicalDescriptors
- log P- Henry coefficient- stericparameters- electronic param.
Advantages Disadvantages
- available for all org. structures- easy to computer
- difficult in interpretation
- firmphysicochemical basis
- scarceavailable
13.05.2004 BIO4530 våren 2004 17
QuantitativeApproach(QSAR)
Regression Analysis Advantages
StatisticalAnalysis
Disadvantages
QualitativeApproach(SAR)
MultivariateAnalysis Advantages Disadvantages
- quantitativeprediction- easy to understand- simple calculations
- requirespreciseinput data
- PCA- DA- CFA- Simca
- low precisiondata sufficient(n=unlimited)
- difficult to interprete- requiresubstantialcomputing efforts 13.05.2004 BIO4530 våren 2004 18
Testing Set Validation of the Model(s)
Testing on a large sample
pool
Limits of the Model(s)
Testing on data obtainedunder varyingexperimentalconditions
Validation through testing set

4
13.05.2004 BIO4530 våren 2004 19
Estimated properties Prediction level Accuracyor activities
1. Physicochemical properties quantitative +/-25-50% 2. Bioconcentration Factor, Toxicity quantitative order of magnitude 3. Mutagenicity/Carcinogenicity qualitative variable
Accuracy range of QSAR/SAR predictions
13.05.2004 BIO4530 våren 2004 20
Observert og beregnet 14 prøver
13.05.2004 BIO4530 våren 2004 21 13.05.2004 BIO4530 våren 2004 22
Biologisk aktivitet er en funksjon av kjemisk struktur
Crum-Brown Fraser i 1868
Φ = f(C)
Moderne QSAR startet i 1964 med publikasjoner av:Hansch og FujitaogFree og Wilson
Begynnelsen av QSAR
13.05.2004 BIO4530 våren 2004 23
Free-Wilson Analysis
X2
X4
X6
Variable fragments
Parent structure
Standard substituent
Standard substituent
Standard substituent
Parent structure
Original Free-Wilson Analysis Fujita-Ban variant of Free-Wilson Analysis
log Bri = µ + bijkzjk
Bri =Biological response of the ith moleculeµ =activity contribution of the parent structurezjk=activity contribution of the jth substituent in the kth position of
substitutionbijk=indicates the occurence of of substitutents in each compound
=1 for compounds i, if the jth substitution in the kth position of substitution occurs in this compound 13.05.2004 BIO4530 våren 2004 24
OOH OH ONH2
OY
X R
OH
N ME2
OHR = H, Me
X = NO2, CL, Br
Y = NO2, NH2, CH3CONH
Free-Wilson
Free-Wilson Matrix for the Compounds in Figurebijk
i R-H R-Me X-NO2 X-Cl X-Br Y-NO2 Y-NH2 YMeCONH log 1/C1 1 0 1 0 0 1 0 0 1.782 1 0 0 1 0 1 0 0 1.323 1 0 0 0 1 1 0 0 1.184 1 0 0 1 0 0 1 0 2.725 1 0 0 0 1 0 1 0 2.516 1 0 1 0 0 0 1 0 2.447 0 1 1 0 0 0 1 0 2.208 0 1 1 0 0 0 0 1 1.189 0 1 0 0 1 0 1 0 2.1510 0 1 0 0 1 0 0 1 1.88
5
13.05.2004 BIO4530 våren 2004 25
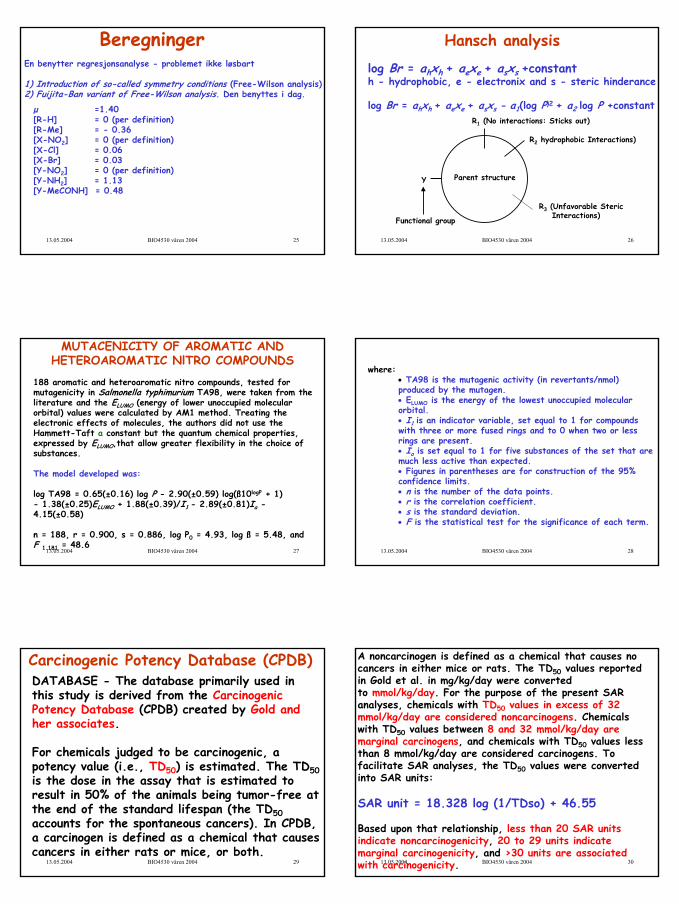
BeregningerEn benytter regresjonsanalyse - problemet ikke løsbart
1) Introduction of so-called symmetry conditions (Free-Wilson analysis)2) Fuijita-Ban variant of Free-Wilson analysis. Den benyttes i dag.
µ =1.40[R-H] = 0 (per definition)[R-Me] = - 0.36[X-NO2] = 0 (per definition)[X-Cl] = 0.06[X-Br] = 0.03[Y-NO2] = 0 (per definition)[Y-NH2] = 1.13[Y-MeCONH] = 0.48
13.05.2004 BIO4530 våren 2004 26
Hansch analysis
log Br = ahxh + aexe + asxs +constant h - hydrophobic, e - electronix and s - steric hinderance
log Br = ahxh + aexe + asxs - a1(log P)2 + a2 log P +constant
Parent structure
R1 (No interactions: Sticks out)
R2 hydrophobic Interactions)
R3 (Unfavorable StericInteractions)Functional group
Y
13.05.2004 BIO4530 våren 2004 27
188 aromatic and heteroaromatic nitro compounds, tested for mutagenicity in Salmonella typhimurium TA98, were taken from the literature and the ELUMO (energy of lower unoccupied molecular orbital) values were calculated by AM1 method. Treating the electronic effects of molecules, the authors did not use the Hammett-Taft a constant but the quantum chemical properties, expressed by ELUMO,that allow greater flexibility in the choice of substances.
The model developed was:
log TA98 = 0.65(±0.16) log P - 2.90(±0.59) log(ß10logP + 1)- 1.38(±0.25)ELUMO + 1.88(±0.39)/I1 - 2.89(±0.81)Ia -4.15(±0.58)
n = 188, r = 0.900, s = 0.886, log P0 = 4.93, log ß = 5.48, andF 1.181 = 48.6
MUTACENICITY OF AROMATIC AND HETEROAROMATIC NlTRO COMPOUNDS
13.05.2004 BIO4530 våren 2004 28
where:• TA98 is the mutagenic activity (in revertants/nmol) produced by the mutagen.• ELUMO is the energy of the lowest unoccupied molecular orbital.• I1 is an indicator variable, set equal to 1 for compounds with three or more fused rings and to 0 when two or less rings are present.• Ia is set equal to 1 for five substances of the set that are much less active than expected.• Figures in parentheses are for construction of the 95% confidence limits.• n is the number of the data points.• r is the correlation coefficient.• s is the standard deviation.• F is the statistical test for the significance of each term.
13.05.2004 BIO4530 våren 2004 29
DATABASE - The database primarily used in this study is derived from the Carcinogenic Potency Database (CPDB) created by Gold and her associates.
For chemicals judged to be carcinogenic, a potency value (i.e., TD50) is estimated. The TD50is the dose in the assay that is estimated to result in 50% of the animals being tumor-free at the end of the standard lifespan (the TD50accounts for the spontaneous cancers). In CPDB, a carcinogen is defined as a chemical that causes cancers in either rats or mice, or both.
Carcinogenic Potency Database (CPDB)
13.05.2004 BIO4530 våren 2004 30
A noncarcinogen is defined as a chemical that causes no cancers in either mice or rats. The TD50 values reported in Gold et al. in mg/kg/day were converted to mmol/kg/day. For the purpose of the present SAR analyses, chemicals with TD50 values in excess of 32 mmol/kg/day are considered noncarcinogens. Chemicals with TD50 values between 8 and 32 mmol/kg/day are marginal carcinogens, and chemicals with TD50 values less than 8 mmol/kg/day are considered carcinogens. To facilitate SAR analyses, the TD50 values were converted into SAR units:
SAR unit = 18.328 log (1/TDso) + 46.55
Based upon that relationship, less than 20 SAR units indicate noncarcinogenicity, 20 to 29 units indicate marginal carcinogenicity, and >30 units are associated with carcinogenicity.

6
13.05.2004 BIO4530 våren 2004 31
Isvalid
experimentalendpointavailable?
Continue PrioritySetting by usingdefault values
Isanalogdata
available?
Isappropriateand validQSAR
available?
Continue PrioritySettingprocess
Continue PrioritySettingprocess
Continue PrioritySetting by using
1 Expert judgement2 Default values
Use of QSARs in priority setting