Embed Size (px)
Citation preview

1978
National Cancer Institute CARCINOGENESIS Technical Report Series No. 114
BIOASSAY OF
2,3,5,6-TETRACHLORO-4-NITROANISOLE FOR POSSIBLE CARCINOGENICITY
CAS No. 2438-88-2
NCI-CG-TR-114
U.S. DEPARTMENT OF HEALTH, EDUCATION, AND WELFARE Public Health Service National Institutes of Health

BIOASSAY OF
2,3,5,6-TETRACHLORO-4-NITROANISOLE
FOR POSSIBLE CARCINOGENICITY
Carcinogenesis Testing Program Division of Cancer Cause and Prevention
National Cancer Institute National Institutes of Health
Bethesda, Maryland 20014
U.S. DEPARTMENT OF HEALTH, EDUCATION, AND WELFARE Public Health Service
National Institutes of Health
DHEW Publication No. (NIH) 78-1369


REPORT ON THE BIOASSAY OF 2,3,5,6-TETRACHLORO-4-NITROANISOLE FOR POSSIBLE CARCINOGENICITY
CARCINOGENESIS TESTING PROGRAM DIVISION OF CANCER CAUSE AND PREVENTION
NATIONAL CANCER INSTITUTE, NATIONAL INSTITUTES OF HEALTH
FOREWORD: This report presents the results of the bioassay of 2,3,5,6-tetrachloro-4-nitroanisole conducted for the Carcinogenesis Testing Program, Division of Cancer Cause and Prevention, National Cancer Institute (NCI), National Institutes of Health, Bethesda, Maryland. This is one of a series of experiments designed to determine whether selected chemicals have the capacity to produce cancer in animals. Negative results, in which the test animals do not have a significantly greater incidence of cancer than control animals, do not necessarily mean the test chemical is not a carcinogen because the experiments are conducted under a limited set of circumstances. Positive results demonstrate that the test chemical is carcinogenic for animals under the conditions of the test and indicate a potential risk to man. The actual determination of the risk to man from animal carcinogens requires a wider analysis.
CONTRIBUTORS: This bioassay of 2,3,5,6-tetrachloro-4-nitroanisole was conducted by Mason Research Institute, Worcester, Massachusetts, initially under direct contract to the NCI and currently under a subcontract to Tracer Jitco, Inc., prime contractor for the NCI Carcinogenesis Testing Program.
The experimental design was determined by the NCI Project Officers, Dr. J. H. Weisburger (1,2) and Dr. E. K. Weisburger (1). The principal investigators for the contract were Dr. E. Smith (3) and Dr. A. Handler (3). Animal treatment and observation were supervised by Mr. G. Wade (3) and Ms. E. Zepp (3). Chemical analysis was performed by Mason Research Institute (3) and Midwest Research Institute (4) and the analytical results were reviewed by Dr. N. Zimmerman (5).
Histopathologic examinations were performed by Dr. R. L. Schueler (6) as a consultant for Mason Research Institute, and the diagnoses included in this report represent the interpretation of this pathologist.
Compilation of individual animal survival, pathology, and summary tables was performed by EG&G Mason Research Institute (7); the statistical analysis was performed by Mr. W. W. Belew (5,8), using methods selected for the Carcinogenesis Testing Program by Dr. J. J. Gart (9).
iii

This report was prepared at METREK, a Division of The MITRE Corporation (5) under the direction of the NCI. Those responsible for this report at METREK are the project coordinator, Dr. L. W. Thomas (5), task leader Dr. M. R. Kornreich (5,10), senior biologist Ms. P. Walker (5), biochemist Mr. S. C. Drill (5), and technical editor Ms. P. A. Miller (5). The final report was reviewed by members of the participating organizations.
The following other scientists at the National Cancer Institute were responsible for evaluating the bioassay experiment, interpreting the results, and reporting the findings: Dr. K. C. Chu (1), Dr. C. Cueto, Jr. (1), Dr. J. F. Douglas (1), Dr. D. G. Goodman (1,10), Dr. R. A. Griesemer (1), Dr. M. H. Levitt (1), Dr. H. A. Milman (1), Dr. T. W. Orme (1), Dr. R. A. Squire (1,11), Dr. S. F. Stinson (1), Dr. J. M. Ward (1), and Dr. C. E. Whitmire (1).
1. Carcinogenesis Testing Program, Division of Cancer Cause and Prevention, National Cancer Institute, National Institutes of Health, Bethesda, Maryland.
2. Now with the Naylor Dana Institute for Disease Prevention, American Health Foundation, Hammon House Road, Valhalla, New York.
3. Mason Research Institute, 57 Union Street, Worcester, Massachusetts.
4. Midwest Research Institute, 425 Volker Boulevard, Kansas City, Missouri.
5. The MITRE Corporation, METREK Division, 1820 Dolley Madison Boulevard, McLean, Virginia.
6. Tracer Jitco, Inc., 1776 East Jefferson Street, Rockville, Maryland.
7. EG&G Mason Research Institute, 1530 East Jefferson Street, Rockville, Maryland.
8. Now with the Solar Energy Research Institute, Cole Boulevard, Golden, Colorado.
9. Mathematical Statistics and Applied Mathematics Section, Biometry Branch, Field Studies and Statistics Program, Division of Cancer Cause and Prevention, National Cancer Institute, National Institutes of Health, Bethesda, Maryland.
IV

10. Now with Clement Associates, Inc., 1010 Wisconsin Avenue, N.W., Washington, D.C.
11. Now with the Division of Comparative Medicine, Johns Hopkins University, School of Medicine, Traylor Building, Baltimore, Maryland.


SUMMARY
A bioassay for possible carcinogenicity of 2,3,5,6-tetrachloro4-nitroanisole was conducted using Fischer 344 rats and B6C3F1 mice. 2,3,5,6-Tetrachloro-4-nitroanisole was administered in the feed, at either of two concentrations, to groups of male and female animals of each species. The high and low dietary concentrations used in the chronic bioassay were 0.012 and 0.006 percent, respectively, for both species. After a 104-week period of chemical administration, observation of rats continued for up to 3 weeks and observation of mice continued for up to 1 week. For rats 50 animals of each sex were placed on test as controls, while for mice 55 animals of each sex were placed on test as controls.
There were no significant positive associations between the dietary concentration of 2,3,5,6-tetrachloro-4-nitroanisole administered and mortality in rats or mice of either sex. Adequate numbers of animals in all groups survived sufficiently long to be at risk from late-developing tumors.
No neoplasms, except for interstitial-cell testicular tumors in males, occurred at statistically significant incidences in dosed rats. Because of the high and variable spontaneous incidence of these lesions in Fischer 344 rats, these tumors were not considered to be associated with the administration of the test compound.
Among dosed male mice the combined incidence of leukemia and malignant lymphoma was statistically significant. However, since these lesions occur spontaneously and with high variation in B6C3F1 mice, the lesions were not considered to be associated with the administration of the test compound. No neoplasms were of a statistically significant incidence in dosed female mice.
Under the conditions of this bioassay, dietary administration of 2,3,5,6-tetrachloro-4-nitroanisole was not carcinogenic to male or female Fischer 344 rats or B6C3F1 mice of either sex.
vii


TABLE OF CONTENTS
Page
I. INTRODUCTION 1
II. MATERIALS AND METHODS 4
A. Chemicals 4 B. Dietary Preparation 4 C. Animals 5 D. Animal Maintenance 6 E. Selection of Initial Concentrations 8 F. Experimental Design 10 G. Clinical and Histopathologic Examinations 13 H. Data Recording and Statistical Analyses 15
III. CHRONIC TESTING RESULTS: RATS 20
A. Body Weights and Clinical Observations 20 B. Survival 20 C. Pathology 23 D. Statistical Analyses of Results 24
IV. CHRONIC TESTING RESULTS: MICE 34
A. Body Weights and Clinical Observations 34 B. Survival 34 C. Pathology 37 D. Statistical Analyses of Results 39
V. DISCUSSION 48
VI. BIBLIOGRAPHY 50
APPENDIX A SUMMARY OF THE INCIDENCE OF NEOPLASMS IN RATS TREATED WITH 2,3,5,6-TETRACHLORO-4NITROANISOLE A-l
APPENDIX B SUMMARY OF THE INCIDENCE OF NEOPLASMS IN MICE TREATED WITH 2,3,5,6-TETRACHLORO-4NITROANISOLE B-l
APPENDIX C SUMMARY OF THE INCIDENCE OF NONNEOPLASTIC LESIONS IN RATS TREATED WITH 2,3,5,6TETRACHLORO-4-NITROANISOLE C-l
ix

D-l
TABLE OF CONTENTS (Concluded)
APPENDIX D SUMMARY OF THE INCIDENCE OF NONNEOPLASTIC LESIONS IN MICE TREATED WITH 2,3,5,6TETRACHLORO-4-NITROANISOLE
x
Figure Number
1
Table Number
LIST OF ILLUSTRATIONS
Page
CHEMICAL STRUCTURE OF 2 ,3 ,5 ,6-TETRACHLORO-4NITROANISOLE
GROWTH CURVES FOR 2 ,3,5,6-TETRACHLORO-4NITROANISOLE CHRONIC STUDY RATS 21
SURVIVAL COMPARISONS OF 2,3,5,6-TETRACHLORO-4-NITROANISOLE CHRONIC STUDY RATS 22
GROWTH CURVES FOR 2,3,5,6-TETRACHLORO-4NITROANISOLE CHRONIC STUDY MICE 35
SURVIVAL COMPARISONS OF 2,3,5,6-TETRACHLORO-4-NITROANISOLE CHRONIC STUDY MICE 36
LIST OF TABLES
DESIGN SUMMARY FOR FISCHER 344 RATS—2 ,3 ,5 ,6-TETRACHLORO-4-NITROANISOLE FEEDING EXPERIMENT 11
DESIGN SUMMARY FOR B6C3F1 MICE--2 ,3,5,6TETRACHLORO-4-NITROANISOLE FEEDING EXPERIMENT 12
ANALYSES OF THE INCIDENCE OF PRIMARY TUMORS AT SPECIFIC SITES IN MALE RATS TREATED WITH 2,3,5,6-TETRACHLORO-4-NITROANISOLE 25
ANALYSES OF THE INCIDENCE OF PRIMARY TUMORS AT SPECIFIC SITES IN FEMALE RATS TREATED WITH 2,3,5,6-TETRACHLORO-4-NITROANISOLE 29
ANALYSES OF THE INCIDENCE OF PRIMARY TUMORS AT SPECIFIC SITES IN MALE MICE TREATED WITH 2,3,5,6-TETRACHLORO-4-NITROANISOLE 40
ANALYSES OF THE INCIDENCE OF PRIMARY TUMORS AT SPECIFIC SITES IN FEMALE MICE TREATED WITH 2,3,5,6-TETRACHLORO-4-NITROANISOLE 44
XI

LIST OF TABLES (Concluded)
Table Number Page
Al SUMMARY OF THE INCIDENCE OF NEOPLASMS IN MALE RATS TREATED WITH 2,3,5,6-TETRACHLORO4-NITROANISOLE A-3
A2 SUMMARY OF THE INCIDENCE OF NEOPLASMS IN FEMALE RATS TREATED WITH 2,3,5,6-TETRACHLORO-4-NITROANISOLE A-7
Bl SUMMARY OF THE INCIDENCE OF NEOPLASMS IN MALE MICE TREATED WITH 2,3,5,6-TETRACHLORO-4-NITROANISOLE B-3
B2 SUMMARY OF THE INCIDENCE OF NEOPLASMS IN FEMALE MICE TREATED WITH 2,3,5,6-TETRACHLORO-4-NITROANISOLE B-7
Cl SUMMARY OF THE INCIDENCE OF NONNEOPLASTIC LESIONS IN MALE RATS TREATED WITH 2,3,5,6TETRACHLORO-4-NITROANISOLE C-3
C2 SUMMARY OF THE INCIDENCE OF NONNEOPLASTIC LESIONS IN FEMALE RATS TREATED WITH 2,3,5,6TETRACHLORO-4-NITROANISOLE C-9
Dl SUMMARY OF THE INCIDENCE OF NONNEOPLASTIC LESIONS IN MALE MICE TREATED WITH 2,3,5,6TETRACHLORO-4-NITROANISOLE D-3
D2 SUMMARY OF THE INCIDENCE OF NONNEOPLASTIC LESIONS IN FEMALE MICE TREATED WITH 2,3,5,6TETRACHLORO-4-NITROANISOLE D-8
xii

I. INTRODUCTION
2,3,5,6-Tetrachloro-4-nitroanisole (Figure 1) (NCI No. C03032),
an agricultural fungicide and acaricide, was selected for bioassay by
the National Cancer Institute because of its structural similarity to
pentachloronitrobenzene, a pesticide classified as tumorigenic by the
Secretary's Commission on Pesticides and their Relationship to Environ
mental Health (U.S. Department of Health, Education, and Welfare, 1969).
The Chemical Abstracts Service (CAS) Ninth Collective Index
(1977) name for this compound is l-methoxy-4-nitro-2,3 ,5,6-tetrachlo
* robenzene. It is also known as tetrachloronitroanisole; ENT 22335;
and TCNA.
2,3,5,6-Tetrachloro-4-nitroanisole has been shown to control
fungi which cause flag smut of winter wheat (Purdy, 1963) and rust,
root and stem rot, and wilt in a variety of vegetables and grains
(Carey, 1963). The compound's singular effectiveness against flag
smut is a result of its ability to control infections arising from
both seed-borne and soil-borne flag smut spores (Purdy, 1963).
Nonetheless, 2,3,5,6-tetrachloro-4-nitroanisole is not currently
registered as a pesticide in the United States (Schaughnessy, 1977).
Although specific production figures for 2,3 ,5,6-tetrachloro-4
nitroanisole are not available, its exclusion from Synthetic Organic
* The CAS registry number is 2438-88-2.

OCH
FIGURE 1 CHEMICAL STRUCTURE OF 2,3,5,6-TETRACHLORO-4-NITROANISOLE

Chemicals: United States Production and Sales, 1975 (U.S. Interna
tional Trade Commission, 1977) implies that it is not produced in
commercial quantities in the United States.
Since 2,3,5,6-tetrachloro-4-nitroanisole is not in present use
as a pesticide, the potential for exposure is greatest for those per
sons engaged in the synthesis of 2,3,5,6-tetrachloro-4-nitroanisole
or in agricultural research involving 2,3,5,6-tetrachloro-4-nitroani
sole.

II. MATERIALS AND METHODS
A. Chemicals
2,3,5,6-Tetrachloro-4-nitroanisole was purchased from Carroll
Products, Wood River Junction, Rhode Island. Chemical analysis was
performed by Mason Research Institute, Worcester, Massachusetts and
Midwest Research Institute, Kansas City, Missouri. The experimentally
determined melting point range was 101° to 105°C. Two differing
literature values (i.e., 105° to 106°C [Berckmans and Halleman, 1925]
and 112° to 113°C [Peters et al., 1943]) were found with no adequate
explanation for the variation. Elemental analysis of the purchased
compound suggested the presence of at least minor impurities. Thin-
layer chromatography utilizing two solvent systems (i.e., ethyl
acetate:hexane and benzene:chloroform) revealed, respectively, two
spots and one spot. Vapor-phase chromatography indicated two impu
rities of motility similar to the major compound. Nuclear magnetic
resonance and infrared analyses were consistent with the structure of
the compound.
Throughout this report, the term 2,3,5,6-tetrachloro-4-nitroani
sole is used to refer to this compound.
B. Dietary Preparation
The basal laboratory diet for both dosed and control animals con
sisted of Wayne Lab-Blox®(Allied Mills, Inc., Chicago, Illinois).
2,3,5,6-Tetrachloro-4-nitroanisole was administered to the dosed ani
mals as a component of the diet.
4

The chemical was removed from its container and proper amounts
were sifted and weighed out under an exhaust hood. The compound was
blended in an aluminum bowl with an aliquot of the ground feed. Once
visual homogeneity was attained, the mixture was placed in a 6 kg
capacity Patterson-Kelley twin-shell stainless steel V-blender along
with the remainder of the meal. The blender was sealed and operated
for 20 minutes. The mixtures were placed in double plastic bags and
stored in the dark at 4°C. The mixture was prepared once weekly and
unused portions were discarded 14 days after formulation.
C. An ima1s
Two animal species, rats and mice, were used in the carcinogeni
city bioassay. Fischer 344 rats and B6C3F1 mice were obtained through
contracts of the Division of Cancer Treatment, National Cancer Insti
tute. All rats were supplied by Charles River Breeding Laboratories,
Wilmington, Massachusetts, and all mice were supplied by the Frederick
Cancer Research Center, Frederick, Maryland. Dosed and control ani
mals for both species were received in separate shipments.
Upon arrival, a sample of anima'ls was examined for parasites and
other signs of disease. One group of high dose male rats (group 2 as
defined in Section II. F., Experimental Design) had parasite infesta
tions and were treated with 3.0 gm piperazine adipate per liter in
drinking water for 3 days, followed by 3 days of tap water and 3 more
days of piperazine adipate administration. Animals to be used in the
chronic bioassay were quarantined by species for 2 weeks prior to

initiation of test. Animals were assigned to groups and distributed
among cages so that average body weight per cage was approximately
equal for a given sex and species.
D. Animal Maintenance
All animals were housed by species in rooms having a temperature
range of 23° to 34°C. Incoming air was filtered through Tri-Dek
(R) 15/40 denier Dacron^ filters (Tri-Dim Filter Corp., Hawthorne, New
Jersey) providing six changes of room air per hour. Fluorescent
lighting was provided on a 12-hour-daily cycle.
Rats were housed five per cage by sex. During quarantine and for
the first 12 months of study, dosed rats were held in galvanized- or
stainless-steel wire-mesh cages (Fenco Cage Products, Boston, Massa
chusetts) suspended over newspapers (except for the high dose group 2
males, which were housed in wire-mesh cages for the first 10 months).
Control rats were housed in wire-mesh cages for the first 14 months
of study. Newspapers under cages were replaced daily, and cages and
racks washed weekly. For the remainder of the study, all rats were
housed in suspended polycarbonate cages (Lab Products, Inc., Garfield,
New Jersey) equipped with disposable nonwoven fiber filter sheets.
® Clean bedding and cages were provided twice weekly. SAN-I-CEL corn
cob bedding (Paxton Processing Company, Paxton, Illinois) was used
for the first 6 months of polycarbonate caging. Aspen hardwood chip
bedding (American Excelsior Company, Baltimore, Maryland) was then
used for the remainder of the study. Stainless steel cage racks were

cleaned once every 2 weeks, and disposable filters were replaced at
that time.
Mice were housed five per cage by sex in polycarbonate shoe box
type cages. Cages were fitted with perforated stainless steel lids
(Lab Products, Inc.). Nonwoven fiber filter bonnets were used over
cage lids. Clean cages, lids, and bedding were provided twice per
(R) week. Bed-o-cobs corncob bedding (The Andersons Cob Division,
Maumee, Ohio) was used for the first 7 months of study for dosed
mice, and for the first 8 months of study for control mice. Aspen
bedding was used thereafter. Reusable filter bonnets and pipe racks
were sanitized every 2 weeks throughout the study.
Water was available ad libitum from 250 ml water bottles equipped
with rubber stoppers and stainless steel sipper tubes. Bottles were
replaced twice weekly and, for rats only, water was supplied as needed
between changes.
During the period of compound administration dosed animals were
(R) fed Wayne Lab-Blox meal containing the appropriate concentration of
2,3,5,6-tetrachloro-4-nitroanisole. Control animals received un
®treated meal. Food was supplied to rats in Alpine aluminum feed
cups (Curtin Matheson Scientific, Inc., Woburn, Massachusetts) while
they were in wire-mesh cages. While in polycarbonate cages, food was
supplied to rats from stainless steel gangstyle feed hoppers (Scien
tific Cages, Inc., Bryan, Texas). Food was supplied to dosed and
(R) control mice from Alpine feed cups for the first 1 and 2 months of

study, respectively, and from gangstyle hoppers thereafter. Food
hoppers were changed on the same schedule as were cages. Food was
t'Si replenished daily in Alpine feed cups.
All dosed and control rats were housed in a room with other
& rats receiving diets containing 4-chloro-o-phenylenediamine (95-83
0) ; acetylatninofluorene (53-96-3); p-cresidine (120-71-8); 4-chloro
m-phenylenediamine (5131-60-2); and IH-benzotriazole (95-14-7).
Dosed mice were housed in a room with other mice receiving
diets containing hydrazobenzene (530-50-7); tris(2,3-dibromopropyl)
phosphate (126-72-7); N-(l-naphthyl)ethylenediamine dihydrochloride
(1465-25-4); 2-chloro-p-phenylenediamine sulfate (61702-44-1); and
aniline hydrochloride (142-04-1). Control mice were housed in a room
with other mice receiving diets containing fenaminosulf (140-56-7);
2,5-dithiobiurea (142-46-1); 4-chloro-o-phenylenediamine (95-83-0);
o-anisidine hydrochloride (134-29-0); p-anisidine hydrochloride
(20265-97-8); and cupferron (135-20-6).
E. Selection of Initial Concentrations
In order to establish the maximum tolerated concentrations of
2,3,5,6-tetrachloro-4-nitroanisole for administration to dosed ani
mals in the chronic studies, subchronic toxicity tests were conducted
with both rats and mice. Rats were distributed among seven groups,
each consisting of five males and five females. 2,3,5,6-Tetrachloro
4-nitroanisole was incorporated into the basal laboratory diet and
* .CAS registry numbers are given in parentheses.

supplied ad libitum to seven of the eight rat groups in concentrations
of 0.003, 0.01, 0.025, 0.05, 0.1, 0.2, and 0.4 percent. Mice were
distributed among nine groups, each consisting of five males and five
females. The chemical was incorporated into the laboratory diet and
supplied ad libitum to eight of the nine mouse groups in concentra
tions of 0.003, 0.006, 0.0125, 0.025, 0.05, 0.1, 0.2, and 0.4 percent.
One rat group and one mouse group each served as a control group,
receiving only the basal laboratory diet. The dosed dietary prepara
tions were administered for 8 weeks. Individual body weights were
recorded during the first, fourth, and seventh weeks of the subchronic
study. Survivors were sacrificed at the end of the test, and gross
necropsies were performed.
The highest concentration causing no deaths, no compound-related
gross abnormalities, and no mean body weight depression in excess of
10 percent relative to controls during the 8-week subchronic test was
selected as the high concentration utilized for the chronic bioassay.
All rats receiving concentrations of 0.025 percent or more died.
Each male rat receiving a concentration of 0.025 percent or higher
had a spotted or colored liver or thymus. No gross pathology was
observed in female rats. A dietary concentration of 0.01 percent
produced a mean body weight depression of 8.2 percent in male rats
and no mean weight depression in female rats. The high concentration
selected for administration to rats in the chronic study was 0.012
percent.

All mice receiving concentrations of 0.1 percent or higher died.
Two male and three female mice receiving 0.05 percent died, and one
male mouse receiving 0.025 percent died. Mesenteric lymph nodes were
moderately enlarged in female mice receiving 0.025 percent. A di
etary concentration of 0.0125 produced mean body weight depressions
of 10.8 and 6.3 percent in male and female mice, respectively. A di
etary concentration of 0.006 percent produced mean body weight depres
sions of 10.0 and 7.2 percent in male and female mice, respectively.
The high concentration selected for administration to mice in the
chronic study was 0.012 percent.
F. Experimental Design
The experimental design parameters for the chronic bioassay (spe
cies, sex, group size, concentrations administered, and duration of
treated and untreated observation periods) are summarized in Tables 1
and 2.
All rats were approximately 6 weeks old at the time they were
placed on test. The concentrations of 2 ,3 ,5,6-tetrachloro-4-nitro
anisole in diets were 0.012 and 0.006 percent. Throughout this report
those rats receiving the former concentration are referred to as the
high dose groups and those receiving the latter concentration are
referred to as the low dose groups. The high dose male rat group was
improperly sexed, and all females that were included in the male group
were removed from the study. Therefore, approximately 6 weeks after
the start of the bioassay, a supplementary group of 25 male rats was
10

TABLE 1
DESIGN SUMMARY FOR FISCHER 344 RATS 2,3,5,6-TETRACHLORO-4-NITROANISOLE FEEDING EXPERIMENT
2,3,5,6-TETRACHLOROINITIAL 4-NITROANISOLE OBSERVATION PERIOD GROUP CONCENTRATION TREATED UNTREATED SIZE (PERCENT) (WEEKS) (WEEKS)
MALE
CONTROL 50 0 0 105
LOW DOSE 49 0.006 104 0 1
HIGH DOSE 1 24 0.012 104 0 1
HIGH DOSE 2 25 0.012 104 0 3
FEMALE
CONTROL 50 0 0 105
LOW DOSE 50 0.006 104 0 1
HIGH DOSE 50 0.012 104 0 2
Initiated approximately 6 weeks after the other male rat groups.
11

TABLE 2
DESIGN SUMMARY FOR B6C3F1 MICE 2,3,5,6-TETRACHLORO-4-NITROANISOLE FEEDING
2,3,5,6-TETRACHLOROINITIAL 4-NITROANISOLE GROUP CONCENTRATION SIZE (PERCENT)
MALE
CONTROL 55 0
LOW DOSE 55 0.006 0
HIGH DOSE 55 0.012 0
FEMALE
CONTROL 55 0
LOW DOSE 55 0.006 0
HIGH DOSE 55 0.012 0
12
EXPERIMENT
OBSERVATION PERIOD TREATED UNTREATED (WEEKS) (WEEKS)
0 105
104 0
104 1
0 105
104 1
104 1

added. These rats are referred to as the high dose male group 2,
while the male members of the original high dose male rat group are
referred to as high dose male group 1. The dosed rats were supplied
with feed containing 2,3,5,6-tetrachloro-4-nitroanisole for a total
of 104 weeks, followed by an observation period of up to 3 weeks.
All mice were approximately 6 weeks old at the time they were
placed on test. The dietary concentrations of 2 ,3 ,5 ,6-tetrachloro-4
nitroanisole administered were 0.012 and 0.006 percent. Throughout
this report those mice receiving the former concentration are referred
to as the high dose groups, while those receiving the latter concen
tration are referred to as the low dose groups. The dosed mice were
supplied with feed containing 2,3,5,6-tetrachloro-4-nitroanisole for
a total of 104 weeks, followed by an observation period of up to 1
week.
G. Clinical and Histopathologic Examinations
Animals were weighed immediately prior to initiation of the ex
periment. Body weights were recorded twice weekly for the first
12 weeks of the study and at monthly intervals thereafter. Food con
sumption, for two cages from each group, was monitored for seven con
secutive days once a month for the first nine months of the bioassay
and for three consecutive days each month thereafter. From the first
day, all animals were inspected twice daily for mortality. The pres
ence of tissue masses and lesions was determined by monthly observa
tion and palpation of each animal.
13

A necropsy was performed on each animal regardless of whether it
died, was killed when moribund, or was sacrificed at the end of the
bioassay. The animals were euthanized by carbon dioxide inhalation,
and were immediately necropsied. The histopathologic examination con
sisted of gross and microscopic examination of major tissues, organs,
and gross lesions taken from sacrificed animals and, whenever possible,
from animals found dead.
Tissues were preserved in 10 percent buffered formalin, embedded
in paraffin, sectioned, and stained with hematoxylin and eosin prior
to microscopic examination. An occasional section was subjected to
special staining techniques for more definitive diagnosis.
Slides were prepared from the following tissues: skin, subcuta
neous tissue, lungs and bronchi, trachea, bone marrow, spleen, lymph
nodes, thymus, heart, salivary gland, liver, gallbladder (mice), pan
creas, esophagus, stomach, small intestine, large intestine, kidney,
urinary bladder, pituitary, adrenal, thyroid, parathyroid, testis,
prostate, brain, uterus, mammary gland, and ovary.
A few tissues were not examined for some animals, particularly
for those that died early. Also, some animals were missing, canni
balized, or judged to be in such an advanced state of autolysis as to
preclude histopathologic interpretation. Thus, the number of animals
for which particular organs, tissues, or lesions were examined micro
scopically varies and does not necessarily represent the number of
animals that were placed on experiment in each group.
14

H. Data Recording and Statistical Analyses
Pertinent data on this experiment have been recorded in an auto
matic data processing system, the Carcinogenesis Bioassay Data System
(Linhart et al., 1974). The data elements include descriptive infor
mation on the chemicals, animals, experimental design, clinical ob
servations, survival, body weight, and individual pathologic results,
as recommended by the International Union Against Cancer (Berenblum,
1969). Data tables were generated for verification of data transcrip
tion and for statistical review.
These data were analyzed using the statistical techniques de
scribed in this section. Those analyses of the experimental results
that bear on the possibility of carcinogenicity are discussed in the
statistical narrative sections.
Probabilities of survival were estimated by the product-limit
procedure of Kaplan and Meier (1958) and are presented in this report
in the form of graphs. Animals were statistically censored as of the
time that they died of other than natural causes or were found to be
missing; animals dying from natural causes were not statistically
censored. Statistical analyses for a possible dose-related effect
on survival used the method of Cox (1972) when testing two groups for
equality and used Tarone's (1975) extensions of Cox's methods when
testing a dose-related trend. One-tailed P-values have been reported
for all tests except the departure from linearity test, which is only
reported when its two-tailed P-value is less than 0.05.
15

The incidence of neoplastic or nonneoplastic lesions has been
given as the ratio of the number of animals bearing such lesions at a
specific anatomic site (numerator) to the number of animals in which
that site was examined (denominator). In most instances, the denomi
nators included only those animals for which that site was examined
histologically. However, when macroscopic examination was required
to detect lesions prior to histologic sampling (e.g., skin or mammary
tumors), or when lesions could have appeared at multiple sites (e.g.,
lymphomas), the denominators consist of the numbers of animals necrop
sied.
The purpose of the statistical analyses of tumor incidence is to
determine whether animals receiving the test chemical developed a sig
nificantly higher proportion of tumors than did the control animals.
As a part of these analyses, the one-tailed Fisher exact test (Cox,
1970, pp. 48-52) was used to compare the tumor incidence of a control
group to that of a group of treated animals at each dose level. When
results for a number of treated groups, k, are compared simultaneously
with those for a control group, a correction to ensure an overall
significance level of 0.05 may be made. The Bonferroni inequality
(Miller, 1966, pp. 6-10) requires that the P-value for any comparison
be less than or equal to 0.05/k. In cases where this correction was
used, it is discussed in the narrative section. It is not, however,
presented in the tables, where the Fisher exact P-values are shown.
16
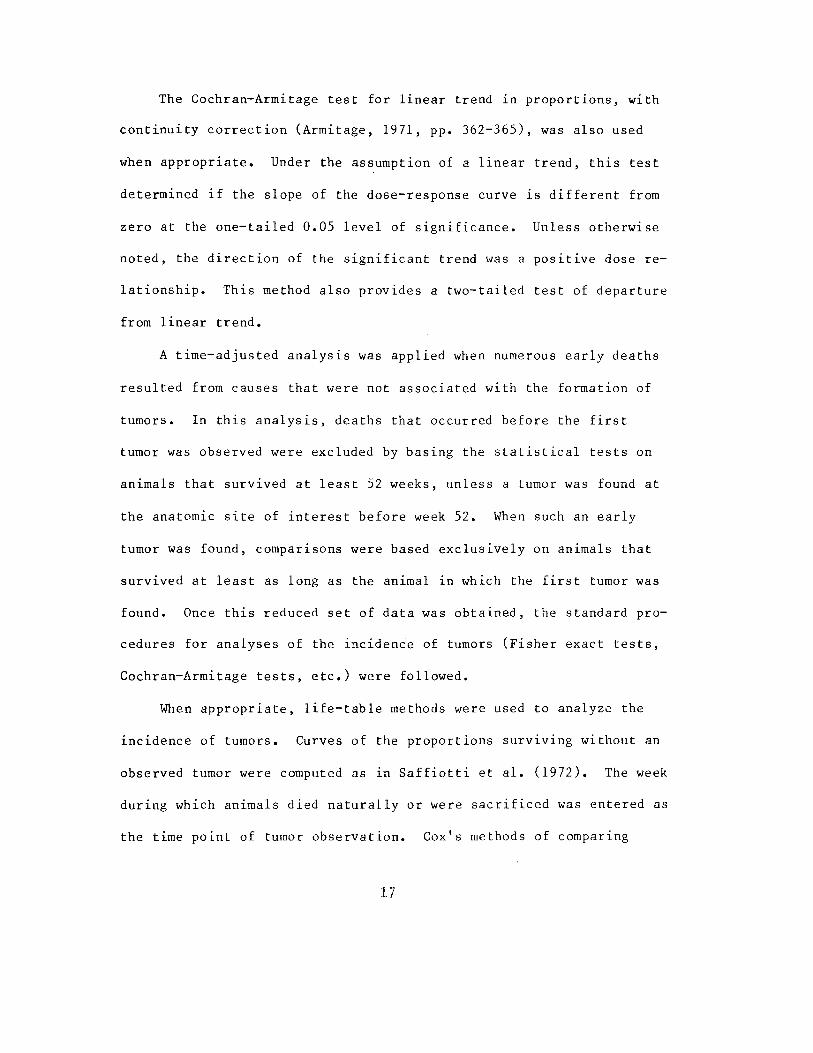
The Cochran-Armitage test for linear trend in proportions, with
continuity correction (Armitage, 1971, pp. 362-365), was also used
when appropriate. Under the assumption of a linear trend, this test
determined if the slope of the dose-response curve is different from
zero at the one-tailed 0.05 level of significance. Unless otherwise
noted, the direction of the significant trend was a positive close re
lationship. This method also provides a two-tailed test of departure
from linear trend.
A time-adjusted analysis was applied when numerous early deaths
resulted from causes that were not associated with the formation of
tumors. In this analysis, deaths that occurred before the first
tumor was observed were excluded by basing the statistical tests on
animals that survived at least 52 weeks, unless a tumor was found at
the anatomic site of interest before week 52. When such an early
tumor was found, comparisons were based exclusively on animals that
survived at least as long as the animal in which the first tumor was
found. Once this reduced set of data was obtained, the standard pro
cedures for analyses of the incidence of tumors (Fisher exact tests,
Cochran-Armitage tests, etc.) were followed.
When appropriate, life-table methods were used to analyze the
incidence of tumors. Curves of the proportions surviving without an
observed tumor were computed as in Saffiotti et al. (1972). The week
during which animals died naturally or were sacrificed was entered as
the time point of tumor observation. Cox's methods of comparing

these curves were used for two groups; Tarone's extension to testing
for linear trend was used for three groups. The statistical tests for
the incidence of tumors which used life-table methods were one-tailed
and, unless otherwise noted, in the direction of a positive dose
relationship. Significant departures from linearity (P < 0.05, two-
tailed test) were also noted.
The approximate 95 percent confidence interval for the relative
risk of each dosed group compared to its control was calculated from
the exact interval on the odds ratio (Gart, 1971). The relative risk
is defined as p /p where p is the true binomial probability of the t c t
incidence of a specific type of tumor in a treated group of animals
and p is the true probability of the spontaneous incidence of the c
same type of tumor in a control group. The hypothesis of equality
between the true proportion of a specific tumor in a treated group
and the proportion in a control group corresponds to a relative risk
of unity. Values in excess of unity represent the condition of a
larger proportion in the treated group than in the control.
The lower and upper limits of the confidence interval of the
relative risk have been included in the tables of statistical analy
ses. The interpretation of the limits is that in approximately 95
percent of a large number of identical experiments, the true ratio
of the risk in a treated group of animals to that in a control group
would be within the interval calculated from the experiment. When
the lower limit of the confidence interval is greater than one, it
18

can be inferred that a statistically significant result (a P < 0.025
one-tailed test when the control incidence is not zero, P < 0.050
when the control incidence is zero) has occurred. When the lower
limit is less than unity but the upper limit is greater than unity,
the lower limit indicates the absence of a significant result while
the upper limit indicates that there is a theoretical possibility
of the induction of tumors by the test chemical which could not be
detected under the conditions of this test.
19

III. CHRONIC TESTING RESULTS: RATS
A. Body Weights and Clinical Observations
Slight mean body weight depression was observed in dosed male
and female rats after 68 weeks (Figure 2).
Firm subcutaneous masses were observed in 1 control male, 7 high
dose females, and 3 control females. Cutaneous lesions were observed
in 2 low dose males, 3 control males, 2 high dose females, and 2 low
dose females. Pale discoloration of the eyes was observed in 1 high
dose male and 2 control males. Swollen, bloody eyes were observed
in a second high dose male. A dark crusted eye and exudate from the
nose were observed in a third high dose male. A swollen mouth was
displayed by 1 high dose male. A distended scrotal sac was observed
in 1 high dose male. Alopecia was observed in 1 high dose female.
No other clinical abnormalities were noted.
B. Survival
The estimated probabilities of survival for male and female rats
in the control and 2,3,5,6-tetrachloro-4-nitroanisole-dosed groups
are shown in Figure 3. For both male and female rats no significant
positive association between dosage and mortality was observed.
For each sex five control rats were sacrificed in week 78. Ade
quate numbers of males were at risk from late-developing tumors, as
88 percent (21/24) of high dose group 1, 68 percent (17/25) of high
dose group 2, 92 percent (46/50) of the low dose group, and 72 percent
20

750 750
— 600
^-450
— 300
1-150
60 75
TIME ON TEST (WEEKS)
120
750
600
FEMALE RATS CONTROL
LOW DOSE
HIGH DOSE
- 750
-600
IT a
450
UJ g
g 300
CD
-450
-300
150 — 150
I 15
I 30
r 45 60
\
75
TIME ON TEST (WEEKS)
90 \
105 120
FIGURE 2 GROWTH CURVES FOR 2,3,5,6-TETRACHLORO-4-NITROANISOLE CHRONIC STUDY RATS
21

— 1.0
Z g 0.8O Z
0.6 —
^0.4H ct CO
h- 0.2cc O Q-o o: o.
O.o-
O
D
Z 5 0.8o Z
D O X 0.6
i Z
^ 0.4oc
CO z: o H 0.2cc o CL
O tr a.
00
0
-0.8
-0.6
-0.4
CONTROL
MALE RATS
15 30 45 60 75
TIME ON TEST (WEEKS)
90
LOW DOSE
HIGH DOSE 2
HIGH DOSE 1
105
- 0.2
-0.0
120
J_ ^L««BB
,
• •••••••*••••••••
^^~I 1
1 f
j
L.t " "1
~>
— 1.0
-
— 0.8
— 06
— 0.4
____^_ CONTROL
LOW DOSE
_
— 0.2
FEMALE RATS
> 1 i 15
1 30
i 1 i 1 i 1 45 60 75
TIME ON TEST (WEEKS)
i 1 90
i
HIGH DOSE
1 i 105
~
0 0
120
FIGURE 3 SURVIVAL COMPARISONS OF 2,3,5,6-TETRACHLORO-4-NITROANISOLE CHRONIC STUDY RATS
22

(36/50) of the control group survived on test for at least 100 weeks.
Survival among females was also adequate as 78 percent (39/50) of the
high dose, 96 percent (48/50) of the low dose, and 78 percent (39/50)
of the control group survived on test at least 100 weeks.
C. Pathology
Histopathologic findings on neoplasms in rats are summarized in
Appendix A (Tables Al and A2); findings on nonneoplastic lesions are
summarized in Appendix C (Tables Cl and C2).
A variety of neoplasms occurred with approximately equal fre
quency in dosed and control rats. These neoplasms are known to occur t
spontaneously in Fischer 344 rats and their distribution indicated a
lack of association with chemical administration.
Hepatic neoplasms, not observed in control rats, were encountered
in limited numbers among dosed rats (i.e., neoplastic nodules—3/49
[6 percent] low dose males, 1/25 [4 percent] high dose group 2 males,
0/23 high dose group 1 males, 1/50 [2 percent] low dose females, 3/45
[7 percent] high dose females; hepatocellular carcinomas—2/49 [4 per
cent] low dose males, 0/25 high dose group 2 males, 3/23 [13 percent]
high dose group 1 males, 0/50 low dose females, 1/45 [2 percent] high
dose females).
Degenerative, inflammatory, and hyperplastic lesions, frequently
observed in aging Fischer 344 rats, were noted among dosed and con
trol groups. The distribution of these nonneoplastic lesions did not
provide evidence for an association with chemical administration.
23

Occasional lesions appeared to be sex-related (e.g. chronic nephro
pathy in males), and these findings were compatible with the inci
dences observed in historical controls.
Based upon this histopathologic examination, convincing evidence
was not provided for the carcinogenicity of dietary administration of
2,3,5,6-tetrachloro-4-nitroanisole; however, there was an increased
incidence of hepatic lesions in both sexes.
D. Statistical Analyses of Results
The results of the statistical analyses of tumor incidence in
rats are summarized in Tables 3 and 4. The analysis is included for
every type of malignant tumor in either sex where at least two such
tumors were observed in at least one of the control or 2,3,5,6-tetra
chloro-4-nitroanisole-dosed groups and where such tumors were ob
served in at least 5 percent of the group. In these analyses the
Cochran-Armitage test was not used for high dose group 2 since this
group was started on test approximately 6 weeks after all the other
groups.
For male rats the Cochran-Armitage test indicated a significant
(P = 0.020) positive association between dosage and the combined in
cidence of hepatocellular carcinomas and neoplastic nodules of the
liver when high dose group 1 was used. None of the Fischer exact test
results were significant, however, under the Bonferroni criterion.
Similarly, for liver neoplasms in the females the Cochran-Armitage
test was significant (P = 0.020), but the Fisher exact tests were not
24

___
TABLE 3
ANALYSES OF THE INCIDENCE OF PRIMARY TUMORS AT SPECIFIC SITES IN MALE RATS TREATED WITH 2,3,5,6-TETRACHLORO-4-NITROANISOLE£
TOPOGRAPHY: MORPHOLOGY
Subcutaneous Tissue: Fibroma
P Values0
Relative Risk (Control) Lower Limit Upper Limit
Weeks to First Observed Tumor
Lung: Alveolar/Bronchiolar Adenoma^
P Values0
Relative Risk (Control) Lower Limit Upper Limit
Weeks to First Observed Tumor
Hematopoietic System: Leukemia or Malignant Lymphomab
P Values0
Relative Risk (Control) Lower Limit Upper Limit
Weeks to First Observed Tumor
CONTROL
3/48(0.06)
N.S.
105
3/48(0.06)
N.S.
105
7/48(0.15)
N.S.
80
LOW DOSE
2/49(0.04)
N.S.
0.653 0.055 . 5.345
105
0/49(0.00)
N.S.
0.000 0.000 1.628
7/49(0.14)
N.S.
0.980 0.311 2.969
92
HIGH DOSE GROUP 2
0/25(0.00)
N.S.
0.000 0.000 3.111
1/25(0.04)
N.S.
0.640 0.012 7.396
106
3/25(0.12)
N.S.
0.823 0.147 3.217
36
HIGH DOSE GROUP 1
0/23(0.00)
N.S.
0.000 0.000 3.366
0/23(0.00)
N.S.
0.000 0.000 3.366
6/23(0.26)
N.S.
1.789 0.550 5.356
89

TOPOGRAPHY: MORPHOLOGY
Liver: Hepatocellular Carcinoma
P Values0
Relative Risk (Control) Lower Limit Upper Limit
Weeks to First Observed Tumor
Liver: Hepatocellular Carcinoma or Neoplastic Noduleb
ho P Values0
Relative Risk (Control) Lower Limit Upper Limit
Weeks to First Observed Tumor
Pituitary: Adenoma NOS
P Values0
Relative Risk (Control) Lower Limit Upper Limit
Weeks to First Observed Tumor
TABLE 3 (CONTINUED)
LOW HIGH DOSE HIGH DOSE CONTROL DOSE GROUP 2 GROUP 1
0/48(0.00) 2/49(0.04) 0/25(0.00) 3/23(0.13)
P = 0.015 N.S. N.S. P = 0.031
Infinite Infinite 0.290 1.265
Infinite Infinite
105 105
0/48(0.00) 5/49(0.10) 1/25(0.04) 3/23(0.13)
P = 0.020 P = 0.030 N.S. P 0.031
Infinite Infinite Infinite 1.237 0.103 1.265
Infinite Infinite Infinite
105 106 105
10/45(0.22) 9/43(0.21) 4/21(0.19) 4/20(0.20)
N.S. N.S. N.S. N.S.
0.942 0.857 0.900 0.375 0.216 0.227 2.320 2.543 2.651
102 103 106 105

___
TABLE 3 (CONTINUED)
TOPOGRAPHY: MORPHOLOGY
Adrenal: Pheochromocytoma
P Values0
Relative Risk (Control) Lower Limit Upper Limit
Weeks to First Observed Tumor
Thyroid: C-Cell Carcinoma or C-Cell Adenomab
K3 P Values0
Relative Risk (Control) Lower Limit Upper Limit
Weeks to First Observed Tumor
Pancreatic Islets: Islet-Cell Adenoma or Islet-Cell Carcinoma
P Values0
Relative Risk (Control) Lower Limit Upper Limit
Weeks to First Observed Tumor
CONTROL
4/46(0.09)
N.S. __ _.
78
5/43(0.12)
N.S.
94
0/44(0.00)
N.S.
LOW DOSE
4/49(0.08)
N.S.
0.939 0.185 4.761
103
2/45(0.04)
N.S.
0.382 0.038 2.194
103
2/46(0.04)
N.S.
Infinite 0.284
Infinite
105
HIGH DOSE GROUP 2
3/25(0.12)
N.S.
1.380 0.215 7.405
106
0/22(0.00)
N.S.
0.000 0.000 1.496
1/25(0.04)
N.S.
Infinite 0.094
Infinite
106
HIGH DOSE GROUP 1
4/22(0.18)
N.S.
2.091 0.421 9.986
105
2/22(0.09)
N.S.
0.782 0.078 4.277
105
2/21(0.10)
N.S.
Infinite 0.625
Infinite
105

___
TABLE 3 (CONCLUDED)
LOW HIGH DOSE HIGH DOSE TOPOGRAPHY :MORPHOLOGY CONTROL DOSE GROUP 2 GROUP 1
Testis: Interstitial-Cell Tumor 37/48(0.77) 46/49(0.94) 19/24(0.79) 22/23(0.96)
P Values0 P = 0.009 P = 0.018 N.S. P = 0.046
Relative Risk (Control) 1.218 1.027 1.241 Lower Limit 1.011 0.745 0.968 Upper Limit 1.364 1.302 1.331
Weeks to First Observed Tumor 78 92 36 103
Treated groups received doses of 0.006 or 0.012 percent in feed.
Number of tumor-bearing animals/number of animals examined at site (proportion). 00 ft
The probability level for the Cochran-Artnitage test for the comparison of the control group and the low dose group with high dose Group 1 is given beneath the incidence of tumors in the control group when P < 0.05; otherwise, not significant (N.S.) is indicated. The probability level for the Fisher exact test for the comparison of a treated group with the control group is given beneath the incidence of tumors in that treated group when P < 0.05; otherwise, not significant (N.S.) is indicated. For both Cochran-Armitage and Fisher exact tests a negative designation (N) indicates a lower incidence in the treated group(s) than in the control group.
The 95% confidence interval on the relative risk of the treated group to the control group.

___
N3
TABLE 4
ANALYSES OF THE INCIDENCE OF PRIMARY TUMORS AT SPECIFIC SITES IN FEMALE RATS TREATED WITH 2,3,5,6-TETRACHLORO-4-NITROANISOLE£
TOPOGRAPHY: MORPHOLOGY
Subcutaneous Tissue: Fibroadenoma
P Values0
Departure from Linear Trend
Relative Risk (Control) Lower Limit Upper Limit
Weeks to First Observed Tumor
Hematopoietic System: Leukemia or Malignant Lymphoma"
P Values0
Relative Risk (Control) Lower Limit Upper Limit
Weeks to First Observed Tumor
Liver: Hepatocellular Carcinoma or Neoplastic Nodule"
P Values
Relative Risk (Control) Lower Limit Upper Limit
Weeks to First Observed Tumor
CONTROL
0/50(0.00)
N.S.
P = 0.006
4/50(0.08)
N.S.
101
0/50(0.00)
P = 0.020
_—_
LOW DOSE
4/50(0.08)
N.S.
Infinite 0.927
Infinite
100
7/50(0.14)
N.S.
1.750 0.476 7.682
88
1/50(0.02)
N.S.
Infinite 0.054
Infinite
105
HIGH DOSE
0/45(0.00)
N.S.
7/45(0.16)
N.S.
1.944 0.531 8.487
4/45(0.09)
P = 0.047
Infinite 1.031
Infinite
97
105

TABLE 4 (CONTINUED)
LOW HIGH TOPOGRAPHY: MORPHOLOGY CONTROL DOSE DOSE
Pituitary: Adenoma NOS 16/40(0.40) 15/48(0.31) 14/40(0.35)
P Values0 N.S. N.S. N.S. ___ Relative Risk (Control) 0.781 0.875
Lower Limit 0.418 0.462 Upper Limit 1.470 1.641
Weeks to First Observed Tumor 100 105 102
Pituitary: Adenoma NOS or Chromophobe Adenoma^* 17/40(0.43) 15/48(0.31) 14/40(0.35)
P Values0 N.S. N.S. N.S.
Relative Risk (Control) 0.735 0.824 Lower Limit 0.399 0.441 Upper Limit 1.360 1.518
Weeks to First Observed Tumor 100 105 102
Pituitary: Adenoma NOS or Carcinoma NOSb 16/40(0.40) 16/48(0.33) 15/40(0.38)
P Values0 N.S. N.S. N.S. ___
Relative Risk (Control) 0.833 0.938 Lower Limit 0.455 0.506 Upper Limit 1.547 1.729
Weeks to First Observed Tumor 100 105 102

TOPOGRAPHY: MORPHOLOGY
Adrenal: Pheochrornocytoma
P Values0
Relative Risk (Control) Lower Limit Upper Limit
Weeks to First Observed Tumor
Thyroid: C-Cell Adenoma
P Values0
Departure from Linear Trend
Relative Risk (Control) Lower Limit Upper Limit
Weeks to First Observed Tumor
Thyroid: C-Cell Adenoma or C-Cell Carcinoma0
P Values0
gDeparture from Linear Trend
Relative Risk (Control) Lower Limit Upper Limit
Weeks to First Observed Tumor
TABLE 4 (CONTINUED)
CONTROL
6/48(0.13)
P = 0.006(N)
105
0/43(0.00)
N.S.
P = 0.022
—_
0/43(0.00)
N.S.
P = 0.045
LOW DOSE
1/50(0.02)
N.S.
0.160 0.004 1.249
105
3/47(0.06)
N.S.
Infinite 0.553
Infinite
88
4/47(0.09)
N.S.
—_
Infinite 0.852
Infinite
88
HIGH DOSE
0/44(0.00)
P = 0.017(N)
0.000 0.000 0.679
0/37(0.00)
N.S.
_.,—
1/37(0.03)
N.S.
Infinite 0.062
Infinite
106

TABLE 4 (CONCLUDED)
LOW HIGH TOPOGRAPHY: MORPHOLOGY CONTROL DOSE DOSE
Mammary Gland: Fibroadenoma 6/50(0.12) 0/50(0.00) 1/45(0.02)
P Values0 P = 0.021(N) P = 0.013(N) N.S.
Relative Risk (Control) 0.000 0.185 Lower Limit 0.000 0.004 Upper Limit 0.625 1.441
Weeks to First Observed Tumor 105 106
Uterus: Endometrial Stromal Polyp 2/48(0.04) 9/50(0.18) 8/45(0.18)
P Values0 P = 0.036 P = 0.030 P = 0.036
Relative Risk (Control) 4.320 4.267 Lower Limit 0.957 0.911 Upper Limit 39.430 39.438
Weeks to First Observed Tumor 105 105 102
Treated groups received doses of 0.006 or 0.012 percent in feed.
Number of tumor-bearing animals/number of animals examined at site (proportion). rt
"The probability level for the Cochran-Armitage test is given beneath the incidence of tumors in the control group when P < 0.05; otherwise, not significant (N.S.) is indicated. The probability level for the Fisher exact test for the comparison of a treated group with the control group is given beneath the incidence of tumors in the treated group when P < 0.05; otherwise, not significant (N.S.) is indicated. For both Cochran-Armitage and Fisher exact tests a negative designation (N) indicates a lower incidence in the treated group(s) than in the control group.
The 95% confidence interval on the relative risk of the treated group to the control group. a
"The probability level of the test for departure from linear trend is given beneath the control group when P < 0.05.

significant under the Bonferroni criterion. In historical control
data collected by this laboratory for the NCI Carcinogenesis Testing
Program 6/250 (2 percent) of the male and 35/249 (14 percent) of the
female untreated Fischer 344 rats had one of these tumors. For endome
trial stromal polyps in the females the Cochran-Armitage test was
significant, but the Fisher exact tests were not under the Bonferroni
criterion. In historical control data 31/249 (12 percent) of the un
treated females had one of these tumors.
Significant positive associations were observed for interstitial-
cell tumors of the testis in males, but these results must be dis
counted due to the usually high spontaneous incidence of this tumor
(Cockrell and Garner, 1976).
For females the possibility of a negative association between
dosage and incidence was observed for adrenal pheochromocytomas and
for mammary fibroadenomas.
To provide additional insight into the possible carcinogenicity
of this compound, 95 percent confidence intervals on the relative
risk have been estimated and entered in the tables based upon the
observed tumor incidence rates. In many of the intervals shown in
Tables 3 and 4, the value one is included; this indicates the absence
of statistically significant results. It should also be noted that
many of the confidence intervals have an upper limit greater than one,
indicating the theoretical possibility of tumor induction in rats by
2,3,5,6-tetrachloro-4-nitroanisole that could not be established under
the conditions of this test.
33

IV. CHRONIC TESTING RESULTS: MICE
A. Body Weights and Clinical Observations
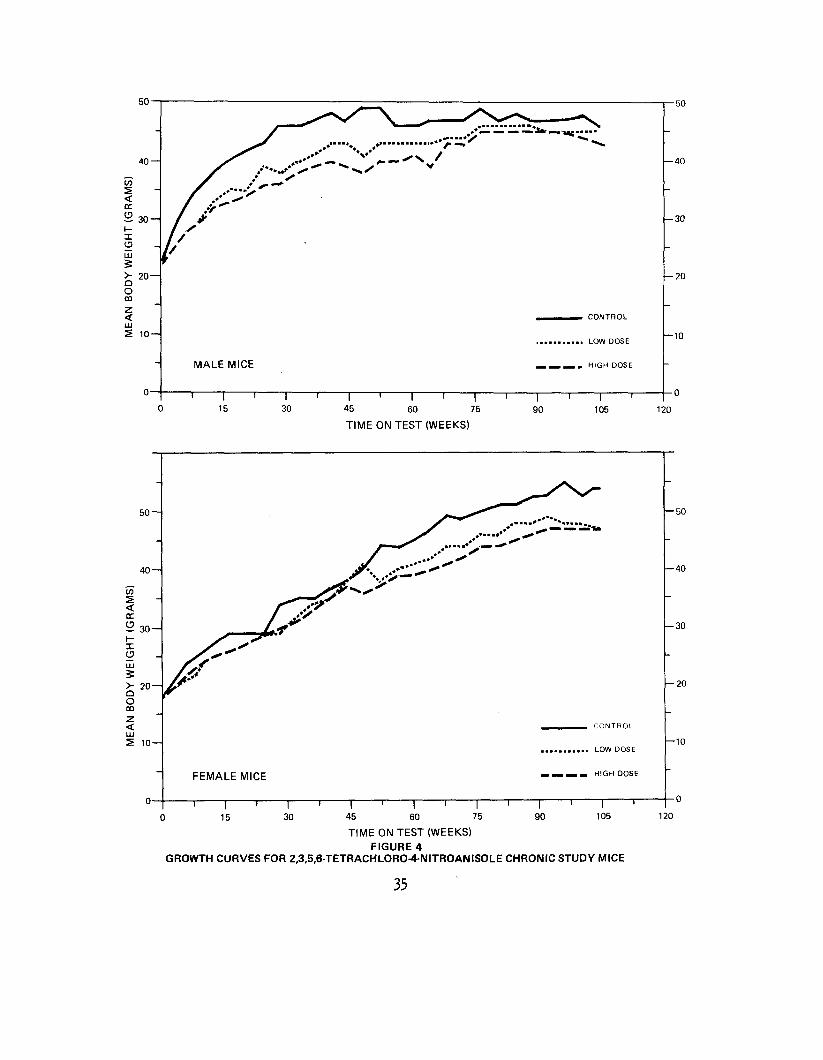
Mean body weight depression, observed in both dosed male and
dosed female mice when compared to controls, was more apparent during
the first year of study for males and during the second year of study
for females (Figure 4).
Abdominal distention, with and without palpable masses, was
observed in 2 high dose males, 5 low dose females, and 1 control
female. Swelling of the urogenital or rectal area was observed in 1
high dose male, 2 low dose males, 1 control male, and 1 high dose fe
male. Blood in the urogenital area was observed in 2 control males.
Subcutaneous masses were observed in 4 control males, 2 low dose fe
males, and 2 control females. Swollen eyes were noted in 2 high dose
females, 1 low dose female, and 1 control male; in this male a mass
developed in the Harderian gland. Cutaneous lesions were observed in
2 high dose males, 3 low dose males, 1 control male, 1 high dose fe
male, 1 low dose female, and 1 control female. Alopecia was observed
in 17 high dose males, 20 low dose males, 42 control males, 25 high
dose females, 23 low dose females, and 54 control females. No other
clinical abnormalities were noted.
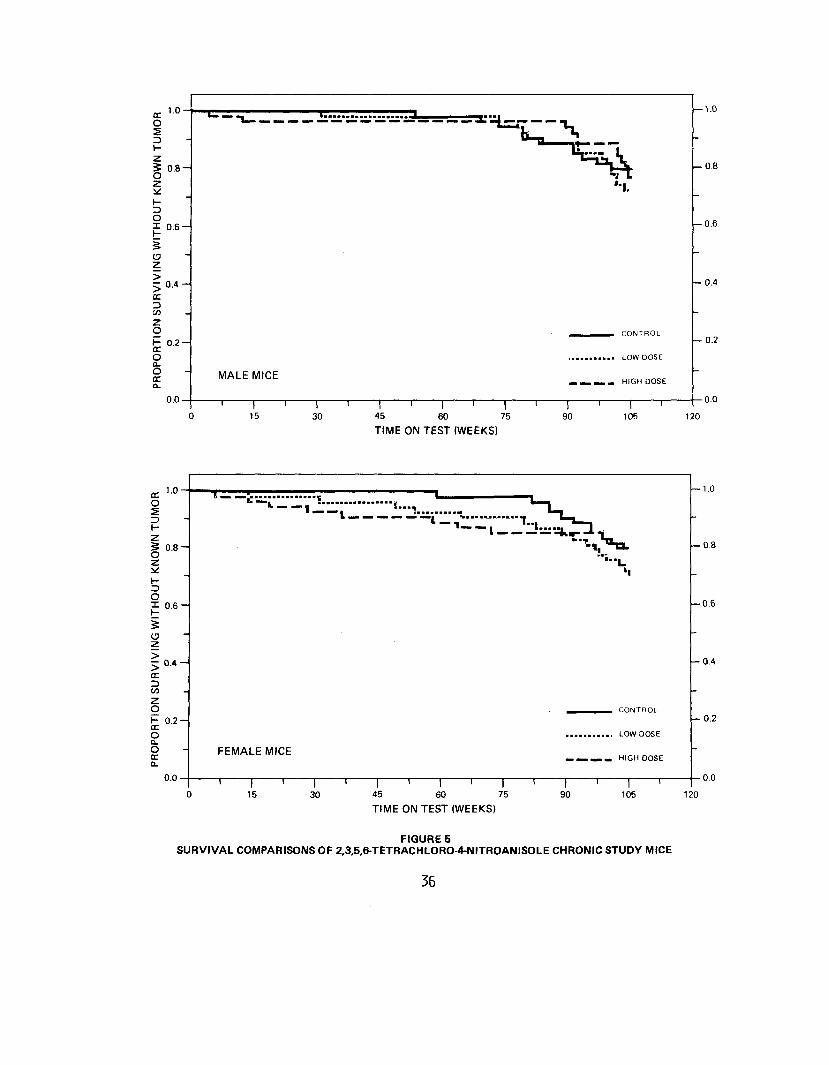
B. Survival
The estimated probabilities of survival for male and female mice
in the control and 2,3,5,6-tetrachloro-4-nitroanisole-dosed groups
are shown in Figure 5. For both male and female mice there was no
significant positive association between dosage and mortality.
34
-50 50
40 — -40
£30 -30
HI
3 > -20
o OQ
CONTROL
10 — ... LOW DOSE
-10
MALE MICE . _ HIGH DOSE
I I I \ I \ 15 30 45 60 75 90 105 120
TIME ON TEST (WEEKS)
50 — — 50
-40 40 —
-30 230
X o HI
-20 >- 20Q O CD
CONTROL
10 — -10 LOW DOSE
HIGH DOSE FEMALE MICE
1 1 1 1 [— 1 TT ~T 0 15 30 45 60 75 90 105 120
TIME ON TEST (WEEKS)
FIGURE 4 GROWTH CURVES FOR 2,3,5,6-TETRACHLORO-4-NITROANISOLE CHRONIC STUDY MICE
35
oc 0 ^___^
-1.0
^_
Z § 0.8O
•—iv 4. * >J_k -0.8
™j ^L Z '•1.
-l__ ~
o -0.6 I 0.6
1
3 -
> -0.4 50.4DC p
z0 1- 0.2cc 0 , LOW DOSE o.
_______ CONTROL - 0.2
O M A 1 II l\/l IPC
DC _ _ _ _ _ HIGH DOSE O
00 0 0 1 | 1 | 1 | 1 | 1 | 1 | 1 | 1
0 15 30 45 60 75 90 105 120
TIME ON TEST (WEEKS)
— 1.0 <z '•"o s -1- — i 1 ".ll1 :-.,*,, .! —f
*"t^ **TX — 0.8 5 o.Bo *•* z !••'i -
o — 0.6 X0.6
§ -
— 0.4 cr ^ 0.4
13 CO —
O _______ CONTROL 1- 0.2 - 0.2 cc 0 LOW DOSE Q.O FEMALE MICE "
EC _ _ _ _ _ HIGH DOSE Q.
0 0 0 0 1 | 1 | 1 | 1 | 1 | 1 | 1 | 1
() 15 30 45 60 75 90 105 12 0
TIME ON TEST (WEEKS)
FIGURES SURVIVAL COMPARISONS OF 2,3,5,6 TETRACHLORO-4-NITROANISOLE CHRONIC STUDY MICE
36

Adequate numbers of males were at risk from late-developing
tumors as 91 percent (50/55) of the high dose, 89 percent (49/55) of
the low dose, and 89 percent (49/55) of the control group survived on
test at least 85 weeks. Survival among the females was also adequate
as 84 percent (46/55) of the high dose, 85 percent (47/55) of the low
dose, and 96 percent (53/55) of the control group survived on test
for at least 85 weeks.
C. Pathology
Histopathologic findings on neoplasms in mice are summarized in
Appendix B (Tables Bl and B2); findings on nonneoplastic lesions are
summarized in Appendix D (Tables Dl and D2).
A dose-related increase in the incidence of malignant lymphomas
was observed among dosed mice as shown in the following table:
Males Females Low High Low High
Control Dose Dose Control Dose Dose
No. of Animals Necropsied (55) (55) (53) (55) (54) (52)
Malignant Lymphoma NOS 0 3 0 2 0 1 Malignant Lymphoma, Undifferentiated 0 1 5 0 2 4
Ma1ignant Lymphoma, Lymphocytic 0 4 2 2 15 13 Malignant Lymphoma, Histiocytic 1 0 1 1 4 0
Malignant Lymphoma, Mixed 3 0 4 9 4 7 Lymphocytic Leukemia 0 0 0 4 0 0 Granulocytic Leukemia 0 1 0 0 0 0 Total number of animals with lymphomas or leukemias 4 9 12 18 25 25
37

These data suggest that administration of 2,3,5,6-tetrachloro-4
nitroanisole may have induced lymphomas, particularly in male mice.
The malignant lymphomas were classified as lymphocytic, histio
cytic, mixed, or undifferentiated. The cell types were characterized
as follows:
Lymphocytic: Round, basophilic lymphocytes with little or no cytoplasm, and often resembling normal lymphocytes. A moderate degree of differentiation was usual.
Histiocytic: Round, ovoid, sometimes indented nuclei surrounded by abundant, granular pink cytoplasm.
Mixed: A combination of lymphocytic and histiocytic cells. The histiocytic tumor cells sometimes folded and occasionally formed giant cells.
Undifferentiated: A uniform population of "blast" type cells with large, pale nuclei and, commonly, a single nucleolus. Cytoplasmic boundaries were indistinct.
Lymphomas with circulating malignant cells were termed "leukemic"
or lymphocytic leukemia.
A variety of other commonly occurring neoplasms was encountered
among dosed and control groups of both sexes. The incidence of these
neoplasms indicated that they were not associated with chemical admin
istration.
Acanthosis, hyperkeratosis, or both were detected in the fore-
stomach in 4/52 (8 percent) low dose and 5/50 (10 percent) high dose
males; and in 4/51 (8 percent) low dose and 7/51 (14 percent) high
dose females. Although few in number, the distribution of these le
sions, when compared to that in historical control mice, indicates
38

an association with chemical administration. There was no apparent
progression of these lesions to neoplasia.
In male mice the number of animals with hepatocellular lesions
was highest in the control group, less in the low dose, and least in
the high dose group.
Based upon this histopathologic examination, administration of
2,3,5,6-tetrachloro-4-nitroanisole to mice was associated with a
slightly increased incidence of malignant lymphomas, particularly in
males. A slight increase in the incidence of acanthosis and hyper
keratosis of the forestomach was noted in dosed mice of both sexes.
D. Statistical Analyses of Results
The results of the statistical analyses of tumor incidence in
mice are summarized in Tables 5 and 6. The analysis is included for
every type of malignant tumor in either sex where at least two such
tumors were observed in at least one of the control or 2,3,5,6-tetra
chloro-4-nitroanisole-dosed groups and where such tumors were observed
in at least 5 percent of the group.
For male mice the Cochran-Armitage test indicated a significant
(P = 0.019) positive association between dosage and the combined
incidence of leukemia or malignant lymphomas. The Fisher exact tests
supported this result with a significant (P = 0.023) comparison of
high dose to control. For females no statistical tests were signif
icant although leukemia or malignant lymphoma was observed in 25/52
(48 percent) of the high dose mice. In historical control data
39

TABLE 5
ANALYSES OF THE INCIDENCE OF PRIMARY TUMORS AT SPECIFIC SITES IN MALE MICE TREATED WITH 2,3,5, e-TETRACHLORO-A-NITRC-ANISOLE2
TOPOGRAPHY: MORPHOLOGY
Subcutaneous Tissue: Fibrosarcoma or Leiomyo sarcoma
P Values0
Relative Risk (Control) Lower Limit Upper Limit
Weeks to First Observed Tumor -eo
Lung: Alveolar/Bronchiolar Carcinoma
P Values0
Relative Risk (Control) Lower Limit Upper Limit
Weeks to First Observed Tumor
Lung: Alveolar/Bronchiolar Carcinoma or Alveolar/Bronchiolar Adenoma"
c P Values
Relative Risk (Control) . Lower Limit Upper Limit
Weeks to First Observed Tumor
CONTROL
1/55(0.02)
N.S.
73
6/54(0.11)
N.S.
—__
105
12/54(0.22)
N.S.
79
LOW DOSE
3/55(0.05)
N.S.
3.000 0.250
154.535
103
13/54(0.24)
N.S.
2.167 0.835 6.445
78
17/54(0.31)
N.S.
1.417 0.709 2.922
78
HIGH DOSE
2/53(0.04)
N.S.
2.075 0.111
120.111
101
9/51(0.18)
N.S.
1.588 0.545 5.043
105
13/51(0.25)
N.S.
1.147 0.534 2.482
89

___
TOPOGRAPHY: MORPHOLOGY
Hematopoietic System: Leukemia or Malignant Lymphoma^
P Values0
Relative Risk (Control) Lower Limit Upper Limit
Weeks to First Observed Tumor
Liver: Hepatocellular Carcinoma
P Values0
Relative Risk (Control) Lower Limit Upper Limit
Weeks to First Observed Tumor
Liver: Hepatocellular Carcinoma, Hepatocellular Adenoma, or Mixed Hepato/Cholangio Carcinoma^
P Values
Relative Risk (Control) Lower Limit Upper Limit
Weeks to First Observed Tumor
TABLE 5 (CONTINUED)
CONTROL
4/55(0.07)
P = 0.019
105
24/54(0.44)
P = 0.002(N)
53
28/54(0.52)
P = 0.002(N)
53
LOW DOSE
9/55(0.16)
N.S.
2.250 0.672 9.455
73
13/52(0.25)
P = 0.029(N)
0.563 0.299 1.015
79
18/52(0.35)
N.S.
0.668 0.405 1.083
79
HIGH DOSE
12/53(0.23)
P = 0.023
3.113 1.016 12.452
91
9/52(0.17)
P = 0.002(N)
0.389 0.179 0.775
92
12/52(0.23)
P = 0.002(N)
0.445 0.237 0.795
92

TOPOGRAPHY: MORPHOLOGY
Liver: Angiosarcoma
P Values0
Relative Risk (Control) Lower Limit Upper Limit
Weeks to First Observed Tumor
Adrenal: Capsular Adenoma NOS or r i Cortical Adenoma0
P Values0 KJ
Departure from Linear Trend
Relative Risk (Control) Lower Limit Upper Limit
Weeks to First Observed Tumor
Thyroid: Follicular-Cell Adenoma or Follicular-Cell Carcinomab
P Values0
Departure from Linear Trend
Relative Risk (Control) Lower Limit Upper Limit
Weeks to First Observed Tumor
TABLE 5 (CONTINUED)
CONTROL
0/54(0.00)
N.S.
6/50(0.12)
P = 0.003(N)
P = 0.070
105
0/48(0.00)
N.S.
P = 0.017
—_
LOW DOSE
2/52(0.04)
N.S.
Infinite 0.307 Infinite
97
0/52(0.00)
P = 0.012(N)
0.000 0.000 0.602
3/49(0.06)
N.S.
Infinite 0.590 Infinite
104
HIGH DOSE
3/52(0.06)
N.S.
Infinite 0.623 Infinite
105
0/49(0.00)
P = 0.014(N)
0.000 0.000 0.637
0/44(0.00)
N.S.

TABLE 5 (CONCLUDED)
aTreated groups received doses of 0.006 or 0.012 percent in feed.
Number of tumor-bearing animals/number of animals examined at site (proportion). Q
The probability level for the Cochran-Armitage test is given beneath the incidence of tumors in the control group when P < 0.05; otherwise, not significant (N.S.) is indicated. The probability level for the Fisher exact test for the comparison of a treated group with the control group is given beneath the incidence of tumors in the treated group when P < 0.05; otherwise, not significant (N.S.) is indicated. For both Cochran-Armitage and Fisher exact tests a negative designation (N) indicates a lower incidence in the treated group(s) than in the control group.
The 95% confidence interval on the relative risk of the treated group to the control group. £
The probability level of the test for departure from linear trend is given beneath the control group when P < 0.05.

___
_ __
TABLE 6
ANALYSES OF THE INCIDENCE OF PRIMARY TUMORS AT SPECIFIC SITES IN FEMALE MICE TREATED WITH 2,3,5,6-TETRACHLORO-4-NITROANISOLE£
TOPOGRAPHY: MORPHOLOGY
Lung: Alveolar/Bronchiolar Carcinoma
P Values0
Relative Risk (Control) Lower Limit Upper Limit
Weeks to First Observed Tumor
Lung: Alveolar/Bronchiolar Carcinoma or Alveolar/Bronchiolar Adenoma0
P Values0
Relative Risk (Control) Lower Limit Upper Limit
Weeks to First Observed Tumor
Hematopoietic System: Leukemia or Malignant Lymphomab
P Values0
Relative Risk (Control) Lower Limit Upper Limit
Weeks to First Observed Tumor
CONTROL
1/55(0.02)
N.S.
105
4/55(0.07)
N.S.
105
18/55(0.33)
N.S.
86
LOW DOSE
5/52(0.10)
N.S.
5.289 0.620
244.998
97
8/52(0.15)
N.S.
2.115 0.606 9.064
83
25/54(0.46)
N.S.
1.415 0.847 2.392
80
HIGH DOSE
2/52(0.04)
N.S.
2.115 0.114
122.378
72
4/52(0.08)
N.S.
1.058 0.207 5.393
72
25/52(0.48)
N.S.
1.469 0.882 2.470
64

_ __
_ __
TOPOGRAPHY: MORPHOLOGY
Liver: Hcpatocellular Carcinoma
P Values0
Relative Risk (Control) Lower Limit Upper Limit
Weeks to First Observed Tumor
Liver: Hepatocellular Carcinoma, Hepatocellular Adenoma or Mixed Hepato/Cholangio Carcinoma^
P Values0
Relative Risk (Control) Lower Limit Upper Limit
Weeks to First Observed Tumor
Pituitary: Adenoma NOS
P Values0
Relative Eisk (Control) Lower Limit Upper Limit
Weeks to First Observed Tumor
TABLE 6 (CONTINUED)
CONTROL
7/54(0.13)
N.S.
——
101
11/54(0.20)
N.S.
59
0/42(0.00)
N.S.
LOW DOSE
1/53(0.02)
P = 0.032(N)
0.146 0.003 1.076
105
4/53(0.08)
N.S.
0.370 0.091 1.161
105
2/47(0.04)
N.S.
Infinite 0.266
Infinite
105
HIGH DOSE
3/52(0.06)
N.S.
0.445 0.078 1.832
105
5/52(0.10)
N.S.
0.472 0.138 1.363
105
3/41(0.07)
N.S.
Infinite 0.620
Infinite
105

TABLE 6 (CONCLUDED)
TOPOGRAPHY: MORPHOLOGY CONTROL LOW DOSE
HIGH DOSE
Pituitary: Adenoma NOS, Chromophobe Adenoma, or Basophil Adenoma'3
P Values0
3/42(0.07)
N.S.
2/47(0.04)
N.S.
3/41(0.07)
M.S.
Relative Risk (Control) Lower Limit Upper Limit
0.596 0.052 4.956
1.024 0.145 7.232
Weeks to First Observed Tumor 105 105 105
Treated groups received doses of 0.006 or 0.012 percent in feed.
Number of tumor-bearing animals/number of animals examined at site (proportion).
"The probability level for the Cochran-Armitage test is given beneath the incidence of tumors in the control group when P < 0.05; otherwise, not significant (N.S.) is indicated. The probability level for the Fisher exact test for the comparison of a treated group with the control group is given beneath the incidence of tumors in the treated group when P < 0.05; otherwise, not significant (N.S.) is indicated. For both Cochran-Armitage and Fisher exact tests a negative designation (N) indicates a lower incidence in the treated group(s) than in the control group.
The 95% confidence interval on the relative risk of the treated group to the control group.

collected by this laboratory for the NCI Carcinogenesis Testing
Program, leukemia or malignant lymphoma was detected in 22/259 (8
percent) of the untreated control male and 44/270 (16 percent) of
the untreated control female B6C3F1 mice. Of the 6 groups of
untreated control male mice and the 6 groups of untreated control
female mice included in these historical control incidences, the
highest incidence of this combination of neoplasms was 11/39 (28
percent) for males and 11/50 (22 percent) for females.
For male mice the possibility of a negative association between
dosage and the incidences of hepatocellular carcinomas and of adenomas
NOS of the adrenal was noted. No other statistical tests for either
sex were significant under the Bonferroni.criterion.
To provide additional insight into the possible carcinogenicity
of this compound, 95 percent confidence intervals on the relative
risk have been estimated and entered in the tables based upon the
observed tumor incidence rates. In many of the intervals shown in
Tables 5 and 6, the value one is included; this indicates the absence
of statistically significant results. It should also be noted that
many of the confidence intervals have an upper limit greater than one,
indicating the theoretical possibility of tumor induction in mice by
2,3,5,6-tetrachloro-4-nitroanisole that could not be established under
the conditions of this test.
47

V. DISCUSSION
There were no significant positive associations between the diet
ary concentration of 2,3 ,5,6-tetrachloro-4-nitroanisole administered
and mortality in rats or mice of either sex. Adequate numbers of
animals in all groups survived sufficiently long to be at risk from
late-developing tumors.
Although the incidences of interstitial-cell testicular tumors
in dosed male rats were statistically significantly higher than in
controls, this was discounted due to the high and variable sponta
neous incidence of this lesion in Fischer 344 rats (Cockrell and
Garner, 1976). There was an association between dosage and the com
bined incidence of hepatocellular carcinomas and neoplastic nodules
in both male and female rats. However, neither these tumors nor any
other tumors occurred at significantly increased incidences when dosed
male or female rats were compared to their controls.
When those male mice having either leukemia or malignant lympho
ma were combined and the resulting incidences analyzed, the Cochran-
Armitage test indicated a significant positive association between
the concentration of the compound administered and occurrence of these
neoplasms. The high dose to control Fisher exact comparison supported
the finding. These hematopoietic lesions occur spontaneously and with
great variation in B6C3F1 mice (i.e., historical control incidences
of 8 and 16 percent for untreated control males and females, respec
tively, with maximum incidences in one group of 28 and 22 percent for
48
males and females, respectively); therefore, the administration of
the compound was not considered to be associated with their develop
ment. No other tumors occurred in significant positive incidences
when dosed mice of either sex were compared to controls. There was
a negative trend for the incidences of hepatocellular carcinomas in
male mice, which was not attributable to poor survival among the
dosed groups.
Under the conditions of this bioassay, dietary administration of
2,3,5,6-tetrachloro-4-nitroanisole was not carcinogenic to either sex
of Fischer 344 rats or to B6C3F1 mice.
49

VI. BIBLIOGRAPHY
Armitage, P., Statistical Methods in Medical Research, Chapter 14. J. Wiley & Sons, New York, 1971.
Berckmans, V.S.F. and A.F. Bailsman, Recueil des travaux Chimiques des Pays-has 44:851, 1925.
Berenblum, I., editor, Carcinogenicity Testing. International Union Against Cancer, Technical Report Series, Vol. 2. International Union Against Cancer, Geneva, 1969.
Carey, W.F., "Determination of Tetrachloronitroanisole (TCNA) Residues in Vegetables and Grains." Journal of the Association of Official Analytical Chemists 46:876-878, 1963.
Chemical Abstracts Service. The Chemical Abstracts Service (CAS) Ninth Collective Index, Volumes 76-85, 1972-1976. American Chemical Society, Washington, D.C., 1977.
Cockrell, B.Y. and F.M. Garner, "Interstitial-Cell Tumors of the Testis in Rats." Comparative Pathology Bulletin 8:2-4, 1976.
Cox, D.R., Analysis of Binary Data, Chapters 4 and 5. Methuen and Co., Ltd., London, 1970.
Cox, D.R., "Regression Models and Life-Tables." Journal of the Royal Statistical Society, Series "B" 34:187-220, 1972.
Gart, J.J., "The Comparison of Proportions: A Review of Significance Tests, Confidence Limits, and Adjustments for Stratification." International Statistical Institute Review 39:148-169, 1971.
Kaplan, E.L., and P. Meier, "Nonparametric Estimation from Incomplete Observations." Journal of the American Statistical Association 5_3_: 457-481, 19587
Linhart, M.S., J.A. Cooper, R.L. Martin, N.P. Page, and J.A. Peters, "Carcinogenesis Bioassay Data System." Computers and Biomedical Research 7:230-248, 1974.
Miller, R.G., Simultaneous Statistical Inference. McGraw-Hill Book Co., New York, 1966.
Peters, A.T., R.M. Rocoe, and D.M. Stead, Journal of the Chemical Society, 233, 1943.
50

Purdy, L.H., "Comparative Effectiveness of Seed-Treatment Chemicals Against Flag Smut of Wheat." Plant Disease Reporter 47(9):793796, 1963.
Saffiotti, U., R. Montesano, A.R. Sellakumar, F. Cefis, and D.G. Kaufman, "Respiratory Tract Carcinogenesis in Hamsters Induced by Different Numbers of Administration of Benzo (a) Pyrene and Ferric Oxide." Cancer Research 32:1073-1079, 1972.
Schaughnessy, J., Registration Division, U.S. Environmental Protection Agency, Washington, D.C. Personal communication, May 24, 1977.
Tarone, R.E., "Tests for Trend in Life-Table Analysis." Biometrika 62^679-682, 1975.
U.S. Department of Health, Education, and Welfare, Report of the Secretary's Commission on Pesticides and their Relationship to Environmental Health. U.S. Government Printing Office, Washington, D.C. , 1969.
U.S. International Trade Commission, Synthetic Organic Chemicals, United States Production and Sales, 1975. USITC Publication 804, U.S. Government Printing Office, Washington, D.C., 1977.
51


APPENDIX A
SUMMARY OF THE INCIDENCE OF NEOPLASMS IN RATS TREATED WITH 2,3,5,6-TETRACHLORO-4-NITROANISOLE


TABLE A1 SUMMARY OF THE INCIDENCE OF NEOPLASMS IN MALE RATS TREATED WITH
2,3,5,6-TETRACHLORO4-NITROANISOLE
1l O N T R O L ( U N T R ) LOW DOSE H I G H DOSE 2 HIGH DOSE 1 01-0220 01-0270 01-S275 01-0275
A N I M A L S I N I T I A L L Y I N STUDY 50 49 25 »50 A N I M A L S N E C F O P S I E D 18 49 25 23 A N I M A L S E X A M I N E D H I S T O P A T H O L O G I C A L L Y * * 48 49 25 23
I N T E G U M E N T A R Y SYSTEM
* S K I N (48) (49) (25) (23) S Q U A M O U S CELL C A R C I N O M A 1 ( 2 % )
* S U B C U T T I S S U E (48) (49) (25) (23) S Q U A M O U S C E L L C A R C I N O M A 1 < 4 < S ) F I B R O M A 3 (6%) 2 ( 4 % ) F I B R O S A R C O M A 2 ( 4 X )
R E S P I R A T O R Y S Y S T E M
* N A S A L T U R B I N A T E (18) (49) (25) (23) S Q U A M O U S CELL C A R C I N O M A 1 ( 4 X )
J L U N G (18) ( 4 9 ) (25) (23) N E O P L A S M , NOS 1 (2*) A L V E O L A B / B R O N C H I O L A R A D E N O M A 3 ( 6 % ) 1 ( ( I X ) F I B R O S A R C O M A , M E T A S T A T I C 1 (25S)
H E M A T O P O I E T I C S Y S T E M
• M U L T I P L E O R G A N S (48) (25) (23) M A L I G N A N T L Y M P H O M A , N O S 1 (2*) M A L I G . L Y M P H O M A , U N D I F F E R - T Y P E 1 ( 4 X ) 1 («X) L E U K E M I A , NOS 1 (2%) U N D I F F E P E N T I A T E D L E U K E M I A 2 (4*) M Y E L O M O N O C Y T I C L E U K E M I A 6 ( 1 2 X ) 2 (3X) 4 ( 17X)
(49)
t S P L E E N (48) (49) (25) (23) M Y E L O M O N O C Y T I C L E U K E M I A 4 (8%)
•L IVEP (48) (49) (25) (23)
* N U M B E R O F A N I M A L S WITH TISSUE E X A M I N E D M I C R O S C O P I C A L L Y * N U M B E R OF A N I M A L S NECEOPSIED
** EXCLUDES PARTIALLY AUTOLYZED ANIMALS 9 50 A N I M A L S WERE INITIALLY IN THE STUDY, BUT 26 W E R E FOUND TO BE FEMALES IN A MALE GSOOP.
A-3

TABLE Al (CONTINUED)
C O N T R O L ( U N T E )01-0220
LOW DOSE 01-0270
HIGH DOSE 01-3275
2 HIGH DOSE 01-0275
1
C I R C U L A T O R Y SYSTEM
N O N E
D I G E S T I V E S Y S T E M
• L I V E RNEOPLASTIC NODULEH E P A T O C E L L U L A R C A R C I N O M A
(48) (19) 3
2 (6X) ( 4 % )
(25) 1 (IX)
(23)
3 (13*)
* S T O N A C HF I B R O S A R C O M A
(48) ( 4 8 ) (25) (23) 1 (UX)
t D U O D E N U MISLET-CELL C A R C I N O M A , METASTATIC
(46) (49) 1 (2X)
( 2 4 ) (23)
U R I N A R Y S Y S T E M
N O N E
E N D O C R I N E S Y S T E M
t E I T U I T A R Y N E O P L A S M , N O S A D E N O M A , N O S 10 (22%)
(43 ) 1 <2X) 9 (21X)
(21)
4 (19X)
(20)
4 (20X)
t A D R E N A L CORTICAL ADENOMA P H S O C H R O M O C Y T O M A
(46)
4 (9%)
(19)1 (2X) it (8X)
(25)
3 (12X)
(22)
4 (18X)
t T K Y R O I D C A R C I N O M A , N O S F O L L I C U L A R - C E L L C A R C I N O M A C-CF.LL A D E N O M A C-CELL C A R C I N O M A
(43)
3 (7)5) 2 (5)6)
(45) 1 (2X)
1 (2X) 1 (2X)
(22)
1 (5X)
(22)
1 <SX) 1 (5X) 1 (5X)
I P A S A T H Y R O I D A D E N O M A , N O S
• P A N C H E A T I C I S L E T S I3LET^CELL_ADSNOMA
(25) 1 («*)
(44) ___________________________________
(46) 1 (2X1
(7)
(25)
(3)
(21)
* N D M B E P* N U M B E R
OF A N I M A L S OF A N I M A L S
WITH TISSUE NECROPSIED
E X A M I N E D MICROSCOPICALLY
A-4

TABLE Al (CONTINUED)
C O N T R O L ( U N T R ) LOW DOSE HIGH DOSE 2 HIGH DOSE 1 01-0220 01-0270 01-S275 01-0275
ISLET-CELL C A E C I N O M A 1 (2%)
R E P R O D U C T I V E S Y S T E M
• M A M M A R Y G L A N D (48) <A9) (25) (23) F I B R O A D E N O M A 1 <<**>
ITESTIS (US) ( U 9 ) (24 ) (23) INTESSTITIAL-CELL T U M O R 37 (77X) 46 (91%) 19 (79*) 22 (96*)
S E R V O O S S Y S T E M
*BRAIN (46 ) (US) ( 2 4 ) (22 ) OSTEOSAECOMA, METASTATIC 1 (2*)
S P E C I A L S E N S E O R G A N S
N O N E
M U S C H L O S K E L E T A L SYSTEM
* S K U L L (48) (49) (25) (23) O S T E O S A F C O N A 1 ( 2 X )
BODY C A V I T I E S
*BODY C A V I T I E S (48) (49) (25) (23) M E S O T H E L I O M A , N O S 1 ( 2 % ) 1 ( 2 % ) 1 (4«)
ALL O T H E R SYSTEMS
_ _ N O N E
* N U M B E R Of A N I M A L S WITH TISSUE E X A M I N E D MICROSCOPICALLY * N U M B E R OF A N I M A L S NECROPSIED
A-5

TABLE Al (CONCLUDED)
C O N T B O L ( U N T R ) 01-0220
LOD DOSE 01-0270
H I G H DOSE01-3275
2 HIGH DOSE01-0275
1
ANIMAL DISPOSITION SUMMARY
A N I M A L S I N I T I A L L Y I S S T U D Y N A T U R A L DEATHS M O R I B U N D SACRIFICE S C H E D U L E D SACRIFICE A C C I D E N T A L L Y K I L L E D T K P M I S A L S A C R I F I C E A N I M A L MISSING DELETED A N I M A L f S R O N G SEX)
50
32 U2
25
16
50
21
26
51 I N C L U D E S A U T O L Y Z E D A N I M A L S
TUMOR SUMMARY
TOTAL ANIMALS WITH PRIMARY TUMORS*TOTAL PRIMARY TUMORS
U2 It
48 83
20 37
23 «5
TOTAL ANIMALS WITH BENIGN TUKORSTOTAL BENIGN TUMORS
«0 61
1)7 6U
19 29
22 33
TOTAL ANIMALS WITH MALIGNANT TUMORSTOTAL MALIGNANT TUMORS
11 12
13 13
6 6
10 12
TOTAL ANIMALS WITH SECONDARY TUMORS*TOTAL SECONDARY TUMORS
2 2
1 1
TOTAL ANIMALS WITH TUMORS UNCERTAINBENIGN OR MALIGNANT
TOTAL UNCERTAIN TUMORS 1
1 5 6
2 2
TOTAL ANIMALS WITH TUMORS UNCERTAINPRIMARY OR METASTATIC
TOTAL UNCERTAIN TUMORS
* PRIMARY TUMORS: ALL TUMORS EXCEPT SECONDARY TUMORS * SECONDARY TUMOPS: METASTATIC TUMOFS OR TUMORS INVASIVE INTO AN ADJACENT ORGAN
A-6

TABLE A2 SUMMARY OF THE INCIDENCE OF NEOPLASMS IN FEMALE RATS TREATED WITH
2,3,5,6-TETRACHLORO^-NITROANISOLE
C O N T R O L ( O N T R ) LOW EOSE HIGH DOSE 02-0220 02-0270 02-0275
MIHUS I N I T I A L L Y IN STODY 50 50 50 A N I M A L S M I S S I N G 1 A N I M A L S NECROPSIBD 50 50 145 A N I M A L S E X A M I N E D HISTOPATHOLOGICALLY** 50 50 45
I N T E G U M E N T A R Y SYSTEM
*SOBCnT TISSUE (50) (50) (45)BASAL-CELL T U M O R 1 (2*) SARCOMA. NOS 1 (2*) F I B E O S A R C O M A 1 (2X) 1 (2X) FIBRO A D E N O M A t (8X)
RESPIRATORY SYSTEM
*N4SAL CAVITY (50) (50) (45) PAPILLOMA, NOS 1 (2X)
HEMATOPOIETIC SYSTEM
• M U L T I P L E O R G A N S (50) (50) (45) M A L I G N A N T L Y M P H O M A , NOS 2 ( 4 X ) M A L I G . L Y M P H O M A , L Y M P H O C Y T I C T Y P E 1 (2X) MYELOMONOCYTIC LEUKEMIA 6 (12X) 6 (13X)
ISPLE3N (50) (50) (44) MYELOMONOCYTIC LEUKEMIA 2 (UX) 1 (2X)
CIRCULATORY SYSTEM
NONE
DIGESTIVE SYSTEM
tLIVSE (50) (45) NEQPLAST1C NODULE, .--3-12X1
* N U M B E R OF A N I M A L S KITH TISSUE E X A M I N E D M I C R O S C O P I C A L L Y * N U M B E R OF A N I M A L S NECROPSIED ** EXCLUDES PARTIALLY AUTOLYZED ANIMALS
A-7

TABLE A2 (CONTINUED)
CONTROL ( U N T R ) LOW DOSE 02-0220 02-0270
HEPATOCELLULAR C A R C I N O M A H E M A N G I O M A
f l R I N A P Y SYSTEM
NONE
E N D O C R I N E SYSTEM
I P I T U I T A P Y (40) (48) C A R C I N O M A , NOS 1 (2X) A D E N O M A , NOS 16 (40%) 15 (31X) CHROMOPHOBE A D E N O M A 1 (3X)
t A D R E N A L (48) (50) CORTICAL A D E N O M A 1 (2X) P HE OC HRO MOC YT 0 MA 6 (13*) 1 (2X)
CTHYROID (43) (47) N E O P L A S M , NOS C-CELL A D E N O M A 3 (6*) C-CELL C A R C I N O M A 1 (2*)
t P A N C R E A T I C ISLETS (46) (50) ISLET -CELL A D E N O M A 1 (2*)
R E P R O D U C T I V E SYSTEM
* M A M M A P Y G L A N D (50) (50) A D E t i O C A R C I N O M A , NOS 1 (2*) F I B R O A D E N O M A 6 (12X)
*CLITORAL G L A N D (50) (50) C A R C I N O M A , NOS 1 <2*> K E R A T O A C A H T H O M A
t U T E R U S (48) (50) A D E N O C A R C I N O M A , NOS 1 ( 2 X ) F I B R O M A 2 (4*) L E I O M Y O M A L E I O M Y O S A R C O M A E N D O M E T R I A L STROMAL POLYP 2 ("*) 9 (18*)
# N U M B E R Of A N I M A L S WITH TISSUE E X A M I N E D MICROSCOPICALLY * N U M B E R OF A N I M A L S NECROPSIED
HIGH DOSE 02-0275
1 (2X) 1 < 2 X )
(40) 1 (3X)
14 (35X)
(44) 1 < 2 X )
(37) 1 <3X)
1 (3X)
("2)
(45)
1 (2X)
(45)
1 (2X)
(45)
1 (2*) 1 (2X)a_jii8*j
A-8

TABLE A2 (CONTINUED)
CONTROL ( U N I R )02-0220
L O M DOSE 02-0270
H I G H DOSE 02-0275
E N D O M E T R I A L STROM AL S A R C O M A 2 (it*)
N E R V O U S SYSTEM
»BRAIN (50) (50) (45) C A R C I N O M A , NOS, I N V A S I V E 1 (2X) 1 (2«) A S T R O C Y T O N A 1 (2*)
SPECIAL S E N S E O R G A N S
N O N E
M ' J S C U L O S K E L E T A L S Y S T E M
N O N E
BODY CAVITIES
* A B D O « I N A L C A V I T Y (50) (50) (45) L E I O M Y O S A R C O M A 1 (2%)
ALL OTHER SYSTEMS
NONE
A N I M A L DISPOSITION S D M M A R Y
A N I M A L S I N I T I A L L Y IN STUDY 50 50 50 N A T U R A L DEATHS 7 4 11 M O R I B U N D SACRIFICE 2 3 2 S C H E D U L E D SACRIFICE 5 A C C I D E N T A L L Y K I L L E D T E R M I N A L SACRIFICE 36 43 36 A N I M A L MISSING 1
t N D M B E R OF A N I M A L S KITH TISSUE E X A M I N E D M I C R O S C O P I C A L L Y * N U M B E R OF A N I M A L S NECROPSIED
A-9

TABLE A2 (CONCLUDED)
CONTROL(UNTR) LOW DOSE HIGH DOSE 02-0220 02-0270 02-0275
T U M O R S U M M A R Y
TOTAL A N I M A L S WITH P R I M A R Y TONORS* 27 3« 28 TOTAL P R I M A R Y TDMOBS U2 US 45
TOTAL A N I M A L S WITH BENIGN TUHORS 23 30 20 TOTAL B E N I G N T<JMOBS 33 35 28
TOTAL A N I M A L S WITH MALIGNANT TOMOfiS 9 12 11 TOTAL M A L I G N A N T T U M O E S 9 12 13
TOTAL A N I M A L S HITH SECONDARY TUMORS* 1 1 T O T A L S E C O N D A R Y T U M O R S 1 1
TOTAL ANIMALS WITH TUMORS UNCERTAINB E N I G N O R M A L I G N A N T 1 a
TOTAL U N C E R T A I N T U M O R S 1 4
TOTAL ANIMALS WITH TUMORS UNCERTAINPRIBABY OR METASTATIC TOTAL UNCERTAIN TUMORS
* PRIMARY TUMORS: ALL TUMORS EXCEPT SECONDARY TUMORS # SECONDARY TUMORS: METASTATIC TUMORS OR TUMORS INVASIVE IMTO AN ADJACENT ORGAN
A-IO

APPENDIX B
SUMMARY OF THE INCIDENCE OF NEOPLASMS IN MICE TREATED WITH 2,3,5,6-TETRACHLORO-4-NITROANISOLE


TABLE Bl SUMMARY OF THE INCIDENCE OF NEOPLASMS IN MALE MICE TREATED WITH
2,3,5,6-TETRACHLORO^t-NITROANISOLE
CONTROL ( U N T E ) LOW DOSE H I G H DOSE 05-0360 05-0271 05-0276
A N I M A L S INITIALLY IN STUDY 55 55 55 ANIMALS MISSING 1 A N I M A L S N E C R O P S I E D 55 55 53 A N I M A L S E X A M I N E D H I S T O P A T H O L O G I C A L L Y * * 5 5 514 52
I N T E G ' J M E N T A R Y S Y S T E M
*SKIN (55) (55) (53) SO.UAMOUS CELL P A P I L L O M A 1 (2X )
*SUBCnl TISSUE (55) (55) (53) F I B R O M A 2 (4%) F I B R O S A R C O M A 1 (2%) 1 ( 2 X ) LiSIOMYOSARCOMA 2 (MX) 2 (»*) H E M A N G I O M A 1 (2X)
R E S P I R A T O R Y S Y S T E M
# L U N G (51) (54) (51) H E P A T O C E L L U L A R C A R C I N O M A , M E T A S T 4 (7S) A L V E O L A R / B R O N C H I O L A P A D E N O M A 6 (11*) 4 (7X) i» (8X) ALVEOLAR/BRONCHIOLAR CARCINOMA 6 (11%) 13 (214%} 9 (18*) C O R T I C A L C A R C I N O M A , M E T A S T A T I C 1 (2* ) '
HEflATOPOIETIC SYSTEM
* M U L T I P L E O R G A N S (55) (55) ( 5 3 ) M A L I G N A N T L Y M P H O M A , N O S 3 (5%) M A L I G . L Y M P H O M A . U N D I F F E R - T Y P E 1 ( 2 X ) 3 (611) M A L I G . L Y M P H O M A , L Y M F H O C Y T I C T Y P E 2 ( U X ) 1 < 2 X ) M A L I G . L Y M P H O M A , HISTIOCYTIC T Y P E 1 ( 2 X ) 1 ( 2 X ) M A L I G N A N T L Y M P H O M A , M I X E D T Y P E 2 ( 4 R ) 3 ( 6 X ) G R A N U L O C Y T I C L E H K E H I A 1 (2X)
*SPLEEN (51) (53 ) (50)
N E O P L A S M , NOS 1 (2X ) H E M A N G I O M A 1 ( 2 X ) H E M A N 2 I O S A R C O M A
* N U M B E R OF A N I M A L S W I T H IISSIIE E X A M I N E D M I C R O S C O P I C A L L Y * N U M B E R OF A N I M A L S N E C R O P S I E D
** EXCLUDES PARTIALLY AUTOLYZED ANIMALS
B-3

TABLE Bl (CONTINUED)
C O N T R O L ( U N I R ) L O W DOSE 05-0360 05-027 1
• M E D I A S P I N A L L. NODE ( tB) (50) A L V E O L A R / B R O N C H I O L A R C A , M E T A S T A 1 < 2 X )
tBESENTEPIC L . N O D E (48) (50) H E P A T O C E L L U L A R C A R C I N O B A , M E T A S T 1 ( 2 X ) H E B A N G I O S A R C O M A 1 (2t) M A L I G . L Y M P H O M A , U N D I F F E R - T Y P E M A L I G . L Y M P H O M A , LYMPHOCYTIC TYPE 1 (2X) M A L I G N A N T L Y M P H O M A , M I X E D T Y P E
t A X I L L A P Y L Y M P H N O D E ( U 8 ) (50) L E I O M Y O S A R C O M A , M E T A S T A T I C
• D U O D E N U M (50) (52) M A L I G . L Y B P H O B A , L Y M P H O C Y T I C TYPE 1 (2<S)
• J E J U N U M (50) (52) MA L IS. L Y M P H O M A , U N D I F F E R - T Y P E M A L I G N A N T L Y M P H O M A , M I X 2 D T Y P E 1 ( 2 X )
CIPC ' ILATOEY SYSTEM
N O N E
DIGESTIVE SYSTEM
t L I V E R (5«) (52) H E P A I O C E L L U L A R A D E N O M A t ( 7 K ) 3 ( 6 X ) H E P A T O C E L L D L A R C A R C I N O M A 2 U ( 4 l t X ) 13 (255!) MIXED HEPATO/CHOLANGIO C A R C I N O M A 2 C*X) A N G I O S A R C O B A 2 ( 4 X )
• S T O M A C H ( 5 1 ) (52) S Q U A M O U S C E L L C A R C I N O M A 1 ( 2 % )
• D U O D E N U M (50) (52) A D E N O B A T O t l S P O L Y P , N O S 1 (2%)
U B I N A S Y S Y S T E M
• K I D N E Y / P E L V I S (5 t ) (53)
* N U M B E R O F A N I M A L S K I T H TISSUE E X A M I N E D M I C R O S C O P I C A L L Y * N U M B E R OF A N I M A L S NECROPSIED
B-4
H I G H DOSE 05-0276
(K7)
(17)
1 (2*) 1 (2*) 1 (2X)
( U 7 ) 1 (2%)
(50)
(50) 1 ( 2 X )
(52) 2 ( t X ) 9 ( 1 7 X ) 2 (UX) 3 ( 6 X )
(50)
(50)
( 5 2 )
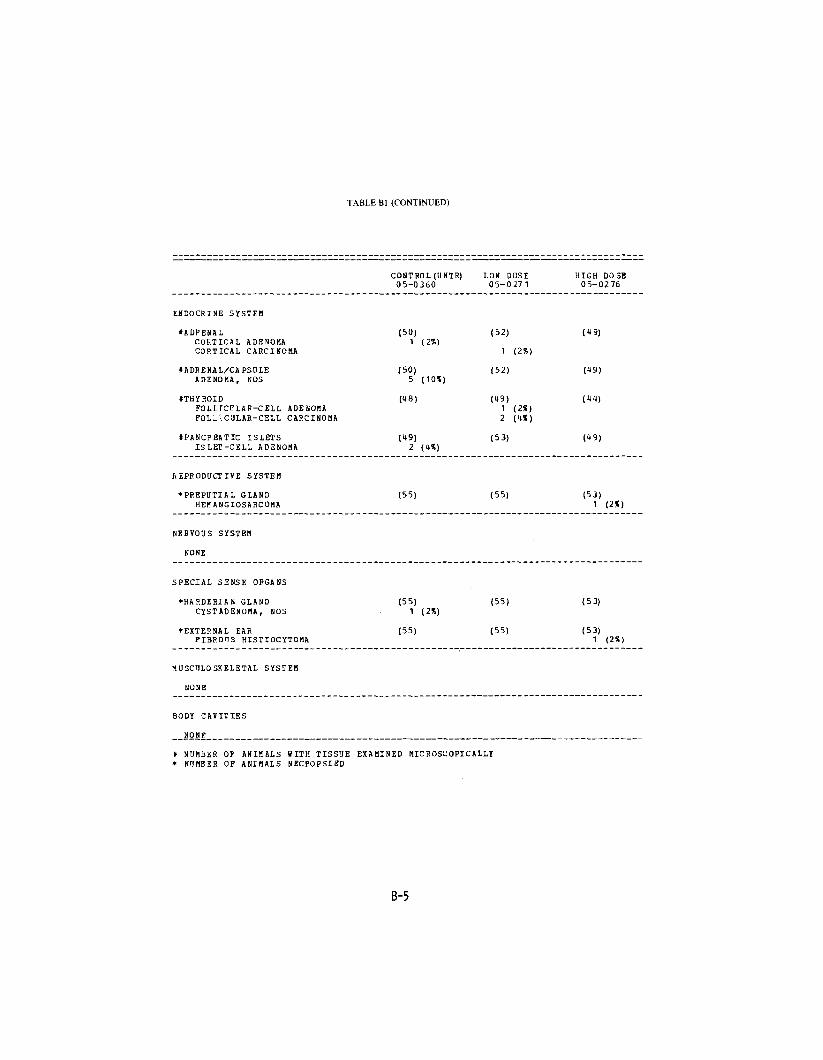
TABLE Bl (CONTINUED)
C O N T R O L ( U N I R ) LOU DOSE H I G H DOSE 05-0360 05-0271 05-0276
E N D O C R I N E S Y S T E M
t A D P E N A L (50) (52) (19) CORTICAL A D E N O M A 1 (2%) C O R T I C A L C A R C I N O M A 1 < 2 X )
#ADRENAL/CAPSULE (50) (52) (149) A D E N O M A , NOS 5 (10*)
ITHYROID ( U S ) (19) (11) FOLLICITLAR-CELL ADENOMA 1 (2X) F O L i - l C U L A R - C E L L C A R C I N O M A 2 (IX)
i P A N C F E A T I C ISLETS (49) (53) (19) ISLET-CELL A D E N O M A 2 ( 4 % )
REPRODUCTIVE SYSTEM
* P K E P U T I A L G L A N D (55) (55) (53) H E M A N G I O S A R C O M A 1 ( 2 X )
N E R V O U S SYSTEM
N O N E
SPECIAL SENSE ORGANS
* H A H D E R I A N G L A N D (55) (55) (53) C Y S T A D E N O M A , NOS 1 ( 2 X )
* E X T E R N A L EAR (55) (55) (53) PIBPOHS HISTIOCYTOMA 1 (2*)
MUSC1LO S K E L E T A L S Y S T E M
N O N E
BODY C A V I T I E S
_ _ N O N E
* N U M B E R O F A N I M A L S W I T H T I S S U E E X A M I N E D MICROSCOPICALLY * N U M B E R OF A N I M A L S NECP.OPSISD
B-5

TABLE Bl {CONCLUDED)
C O H I E O L ( O N T H ) LOW DOSE HIGH DOSE 05-0360 05-0271 05-0276
ALL 01 HEP SYSTEMS
* M U L I I P L E O R G A N S (55) (55) (53) N E O P L A S M , NOS 2 (4X) S A R C O M A , NOS 1 (2*)
A N I M A L DISPOSITION S D M M A K Y
A N I M A L S I N I T I A L L Y IN STUDY 55 55 55 N A T U R A L D E A T H S 11 11 M O R I B U N D SACRIFICE 14 1 S C H E D U L E D SACRIFICE A C C I D E N T A L L Y KILLED 2 T E R M I N A L SACRIFICE 44 to A N I M A L M I S S I N G 1
3 I N C L U D E S A U T O L Y Z E D A N I M A L S
T U M O R S U M M A R Y
TOTAL A N I M A L S WITH P R I M A R Y T U M O R S * 43 38 36 TOTAL P R I M A R Y TUMORS 59 57 50
TOTAL A N I M A L S WITH B E N I G N T U M O R S 22 8 6 T O T A L B E N I G N TUMOFS 24 10 7
TOTAL A N I M A L S W I T H M A L I G N A N T T U M O R S 29 34 32 TOTAL M A L I G N A N T TDMOP.S 35 47 40
TOTAL A N I M A L S W I T H S E C O N D A R Y TUMORS* 4 2 1 T O T A L S E C O N D A R Y T U M O R S 5 2 1
TOTAL A N I M A L S W I T H T U M O R S U N C E R T A I N B E N I G N OR M A L I G N A N T 3
T O T A L U N C E R T A I N T U M O R S 3
TOTAL A N I M A L S W I T H T U M O R S U N C E R T A I N P R I M A R Y OR METASTATIC
TOTAL U N C E R T A I N TUMOSS
* P R I M A R Y T U M O R S : ALL T U M O R S EXCEPT S E C O N D A R Y T U M O R S * S E C O N D A R Y T U M O R S : METASTATIC T U M O K S OR TUHORS I N V A S I V E INTO AN A D J A C E N T O B G A N
B-6

TABLE B2 SUMMARY OF THE INCIDENCE OF NEOPLASMS IN FEMALE MICE TREATED WITH
2,3,5,6-TETRACHLORO^-NITROANISOLE
CONTROL ( H N T R ) LOW COSE HIGH DOSE 06-0360 06-0271 06-0276
A N I M A L S I N I T I A L L Y IN STUDY 55 55 55 A N I M A L S M I S S I N G 1 1 A N I M A L S N E C R O P S I E D 55 54 52 A N I M A L S E X A M I N E D HISTOPATHOLOGICALLY ** 55 54 52
INTEGUMENTARY SYSTEM
*SKIN (55) (54) (52) S Q U A M O U S CELL C A R C I N O M A 1 (2%)
*SUBCUT TISSUE (55) (54 ) (52) F I B R O S A R C O M B 1 < 2 X ) 1 (21) H E M A N G I O M A 1 ( 2 X )
RESPIRATORY SYSTEM
ILUNG (55) (52) (52) H E P A T O C E L U I L A R C A R C I N O M A , W E T A S T 2 ( 4 % ) 1 ( 2 X ) M I X E D H E P A T O / C H O L A N G I O C A , M E T A S T 1 (21) A L V E O L A R / B R O N C H I O L A R A D E N O M A 3 (55) 3 (6X) 2 (4*) A L V E O L A R / B R O N C H I O L A P C A R C I N O M A 1 (2*) 5 ( I D S ) 2 ( 4 X )
HEMATOPOIETIC SYSTEM
* M U L I I P L E O R G A N S (55) (54) (52) M A L I G N A N T L Y M P H O M A , N O S 1 ( 2 % ) M A L I G . L Y M P H O M A , U N D I F F E R - T Y P E 2 (4S) 3 (6X) M A L I G . L Y M P H O M A , L Y M P H O C Y T I C T Y P E 2 ( 4 % ) 11 (20S) 10 ( 1 9 X ) M A L I G . L Y M P H O M A , HISTIOCYTIC T Y P E 1 (2X) 2 (4X) M A L I G N A N T L Y M P H O M A , M I X E D T Y P E ' 6 (1U) 2 ( 4 X ) 5 ( 1 0 X ) L Y M P H O C Y T I C L E U K E M I A 1 < 7 X )
*SPLBEN (53) (52) (51) H E M A N G I O S A R C O M A 2 ( 4 % ) 1 ( 2 X ) M A L I G . L Y M P H O M A , L Y M P H O C Y T I C T Y P E 3 (6%) M A L I G N A N T LYMPHOMA, M I X E D TYPE 1 (2S) 1 (2«) 1 (2X)
t M E D I A S T I N A L L . N O D E (47) (50) (46) M I X E D H E P A T O / C H O L A N G I O C A , M E T A S T 1 (2%)
» N U M B E R OF A N I M A L S KITH TISSUE E X A M I N E D M I C R O S C O P I C A L L Y * N U M B E R OF A N I M A L S NECEOPSIED
** EXCLUDES PARTIALLY AUTOLYZED ANIMALS
B-7

TABLE B2 (CONTINUED)
C O N T R O L ( O N T R ) L O U DOSE 06-0360 06-0271
t M E S E N T E R I C L. NODE (47) (50) MA LIG. LY M P H O M A , L Y M P H O C Y T I C TYPE 1 < 2 X ) M A L I G N A N T L Y M P H O M A , M I X E D T Y P E 2 < < * % ) 1 (2%)
# R E N A L L Y K P H NODE (47) (50) S A R C O M A , N O S
* L I V E R (54) (53) M A L I G N A N T L Y M P H O M A , N O S 1 (2*) M A L I G . L Y M P H O M A , HISTIOCYTIC TYPE 2 (4%)
t I L E U M (52) (53) M A L I G . L Y M P H O M A , L Y M P H O C Y T I C TYPE
t C O L O N (48 ) (51) M A L I G . L Y M P H O M A , D NDIFFES-TY PE
tTHYTJS (35) (39) A L V S O L A R / B 5 0 N C H I O L A F C A , M E T A S T A 1 ( 3 X ) T H Y M O M A 1 (3%) M A L I G N A N T L Y M P H O M A , M I X E D T Y P E
C I R C U L A T O R Y S Y S T E M
I H E A S T (55) (53) A L V E O L A R / B R O N C H I O L A R C A , M E T A S T A 1 (2*) H E M A N G I O M A 1 (2«)
D I G E S T I V E S Y S T E M
K L I V E H (54) (53) H E P A T O C E L H I L A R A D E N O M A t (7%) 2 ( 4 % ) H E P A T O C E L L U L A R C A R C I N O M A 7 (13*) 1 (2%) M I X E D H E P A T O / C H O L A N G I O C A R C I N O M A 1 ( 2 X ) H E M A N G I O M A 1 (2X) A N G I O S A R C O M A
• P A N C R E A S ( 4 9 ) (51) M I X E D H E P A T O / C H O L A N G I O C A , M E T A S T 1 (2X)
f S T O M A C H (53) (51) PAPILLOMA.^NOS,,
* N I I M B E P OF A N I M A L S WITH TISSHE E X A M I N E D M I C R O S C O P I C A L L Y * N U M B E R OF A N I M A L S N E C R O P S I E D
HIGH DOSE 06-0276
(46) 2
( 4 6 ) 1
(52) 1
(51) 1
(49) 1
(38)
1
(52)
(52) 21
1
(50)
(51)
(4*)
(2X)
(2X)
(2*)
( 2 X )
(3X)
( 4 X ) (6X)
(2*)
B-8

TABLE B2 (CONTINUED)
S Q U A M O U S CELL P A P I L L O M A M I X E D H E P A T O / C H O L A N G I O C A ,
I D U O D E N U M A D E N O M A T O U S P O L Y P , N O S
U R I N A R Y S Y S T E M
N O N E
E N D O C S I N E S Y S T E M
(t P I T U I T A R Y A D E N O M A , N O S C H R O M O P H O B E A D E N O M A BASOPHIL A D E N O M A S A R C O M A , N O S , M E T A S T A T I C
t A D R E N A L P H E O C H R O M O C Y T O M A
#THYROID F O L L I C U L A R - C E L L A D E N O M A F O L L I C U L A R - C E L L C A P C I N O M A
R E P P O D U C T I V E SYSTEM
* M A M M A B Y G L A N D A D E N O C A R C I N O M A , N O S A C I N A R - C E L L C A R C I N O M A F I B R O A D E N O M A
* U T E R U S N E O P L A S M , NOS, M A L I G N A N T I 2 I O M Y O M A E N D O N E T R I A L S T R O M A L POLYP
• O V A R YM I X E D H E P A T O / C H O L A N G I O C A ,
C O N T R O L ( U N I R ) 06-0360
LOW DOSE 06-027 1
HIGH DOSE 06-0276
2 (1*) M E T A S T 1 (2%)
(52) (53) (51) 1 U*)
(12) ( 4 7 ) 2 (1*)
(11) 3 (7X)
21 (51) (2%)
1 (2*)
(50) (53) (19) 1 (2%)
(18) 1 (2S)
(39) (18) 11 (2*) (2*)
(55) (51) 1 (2*)
(52) 1 (2%)
1 (2S) 1 ( 2 X )
(51) 1 ( 2 % )
(51) (52)
12
(2*) ( IX)
( 5 0 ) (19) (19) M E T A S T 1 (2<)
P A P I L L A R Y C Y S T A D E N O M A ,C H O P I O C A R C I N O M AH E H A N G 1 0 S A R C O M A
NOS 1 1
(2*) (2X)
#*
N U M B E R N U M B E R
OF OF
A N I M A L S A N I M A L S
WITH TISSUE NECEOPSIED
E X A M I N E D M I C R O S C O P I C A L L Y
B-9

TABLE B2 (CONTINUED)
CONTROL ('J NTH) LOW DOSE H I G H DOSE 06-0360 06-0271 06-0276
N E R V O U S SYSTEM
I B R A I N (55) (52) (52) S A R C O M A , NOS, M E T A S T A T I C 1 (2X)
S P E C I A L S E N S E O R G A N S
• H A E D E R I A N G L A N D (55) ( 5 U ) (52) P A P I L L A R Y A D E N O M A 1 ( 2X) P A P I L L A R Y C Y S T A D E N O M A , NOS 1 (2X) 1 (2X)
M I I S C U L O S K E L E T A L S Y S T E M
DONS
B O D Y C A V I T I E S
*BODY C A V I T I E S (55) ( 5 U ) (52) M E S O T H E L T O M A , NOS 1 (2»)
A L L O T H E R S Y S T E M S
* M U L T I P L E O R G A N S (55) (5<t) (52) S A R C O M A , NOS 1 (2%)
H L ' A D S A R C O M A , NOS 1
A N I M A L D I S P O S I T I O N S U M M A R Y
A N I M A L S I N I T I A L L Y IN S T U D Y 55 55 55 N A T U R A L DEATHS 7 11 10 M O R I B U N D S A C R I F I C E H 5 1 S C H E D U L E D S A C R I F I C E A C C I D E N T A L L Y K I L L E D T E R M I N A L S A C R I F I C E "4U 38 13 A N I M A L MISSING 1 1
S _ I N C L U D E S _ A U T O L Y Z E D _ A N I M A L S
# N U M B E R OF A N I M A L S WITH TISSUE E X A B I K E D HICROSCOPICALL* * N U M B E R OF A N I M A L S NECROPSIED
B-IO

TABLE B2 (CONCLUDED)
(: O N T E O L ( U N T R ) L O W DOSE H I G H DOSE 06-0360 06-027 1 06-0276
T U M O R S U M M A R Y
T O T A L A N I M A L S W I T H P R I M A R Y T U M O P S * 3U J7 38 T O T A L P H I M A P Y T U M O R S 50 U 7 52
TOTAL A N I M A L S K I T H B E N I G N T U H O R S 15 9 12 TOTAL B E N I G N T U M O R S 19 1 1 13
T O T A L A N I M A L S W I T H M A L I G N A N T T U M O R S 27 3t 32 T O T A L M A L I G N A N T TOHORS 30 36 39
TOTAL A N I M A L S W I T H S E C O N D A R Y TUMOPS* 2 3 1 T O T A L S E C O N D A R Y T U M O R S 2 9 1
TOTAL ANIMALS WITH TUMORS UNCERTAINBENIGN OR MALIGNANT 1
TOTAL UNCERTAIN TOMOHS 1
TOTAL ANIMALS WITH TUMORS UNCERTAINPRIMARY OH METASTATIC TOTAL UNCERTAIN TUMORS
* PRIMARY TUMORS: ALL TUMORS EXCEPT SECONDARY TUMOPS » SECONDARY TUMOPS: METASTATIC TUMORS OR TUMORS INVASIVE INTO AN ADJACENT ORGAN


APPENDIX C
SUMMARY OF THE INCIDENCE OF NONNEOPLASTIC LESIONS IN RATS TREATED WITH
2,3,5,6-TETRACHLORO-4-NITROANISOLE


TABLE Cl SUMMARY OF THE INCIDENCE OF NONNEOPLASTIC LESIONS IN MALE RATS TREATED WITH
2,3,5,6-TETRACHLORO^t-NITROANISOLE
CONTROL ( U N T R ) LOW DOSE 01-0220 01-0270
A N I M A L S I N I T I A L L Y I N STUDY 50 49 A N I M A L S N E C R O P S I E D 48 49 A N I M A L S E X A M I N E D HISTOPATHOLOGICALLY** 48 49
I N T E G U M E N T A R Y S Y S T E M
• S K I N (48) (49) E P I D E R M A L I N C L U S I O N C Y S T 1 (2*) 1 ( 2 X ) U L C E R , ACUTE 1 ( 2 X ) D S G E N E R A T I O N , N O S 1 (2%) NECROSIS , NOS 1 (2)5)
*SUBCUT TISSUE (46) (49) A B S C E S S , NOS 3 (6«) 1 (2*)
R E S P I R A T O R Y SYSTEM
* N A S A L T U R B I N A T E (48) (49) I N F L A M M A T I O N , S U P P U R A T I V E 1 (2X)
t L U N S / B P O N C H U S (49) B R O N C H I E C T A S I S 1 (2X)
t L U N G (48) (49) E D E M A , NOS I N F L A M M A T I O N , FOCAL 3 H A N U L O M 4 T O U 2 ( 4 X ) P S P I V A S C U L A R C U F F I N G 1 (2*) H Y P E R P L A S I A , A D E N O M A T O U S 2 ( 4 X ) HISTIOCYTOSIS 1 (2%) H Y P E R P L A S I A , L Y M P H O I D
HEHATOPOIETIC SY5TEK
*BONE M A R R O W (46) (47) M Y E L O F I B R O S I S
t S P L E E N («8) ( 4 9 ) NECRgSIS i _FOCAL_.
# N U M B E R O F A N I M A L S W I T H TISSUE E X A M I N E D M I C R O S C O P I C A L L Y * N U M B E R OF A N I M A L S N E C R O P S I E D
** EXCLUDES PARTIALLY AUTOLYZED ANIMALS 9 50 A N I H A L S W E R E I N I T I A L L Y IN THE STUDY, BUT ^6 W E R E F O U N D TO
HIGH01-S
DOSE 2 275
HIGH DOSE 01-0275
1
25 25 25
150 23 23
(25) (23)
(25) (23)
(25) (23)
(25) (23)
(25) (23) 1 ("»«) 1 (4X)
1 ("*)
1 < 4 X )
(25) (22) (5X>
(25) (23)
BE F E M A L E S IN A M A L E GBODP.
C-3
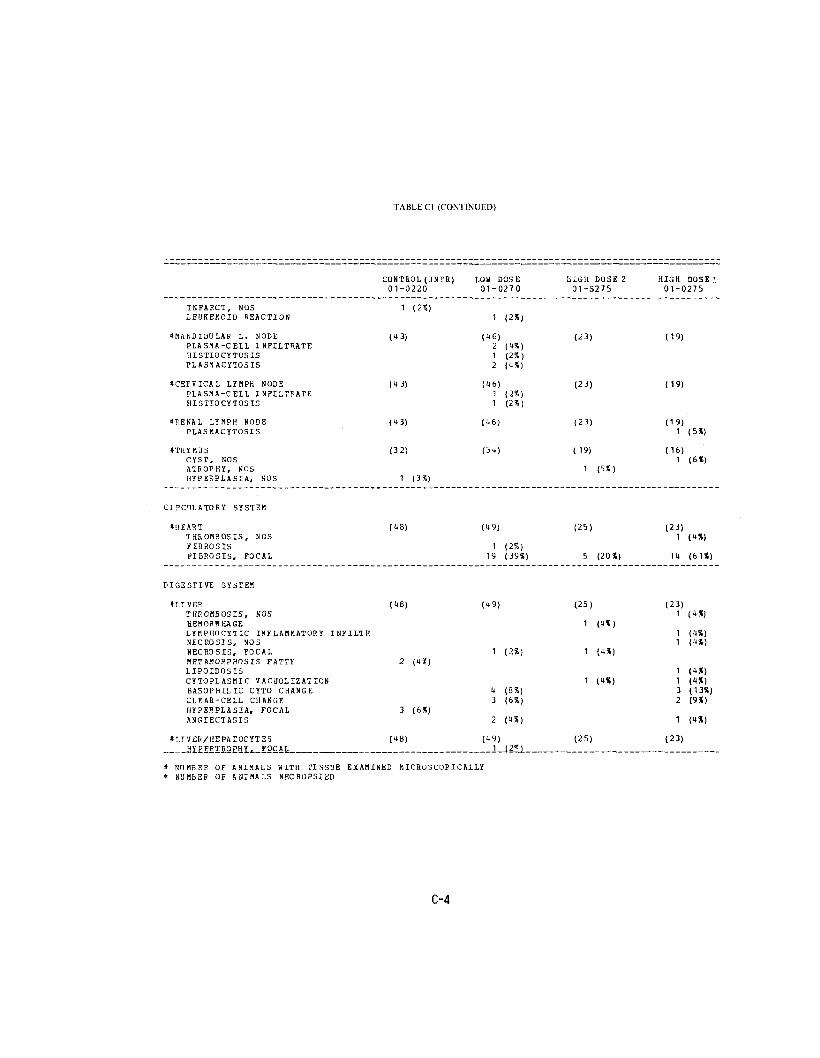
TABLE Cl (CONTINUED)
CONTROL ( U N T R ) LOU DOSE 01-0220 01-0270
I N F A R C T , NOSL E D K E H O I D R E A C T I O N
1 ( 2 % ) 1 (2*)
t M A N D I B ' J L A P L . N O D E ( U 3 ) ( U 6 ) P L A S M A - C E L L I N F I L T R A T E 2 ( U X ) HISTIOCYTOSIS 1 ( 2 % ) PLASNACYTOSIS 2 (US)
* C E F V I C A L L Y M P K N O D E (43) (16) P L A S M A - C E L L I N F I L T R A T E 1 ( 2 % ) HISTIOCYTOSIS 1 ( 2 U )
• R E N A L L Y M P H N O D E («3) ( 4 6 ) P L A S M A C Y T O S I S
I T H Y N U S (32) (314) C Y S T , NOS A T R O P H Y , N O S H Y P E R P L A S I A , NOS 1 ( 3 % )
C I P C U L A T O P . Y SYSTEM
• H E A R T ( U 8 ) (1*9) T H R O M B O S I S , N O S FIBBOSIS 1 ( 2 % ) FIBROSIS , F O C A L 19 ( 3 9 % )
D I G E S T I V E S Y S T E M
• L I V E R ( U 8 ) (09 ) THROMBOSIS, NOS H E M O R R H A G E L Y M P H O C Y T I C I N F L A M M A T O R Y I N F I L T R N E C R O S I S , N O S N E C R O S I S , F O C A L 1 ( 2 % ) METAMORPHOSIS FATTY 2 (U«) L IPOIDOSIS C Y T O P L A S M I C V A COOL IZAT ION B A S O P H I L I C CYTO C H A N G E U ( 8 % ) C L E A R - C E L L C H A N G E 3 ( 6 X ) HYPERPLASIA, FOCAL 3 (6%) A N G I E C T A S I S 2 («)
* L I V £ R / H E P A T O C Y T E S ( U 8 ) (19)H Y P E R T R O P H Y , FOCAL 1-J2H_
* N U M B E R O F A N I M A L S W I T H TISSUE E X A M I N E D M I C R O S C O P I C A L L Y * N U M B E R O F A N I M A L S N E C R O P S I E D
H I G H DOSE 2 01-3275
(23)
(23)
(23)
(19)
1 (5*)
(25)
5 (20*)
(25)
1 ( U » )
1 (It*)
1 ( U X )
(25)
HIGH DOSE 1 01-0275
(19)
(19)
(19) 1 (5*)
(16) 1 ( 6 X )
(23) 1 ( U X )
11 ( 6 1 X )
(23) 1 (UX)
1 ( U X ) 1 ( U X )
1 ( U X ) 1 («%) 3 (13X) 2 (9X)
1 ( 4 X )
(23)
C-4

TABLE Cl (CONTINUED)
C O N T R O L ( U N T R ) LOW DOSE 01-0220 01-0270
*BILE D'ICT (18) (49) H Y P E R P L A S I A , N O S 6 ( 1 2 % )
• P A N C R E A S (11) («6 ) I N F L A M M A T I O N , N O S 2 < 5 X ) A T R O P H Y , FOCAL
IPANCFEATIC A C I N U S f t " ) (16) A T R O P H Y , NOS 1 < 9 X ) AT80PHY, FOCAL a (17%)
•STOMACH (18) (18) E D E M A , NOS I N F L A M M A T I O N , ACUTE/CHRONIC I N F L A M M A T I O N , C H R O N I C H Y P E R P L A S I A , P S E U D O E P I T H E L I O M A T O H Y P E R K E R A T O S I S A C A N T H O S I S
• G A S T R I C flUCOSA (U8) (18) H Y P E R P L A S I A , DIFFUSE
• J E J U N U M (16) (19) "AHASITISM
• ILEUM (16) (19) I N F L A M M A T I O N , FOCAL
•COLON (12) (19) LYMPHOCYTIC I N F L A M M A T O R Y INFILTP P A R A S I T I S M 6 (12%)
U R I N A R Y SYSTEM
• K I D N E Y (18) (19) EMBOLUS, SEPTIC I N F L A M M A T I O N , FOCAL I N F L A M M A T I O N , S U P P U R A T I V 2 N B P H R O P A T H Y 35 (73 X) 20 (11%) M E T A P L A S I A , OSSEOUS 1 (2%)
tKIDNEY/TUBULE (18) (19) P IGMENTATION. SOS 1_J2%1
* N U M B E R OF A N I M A L S WITH TISSUE E X A M I N E D MICROSCOPICALLY * N'JMBEE OF A N I M A L S MECROPSIED
H I G H DOSE 2 01-S275
(25) 1 (1«)
(25)
1 (1%)
(25)
2 (8%)
(25) 1 ( K % ) 1 (1%)
1 ( IX) 1 ( IX)
(25) 1 («%)
(21)
(21) 1 ( « X )
(23)
5 (22%)
(25)
11 ( U U % )
(25)
HIGH DOSE 1 01-0275
(23) 9 (39%)
(21)
(21) 1 (5%) 3 (11%)
(23)
1 (1%) 1 (IX)
(23)
(23) 1 (1%)
(23)
(23) 1 (U%) 2 (9%)
(23) 1 (1%) 1 (1*) 1 (IX)
11 (48%)
(23)
C-5

TABLE Cl (CONTINUED)
E N D O C R I N E S Y S T E M
* P 1 T ' J I T A P Y H Y P E P P L A S I A , F O C A L
* A D P E N A L N E C R O S I S , F O C A L A N G I E C T A S I S H E H A I O P O I E S I S
* A D P E N A L C O R T E X H E B O P R H A G E N E C R O S I S , N O S L IPOIDOSIS A N G I E C T A S I S
• A D R E N A L M B D T I L L A H Y P E R P L A S I A , N O S H Y P E P P L A S I A , F O C A L
( T H Y R O I D H Y P E P P L A S I A , C - C E L L
• P A N C R E A T I C ISLSTS H Y P E R P L A S I A , NOS
R E P R O D U C T I V E S Y S T E M
* B A M M A R Y G L A N D D I S P L A C E M E N T , N O S L A C T A T I O N
• P R O S T A T E I N F L A M M A T I O N , SU P P U R ATI VE I N F L A M M A T I O N , ACUTE I N F L A M M A T I O N , A C U T E / C H R O N I C
* S E M I N A L V E S I C L E I N F L A M M A T I O N , S U P P U H A T I V E
# T E S T I S M I N E R A L I Z A T I O N A T R O P H Y ^ . N O S
* N U H B E 1 ? O F A N I M A L S W I T H TISSUE* N U M B E R O F A N I M A L S N E C R O P S I E D
C O N T P O L ( U M T R ) LOW DOSE H I G H DOSE 2
01-0220 0 1-0270 01-S275
(45 ) ( 4 3 ) ( 2 1 ) 1 (2%) 4 ( 9 % )
(46) ( 4 9 ) (25) 1 ( 2 % ) 1 ( 2 X )
1 ( » X )
(46) ( 4 9 ) ( 2 5 )1 (4X) 1 (4*) 1 ( 4 % ) 1 ( 4 X )
(46) ( 49 ) (25) 1 ( 2 % ) 3 ( 7 % ) 3 ( 6 % ) 1 ( 4 « )
( 4 3 ) ( 45 ) (22) 1 ( 2 % )
( 4 4 ) ( 4 6 ) (25) 1 ( 2 % ) 1 (2%)
(48) (49) (25) 1 < 2 X ) 1 ( 2 % ) 1 (4*)
(45) ( 4 9 ) (24) 1 ( 4 X )
1 ( 4 X )
(48) (49) (25)
(48) ( 4 9 ) (24) 1 ( 2 K )
- S 18*1 2 J4*) 3 (13X)
E X A M I N E D M I C R O S C O P I C A L L Y
HIGH DOSE ! 01-C I275
(20)
(22)
( 2 2 )
(22)
(22)
(21)
(23)
(23)1 (4X) 2 (9X)3 (13X)
(23) 1 ("X)
(23)
C-6

TABLE Cl (CONTINUED)
H Y P E R E L A S I A , I N T E R S T I T I A L
*EPIDIDYMISDILATf tTION/DUCISABSCESS, NOS
CBLI
CONTROL (UNTH)01-0220
3 (6%)
(U8)
1 (2%)
LOW DOSE 01-0270
(49) 1 (2%)
H I G H DOSE 01-S275
1 ( tJ)
(25)
2 HIGH DOSE 01-0275
(23)
1
N E R V O U S S Y S T E M
• B R A I NE M B O L U S , SEPTICH E M O R R H A G EF I B R O S I SN E C R O S I S , H E M O P R H A G I C
( U 6 ) (US)
1 ( 2 % )
1 (2*)
( 2 U ) (22) 1 (5*)
1 ( 5 X )
S P E C I A L S E N S E O R G A N S
* E Y EC A T A R A C T
* E Y E / R E r i N AA T f i O P H Y , NOS
( U 8 ) 1 (2X)
(48) 2 (< t«)
(49)
(49)
(25 )
(25)
(23) 1 (IX)
(23)
M U S C I I L O S K E L E T A L
N O N E
SYSTEM
BODY C A V I T I E S
• M E S E N T E R YP E R I A P T E R I T I S
(US) (49) 1 ( 2 R )
(25) (23)
A L L O T H E R
N O N E
S Y S T E M S
S P E C I A L M O R P H O L O G Y S U M M A R Y
NO_LESION_REPORTEB
* S U M B E B OF A N I M A L S W I T H TISSUE* N U M B E R OF A N I M A L S NECROPSIED
E X A M I N E D MICROSCOPICALLY
2
C-7

TABLE Cl (CONCLUDED)
AtnO/NECROPSY/HISTO PERF A U T O / N E C R O P S Y / N O HISTO AOIOLYSIS/NO NECROPSY
C O N T R O L ( U N T H ) L O W DOSE 01-0220 01-0270
1 1
2
t NUHBEP OF ANIMALS WITH TISSUE EXAMINED MICROSCOPICALLY * NUMBER OF ANIMALS WECROPSIED
HIGH DOSE 2
01-S275 HIGH DOSE
01-0275
1
1

TABLE C2 SUMMARY OF THE INCIDENCE OF NONNEOPLASTIC LESIONS IN FEMALE RATS TREATED WITH
2,3,5,6-TETRACHLORO^-NITROANISOLE
CONTROL ( U N T E ) L O W DOSE H I G H DOSE 02-0220 02-0270 02-0275
A N I M A L S I N I T I A L L Y I N S T U D Y 50 50 50 A N I M A L S MISSING 1 A N I M A L S N E C R O P S I E D 50 50 U5 A N I M A L S E X A M I N E D HISTOPATHOLOGICA LLY ** 50 50 1(5
I N T E G U M E N T A R Y SYSTEM
* S K I N (50) (50) (15) E P I D i i R M A L I N C L U S I O N CYST 1 (2*) FIBSOSIS, FOCAL 1 (2*) P O L Y P O I D H Y P E R P L A S I A 1 (2*) HISTIOCYTOSIS 1 < 2 X )
R E S P I R A T O R Y S Y S T E M
* N A S A L T U ' m i N A T E (50) (50) (US) I N F L A M M A T I O N , NOS 1 (2«)
* L U N G / B P O N C H U S (50) (50 ) B S O N C H I E C T A S I S 1 (2%)
# L B N G (50) (50) ( t t ) A T E L E C T A S I S 1 (2%)I N F L A M M A T I O N , NOS 1 (22!) L Y M P H O C Y T I C I N F L A M M A T O R Y INFI1TE ( 2 X ) I N F L A M M A T I O N , INTERSTITIAL 1 (2t) B R O N C H O P N E U M O N I A S U P P ' J R A T I V E < 2 X ) ABSCESS, NOS 2 («*) P N E U M O N I A , C H R O N I C M U R I N E 1 (2«) G 3 A N U L O K A , NOS 1 (2* )
HEMATOPOIETIC SYSTEM
#BONE MARROW (U8) (U7) (U2) MYELOFIBROSIS 1 (2X)
ISPLEEN (50) (50) (UU) ___ HEMAIOPOIESIS
# N U M B E R OF A N I M A L S WITH TISSUE EXAMINED MICROSCOPICALLY * N U M B E R O F A N I M A L S N E C R O P S I E D * EXCLUDES PARTIALLY AUTOLYZED ANIMALS
C-9

TABLE C2 (CONTINUED)
C O N T R O L ( U N T R ) L O W DOSE H I G H DOSE 02-0220 02-0270 . 02-0275
* L U M B A R L Y M P H NODE (43) (49) (43) H Y P E R P L A S I A , NOS 1 ( 2 X )
t P E N A L L Y M P H NODE (43) (49) (13) S I D E R O S I S 1 (2X)
I T H Y M U S (3D (40) (32)H E M O R R H A G E 1 (3X) 1 (3X) A T R O P H Y , N O S 1 ( 3 X )
C I R C U L A T O R Y SYSTEM
K H E A R T (50) (50) (44) FIBROSIS , FOCAL 1 ( 2 X ) 1 ( 2 X )
• E N D O C A R D I U M (50) (50) (44) I N F L A M M A T I O N , C H R O N I C 1 ( 2 X )
D I G E S T I V E S Y S T E M
tLIVER (50) (50) (45) C O N G E S T I O N , NOS 1 (2X) H S M O P F H A G E 1 ( 2 X ) I N F L A M M A T I O N , CHRONIC (2X) I N F L A M M A T I O N , C H R O N I C F O C A L 1 ( 2X ) I N F L A M M A T I O N , FOCAL G R A N U L O B A T O U ( 2X ) C H O L A N G I O F I B R O S I S 1 UX) N E C R O S I S , N O S 1 ( 2 X ) N E C R O S I S , F O C A L 1 (2%) METAMORPHOSIS FATTY 4 (8X) B A S O P H I L I C CYTO C H A N G E 25 (50%) 16 (36X) H Y P E R P L A S I A , F O C A L 9 (18X) A N S I E C T A S I S 1 < 2 X )
* L I V E R / C E N T R I L O B I ' L A R (50) (50) NSCROSIS, NOS 1 (2X)
•BILE DUCT (50) (50) (45) CYST, NOS 1 (2X) H Y P E R P L A S I A , N O S 1 < 2 X )
t P A N C R E A T I C A C I S U S (46) (50) (42) A T R g P H Y i _ N O S
« N U M B E R OF A N I M A L S W I T H TISSUE E X A M I N E D MICROSCOPICALLY * N U M B E R OF A N I M A L S NECPOPSIiD
C-IO
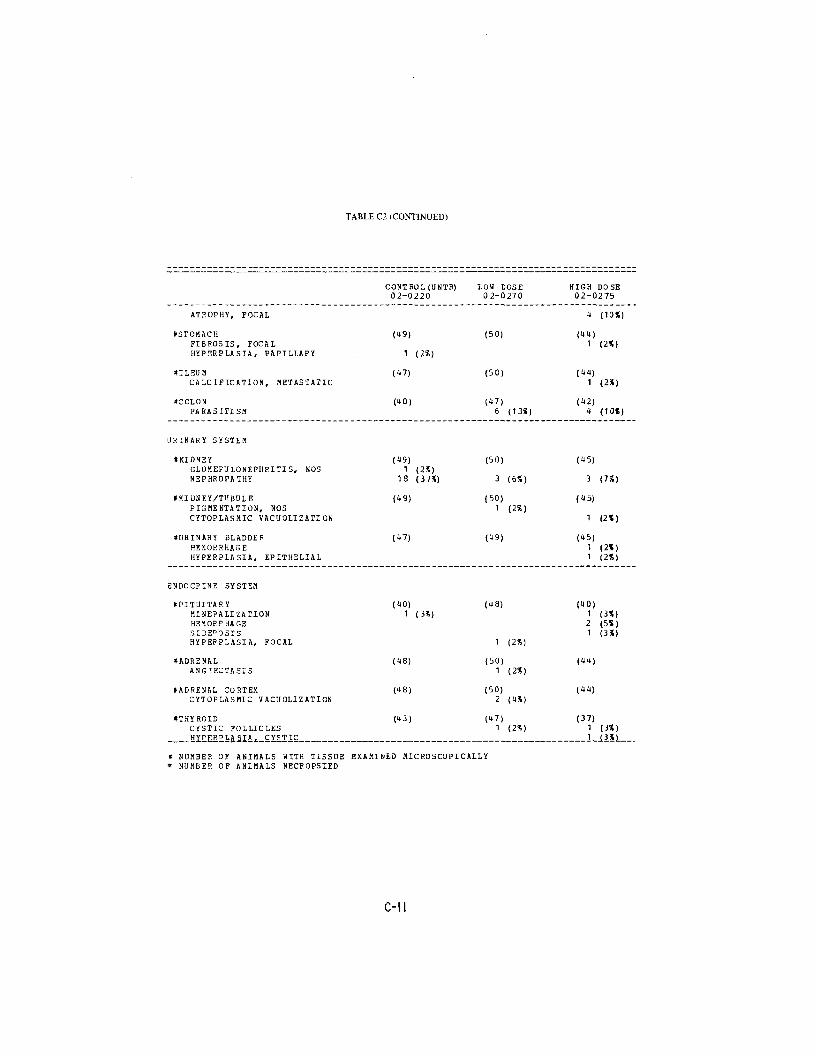
• •
TABLE C2 (CONTINUED)
CONTROL ( U N T H ) LOW DOSE H I G H DOSE 02-0220 02-0270 02-0275
A T H O P H Y , FOCAL 4 (10%)
# S T O M A C H (49) (50) (44 ) FIBROSIS , F O C A L 1 (2X) H Y P 2 R P L A S I A , P A P I L L A R Y 1 ( 2 X )
• I L E U M (47) (50) (44) C A L C I F I C A T I O N , M E T A S T A T I C 1 (2X)
•COLON ( 4 0 ) (47 ) (42) PARASITISM 6 (13X) 4 (10%)
U R I N A R Y S Y S T E M
• K I D N E Y (49 ) (50) (45) G L O M E F U L O N E P H R I T I S , NOS 1 ( 2 X ) N E P H R O P A T H Y 18 (37%) 3 (6%) 3 ( 7 X )
I K I D N E Y / T H B U L E (49) (50) (45) P I G M E N T A T I O N , N O S 1 (2%) C Y T O P L A S M I C V A C U O L I Z A T I ON 1 ( 2 X )
• U R I N A R Y B L A D D E R (47) ( 4 9 ) (45) H E M O R R H A G E 1 < 2 X ) H Y P E R P L A S I A , E P I T H E L I A L 1 ( 2 X )
E N D O C R I N E SYSTSM
t P I T U I T A H Y ( 4 0 ) (48) (40) M I N E R A L I Z A T I O N 1 (3*) 1 ( 3 X ) H E 1 0 R F H A G E 2 (5)5) S I D E f O S I S 1 ( 3 X ) H Y P E F P L A S I A , FOCAL 1 (2%)
t A D R E N A L (48) (50) (44) ANGIECTASIS 1 (2%)
•ADRENAL CORTEX (48) (50) (44) CYTOPLASMIC VACUOL1ZATION 2 (4S)
ITHYROID (43) (47) (37) C Y S T I C F O L L I C L E S 1 (2*) 1 (3X) H Y P E R P L A S I A CYSTIC
* NUMBER OF ANIMALS WITH TISSUE EXAMINED MICROSCOPICALLY » NUMBER OF ANIMALS NECPOPSIED
C-ll

TABLE C2 (CONTINUED)
CONTROL ( U NT R) 02-0220
LOU DOSE 02-0270
H Y P E B P L A S I A ,H Y P E R P L A S I A ,
C-CELL FOLLICULAR-CELL
1 (2*) 1 (2*)
H Y P E R P L A S I A , L Y M P H O I D
* P A R A T H Y R O I D (31) (14) H Y P E R P L A S I A , N O D U L A R 1 < 3 X )
R E P R O D U C T I V E SYSTEM
* M A H M A R Y G L A N D (50) (50) D I S P L A C E M E N T , NOS 8 (16%) DILATATION/DUCTS 1 (2%) GALACTOCELE 2 ( IK) FIBROSIS, D I F F U S E H Y P E R P L A S I A , SOS 1 (2%) L A C T A T I O N 1 ( 2 X )
* A C I N U S OF BREAST (50) (50) D I L A T A T I O N , N O S
* C L I T O R A L G L A N D (50) (50) CYST, NOS I N F L A M M A T I O N , ACUTE H Y P E R P L A S I A , CYSTIC 1 (2X)
I U T E R U S (1*8) (50) D I L A T A T I O N , NOS 6 (12%) H Y D R O M E T R A 1 ( 2%) I N F L A M M A T I O N , S U P P U R A T I V E 1 ( 2 % ) I N F L A M M A T I O N , ACUTE 1 (2%) ABSCESS, NOS 1 (2*) ABSCESS, C H R O N I C 1 ( 2 % ) NECROSIS, NOS 1 (2*) D E C I D U A
# C E R V I X U T E R I (48) (50) H E M A T O M A , NOS 1 (2%)
t U T E R U S / E N D O M E T R I U M (48) (50) CYST, NOS I N F L A M M A T I O N , NOS 1 (2%) H Y P S R P L A S I A , NOS H Y P E R P L A S I A , CYSTIC 1 ( 2 X )
t O V A R Y (49) (50) C Y S T , NOS 4 (8X)
* N U M B E R OF A N I M A L S WITH TISSUE E X A M I N E D MICROSCOPICAL1Y * N U M B E R OF A N I M A L S NBCROPSIED
HIGH DOSE 02-0275
3 (8%) 1 (3*) 1 (3X)
(21)
(45) 6 (13X) 2 ( 4 X )
1 (2X)
(45) 1 (2*)
(45) 1 ( 2 X ) 1 (2X) 1 (2X)
(45) 3 (7«)
5 (11X)
1 < 2 X )
(45)
(45) 2 ( U % )
1 ( 2 X )
(44) 2_J5X1
C-I2

TABLE C2 (CONCLUDED)
CONTROL (UNTR) LOW DOSE HIGH DOSE 02-0220 02-0270 02-0275
I N F L A M M A T I O N , NO S 1 (2*) I N F L A M M A T I O N , S O P P U R A T I V E 1 (2*) I N F L A M M A T I O N , ACUTE 1 (2X) I N F L A M M A T I O N , CHBONIC 2 (5J) D E G E N E R A T I O N , CYSTIC 2 (41!)
N E R V O U S S Y S T E M
t B R A I N (50) (50) («5) H E M O R R H A G E 2 (»*) N E C R O S I S , NOS 2 (<*«)
SPECIAL SENSE O R G A N S
NONE
M U S C U L O S K E L E T A L S Y S T E M
N O N E
BODY CAVITIES
N O N E
A L L O T H E R S Y S T E M S
D I A P H R A G M Hi lRNIA, NOS 1
SPECIAL M O R P H O L O G Y S U M M A R Y
NO LESION R E P O R T E D 11 1 3 A N I M A L M I S S I N G / N O N E C R O P S Y 1 A ' lTO/NECROPSY/HISTO P E R F 1 1 A U T O L Y S I S / N O NECROPSY t
I N U M B E R OF A N I M A L S KITH TISSUE E X A M I N E D MICROSCOPICALLY * N U M B E R OF A N I M A L S NECROPSIED
C-13


APPENDIX D
SUMMARY OF THE INCIDENCE OF NONNEOPLASTIC LESIONS IN MICE TREATED WITH
2,3,5,6-TETRACHLORO-4-NITROANISOLE


TABLE Dl SUMMARY OF THE INCIDENCE OF NONNEOPLASTIC LESIONS IN MALE MICE TREATED WITH
2,3,5.6-TETRACHLORO-4-NITROANISOLE
C O N T R O L ( U N T E ) LOW DOSE H I G H DOSE 05-0360 05-0271 05 -0276
ANIMALS INITIALLY IN STUDY 55 55 55 A N I M A L S M I S S I N G 1 A N I M A L S NEC30PSIED 55 55 53 A N I M A L S E X A M I N E D H ISTOPATHOLOGICALLY** 55 54 52
I N T E G U M E N T A R Y SYSTEM
*SK1N (55) (55) (53) EPIDERMAL INCLUSION CYST 1 (2%) INFLAMMATION, GRANULOMATOUS 1 (2*) ACANTHOSIS 1 (2%) POLYP, INFLAMMATORY 1 (2%)
R E S P I H A T O R Y S Y S T E M
t L U N S (54) (54) (51) E D E M A , N O S 1 (2%) H E M O B B H A G E 1 < 2 X ) 1 (2*) H Y P E R P L A S I A , A D E N O M A T O U S 1 ( 2 % ) H Y P B R P L A S I A , A L V E O L A R E P I T H E L I U M 1 (2«)
H E M A T O P O I E T I C S Y S T E M
* S P L E E N ( 5 1 ) (53 ) (50) I N F L A M M A T I O N , P Y O G P A N U L O M ATOU S 1 (2%) A T P O P H Y , NOS 1 ( 2 % ) PLASMACYTOSIS 1 (2X) H Y P E E P L A S I A , L Y M P H O I D 1 (2X) 1 < 2 X ) H E M A T O P O I E S I S . 2 (UJS) 2 (4X) 6 (12X)
tPANCREATIC L.NODE (18) (50) (47) P L A S M A C Y T O S I S 1 (2X)
t A O R T I C L Y M P H N O D E (48) (50) ( 4 7 ) THROMBOSIS, NOS 1 (2X)
OLOMSAP LYMPH NODE (48) (50) (47) HEMOFEHAGE
* N U M 3 E B O F A N I M A L S W I T H TISSUE E X A M I N E D MICROSCOPICALLY * N U M B E E OF A N I M A L S NECROPSIED
** EXCLUDES PARTIALLY AUTOLYZED ANIMALS
D-3

TABLED! (CONTINUED)
C O M T R O L ( U N T R ) LOU DOSE HIGH DOSE 05-0360 05-0271 05-0276
*MESENTERIC I. NODE (18) (50) (47) C O N G E S T I O N , HOS 6 (13X) H E M O R R H A G E 1 (2«) HIPEBPLASIA, NOS 1 (2X) HISTIOCYTOSIS 1 (2X) 1 (2%) 1 (2X) P L A S M A C Y T O S I S 1 (2X) H Y P E R P L A S I A , L Y M P H O I D 1 (2X) 2 (4X) HEMATOPOIESIS 15 (30%) 10 (21X)
# S E N A L L Y M P H NODE (48) (50) (47) H E M O R B H A G E 1 (2X) HYPEEPIASIA, LYMPHOID 1 (2X)
I T H Y M U S (39) (36) (39;A T R O P H Y , N O S 1 <3X)
C I R C U L A T O R Y SYSTEM
tHEARr (55) (54) (52) THPOMBOSIS , NOS 1 (2X) fIBSOSIS 1 (2%) FIBROSIS, DIFFUSE 1 <2X)
DIGESTIVE SYSTEH
tLIVER (54) (52) (52) I N F L A H H A T I O N , GHA N U L O M A T O U S 1 (2X) I N F A R C T , NOS 2 (»X) CYTOPLASMIC VACDOLIZATION 4 (8X) 1 (2*) BASOPHILIC CYTO C H A N G E 1 ( 2 X ) EOSINOPHILIC CYIO C H A N G E 1 (2X) CLEAR-CELL CHANGE 3 (6X) 1 (2X) H Y P E H P L A S I A , NOS 1 ( 2 X )
*LIVEB/CENTPILOBOLAR (54) (52) (52) C Y T O P L A S M I C V A C D O L I Z A T I O N 1 (2X)
*BILE DUCT (55) (55) (53) CYST, NOS 1 (2*) 2 ( 4 X )
I P A N C R E A S (49) (53) (49) DILATATION/DHCTS 1 < 2 X >
* N a M B E R OF A N I M A L S WITJJ TISSUE E X A M I N E D MICROSCOPICALLY * N U M B E R OF A N I M A L S BECROPSIED
D-4

TABLE Dl (CONTINUED)
C O N T R O L ( U N T R ) L O W DOSE H I G H DQSE 05-0360 05-0271 05-0276
A T R O P H Y , NOS 1 (2%) A T R O P H Y , F O C A L 1 (2X)
• S T O M A C H (51) (52) (50) U L C E B , N O S 2 (««) L Y W P H O C Y T I C I N F L A M M A T O R Y I N F I L T R 1 (2*) I N F L A M M A T I O N , A C U T E 1 (2%) 1 < 2 X ) A T Y P I A , N O S 1 ( 2 X ) H Y P E R K E R A T O S I S 3 (6X) 5 (10X) A C A N T H O S I S 4 (8*) 5 (10X)
• J E J U N U M (50) (52) (50) D I V E R T I C U L U K 1 (2*) H Y P E R P L A S I A , L Y M P H O I D 1 (2*)
• I L E U M (50) (52) (50) H Y P E R P L A S I A , L Y M P H O I D 2 (4X) 2 (!»*)
*COLON (45 ) (19) ( U 6 ) P A R A S I T I S M 1 (2X) 4 (9X)
U R I N A R Y S Y S T E M
# K I D N E Y (53) (52) H Y D R O N E P H R O S I S 1 (2%) P Y E L O N E P H R I T I S , A C B T E 1 (2%) P Y E L O N E P H R I T I S , C H R O N I C 1 (2%) F I B R O S I S , F O C A L 1 (2X ) N E P H R O P A T H Y 1 (2X) N E C R O S I S , C O R T I C A L 1 (2*)
I O R I N A R Y B L A D D 3 R (48) (52) (51) C A L C U L U S , N O S 1 ( 2 X ) H Y P E R P L A S I A , E P I T H E L I A L 1 (2X)
E N D O C R I N E S Y S T E M
t A D P E N A L (50) (52) (49)N E C R O S I S , C O R T I C A L 1 (2X)
t P A N C R E A T I C ISLETS (49) (53) (49 ) H Y P E S P L A S I A . NOS
* N U M B E R O F A N I M A L S W I T H TISSUE E X A M I N E D MICROSCOPICALLY * N U M B E P OF A N I M A L S NECPOPSIED
D-5

TABLE Dl (CONTINUED)
C O N T R O L ( O N T R )05-0360
LOW DOSE 05-0271
H I G H DOSE 05-0276
R E P R O D U C T I V E SYSTEM
*PREP»TIAL G L A N DCJLCttLIS, NOSDILATATION/DUCTSCYST, NOSI N F L A M M A T I O N , S U P P U E A T I V EHYPEEPLASIA, CYSTIC
I P R O S T A T EINFLAMMATION, ACUTEH Y P E B P L A S I A , P A P I L L A R Y
ITESTISA T R O P H Y , NOS
•EPIDIDYMISM U L T I N U C L E A T E G I A N T - C E L L
(55) 1 (2%)
(52) 1 (2*)
(5U)
(55)
(55)
1 ( 2 % ) 1 (2*)
1 ( 2 % ) 1 ( 2 % )
(50)
1 ( 2 % )
(52) 3 (6X)
(55)
(53)
1 (2X)
(<*9)
(50) 1 ( 2 X )
(53) 1 ( 2 X )
NEPVOUS SYSTEM
N O N E
SPECIAL SENSE ORGANS
•EYEI N F L A M M A T I O N ,C A T A R A C T
ACUTE (55)
1 ( 2%) 1 ( 2 % )
(55) (53)
MtJSCnLOSKELETAL
NONE
SYSTEM
BODY CAVITIES
• A B D O M I N A L C A V I T YNECROSIS, FAT
(55) 5 (9X)
(55) (53)
ALL O T H E R SYSTEMS
O M E N T U M HEMATOJA J _NOS
* N U M B E R OF A N I M A L S* N U M B E R OF A N I M A L S
ilTH TISSDE NECROPSIED
E X A M I N E D
1
MICROSCOPICALLY
D-6

TABLE Dl (CONCLUDED)
CONTROL (ONTR) LOW DOSE H I G H DOSE 05-0360 05-0271 05-0276
SPECIAL M O R P H O L O G Y S U M M A R Y
NO LESION REPORTED 8 5 4 ANIMAL MISSING/NO NECROPSY 1 AUTO/NECFOPSY/HISTO PERF 1 AUTO/NECFOPSY/NO HISTO 1 1 AUTOLYSIS/NO NECEOPSY 1
t N U M B E R OF A N I H A L S WITH TISSUE E X A M I N E D MICROSCOPICALLY * N U M B E R OF A N I M A L S N E C R O P S I E D
D-7

TABLE D2 SUMMARY OF THE INCIDENCE OF NONNEOPLASTIC LESIONS IN FEMALE MICE TREATED WITH
2,3,5,6-TETRACHLORO-4-NITROANISOLE
CONTROL ( U N T R ) LOW DOSE H I G H DOSE 06-0360 06-0271 06-0276
A N I M A L S I N I T I A L L Y IN S T U D Y 55 55 55 A N I M A L S K I S S I N G 1 1 A N I M A L S N E C R O P S I E D 55 5U 52 A N I M A L S E X A M I N E D H I S T O P A T H O L O G I C A L L Y ** 55 5U 52
I N T E G U M E N T A R Y SYSTEM
NONE
R E S P I R A T O R Y S Y S T E M
* L U N G A T E L E C T A S I S I N F L A M M A T I O N , SUPPUP.ATIVE
(55) 1 (2*)
(52) (52)
1 (2X)
H S M A T O P O I E T I C SYSTEM
*BONE M A R R O W (52) < 5 t ) (52) M Y E L O F I B R O S I S 31 (60 / i ) 26 (U8S) 18 (35X) H Y P E R P L A S I A , H E M A T O P O I E T I C 1 ( 2 % )
• S P L E E N ( 5 3 ) ( 5 2 ) ( 5 1 ) H Y P E R P L A S I A , L Y M P H O I D 1 ( 2 % ) 1 ( 2 % ) HEMATOPOIESIS 1 (2%) 7 (13X) !» (S%)
• L U M B A R L Y M P H NODE ( K 7 ) (50) ("6) I N F L A M M A T I O N , S U P P U S A T I V E 1 ( 2 % ) H Y P E H P L A S I A , LYMPHOID 2 (4X) 1 (2X)
t M E S i N T E E I C L. N O D E C*7) (50) (*6) T H R O M B O S I S , N O S 1 ( 2 % ) C O N G E S T I O N , NOS 1 (2%) H Y P K R P L A S I A , N O S 2 ( I » X ) H Y P E R P L A S I A , L Y M P H O I D 3 (6J) 1 ( 2 X ) H E M A T O P O I E S I S 2 ( H X )
t P E N A L L Y M P H NODE (17) (50) (1*6) I N F L A M M A T I O N ^ A C U T E ^ C H R O N I C 1 (25)
* S U M B E P O F A N I M A L S W I T H TISSUE E X A M I N E D M I C R O S C O P I C A L L Y * N U M B E R O F A N I M A L S N E C B O P S I E D
** EXCLUDES PARTIALLY AUTOLYZED ANIMALS
D-8

TABLE D2 (CONTINUED)
C O N T H O L ( U N T H ) LOB DOSE H I G H DOSE 06-0360 06-027 1 06-0276
H Y P E P P L A S I A , L Y M P H O I D 2 (1%)
* A X I L L A R Y L Y M P H NODE (17) (50) (16) I N F L A M M A T I O N , S U P P U R A T I V E 1 ( 2 X )
* T H Y M U S (35) (39) (38) A T R O P H Y , N O S 1 < 3 X ) h Y P E R P L A S I A , L Y M P H O I D 1 '3%)
C I R C U L A T O R Y S Y S T E M
• H E A R T (55) (53) (52) P E P . I A S T E R I T I S 1 (2*,) D E G E N E R A T I O N , M U C O I D 1 (2«)
D I G E S T I V E S Y S T E M
tLIVER (51) (53) (52) C Y T O P L A S M I C V A C U O L I Z A T I O N 2 (1%) C L E A R - C E L L C H A N G E 1 (2*)
I P A N C R E A S (19) (51) (50) D I L A I A T I O N / D U C T S 1 ( 2 % ) 1 (2%) 3 ( 6 X ) I N F L A M M A T I O N , C H R O N I C 2 (1%) A T R O P H Y , N O S 1 ( 2 % ) 3 ( 6 X ) A T R O P H Y , F O C A L 1 ( 2 % ) A T R O P H Y , F A T T Y 1 ( 2 % )
* P A N C H E A T I C A C I N U S (19) (51) (50) A T R O P H Y , F A T T Y 1 ( 2 % )
• S T O M A C H (53) ( 5 1 ) (51) U L C E R , NOS 1 ( 2 % ) 1 ( 2 % ) ABSCESS, NOS 1 ( 2 X ) I N F L A M M A T I O N , C H R O N I C 1 ( 2 % ) I N F L A M M A T I O N , C H R O N I C F O C A L 1 ( 2 X ) E R O S I O N 1 (2*,) K Y P E R P L A S I A , E P I T H E L I A L 2 (t%) H Y P E F P L A S I A , P S E U D O E P I T H E L I O M A T O 1 (255) H Y P E R K E P . ATOSIS 3 ( 6 % ) 7 (11%) A C A N T H O S I S U ( 8%) 7 (11X)
ORINARY SYSTEM
t K I D N E Y (55) ( 5 3 ) ( 5 2 ) _ _ _ _ E Y E L O N E P H R I T I S CHRONIC
# N U M B E R O F A N I M A L S W I T H TISSUE E X A M I N E D M I C R O S C O P I C A L L Y * N U M B E R O F A N I M A L S N E C R O P S I E D
D-9

TABLE D2 (CONTINUED)
CONTROL (UNT8) LOW DOSE HIGH DOSE 06-0360 06-0271 06-0276
I N F L A M M A T I O N , C H R O N I C FOCAL 1 (2%) N E P H R O P A T H Y 1 < 2 X ) D E G E N E R A T I O N , H Y A L I N E 1 ( 2 X )
t U E I N A R Y B L A D D E R (50) (54) (49) LYMPHOCYTIC INFLAMHATORY INFILTE 1 (2X) U L C E R , A C U T E 1 (2») I N F L A M M A T I O N , C H R O N I C 1 (2X)
SNDOCRIN2 SYSTEM
i P I T U I T A R Y (12) (47) (41) H Y P E P . P L A S I A , FOCAL 1 (2%)
• A D R E N A L (50) (53) (49) NECROSIS , NOS 1 (2X) A N G I E C T A S I S 1 (2%)
f T H Y S O I D (48) (39) (48) F O L L I C U L A R CYST, NOS 1 (2*) H Y P E R P L A S I A , CYSTIC 1 (3X) 1 ( 2 K )
U P A N C E E A T I C ISLETS (49) (51) (50) HYPERPLASIA, NOS 3 (6%)
R E P R O D U C T I V E S Y S T E M
tUTBRUS (54) (51) (52) H Y D P O M E T R A 3 <6T. ) D E G E N E R A T I O N . H Y A L I N E 2 < 4 X ) NECROSIS, FOCAL 1 (2«)
* U T E R U S / E N D O M E T E I U M (54) (51) (52) H Y P E R P L A S I A , CYSTIC 15 (28%) 35 (69X) 32 (62%)
# O V A H Y (50) ( 4 9 ) (49) CYST, NOS 7 (14*) 1 (2X) F O L L I C U L A R C Y S T , NOS 5 (10X) 3 (&*) H E M O R R H A G I C CYST 1 (2%) 4 < 8 X ) ABSCESS, NOS 1 (2*) 1 < 2 X )
N E R V O U S SYSTEM
t B R A I N / M E N I N G E S (55) (52) (52) I N F L A M H A T I O N t NOS _ -1-12*1. .
* N U M B E R OF A N I M A L S WITH TISSUE E X A M I N E D MICROSCOPICALLY * N U M B E R OF A N I M A L S NECSOPSIED
D-IO

TABLE D2 (CONCLUDED)
C O N T R O L ( I I N T R ) L O W DOSE H I G H D O S E 06-0360 06-0271 06-0276
* B R A I N (55) (52 ) (52) H Y D R O C E P H A L U S , NOS 2 (U i t ) D E G E N E R A T I O N , NOS 1 ( 2 % )
SPECIAL SENSE O R G A N S
N O N E
M U S C H L O S K E L E T A L S Y S T E M
N O N E
BODY C A V I T I E S
* A B D O H I N A L C A V I T Y (55) (51) (52) NECROSIS , FAT 7 ( 1 3 % )
* M E S E N T E R Y (55) ( 5 U ) (52) CYST, NOS 1 (2*)
ALL OTHER SYSTEMS
* M U L T I P L E O R G A N S (55) ( 5 U ) (52) P E R I A R T E P I T I S 1 (2*)
SPECIAL M O R P H O L O G Y S U M M A R Y
NO LESION R E P O R T E D 1 1 2 A N I M A L M I S S I N G / N O N E C R O P S Y 1 1 AOTO/NECROPSY/HISTO P E H F 2 1 A U T O L Y S I S / N O N E C R O P S Y 2
* N U M B E R OF A N I M A L S W I T H TISSUE E X A M I N E D M I C R O S C O P I C A L L Y * N U M B E R OF A N I M A L S NECf.OPSIED
D-ll


Review of the Bioassay of 2,3,5,6-Tetrachloro-4-Nitroanisole* for Carcinogenicity
by the Data Evaluation/Risk Assessment Subgroup of the Clearinghouse on Environmental Carcinogens
June 29, 1978
The Clearinghouse on Environmental Carcinogens was established in May, 1976, in compliance with DREW Committee Regulations and the Provisions of the Federal Advisory Committee Act. The purpose of the Clearinghouse is to advise the Director of the National Cancer Institute (NCI) on its bioassay program to identify and to evaluate chemical carcinogens in the environment to which humans may be exposed, The members of the Clearinghouse have been drawn from academia, industry, organized labor, public interest groups, State health officials, and quasi-public health and research organizations. Members have been selected on the basis of their experience in carcinogenesis or related fields and, collectively, provide expertise in chemistry, biochemistry, biostatistics, toxicology, pathology, and epidemiology. Representatives of various Governmental agencies participate as ad hoc members. The Data Evaluation/Risk Assessment Subgroup of the Clearinghouse is charged with the responsibility of providing a peer review of reports prepared on NCI-sponsored bioassays of chemicals studied for carcinogenicity. It is in this context that the below critique is given on the bioassay of 2,3,5,6-Tetrachloro-4-Nitroanisole for carcinogenicity.
The reviewer noted an increased (though not statistically significant) incidence of hepatic neoplasms among treated rats and lymphomas and leukemias among treated mice. Although the results indicated that the animals were administered maximum tolerated doses of the compound, the reviewer expressed surprise that the levels were so low given the nature of the substance. He suggested that the low dose levels imposed by the toxicity may have limited the expression of a higher tumor rate at those sites at which an increased incidence was observed. Despite the apparent adequacy of the study, the reviewer felt that some additional testing was appropriate. In this regard, he suggested that short-term in vitro assays might provide useful information. The reviewer concluded that the bioassay
53

did not clearly show 2,355,6-Tetrachloro-4-Nitroanisole to be positive or negative under the conditions of test. His conclusion was accepted without objection.
Clearinghouse Members present:
Arnold L. Brown (Chairman), Mayo Clinic Paul Nettesheim, National Institute of Environmental Health Sciences
Verne Ray, Pfizer Medical Research Laboratory Verald K. Rowe, Dow Chemical U.S.A. Michael B. Shimkin, University of California at San Diego Louise Strong, University of Texas Health Sciences Center
Subsequent to this review, changes may have been made in the bioassay report either as a result of the review or other reasons. Thus, certain comments and criticisms reflected in the review may no longer be appropriate.
<H).S. GOVERNMENT PRINTING O F F I C E t 1978-260-899/3182
54


DHEW Publication No. (NIH) 78-1369


![Title Author(s) Doc URL...the xenobiotic response element (XRE) [17]. Other AhR ligands include exogenous environmental pollutants such as tetrachloro-dibenzo-[p]-dioxin (TCDD), benzo(a)pyrene,](https://img.pdfslide.net/doc/110x75/606775b2224e9c671e61099d/title-authors-doc-url-the-xenobiotic-response-element-xre-17-other-ahr.jpg)

![Attitudes and Intentions Regarding Abortion Provision ......cause of maternal deaths in Africa, which has the world’s highest case-fatality rates.[2,3,5,6] After a 1994 study found](https://img.pdfslide.net/doc/110x75/5e7603389c3374394e64263d/attitudes-and-intentions-regarding-abortion-provision-cause-of-maternal.jpg)