Embed Size (px)
Citation preview
Biochar
and the Carbon Market A review of carbon market development perspectives and
biochar offset projects GHG accounting aspects
11-6-2013 Joint Implementation Network, the Netherlands
W.P. van der Gaast and E. Spijker
Joint Implementation Network Laan Corpus Den Hoorn 300 9762 JT, Groningen The Netherlands T: +31(0)50 524 8430 E: [email protected] W: www.jiqweb.org

1
1. Introduction .................................................................................................................... 2
2. Current Status of International Carbon Markets ............................................................ 4
2.1. Overview of Carbon Markets ................................................................................... 4
2.2. Managing an Unbalanced EU ETS market .............................................................. 6
3. Possible Climate Policy Scenarios and Implications for Carbon Markets ..................... 9
3.1. Overview of International Climate Policy Developments ....................................... 9
3.2. Implications for carbon markets and/or carbon pricing ......................................... 11
3.3. Conclusion ............................................................................................................. 15
4. Greenhouse Gas Accounting Aspects of Biochar Carbon Offsets ............................... 16
4.1. Introduction ................................................................................................................ 16
4.2. GHG accounting methodologies for biochar-to-soil projects .................................... 18
4.3. Applicability conditions of the ‘biochar methodology’ ............................................. 19
4.4. Use of secondary biomass .......................................................................................... 20
4.5. Accounting of soil organic carbon changes/losses .................................................... 20
4.6. Allocation of GHG emission reduction impact across biochar project stages ........... 22
4.7. Selecting baseline and monitoring method ................................................................ 24
4.8. On end-use and avoidance of fossil fertilizer use ...................................................... 27
4.9. Concluding remarks ................................................................................................... 28
References ................................................................................................................................ 30
Annex I – Inventory overview of CDM methodologies and tools ....................................... 32

2
1. Introduction
Since the mid-1990s carbon markets have internationally become accepted as a way to
provide additional financial incentives to climate-friendly investment options. The main
framework for carbon markets has been the UN Framework Convention on Climate Change
(UNFCCC) and its 1997 Kyoto Protocol. This has been followed by, among other schemes,
the EU emissions trading scheme (EU ETS, in 2005), the Regional Greenhouse Gas Initiative
(RGGI, USA), the Western Climate Initiative (WCI, USA/Canada) and the New Zealand
emissions trading scheme. In Australia, China, South Korea and Brazil national and sub-
national emissions trading schemes are being planned. When adding up all such initiatives, it
is estimated that by 2015 75% of global GDP is produced in regions where, in one form or
another, greenhouse gas (GHG) emissions are priced (Promethium Carbon, 2013).
Carbon markets usually emerge when countries (such as under the Kyoto Protocol) or
companies (such as in the EU ETS) become subject to GHG emission reduction or limitation
commitments (mandatory or voluntary) in the form of maximised (annual) GHG emission
allowances. In order to comply with these commitments, the market schemes allow
countries/companies to invest in measures to reduce their own GHG emissions or purchase
emission allowances from other countries/companies. In addition, if permitted by the carbon
market scheme, carbon credits can be purchased from emission reduction projects taking
place outside the scheme. These credits are then added to the country’s/company’s emission
allowances within the scheme (see Figure 1 for an illustration). A reason for purchasing
allowances from projects outside the scheme is that this could be cheaper than investing in
extra emission reductions domestically or within the company’s own installation. As such, a
market results where emission reductions take place where the costs are lowest. The best
known example of what such a market looks like is the Clean Development Mechanism
(CDM) under the Kyoto Protocol.
The main objective of carbon markets is to put a price on GHG emissions and a clear benefit
of using markets is that additional private sector funding can be mobilised and pressure on
governmental budgets relieved. Typically, this funding goes to investments in low emission
technologies which have not yet reached the stage of commercial feasibility (i.e. costs are
higher than revenues) and which could become financially viable by adding the value of
carbon credits to the revenues. At the same time, there is a challenge that the purchased
carbon credits must represent real emission reductions so that GHG accounting processes
need to be available with accompanying validation, monitoring and verification procedures.

3
Figure 1. Illustration of cap-and-trade scheme with link to emission reduction projects
This diagram shows two installations (e.g. companies) within an emissions trading scheme which both
receive 100 allowances to emit greenhouse gases during one year (1 allowance = 1 tGHG).
Installation A, however, emits 120 tGHG during the year and therefore overshoots its allowance level
by 20 tonne. Installation B manages to keep its emissions below its allowances level by emitting only
90 tGHG. For compliance, installation A can purchase B’s surplus of 10 allowances and add these to
its own allowances. In order to cover the remaining deficit, A could invest in an emission reduction
project taking place outside the scheme to attract another 10 carbon credits. By doing so, A manages
to surrender 120 allowances/carbon credits and comply with its commitments under the scheme.
Recently, international carbon markets have experienced strong declines in prices due to over-
allocation of allowances under the EU ETS and reduced demand for carbon credits under the
Kyoto Protocol (partly due to the US withdrawal from the protocol). Both effects have been
enhanced by the global economic crisis since 2008 which led to decrease in industrial
production and corresponding GHG emissions and therefore reduced demand for GHG
emission allowances and carbon credits. The lower allowance/carbon credit prices have
4
reduced the potential of carbon markets to promote commercially non-viable projects to
financially feasible investments.
Biochar production with application to soils is a technology option which could potentially be
applied in a project with its contribution to GHG emission reductions calculated as credits and
sold on a GHG emission trading market. As such, additional funding could be generated for
biochar project investments. At present, however, it is uncertain at what carbon credit price a
biochar technology project would become financially feasible, as this requires detailed insight
on the net emission reduction impact of producing biochar and applying it to soils, including
the techniques used for that, and on the permanence of the biochar stored in soils.
In light of this uncertainty, this paper discusses:
1. The current status of international carbon markets (chapter 2).
2. Possible directions of international climate policy making towards a post-2020 climate
policy regime and possible implications of these for international carbon market
development (chapter 3).
3. How biochar-based technology options could contribute to GHG emission reductions
and what accounting methodology/ies would be required for that (chapter 4).
2. Current Status of International Carbon Markets
The main objective of carbon markets is to internalise environmental impacts of GHG
emissions as a cost in economic decision making and to create incentives for low emission
investments. Ideally, the carbon market price reflects the environmental costs of GHG
emissions.1 Carbon trading was adopted internationally under the 1997 Kyoto Protocol, which
contained quantified emission reduction/limitation commitments for industrialised countries
(for the years 2008-2012).2 Countries could comply with these commitments partly through
the purchase of carbon credits through projects in developing countries (Clean Development
Mechanism, CDM) or in other industrialised countries (Joint Implementation, JI) (UNFCCC,
1997). As a result, a global market for carbon credits emerged.
2.1. Overview of Carbon Markets
As per September 2013, 7890 Kyoto-based projects (JI and CDM) have entered the carbon
market (individual projects registered by the JI and CDM authorities under the UNFCCC; in
addition, the CDM pipeline contains 721 Programmes of Activities which group small-scale
emission reduction activities into larger programmes).3 Initially, during the early years of the
Kyoto Protocol crediting period 2008-2012, credit prices were between € 15 and 20 (per tonne
CO2-equivalent), but they dropped after 2010 due to the economic recession and the
1 In reality, however, it has turned out difficult to realise this ideal situation. As will be explained below, at
present there is a very large gap between international carbon market prices and science-based estimates of the
costs of climate change. 2 developing countries were exempted from such commitments.
3 CDMpipeline.org: http://cdmpipeline.org/publications/CDMPipeline.xlsx and
http://cdmpipeline.org/publications/JiPipeline.xlsx

5
international disagreements on an ambitious extension of the Kyoto Protocol beyond 2012.
This has resulted in a weakening of carbon credit demand. As a result, carbon credit prices
dropped to less than €2 in December 2012, shortly before the end of the first Kyoto Protocol
commitment period. Consequently, the market perspective for Kyoto-based credits has
become bleak: despite the agreed extension of the Kyoto Protocol at the Doha climate summit
of 2012, it remains unclear whether this will stimulate carbon credit demand. At Doha, an
agreement was reached on a second commitment period under the Kyoto Protocol from 2012
to 2020, although a number of key industrialised countries (among them the USA, Canada
and Russian Federation) announced that they would not adopt emission reduction
commitments during this period (UNFCCC, 2012). Eventually, 37 countries (mainly
European countries and Australia, representing 14% of global emissions) pledged emission
reductions (18% below 1990 levels) (CDCClimat, 2012).
As part of its Kyoto Protocol policy package, the EU launched an emissions trading scheme
(ETS) in 2005. The scheme caps GHG emissions for over 10,000 energy-intensive
installations (around 40% of the EU’s total emissions) and allows trade between installations
to remain below their caps. During 2005-2007, the EU ETS was operated as an initial,
learning phase with emission allowances allocated for free to installations and without the
possibility to carry over surplus allowances to future ETS phases. As a result, the ETS carbon
market price could either increase to a level equal to the fine that installations had to pay if
their annual emissions were higher than the allocated emission allowances (€ 100/tonne CO2,
in case allocated allowances would be structurally lower than emissions) or decrease to a
value close to zero euro per tonne CO2 (in case allocated allowances would be structurally
higher than actual emissions) (Ellerman, 2008). In practice, the ETS market price dropped to
around zero by the end of 2007 as the 3-year market faced considerable over-supply of
allowances.
In 2008, the second phase of the EU ETS began which covered a five-year period of 2008-
2012. This time, the allocation of emission allowances could be based on verified emissions
of European installations under the scheme during 2005-2007. During the second phase, the
Kyoto Protocol and EU carbon markets also became interlinked (although with limitations):
European installations could buy Kyoto-credits (through JI and CDM) and add these to their
allowances (so that they could be used, for instance, as a compensation if their annual
emissions were higher than their allocated emission allowances). As a result, during 2008-
2012, European installations developed the strongest demand for Kyoto-based carbon credits
of any major trading block (World Bank, 2012). Moreover, surplus allowances during the
second EU ETS phase could be carried over to the third phase of the EU ETS, covering the
years 2013-2020.
In addition to the EU scheme, several other cap-and-trade schemes have been established such
as the Regional Greenhouse Gas Initiative (USA) and Western Climate Initiative (Canada,
USA) and New Zealand emissions trading schemes.4 In Australia a domestic CO2 taxation
4 For most cap-and-trade schemes, biochar credits can only be included with the help of linking offset
mechanisms to the cap-and-trade mechanism. However, the New Zealand Emissions Trading Scheme also
includes sink categories, and herewith biochar could also potentially be included directly under this scheme. In
addition, the Kyoto protocol allows carbon credits to be generated through sinks.

6
scheme was agreed (as part of the Clean Energy Future Package legislation) in 2012
(Promethium Carbon, 2013) which taxes each tonne of GHG emitted by AUS$ 23. The
Government of Australia has the objective to transform the carbon tax system into a trading
scheme by 2015 and to link the scheme to the EU ETS from then on. As of 2018, EU ETS
installations may also enter the Australian ETS and purchase Australian emission allowances.
In China, South Korea and Brazil national and sub-national emissions trading schemes are
being planned (JIN, 2013).
Next to these ‘compliance markets’ also markets have developed for crediting voluntary
actions to offset emissions related to, e.g., travelling and conference organization. The
voluntary carbon market has been diverse with, e.g., varying standards for accounting of
carbon benefits. Nonetheless, voluntary carbon schemes have become a stable carbon market
with improved standards. Examples of voluntary schemes are: Verified Carbon Standard,
Climate Action Reserve, Gold Standard, American Carbon Registry and Plan Vivo
(Ecosystem Market Place, 2013).
On the voluntary carbon markets, prices have remained relatively stable, as they are not
immediately linked to the EU and Kyoto carbon markets.5 In addition, improvements in GHG
accounting and environmental integrity standards of voluntary market credits have generally
enhanced the credibility of these markets.6 As a result, prices are nowadays at levels around €
6 to € 8 per tonne CO2 which is considerably higher than the current carbon credit and
allowances prices on the ETS and under the Kyoto protocol. Demand on the voluntary
markets (e.g. from organisations such as JetBlue, eBay, Google, Dell, Siemens initiatives as
well as organisations that aim at greening supply chains or branding their products as green or
sustainable) is expected to grow to 200 or even 500 million credits by 2020 (from 100 million
voluntary credits in 2012 (Ecosystem Market Place, 2013)). The USA is the country that hosts
most of the buyers of voluntary carbon credits (43%), followed by the UK (26%) and
Germany (13%). Most of the buyers are from the energy and wholesale/retail sectors (50%
jointly). Generally, voluntary market transaction volumes are much lower than, for instance,
CDM-based credit transactions and usually have a short term focus, while CDM-transactions
could have a focus of even 21 years.
2.2. Managing an Unbalanced EU ETS market
The price development on the EU ETS market has shown a similar downward trend from
almost €30 per emission allowance around mid-2008 to € 2.81 in January 2013 (JIN, 2012).
From this trend it has become clear that without any structural measures to bring supply and
demand back in balance on the ETS market, prices will remain low and stay far below the €30
to €40 per allowance level that were expected for the third ETS phase to trigger a large-scale
switch from CO2-intensive to low emission technologies within Europe. For instance, in a
5 In principle, voluntary market buyers could also buy CDM credits, but procedures for that have been relatively
complex, as it requires approval of the buying and selling governments. In the future, however, sale of CDM
credits on non-compliance market may increase. 6 Although there are examples of voluntary crediting schemes which collapsed due to poor understanding of the
carbon accounting rules and consequences of sectoral policies for carbon credit potential.
7
report to the European Parliament and the Council, the European Commission explained that
during the second phase of the ETS (2008-2012) supply of issued allowances and used credits
from JI and CDM projects amounted to 8720 million whereas installations’ cumulative
emissions during this period (i.e. demand for emission allowances) amounted to 7765 million
tonnes CO2-eq. ( (European Commission, 2012). In other words, the second ETS phase had an
oversupply of 955 million allowances. Only in 2008, before the global economic crisis began,
emissions were higher than allowance supply (24 million tons) ( (JIN, 2012).
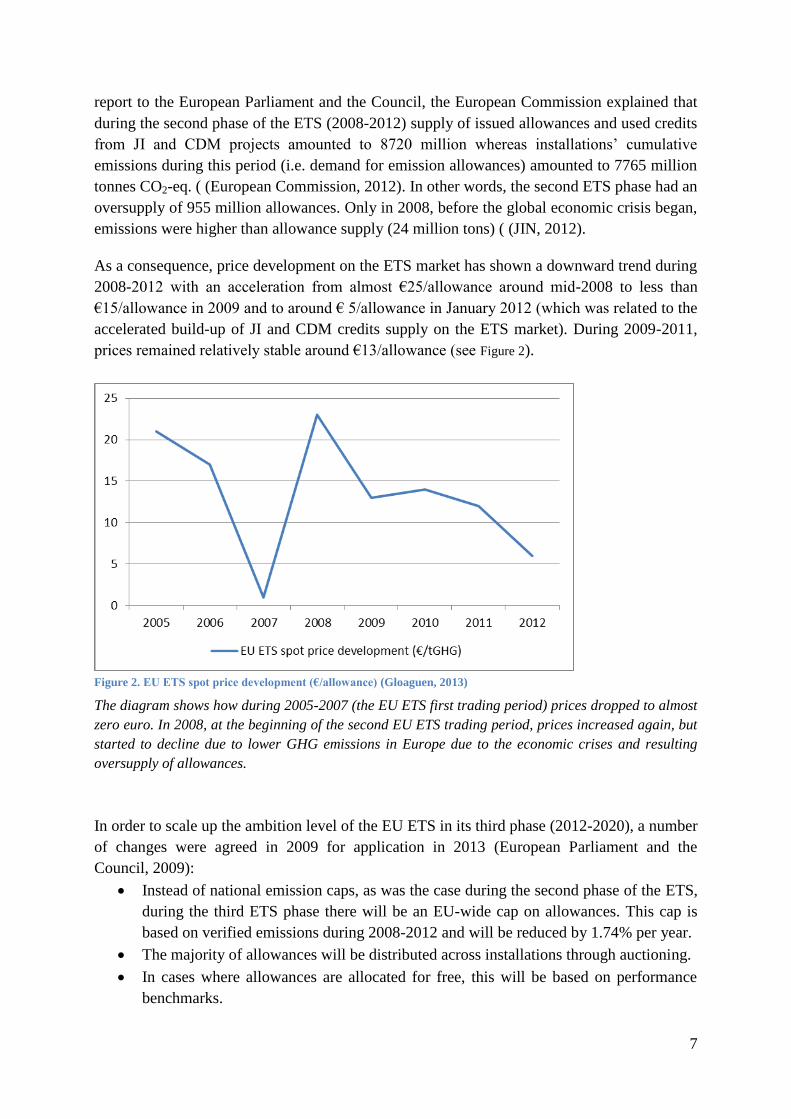
As a consequence, price development on the ETS market has shown a downward trend during
2008-2012 with an acceleration from almost €25/allowance around mid-2008 to less than
€15/allowance in 2009 and to around € 5/allowance in January 2012 (which was related to the
accelerated build-up of JI and CDM credits supply on the ETS market). During 2009-2011,
prices remained relatively stable around €13/allowance (see Figure 2).
Figure 2. EU ETS spot price development (€/allowance) (Gloaguen, 2013)
The diagram shows how during 2005-2007 (the EU ETS first trading period) prices dropped to almost
zero euro. In 2008, at the beginning of the second EU ETS trading period, prices increased again, but
started to decline due to lower GHG emissions in Europe due to the economic crises and resulting
oversupply of allowances.
In order to scale up the ambition level of the EU ETS in its third phase (2012-2020), a number
of changes were agreed in 2009 for application in 2013 (European Parliament and the
Council, 2009):
Instead of national emission caps, as was the case during the second phase of the ETS,
during the third ETS phase there will be an EU-wide cap on allowances. This cap is
based on verified emissions during 2008-2012 and will be reduced by 1.74% per year.
The majority of allowances will be distributed across installations through auctioning.
In cases where allowances are allocated for free, this will be based on performance
benchmarks.

8
The use of credits from the Kyoto mechanisms JI and CDM is further restricted.
There will be one single EU-wide registry for registering allowances and emissions.
With these changes, it is intended to make the scheme more harmonized across the Member
States and to tighten the supply of allowances thereby creating upward pressure on the prices.
However, as the European Commission has concluded (European Commission, 2012), these
pre-economic crisis measures will not prevent that also during most of the third ETS phase
there is likely to be a surplus of allowances. The latter is largely due to surpluses from the
second ETS phase that are carried over to the third phase. The European Commission
estimates that during 2013-2020 the cumulative surplus of allowances could amount to
approximately 2 billion (European Commission, 2012),7 although it is assumed that from
2014 onwards the annual increase of surpluses will slow down.
In order to support price development in the EU ETS market, the European Commission
proposed to retire 900 million allowances from the ETS during 2013-2015 (400 million in
2013, 300 million in 2014 and 200 million in 2015) and bring these back to the market at the
end of current third ETS phase ( (European Commission, 2012). Through this ‘backloading’
idea it is hoped that EU ETS prices will recover as a result of short-term scarcity. On 3 July
2013, the European Parliament in a full plenary session considered the ‘backloading’ proposal
again (after it had rejected the proposal on 16 April) (JIN, 2013). This time, the Parliament
supported the proposal (by a vote of 344 for against 311 against), by deciding that
‘backloading’ can take place as proposed with postponing auctions of 900 million allowances
and reintroducing these in the market by the end of the third ETS phase.
The passing of the ‘backloading’ proposal through the European Parliament means that it can
now be considered by the European Council of Ministers. About half of the EU Ministers
seem to be supportive of the proposal, but with expected opposition from Poland and
governmental changes in Germany, the ‘backloading’ proposal is still surrounded by
uncertainties.
In the meantime, the European Commission has also suggested other possible solutions to
restore balance between greenhouse gas demand and supply on the EU ETS market (see Box
1). Each of these possible solutions would imply a significant impact on the current ETS
legislation and would require support from policy (European Parliament and the Council) and
through this from the market itself.
7 To compare: annually, the EU ETS allocates around 2 billion allowances to installations covered by the
scheme. http://ec.europa.eu/clima/policies/ets/cap/index_en.htm

9
Box 1. Possible measure to restore balance between demand and supply on EU ETS market (European Commission,
2012)
Increase of the EU GHG emission reduction target to 30% in 2020 as this would need a consequential amendment to the quantity of EU ETS allowances. This amendment could be in the form of a retirement of allowances from the scheme or a revision of the annual reduction of the cap. It is estimated that aligning the ETS cap with a 30% reduction target in 2020 would need a 1.4 billion reduction of allowances during the third phase.
Permanently retiring a number of allowances during the third ETS phase. This would imply a reduction in the quantity of allowances available for auctioning. As a consequence, this option would result in a GHG emission reduction within the EU that goes beyond the -20% target in 2020.
Early revision of the annual linear CO2 emission reduction factor. As explained above, during 2013-2020 the emission cap for ETS installations will decrease by 1.74% per year. According to the ETS Directive, the reduction factor will be reviewed as from 2020, and this option would imply a revision already during the third phase. The European Commission note explains that such a revision would also bring GHG emission reduction trends in the EU in line with the longer term climate goals, such as the 80-95% emission reduction target in the EU Climate Roadmap for 2050. It is currently estimated that should the present annual reduction schedule of 1.74% be continued during the third phase and beyond, EU GHG emission would be 70% below 1990 emissions in 2020.
Extension of the ETS to other sectors. According to the Commission, emission reductions in ETS sectors have been stronger than in non-ETS sectors (for instance, 11% vs. 4% in 2009). One option to extend the ETS scope to other sectors could be to include energy related CO2 emission sources in non-ETS sectors within the scheme.
Limit access to credits from international carbon markets. The Commission estimates that without access to JI and CDM credits, the surplus of allowances during the period 2008-2020 would have been only 25% of the presently expected surplus (see also above). In this option, access to international credits would be limited (or even excluded) whereby temporary demand increases could be softened by the present allowance surplus. More structural price increases could then lead to more flexible access to international credits again (or to non-ETS projects as described in Art. 24a of the ETS Directive).
Discretionary price management mechanisms. Options for such mechanisms are: a price floor during the auctions and depositing of a certain amount of allowances in a reserve in case of a temporary demand-supply imbalance.
3. Possible Climate Policy Scenarios and Implications for Carbon
Markets
3.1. Overview of International Climate Policy Developments
As the Kyoto Protocol’s first commitment period ended in 2012 (it started in 2008),
negotiations were required on a post-2012 international climate policy regime under the
UNFCCC. These negotiations started in 2005 (after the formal entry-into-force of the Kyoto
Protocol earlier that year) but faced a set back at the UN Climate Conference in Copenhagen
(2009) when Parties did not reach consensus on a new follow-up agreement. Instead, after
‘Copenhagen’ a shift took place from a top-down architecture where an overarching goal is
translated in individual country targets (such as in the Kyoto Protocol) to one in which
national GHG emission reduction pledges should add up to a joint international effort (Gaast,
2012). Other concepts introduced in the post-2012 negotiations were those of nationally
appropriate mitigation actions (NAMA) and low emission development strategies (LEDS)
which both aim at supporting developed and developing countries in identifying and
embedding GHG emission reduction measures within their sustainable development contexts.

10
These measures, however, do not have the legally binding nature of the Kyoto Protocol
emission reduction commitments for industrialised countries (UNFCCC, 2013).
Eventually, at the UN Climate Conferences of Durban (2011) and Doha (2012) it was agreed
to extend the Kyoto Protocol with a second commitment period (Doha Amendment to the
Kyoto Protocol to cover the period 2012-2020) (UNFCCC, 2012)8 and to prepare a new
climate regime for the period after 2020. The continuation of the Kyoto Protocol was
generally considered a relatively weak step as the portfolio of GHG emission reduction
pledges by countries represented only 14% of global GHG emissions9 (without participation
of, among other countries, USA, Canada, Japan and the Russian Federation) (CDCClimat,
2012). Consequently, carbon markets, which had initially flourished during the early stage of
the first commitment period, were characterised by significant oversupply of credits. The
extended Kyoto Protocol, with the absence of key industrialised countries, does not contain
measures to repair this imbalance (Taminiau, 2012).
For the period after 2020, it has been agreed at ‘Durban’ to negotiate a global climate policy
regime for the period beyond 2020 to be agreed upon by 2015 (Taminiau, 2012). Currently, it
is therefore unclear what a future international climate policy regime will look like. ‘Simply’
continuing from the Kyoto Protocol has become unlikely. An important reason for that is that
the group of countries with quantified, legally-binding commitments under the Kyoto
Protocol is limited to industrialised countries only. Such a division of tasks will not be
possible under a future regime as this would imply exemption (again) of rapidly
industrialising countries, such as China, India, Mexico and Brazil, from emission reduction
commitments (Gaast, 2012). While in 1997 (when the first commitment period of the Kyoto
Protocol was agreed) such a division between industrialised and developing countries was still
acceptable, nowadays exemption of rapidly industrialising developing countries from
commitments has become unacceptable for industrialised countries.
Another aspect is whether a future climate policy regime will be fully centrally-governed or
more decentralised. The UNFCCC and Kyoto Protocol are centralised top-down agreements
aiming at global, long term GHG emission reduction targets and dividing these targets
between individual countries (Gaast, 2012). However, recently, also a range of climate policy
initiatives have been taken by countries or regions within countries which have no direct link
to the UNFCCC or Kyoto Protocol. For example, Japan has initiated a Bilateral Offset Credit
Mechanism (BOCM) within which it collaborates bilaterally with other countries in the form
of technology transfer support with carbon credits in return. In China, the municipalities of
Beijing, Tianjin, Chogqing and Shenzhen and the governments of the provinces Hubei and
Guangdong have developed plans for regional emissions trading schemes.
8 <http://unfccc.int/files/kyoto_protocol/application/pdf/kp_doha_amendment_english.pdf>
9 Of the industrialised countries in Annex B of the Kyoto Protocol (countries with quantified commitments
during 2008-2012) only Australia, Belarus, Croatia, EU, Kazakhstan, Liechtenstein, Monaco, Norway, Sweden,
Switzerland and Ukraine made pledges for GHG emission reductions by 2020 under the 2012 Doha Amendment
to the Kyoto Protocol. Consequently, the group of countries in the amended Annex B of the Kyoto Protocol
represent a much smaller share of global GHG emissions (14%) than in the initial Annex B of the protocol as
agreed in 1997.
11
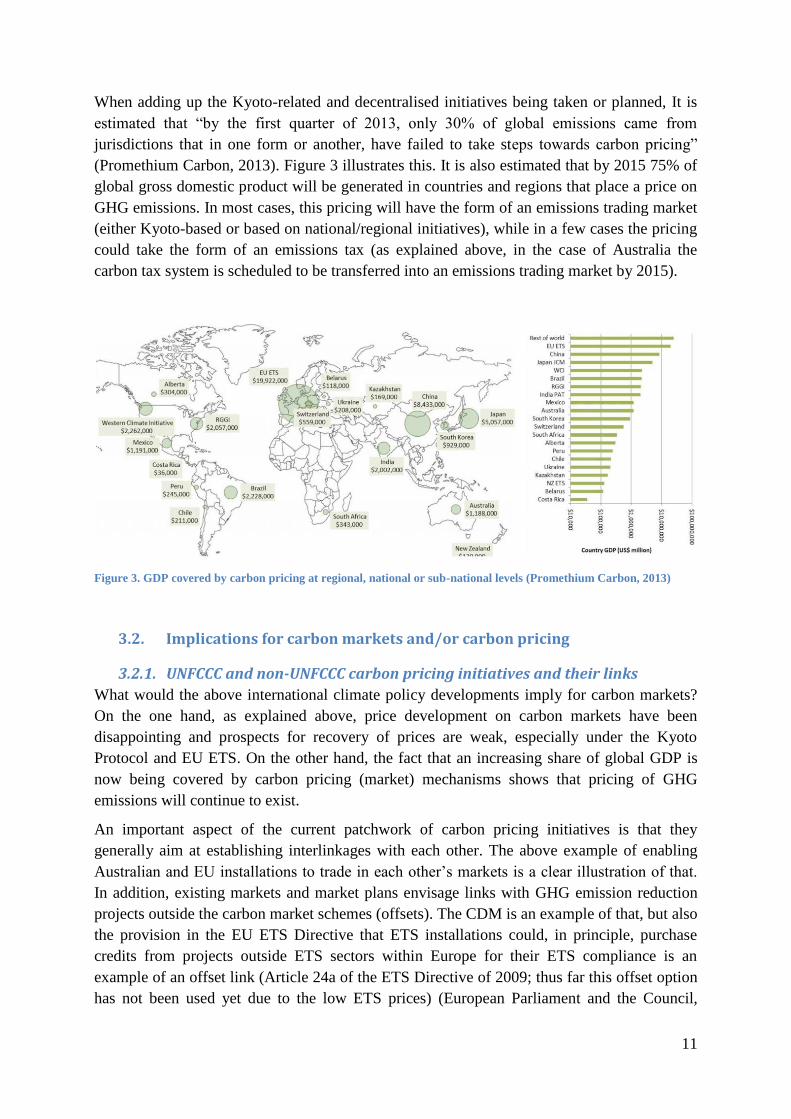
When adding up the Kyoto-related and decentralised initiatives being taken or planned, It is
estimated that “by the first quarter of 2013, only 30% of global emissions came from
jurisdictions that in one form or another, have failed to take steps towards carbon pricing”
(Promethium Carbon, 2013). Figure 3 illustrates this. It is also estimated that by 2015 75% of
global gross domestic product will be generated in countries and regions that place a price on
GHG emissions. In most cases, this pricing will have the form of an emissions trading market
(either Kyoto-based or based on national/regional initiatives), while in a few cases the pricing
could take the form of an emissions tax (as explained above, in the case of Australia the
carbon tax system is scheduled to be transferred into an emissions trading market by 2015).
Figure 3. GDP covered by carbon pricing at regional, national or sub-national levels (Promethium Carbon, 2013)
3.2. Implications for carbon markets and/or carbon pricing
3.2.1. UNFCCC and non-UNFCCC carbon pricing initiatives and their links
What would the above international climate policy developments imply for carbon markets?
On the one hand, as explained above, price development on carbon markets have been
disappointing and prospects for recovery of prices are weak, especially under the Kyoto
Protocol and EU ETS. On the other hand, the fact that an increasing share of global GDP is
now being covered by carbon pricing (market) mechanisms shows that pricing of GHG
emissions will continue to exist.
An important aspect of the current patchwork of carbon pricing initiatives is that they
generally aim at establishing interlinkages with each other. The above example of enabling
Australian and EU installations to trade in each other’s markets is a clear illustration of that.
In addition, existing markets and market plans envisage links with GHG emission reduction
projects outside the carbon market schemes (offsets). The CDM is an example of that, but also
the provision in the EU ETS Directive that ETS installations could, in principle, purchase
credits from projects outside ETS sectors within Europe for their ETS compliance is an
example of an offset link (Article 24a of the ETS Directive of 2009; thus far this offset option
has not been used yet due to the low ETS prices) (European Parliament and the Council,

12
2009). Enhanced interlinkages between carbon trading/pricing schemes and possibilities for
offsetting emissions with activities outside the schemes will require that rules for accounting
of GHG emissions are harmonised, so that the quality of a tonne CO2-equivalent traded in one
market is similar to that of a tonne CO2-equivalent traded elsewhere. Such rules could emerge
from increased collaboration between carbon pricing schemes, but could be arranged by
countries under the auspices of the UNFCCC. Figure 4 shows a possible process of how
increased collaboration between international carbon pricing schemes could eventually lead to
global emissions trading scheme (Promethium Carbon, 2013). It is noted that such a
development is not officially scheduled, but just an illustration of what a process towards
global carbon pricing could look like.
Figure 4. A potential process for establishing interlinkages between carbon market initiatives and how this could lead
to a global market (Promethium Carbon, 2013).
The above description of global carbon pricing activities does not mask the fact that current
carbon market price are relatively low and that in the short run there are no prospects of a
strong recovery of carbon price development. In fact, when comparing supply and demand in
the current compliance markets (such as Kyoto Protocol and EU ETS), then an oversupply of
allowances and credits of 2 billion can be found which has had a downward pressure on
carbon prices, at least in the short run (Michaelowa, 2013). In light of that reality, how could
13
investors in low carbon technology projects sell their future carbon credits, what markets are
most attractive and when to sell credits for maximising their value?
3.2.2. Short term carbon market perspectives
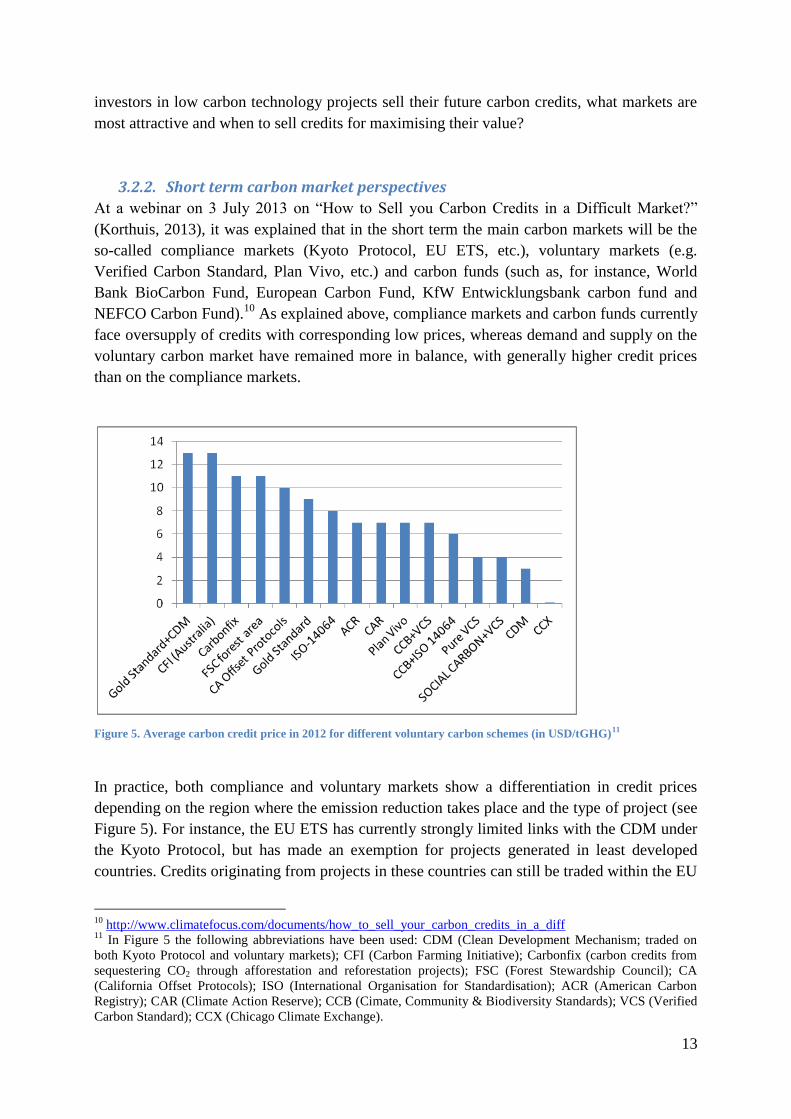
At a webinar on 3 July 2013 on “How to Sell you Carbon Credits in a Difficult Market?”
(Korthuis, 2013), it was explained that in the short term the main carbon markets will be the
so-called compliance markets (Kyoto Protocol, EU ETS, etc.), voluntary markets (e.g.
Verified Carbon Standard, Plan Vivo, etc.) and carbon funds (such as, for instance, World
Bank BioCarbon Fund, European Carbon Fund, KfW Entwicklungsbank carbon fund and
NEFCO Carbon Fund).10
As explained above, compliance markets and carbon funds currently
face oversupply of credits with corresponding low prices, whereas demand and supply on the
voluntary carbon market have remained more in balance, with generally higher credit prices
than on the compliance markets.
Figure 5. Average carbon credit price in 2012 for different voluntary carbon schemes (in USD/tGHG)11
In practice, both compliance and voluntary markets show a differentiation in credit prices
depending on the region where the emission reduction takes place and the type of project (see
Figure 5). For instance, the EU ETS has currently strongly limited links with the CDM under
the Kyoto Protocol, but has made an exemption for projects generated in least developed
countries. Credits originating from projects in these countries can still be traded within the EU
10
http://www.climatefocus.com/documents/how_to_sell_your_carbon_credits_in_a_diff 11
In Figure 5 the following abbreviations have been used: CDM (Clean Development Mechanism; traded on
both Kyoto Protocol and voluntary markets); CFI (Carbon Farming Initiative); Carbonfix (carbon credits from
sequestering CO2 through afforestation and reforestation projects); FSC (Forest Stewardship Council); CA
(California Offset Protocols); ISO (International Organisation for Standardisation); ACR (American Carbon
Registry); CAR (Climate Action Reserve); CCB (Cimate, Community & Biodiversity Standards); VCS (Verified
Carbon Standard); CCX (Chicago Climate Exchange).

14
ETS, which results in higher prices for these credits. Another price differentiation can be
observed in terms of project types, with a particular focus on projects’ contribution to
sustainable development. In the current market, it can, for instance, be observed that improved
cook stove technology, forestry/afforestation, domestic biogas and other biomass-based
projects receive higher prices than, for instance, landfill gas capture and hydropower and
wind power projects (Korthuis, 2013). This sustainable development contribution impact is
also reflected in the relative popularity of credits that have been accredited by the Gold
Standard. This standard not only observes the credibility of emission reductions in terms of
accounting rules used, but only how the project contributes to sustainable development. In the
market, this has been reflected in a mark-up to the market price for credits (see Figure 5).
CDM project developers would enhance the tradability of their credits if they added a Gold
Standard label to their projects (Korthuis, 2013).
3.2.3. Medium term perspectives
In the medium term, finance for low carbon projects may be generated from processes under
the UNFCCC such as nationally appropriate mitigation actions (NAMA). As explained above,
NAMAs are actions that developing countries will undertake under the UNFCCC to reduce
their GHG emissions. These actions are not mandatory in the sense that it is prescribed what
they should look like. Instead, countries are encouraged to formulate GHG emission reduction
(mitigation) actions within the context of their sustainable development goals. An overarching
goal of NAMAs is that they aim at system changes towards low emission development and
therefore identifying actions which are likely to go beyond countries’ business-as-usual trends
(Tilburg, 2011). However, NAMAs do not envisage carbon credit trading, rather could they
be funding opportunities for low emission actions in developing countries.
Another medium-term carbon market opportunity could be reducing emissions from
deforestation and forest degradation (REDD+). For instance, projects that reduce the
consumption of non-renewable biomass, such as household cooking projects, or programmes
that incentivize biomass projects could become eligible for carbon credit trading. Presently,
funding for REDD+ has become available through, for instance, the UN-REDD programme
and the World Bank’s Forest Carbon Partnership Facility. Therefore, in the medium term,
overarching, national REDD+ programmes could be partly funded through carbon markets
(Korthuis, 2013).
In the medium term, also the development of domestic carbon credit markets, as described
above, would represent increased carbon credit trading opportunities.
3.2.4. Longer term perspectives
With respect to the longer term, the NAMA and REDD+ funding opportunities could be
enlarged, depending on what the post-2020 UNFCCC climate policy framework will look
like. In addition, at the UNFCCC Climate Conference in Durban (South Africa, 2011) the
Green Climate Fund (GCF) was established which is intended to collect USD 100 billion per
year by 2020 to support developing countries in taking mitigation and adaptation actions (in

15
the meantime, as per 2013, around USD 30 billion has been pledged by industrialized
countries for short term climate funding) (UNFCCC, 2012). In general, the GCF funding shall
be spent on enhanced action on mitigation, adaptation, technology development and transfer
and capacity building. Although this money has therefore not been earmarked for carbon
credit trading, the GCF will provide opportunities to financially support low emission
technology projects in developing countries.
Finally, next to the existing Kyoto Protocol carbon credit mechanisms CDM and JI, a New
Market Mechanism will be developed as per the decision of the UNFCCC Climate
Conference at Durban (South Africa, 2011) (UNFCCC, 2012), “to enhance the cost-
effectiveness of, and to promote, mitigation actions, bearing in mind different circumstances
of developed and developing countries” (para. 83). An important aspect of New Market
Mechanism proposals submitted by a range of countries is the tendency to consider GHG
emission reduction activities at a larger scale than the CDM project level. For instance,
proposals by the Alliance of Small Island States (AOSIS), Costa Rica, the Dominican
Republic, Mexico, Panama and Peru explain how the new market mechanism should go
beyond the project-based approach of the CDM and address countries’ sectoral emissions (De
Sépibus, 2012).
The EU has proposed ‘sectoral crediting’ or ‘sectoral trading’ mechanism (De Sépibus, 2012).
With sectoral crediting a country would agree on an absolute or relative target GHG emission
level for a sector which it could achieve unilaterally or with international support. Emission
reductions beyond this target level could then be traded as carbon credits. Sectoral trading
refers to a cap-and-trade system whereby a country receives emission allowances upfront and
can trade surpluses or deficits with other Parties. Such a system could possibly also be linked
to CDM projects in sectors not covered by the cap-and-trade system.
3.3. Conclusion
Analysis of the current status of carbon markets shows that supply of carbon credits is
considerably higher than demand. This holds in particular for so-called compliance markets,
such as the Kyoto Protocol and the EU ETS. The prospective of market recovery is rather
bleak as the EU ETS is expected to have an allowance surplus until at least 2020 and recent
attempts to temporarily reduce supply of allowance have not been very successful.
Negotiations about the successor of the Kyoto Protocol under the UNFCCC for the period
beyond 2020 have neither resulted in indications that at the short term demand for carbon
credits will strongly increase.
At the same time, and partly separate to the UNFCCC negotiation process, a range of country
and sub-national initiatives have begun to put a price on GHG emissions (mainly in the form
of carbon markets). In addition, these carbon pricing initiatives aim at interlinkages with each
other which could eventually lead to global consistency in terms of accounting rules for
calculating greenhouse gas emissions.
In the short term, the main carbon market opportunities are in the existing compliance markets
and voluntary carbon trading markets. In the medium to longer term, new processes under the

16
UNFCCC, such as NAMAs, REDD+ and the New Market Mechanism may provide additional
funding opportunities for low emission technology investments.
4. Greenhouse Gas Accounting Aspects of Biochar Carbon Offsets
4.1. Introduction
The above sections have provided insights on the current status and future perspectives of
international GHG emission reduction credit markets. Given its potential contribution to GHG
emission reductions, biochar-to-soil projects could be eligible as carbon credit trading
investments. The carbon credits could be generated from:
1. The gases and oil generated during the pyrolysis process can be used for energy
purposes, which could replace the combustion of fossil fuels.
2. The long-term sequestration of carbon in biochar through pyrolysis prevents release of
carbon back into the atmosphere in case of decomposition of biomass.
3. Avoidance of methane emissions as biomass used for biochar production is not left to
decompose.
4. Emissions of nitrous oxides from soils may reduce through application of biochar to
soils, while also methane uptake by soils may be enhanced.
5. Applying biochar to soils may reduce the need to use conventional fertilizers, which
could contribute to carbon dioxide and nitrous oxide emission reductions.
The extent to which these five biochar-to-soil components or project stages could contribute
to GHG emission reduction has been summarised in Table 1.

17
Table 1. Biochar-to-soil GHG emission reductions
GHG
reduction
Description GHG % of
Reductions
Carbon
sequestration
Photosynthesis sequesters carbon in biomass as it grows. When this
biomass decomposes, it releases the carbon back into the atmosphere.
If the biomass is instead converted through pyrolysis into biochar, the
carbon originally sequestered in the biomass will be stored for a much
longer time – for hundreds or thousands of years depending on the
characteristics of the biochar and the environment into which it is
incorporated (Lehmann 2007). This is because biochar is significantly
more resistant to decomposition than the biomass used to produce it.
Pyrolysing biomass therefore enhances carbon sequestration.
CO2 50-65%
Renewable
energy
The energy which can be produced from the gases and oils generated
by pyrolysis can replace the combustion of fossil fuels. Pyrolysis could
produce electricity (which would offset fossil-fuelled power plants) or
heat (which could replace thermal demand at or near the pyrolysis plant
previously supplied with fossil fuels).
CO2 20-40%
Waste
diversion
Many feedstocks, including rice residues, green waste sent to landfills
and manure, are left to decompose without oxygen in rice paddies,
landfills and lagoons (Woolf et al. 2010). This anaerobic
decomposition emits methane (CH4). Collecting and pyrolysing
feedstocks that would otherwise anaerobically decompose avoids CH4
emissions.
CH4 0-20%
Reduction in
soil emissions
Applying biochar to soils may reduce soil emissions of nitrous oxide
(N2O) and increase the ability of soils to uptake CH4. These reductions
are highly variable and the precise mechanism through which they
occur is not yet fully understood (Van Zwieten et al. 2010).
N2O,
CH4
0-5%
Reduction in
fertilizer
manu-
facturing
Applying biochar to fields may reduce the need to apply other
conventional fertilizers. Many conventional fertilizers are energy
intensive to manufacture. Reducing the demand for fertilizers reduces
its manufacture, thereby reducing CO2-emissions. When nitrogen
fertilizers are applied to field, a small percentage of the nitrogen is
emitted as N2O. Reducing nitrogen fertilizer applications also reduces
N2O emissions
CO2,
N2O
Not
quantified
Source: Based on ranges reported in (Woolf, 2010) and (Roberts, 2010)12
Table 1 also estimates (in percentages) how each project component could contribute to the
overall GHG emission reductions that a biochar-to-soil project could achieve. The table
suggests that carbon sequestration by adding biochar to soils and renewable energy
production based on controlled pyrolysis processes are expected to be the key contributors to
the abatement impact of biochar projects. Both key impacts mainly concern the abatement of
CO2-emissions (or fixation of carbon into soil), whereas the abatement potential for the
‘other’ three mitigation impacts mainly relates to avoidance of CH4 and N2O emissions. The
next section discusses approaches for accounting the GHG emission reduction contributions
by biochar-to-soil projects in further detail.
12
Table taken from Report ‘Carbon Market Investment Criteria for Biochar Projects’, California Energy
Commission September 2010.
18
4.2. GHG accounting methodologies for biochar-to-soil projects
In order to calculate the GHG emission reductions from biochar-to-soil projects, it is
necessary that for each of these five components robust accounting methodologies are
prepared. In addition, these component methodologies need to be combined into one project
methodology, which adequately reflects the project context. The main challenges of the GHG
accounting methodology are to make a reasonable estimation of what would have happened in
the absence of a biochar-to-soil project (baseline; e.g., if energy resulting from a pyrolysis
process is used as energy source, what energy source does it replace?) and how one can
reliably estimate and monitor the actual project performance.
To date there has been no biochar-to-soil offset carbon credit project, which has been mainly
due to the lack of an approved baseline and monitoring methodology addressing the entire
biochar-to-soil project chain. At the same, when looking at the list of approved baseline and
monitoring accounting methodologies for CDM projects,13
it can be concluded that for several
of the individual biochar-to-soil project components draft or approved CDM methodologies
have already been available.
However in 2013, an important step into the direction of an integrated approach for
accounting GHG emission reductions, and eventually generating carbon credits, by biochar
project has been made through the development of a comprehensive ‘Biochar Carbon Offset
methodology (Koper, 2013).14
This methodology has been submitted to the American Carbon
Registry (ACR) for public commenting (end of commenting period: 22 November 2013).
The developers of the ‘biochar methodology’ have put significant time and effort in
integrating the latest best practices and science on biochar with the lessons learned and
experiences gained from other carbon market regimes, such as the CDM. Especially
experiences with the CDM were considered useful as they would provide the opportunity to
build further upon existing (and already approved!) baseline and monitoring methodologies
for GHG accounting as well as associated methodological tools.
The biochar methodology refers, for instance, to two approved small-scale CDM
methodologies AMS-III.E (on the avoidance of methane production from decay of biomass
through controlled combustion, gasification or mechanical/thermal treatment) and AMS-III.L
(on the avoidance of methane production from biomass decay through controlled pyrolysis)
which were found to be of interest with respect to the impact of avoidance of methane
emissions. However, both methodologies seemed inadequate to tackle the baseline and
monitoring issue of sequestration of biochar to soils. Despite this important methodological
gap, both approved CDM methodologies have already acknowledged the role of so-called
stabilized biomass (SB)15
which is quite similar to biochar. This recognition of the concept of
SB might also prove to be useful in the methodology acceptance process. However, while
13
http://cdm.unfccc.int/methodologies/index.html 14
The methodology was prepared by a project team consisting of The Climate Trust, The Prasino Group, The
International Biochar Initiative and Carbon Consulting. http://www.biochar-international.org/protocol. 15
Stabilized biomass (SB) is defined as biomass adequately treated to prevent further degradation in the
environment. Examples of SB are: pellets, briquettes and torrified wood chips (Source: CDM methodologies
AMS-III.E and AMS-III.L).
19
both methodologies also recognize the need for monitoring the carbon content of SB, they do
not consider admittance of SB to soils as an eligible end-use.
In addition to the two above-mentioned CDM methodologies, the ‘biochar methodology’
developers have also used certain methodological features of AM 0036 (on fuel switch from
fossil fuels to biomass residues in heat generation equipment) regarding the GHG accounting
aspects related to renewable energy production. This shows that existing CDM experience and
practices not yet fully address the methodological needs of the biochar community.
The following sections discuss in more detail a set of five applicability conditions of the
proposed biochar methodology. In order to perform this methodology review a broad subset
of CDM methodologies and tools has been reviewed to see what additional lessons can be
learned from this mechanism in relation to biochar carbon crediting.
For this an inventory overview of 26 CDM methodologies is presented in Annex I. Given the
differing development and acceptance statuses of the methodologies and tools in Annex I, it is
not possible to ‘simply’ pick methodology components from the shelf and combine them in
one integrated biochar project methodology that covers all five relevant project components
(see Table 1). For example, the soil-related impacts (e.g. carbon dioxide and nitrous oxide
impacts) require additional science-based evidence and related methodological development
for different soil types under different (climatic and hydrological) conditions.
4.3. Applicability conditions of the ‘biochar methodology’
The ‘biochar methodology’ attempts to formulate a integrated approach for accounting of
GHG emission reductions (baselines and monitoring) through biochar-to-soil projects,
nevertheless there are some limitations to its applicability. From the list of key conditions for
methodology application that have been formulated by the methodology developers five have
been selected that will be discussed in more detail.
1. The methodology is only applicable when secondary biomass (residues or waste
streams) is used for biochar production (section 4.4);
2. Potential depletion (or changes) of soil organic carbon (SOC) stocks as a result of the
project has to be accounted for (section 4.5);
3. Mixed origin feedstocks can be accounted for by the methodology, provided that the
monitoring regime can differentiate between the various sources (and their expected
GHG emission reduction impact) (section 4.6);
4. The biochar produced must be applied to land or be mixed with another soil, compost
or amendment medium (section 4.7); and
5. Proof of the specific end-use is required (section 4.8),
In the next sections, these five key conditions are discussed in further detail, so as to perform
a review of the merits of the ‘biochar methodology’.
20
4.4. Use of secondary biomass
Developing a methodology that only assumes the use of secondary biomass resources
significantly reduces the monitoring costs relative to when primary biomass resources are
used. In case of using primary resources some form of pre-project monitoring and reporting
might be required to ensure that the assumed baseline agricultural (or forestry) practices –
notably regarding pre-project use of land – are justified.16
Using primary resources as input
for biochar processes could thus significantly increase GHG accounting related transaction
costs. Expanding the scope of the biochar methodology to also cover primary biomass
resources eventually might be necessary if and when biochar production and use becomes a
more mainstream and valued biomass application.
4.5. Accounting of soil organic carbon changes/losses
Any SOC stock loss can prove to be particularly harmful for any biochar project. SOC losses
can occur in two ways, either by means of so-called ‘priming’ or in cases where the baseline
application of the biomass resources is decay under aerobic conditions (e.g. when the
feedstock will be left to decay under aerobic conditions).
“Priming can be defined as any change (positive or negative, persistent or ephemeral) in the
turnover rate of soil organic matter caused by the addition of a new substrate (Woolf and
Lehmann 2012). Increased or decreased turnover rates are defined as positive or negative
priming, respectively.”
Source: (Koper, 2013) excerpt from Appendix 3
The first type of SOC change/loss is general for all biochar projects that aim to administer the
char to soil. In order to address this priming issue, the ‘biochar methodology’ developers
applied a science-based approach in the Appendix 3 (Koper, 2013), where a default approach
for determining ‘priming of SOC mineralization by black carbon’ is proposed. The manner in
which this default is determined is in line with the most preferred justification method applied
within the approved (CDM) ‘Tool for estimation of change in soil organic carbon stocks due
to the implementation of A/R CDM project activities’ (version 1).17
This tool indicates a first
order preference for “Peer-reviewed scientific publications relating to local conditions” to
establish/calculate the key parameters for calculating SOC changes.
The second type of potential SOC change/loss (i.e. not being priming) could occur if the
baseline application of the biomass feedstock would otherwise have been disposal on land,
where despite the decomposition under aerobic conditions still some level of (SOC) carbon
sequestration could take place. By using crop residues for biochar production, that normally
would have been left to decompose on land (or which have been directly processed (e.g.
16
AMS-III.A. on the ‘Offsetting of synthetic nitrogen fertilizers by inoculant application in legumes-grass
rotations on acidic soils on existing cropland --- Version 2.0’ for instance requires “Also the yield per crop per
hectare during the last three complete rotations shall be established. It shall be verified that no inoculant was
used for fertilization of legumes in the previous three complete rotations.” 17
See: http://cdm.unfccc.int/methodologies/ARmethodologies/tools/ar-am-tool-16-v1.pdf

21
chopping) and re-submitted to the soil18
) also results in some level of carbon storage in the
baseline scenario since not all biogenic carbon will be released into the atmosphere. Even
though the ‘avoided’ carbon sequestration impact is likely to be fully offset by the
incorporation of biochar to agricultural soils (especially if it is re-submitted to the same
acreage), it nevertheless is a potential project-related impact that should be properly
accounted for. The ‘biochar methodology’ tries to address this issue by proposing bio-energy
production as the most conservative default baseline option, which would avoid this specific
SOC issue. However, in many countries (un)controlled, (an)aerobic decomposition of
secondary biomass still is the dominant baseline scenario and thus in some cases there also be
a need to account for this type of SOC losses.
In terms of GHG accounting and crediting, this potential SOC issue might introduce some
additional complexity. Soil carbon modelling has shown that only about 1% of carbon
contained in non-pyrolyzed organic matter admitted to soil today will retain in the soil after
100 years. Based upon this evidence, this impact could be considered insignificant or could
simply be discounted (e.g. 0.01 correction factor). However, GHG crediting periods generally
cover much shorter time spans than 100 years. For non A/R projects this generally is 7 or 10
years (with 3 times 7 years = 21 years as maximum), while for A/R projects this normally is
20 or 30 years (with 60 years as maximum). The notion that for most secondary biomass
resources the share of carbon retained in non-pyrolyzed biomass will not likely be at a level of
1% after 7, 10, 20 or 30 years (as it generally follows a pattern of exponential decrease) could
thus result in a larger level of avoided SOC storage (in the baseline) during the crediting
period as a result of the biochar project. From a methodological perspective this can simply be
addressed by applying an appropriate correction factor (e.g. > 0.01), but the key question here
is if this would be a fair discount factor knowing that a large part of the non-pyrolyzed carbon
would still have been released into the atmosphere after the crediting period.
In addition to these two types of potential SOC losses, the application of biochar to soil as a
carbon sequestration medium introduces a key monitoring challenge which requires a robust
and standardized method for testing biochar carbon stability. A specific test method has been
introduced and discussed in more detail in Appendix 2 of the ‘biochar methodology’ (Koper,
2013). In all circumstances the biochar-based carbon sequestration impact should be larger
than the total of any potential (SO)C losses. The full recognition and acceptance of this
standard test method within the various carbon market is crucial for the future potential of
biochar projects to be able to generate revenues based on the sale of carbon credits. If the
proposed standard test method (or any alternative method) would not become available;
climate finance for pyrolysis-biochar projects can only become available based upon the non-
carbon sequestration related project activities (e.g. through renewable energy production and
avoidance of methane emissions).
18
There is a CDM methodology (AMS-III.BE.: Avoidance of methane and nitrous oxide emissions from
sugarcane pre-harvest open burning through mulching --- Version 1.0) that specifically refers to mulching as a
means to avoid CH4 and N2O emissions, however mulching layers generally also contain a certain share of
carbon, part of which (theoretically) could be considered permanently stored.
22
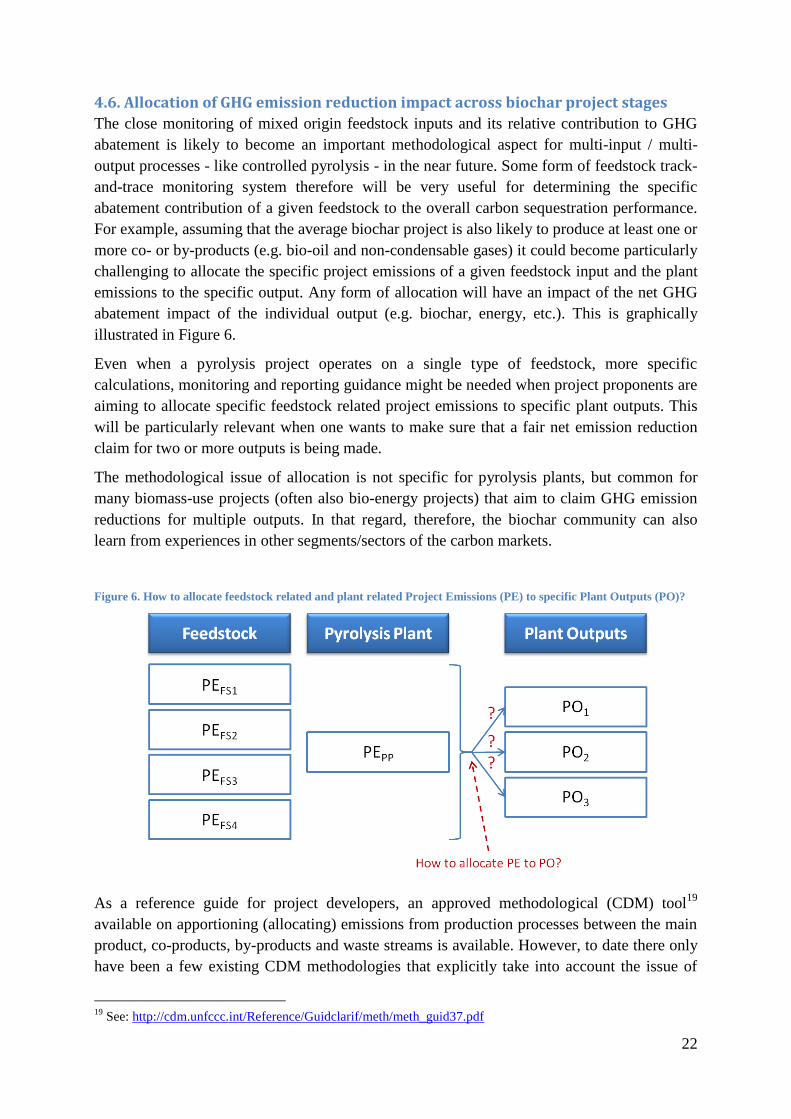
4.6. Allocation of GHG emission reduction impact across biochar project stages
The close monitoring of mixed origin feedstock inputs and its relative contribution to GHG
abatement is likely to become an important methodological aspect for multi-input / multi-
output processes - like controlled pyrolysis - in the near future. Some form of feedstock track-
and-trace monitoring system therefore will be very useful for determining the specific
abatement contribution of a given feedstock to the overall carbon sequestration performance.
For example, assuming that the average biochar project is also likely to produce at least one or
more co- or by-products (e.g. bio-oil and non-condensable gases) it could become particularly
challenging to allocate the specific project emissions of a given feedstock input and the plant
emissions to the specific output. Any form of allocation will have an impact of the net GHG
abatement impact of the individual output (e.g. biochar, energy, etc.). This is graphically
illustrated in Figure 6.
Even when a pyrolysis project operates on a single type of feedstock, more specific
calculations, monitoring and reporting guidance might be needed when project proponents are
aiming to allocate specific feedstock related project emissions to specific plant outputs. This
will be particularly relevant when one wants to make sure that a fair net emission reduction
claim for two or more outputs is being made.
The methodological issue of allocation is not specific for pyrolysis plants, but common for
many biomass-use projects (often also bio-energy projects) that aim to claim GHG emission
reductions for multiple outputs. In that regard, therefore, the biochar community can also
learn from experiences in other segments/sectors of the carbon markets.
Figure 6. How to allocate feedstock related and plant related Project Emissions (PE) to specific Plant Outputs (PO)?
As a reference guide for project developers, an approved methodological (CDM) tool19
available on apportioning (allocating) emissions from production processes between the main
product, co-products, by-products and waste streams is available. However, to date there only
have been a few existing CDM methodologies that explicitly take into account the issue of
19
See: http://cdm.unfccc.int/Reference/Guidclarif/meth/meth_guid37.pdf

23
apportioning/allocation. A good example of this is AMS-III.AK. (Biodiesel production and
use for transport applications --- Version 1.0), which applies the ‘market value’ (or economic)
allocation principle where:
“The allocation factor is calculated using the amount of fuels, co-products and by-products
obtained from the oilseed type k and respective market prices.”
Another example could be AM0057 (Avoided emissions from biomass wastes through use as
feed stock in pulp and paper, cardboard, fibreboard or bio-oil production --- Version 3.0.1).
This methodology acknowledges that organic waste feedstocks can be used for the
manufacturing and supply of different main-, co- and by-products. Although the
methodology’s primary goal is to claim credits for avoiding CH4 emissions, it also applies a
basic or minimal compliance condition related to the end-use impact of the expected outputs:
“The pulp and paper, cardboard, fibreboard or bio-oil produced with the agricultural wastes
is of similar characteristics and quality to existing high quality products in the market and
does not require special use or disposal methods.”
The above condition is not an obvious example of allocation, but it is a methodological
safeguard to minimize or avoid any carbon leakage20
, where for instance the downstream use
of the outputs could result in an increase of project-related emissions. This could for instance
occur when certain resources normally used for recycled paper would now be landfilled as a
result of the project activity which uses other feedstocks. In such a leakage scenario the
methane emissions from landfills can increase as a result of the project activity.
In order to remain conservative in their estimations the developers of methodology AM0057
only seem to have opted to focus on calculating and monitoring any project related ‘negative
leakage’ effects, while for some project outputs (e.g. pulp, paper, cardboard, fibre-board, bio-
oil) the reverse (‘positive leakage’) could be true as the baseline process for producing and
supplying the conventional (baseline) output/product could just as well be more GHG
intensive. In such circumstances the allocation of project related emissions will become an
important methodological feature.
A similar methodological approach to address negative leakage is used in:
AMS-III.AQ.: Introduction of Bio-CNG in transportation applications --- Version 1.0,
Where:
“the digested residue waste leaving the reactor shall be handled aerobically and
submitted to soil application, the proper procedures and conditions not resulting in
the methane emissions shall be ensured; otherwise the emissions shall be taken into
account as per relevant procedures of AMS-III.AO.”
And:
AMS-III.F.: Avoidance of methane emissions through composting --- Version 11.0
Where:
20
See: http://cdmrulebook.org/330
24
“soil application of the compost in agriculture or related activities will be monitored.
This includes documenting the sales or delivery of the compost final product. It shall
also include an in situ verification of the proper soil application of the compost to
ensure aerobic conditions for further decay. Such verification shall be done at
representative sample of user sites. The conditions for proper soil application
ensuring aerobic conditions can be established by a local expert taking into account
the soil conditions, crop types grown and weather conditions.”
Which:
In both cases the methodology does not allow the project proponent to claim emission
credits for any possible increases in SOC stocks, but only has to account for (or take
appropriate measures to reduce) any potential negative leakage, in these examples
being any potential SOC losses.
The above shows that the existing (methodological) experience of the carbon markets with
allocation (or apportioning) is rather limited. Nevertheless allocating project related emissions
to specific project outputs is likely to become more important in time21
. This will especially
be true for those pyrolysis plants that have the technical capability and flexibility to optimize
their operational process according to market conditions. In more general terms, the allocation
issue underlines the importance and methodological impacts of:
The determination of the project boundary of a pyrolysis project
The baseline selection process (i.e. considering the various baseline scenario(s))
When considering apportioning (e.g. as a result of an expansion of the project boundary), the
consequence is that the GHG impact of the co-, by- and waste product(s) also needs to be
accounted for (and monitored). This is likely to result in an increase in transaction costs given
that the CDM apportioning (allocation) tool guideline stipulates that: “for each by-product or
co-product, the alternative production process(es) is/are identified as part of the procedure to
identify how the byproduct or co-product would have been produced.”
The proposed biochar methodology does not consider the issue of allocation in great detail
and therefore might be improved in this particular area in order to provide project developers
with more guidance and flexibility to develop their project and claim emission reductions for
the most significant project components.
4.7. Selecting baseline and monitoring method
The ‘Biochar Carbon Offset Methodology’ includes comprehensive guidance with respect to
the selection of the appropriate baseline for pyrolysis projects. The methodology developers
also propose a conservative default baseline, being the controlled combustion of the biomass
with energy capture (in the absence of the pyrolysis project). Although this approach might be
considered conservative from the perspective of any potential unwarranted claims of
avoidance of CH4 and/or N2O emissions; under specific circumstances the proposed default
21
General LCA literature refers to three different allocation principles; 1) Economic allocation – based on
market value of primary-, co-, and/or by-product as well as 2) physical (e.g. energy content) and 3) mass-share
allocation, but other allocation methods exist as well.

25
baseline might not be the most appropriate and be sufficiently conservative when - for
example - considering any (non-priming related) potential SOC losses or leakage (see
discussion in §4.5).
The proposed default baseline (bioenergy production) also takes into account the specific
leakage impacts related to the avoided production and use of renewable energy as a result of
the biochar project activities. The assumed impact of this would be that the production and
use of other (generally fossil) energies will increase to fill this ‘gap’. In most circumstances
this leakage impact is likely to be negative, which will result in a higher discount factor and
with that a lower net claim of GHG emission reductions for biochar projects. From a
methodological perspective this approach to baseline setting and leakage correction is
rational, conservative and justifiable. However, here one could also argue that in some
circumstances this is at odds with some generally accepted principles on biomass cascading.
The core principle of cascading is that biomass resources should always be put to their ‘best’
or ‘most sustainable’ use. This can be explained by hypothesising that the advantageous
impact of biochar on soil quality is a better use of a given biomass resource relative to energy
application. The implication of this for any incentive scheme would be to provide a stronger
incentive to biomass-to-biochar application relative to biomass-to-energy applications.
The baseline selection in biochar methodology has exactly the opposite impact (even though it
is applied correctly). This can be explained by first assuming bioenergy as the project scenario
with a fossil energy baseline and second, by assuming bioenergy as the baseline scenario of
the biochar project. The left-hand side of Figure 7 illustrates this situation, whereas the right-
hand side shows the incremental GHG performance of the project scenario relative to its
baseline.
Figure 7. Setting baselines in a cascading situation
Figure 7 tries to show that the incremental GHG performance of the biochar project is not
necessarily equal or the incremental GHG performance of the bioenergy project simply
because different baselines were used.
1) In case incremental GHGbiochar > incremental GHGbioenergy, there is an incentive for
project proponents to use the biomass for biochar purposes from a emission reduction
perspective.
2) Alternatively in case incremental GHGbiochar < incremental GHGbioenergy, it is more
favourable to consider bioenergy production with the aim to optimize GHG emission
reductions.

26
Without any further quantification, and based upon current baseline practices in the carbon
markets regarding bioenergy and the proposed baseline approach for biochar, it seems to be
that scenario 2 prevails. As such project developers that are planning to use biomass resources
might be inclined to stick to those practices with the highest GHG-returns (i.c. bioenergy
application instead of biochar).
In more general terms this means when applying cascading principles one could argue that
food, feed, material and soil nutrient applications rank higher (on the cascade ladder) relative
to biomass-to-energy applications. However this ‘hierarchy of best use’ is not always
promoted by the carbon market. This claim can be verified by comparing the incremental
GHG performances of the various cascading options relative to its specific baseline.
It has yet to be determined if, how and to what extent further methodological guidance on
biomass cascading is needed in relation to carbon markets, but it is clear that the carbon
market might not always provide the right incentive when putting more emphasis on
cascading. (Domburg, 2005) also raised this issue highlighting that:
“A wide variety of biomass material applications and possible cascading chains exist, and it
is unclear yet, which biomass chain is optimal with regard to costs, CO2 emission reduction
and land demand.”22
In addition to the above, (Domburg, 2005) also acknowledged the importance of the ‘time
dimension’ (comparable to the issue raised in §4.5) when calculating GHG emissions
reductions in relation to biomass cascading systems, where:
“The use of biomass, when derived from well-managed plantations, is considered to be close
to having no net impacts on the carbon in the atmosphere, because all carbon sequestered
during plant growth is released during energy conversion and vice versa. However, if
cascading systems of biomass are considered, the release of sequestered carbon can take
place significantly later in time than the moment biomass is harvested. Depending on the
applications in the cascading chains this period can vary from several weeks (e.g. paper) to a
century or more (e.g. construction wood). Furthermore, CO2 is emitted at different moments
in time in the biomass as well as in the reference system.”
The above discussion on biomass cascading is socially and politically relevant given the
increasing notion of global biomass resource scarcity for various end-use applications. These
considerations illustrate that future revisions of GHG baseline and monitoring protocols for
any type of biomass-use systems (including those for pyrolysis systems) also might have to
take cascading-related issues into account.
22
“Preliminary analyses have shown that CO2 emission reduction per hectare of biomass production and the
CO2 mitigation costs differ significantly for different biomass cascading systems (Domburg and Faaij, 2001a).”
(Quote taken from (Domburg 2005), on Chapter 3 dissertation, page 55).

27
4.8. On end-use and avoidance of fossil fertilizer use
One of the key challenges of claiming carbon sequestration based on biochar applications to
agricultural soils is to ensure and monitor the actual end-use of the marketed biochar (to be
sure that the carbon is actually stored). The easiest and most secure way to deal with this
monitoring issue is to apply the biochar to ‘captive land’ only, where the biochar end-use can
be closely monitored23
. There are several alternative monitoring approaches introduced in the
‘biochar methodology’ to ensure the desired end-use of the biochar resulting in carbon
sequestration. One interesting alternative approach introduced in the biochar methodology is
the mixing or blending of biochar “with other soil amendments, microbial inoculants,
fertilizers and other nutrient products.” Such an approach would avoid a (time and resource
consuming) coordinated monitoring effort for all ‘captive land’ to which biochar is applied.
By introducing biochar into existing marketing and distribution channels, one can accurately
determine if and to what extent the marketed biochar has been used for soil enhancement
purposes only. This approach is similar to that applied in the CDM transport methodology
AMS-III.AQ (Introduction of Bio-CNG in transportation applications --- Version 1.0), where
the specific end-use of the final product can be determined by checking the sales volumes of
dedicated Bio-CNG fuelling stations.
From a monitoring perspective the mixing/blending of biochar with other components to
serve as soil fertilizer seems rather effective and efficient.
In addition to that, when considering biochar end-use as a fertilizer substitute as the preferred
application; the biochar methodology seems to omit the potential claim on GHG emission
reductions that would occur as a result of the avoidance (or increased efficiency) of the use of
fossil fertilizers. This should be true for all biochar projects where the char is or will be
applied to soils where otherwise fossil fertilizers would have been admitted.
In order to make such potential emission reduction claims one can draw from two approved
CDM methodologies that provide relevant guidance24
for biochar project proponents. These
two methodologies would especially be useful for calculating the baseline emissions related to
the production of fossil fuel based fertilizers.
- AMS-III.A.: Offsetting of synthetic nitrogen fertilizers by inoculant application in
legumes-grass rotations on acidic soils on existing cropland --- Version 2.0
- AMS-III.BF.: Reduction of N2O emissions from use of Nitrogen Use Efficient (NUE)
seeds that require less fertilizer application --- Version 1.0
This biochar-related abatement opportunity, however, does also introduce a number of
additional monitoring requirements, whereby the project proponent has to prove that the use
23
This is similar to the monitoring approach taken in a number of CDM transport methodologies (e.g. AMS-
III.AK.: Biodiesel production and use for transport applications --- Version 1.0; AMS-III.AQ.: Introduction of
Bio-CNG in transportation applications --- Version 1.0; AMS-III.T.: Plant oil production and use for transport
applications --- Version 2.0) where the renewable fuel consumption of a so-called ‘captive fleet’ shall be
monitored by the project proponents. 24
Although this concerns two approved CDM methodologies, there currently is not one project in the CDM
pipeline at any given development stage.

28
of fossil fertilizer has actually been reduced during the crediting period. The above-mentioned
‘fertilizer methodologies’ apply similar baseline calculation and monitoring procedures.
The emission factor for nitrogen fertilizer (EFNF) comprises the CO2-emissions (from
fertilizer production) as well as the N2O emissions (from application to soil). The
methodologies indicate that:
Project proponents may claim CO2 emission reductions for the production of synthetic
fertilizers (EFCO2,P) for the share of synthetic fertilizer to the total nitrogen fertilizers shown to
have historically been used on the participant farms.
Emission factor for N2O comprises of emission factor due to direct N2O emissions at the
baseline and/or project crop cultivation areas and indirect N2O emissions due to nitrogen
fertilizer application.
For calculating and monitoring the CO2-emission reductions appropriate (default) guidance is
provided, which would also imply some form of pre-project monitoring regarding historic use
of nitrogen fertilizers. This might cause some difficulties because in some circumstances pre-
project monitoring could increase the transaction costs, especially if historic, farm-level
fertilizer use administrations are non-homogeneous or incomplete. In order to calculate and
monitor the N2O-emissions, project proponents can either apply the IPCC default approach to
determine the emission factor, or use the so-called DNDC model.
DNDC (i.e., DeNitrification-DeComposition) is a computer simulation model of carbon and
nitrogen biogeochemistry in agro-ecosystems. The model can be used for predicting crop
growth, soil temperature and moisture regimes, soil carbon dynamics, nitrogen leaching, and
emissions of trace gases including nitrous oxide (N2O), nitric oxide (NO), dinitrogen (N2),
ammonia (NH3), methane (CH4) and carbon dioxide (CO2).
4.9. Concluding remarks
Some concluding remarks can be made below based upon the review and analysis of the
CDM methodologies and methodological tools (including Annex I) and the review of the
Biochar Carbon Offset Methodology in the previous paragraphs.
- If and when biochar activities become more mainstream, the scope of the biochar
methodology might need to be broadened to also allow for the use of primary biomass
resources for biochar production.
- Project related (non-priming) SOC losses (avoided C sequestration) during the crediting
period could be significant in cases where the baseline scenario is uncontrolled aerobic
decomposition of the feedstock. Even impact even holds given the fact that the SOC
stored in the baseline (during crediting period) would also have declined to about 1% of
initial SOC in feedstock in a time frame of about 100 years.
- Further methodological guidance on allocation is needed if and when project developers
will have the desire to be able to properly allocate or apportion project emissions (PE) to
specific project outputs (PO), such as biochar and energy.

29
- The prevailing practices and notions regarding baseline setting might not always be in line
with commonly accepted notions of biomass cascading where the ‘better’ or more
‘sustainable’ use of a given biomass resource should prevail. In this regard the carbon
market might not always provide the strongest incentive to the ‘best’ use.
- The biochar methodology might benefit from also including methodological guidance on
the potential emission reduction claims that can be made as a result of the avoidance of
the use of fossil fertilizers due to biochar admission to soils.
30
References CDCClimat. (2012). “International climate negotiations - COP 18: the art of the Doha-ble”,
Climate Brief.
De Sépibus, J. W. (2012). Top-down, Bottom-up or In-between: How Can a UNFCCC
Framework for Market-Based Approaches Ensure Environmental Integrity and
Market Coherence? NCCR Trade Regulation Working Paper No. 2012/31.
Domburg, V. (2005). Cost and CO2-Emission Reduction of Biomass Cascading:
Methodological Aspects and Case Study of SRF Poplar. Chapter 3 dissertation.
Ecosystem Market Place. (2013). Maneuvering the Mosaic - State of the Voluntary Carbon
Markets 2013. Ecosystem Market Place.
Ecosystem Market Place. (2013). State of the Voluntary Carbon Markets 2012 Report
Assessment.
Ellerman, A. D. (2008). The EU Emission Trading Scheme: A Prototype Global System?
Discussion Paper 08-02 (p. 34). Harvard Project on International Climate Agreements,
Belfer Center for Science and International Affairs, Harvard Kennedy School,.
European Commission. (2012). Report from the Commission to the European Parliament and
the Council.
European Parliament and the Council. (2009). Directive 2009/29/EC of the European
Parliament and of the Council of 23 April 2009 amending Directive 2003/87/EC so as
to improve and extend the greenhouse gas emission allowance trading scheme of the
Community. Official Journal of the European Union. Brussels: European Parliament
and the European Council.
Gaast, W. v. (2012). Challenges and Solutions for Climate Change. London: Springer.
Gloaguen, O. a. (2013). Assessing the factors behind CO2 emission changes over the phases 1
and 2 of the EU ETS: an econometric analysis. Paris: CDC Climat Research.
JIN. (2012). Uncertain Times for the EU ETS – Can the Market Imbalance be Repaired? JIQ -
Magazine on Climate and Sustainability (pp. 2-3). Groningen: JIN.
JIN. (2013). ETS Backloading Proposal Takes Important Hurdle. JIQ - Magazine on climate
and sustainability (pp. 2-3). Groningen: JIN.
JIN. (2013). State and Perspectives of International Carbon Markets. JiQ - Magazine on
climate and sustainability (pp. 1-2). Groningen : JIN.
Koper, T. (2013). Methodology for Biochar Projects. Submitted to American Carbon Registry
(ACR).
Korthuis, A. (2013). How to Sell your Carbon Credits in a Difficult Market? Climate Focus.
Michaelowa, A. (2013). Challenges on the carbon markets. Austrian Cimate Change
Workshop. Vienna.
Promethium Carbon. (2013). Carbon Pricing Scenarios.
31
Roberts, K. (2010). Life Cycle Assessment of Biochar Systems: Estimating Energetic,
Economic and Climate Change Potential. In Environmental Science Technology, 44,
827-833.
Taminiau, J. (2012, December). The Durban Agreement: A Deal to Negotiate a Deal. Joint
Implementation Quarterly, pp. 2-4.
Tilburg, X. v. (2011). Paving the Way for Low Carbon Development Strategies. Amsterdam:
Energy Research Centre of the Netherlands (ECN).
UNFCCC. (1997). Kyoto Protocol. 1998. Bonn: UNFCCC.
UNFCCC. (2012). Report of the Conference of the Parties on its seventeenth session, held in
Durban from 28 November to 11 December 2011 - Part Two: Action taken by the
Conference of the Parties at its seventeenth session. Bonn: UNFCCC.
UNFCCC. (2012). Report of the Conference of the Parties serving as the meeting of the
Parties to the Kyoto Protocol on its eigth session. FCCC/KP/CMP/2012/13/Add.1.
Bonn: UNFCCC.
UNFCCC. (2013). Interlinkages between Technology Needs Assessments and National and
International Climate Policy Making Processes. Bonn: Technology Executive
Committee .
Woolf, D. (2010). Sustainable biochar to mitigate global climate change. In Nature
Communications, 1:56.
World Bank. (2012). State and Trends of the Carbon Market 2012. 2013. Washington, DC:
The World Bank.

32
Annex I – Inventory overview of CDM methodologies and tools
Biochar potential GHG reduction impacts
Most relevant project categories for biochar
Rationale for baseline and monitoring for biochar impacts
Sample of relevant approved (CDM) methodologies (small and large scale)
Relevant methodological/guidance tools (hyperlinks included)
Carbon sequestration & Reduction in soil emissions
Afforestation Includes guidance on how to calculate changes (losses) in soil organic carbon as a result of the project activity
AR-AMS0007: Simplified baseline and monitoring methodology for small scale CDM afforestation and reforestation project activities implemented on lands other than wetlands --- Version 2.0
Estimation of non-CO2 GHG emissions resulting from burning of biomass attributable to an A/R CDM project activity
Reforestation Estimation of carbon stocks and change in carbon stocks of trees and shrubs in A/R CDM project activities
Estimation of the increase in GHG emissions attributable to displacement of pre-project agricultural activities in A/R CDM project activity
Renewable energy
Biomass energy
Can be used as a reference to calculate and monitor baseline emissions related to stationary energy applications (e.g. electricity and heat)
AM0036: Fuel switch from fossil fuels to biomass residues in heat generation equipment --- Version 4.0.0
Tool for the demonstration and assessment of additionality
Tool to calculate project or leakage CO2 emissions from fossil fuel combustion
Emissions from solid waste disposal sites
Tool to calculate the emission factor for an electricity system
Tool to determine the baseline efficiency of thermal or electric energy generation systems
Tool to determine the remaining lifetime of equipment
Assessment of the validity of the original/current baseline and update of the baseline at the renewal of the crediting period
Project and leakage emissions from transportation of freight
AMS-I.D.: Grid connected renewable electricity generation --- Version 17.0
Tool to calculate project or leakage CO2 emissions from fossil fuel combustion
Tool to calculate the emission factor for an electricity system
AM0042: Grid-connected electricity generation using biomass from newly developed dedicated plantations --- Version 2.1
Tool to calculate the emission factor for an electricity system
Tool for the demonstration and assessment of additionality
AM0053: Biogenic methane injection to a natural gas distribution grid --- Version 4.0.0
Combined tool to identify the baseline scenario and demonstrate additionality
Tool to calculate project or leakage CO2 emissions from fossil fuel combustion
Tool to calculate baseline,

33
project and/or leakage emissions from electricity consumption
Project emissions from flaring
Assessment of the validity of the original/current baseline and update of the baseline at the renewal of the crediting period
AM0075: Methodology for collection, processing and supply of biogas to end-users for production of heat --- Version 1.0
Project emissions from flaring
Tool to calculate project or leakage CO2 emissions from fossil fuel combustion
Tool to calculate baseline, project and/or leakage emissions from electricity consumption
Tool for the demonstration and assessment of additionality
AMS-I.G.: Plant oil production and use for energy generation in stationary applications --- Version 1.0
Tool to calculate project or leakage CO2 emissions from fossil fuel combustion
Tool to calculate baseline, project and/or leakage emissions from electricity consumption
AMS-I.H.: Biodiesel production and use for energy generation in stationary applications --- Version 1.0
Tool to calculate project or leakage CO2 emissions from fossil fuel combustion
Tool to calculate baseline, project and/or leakage emissions from electricity consumption
Tool for the identification of degraded or degrading lands for consideration in implementing CDM A/R project activities
ACM0017: Production of biodiesel for use as fuel --- Version 2.1.0
Tool for the demonstration and assessment of additionality
Tool to calculate project or leakage CO2 emissions from fossil fuel combustion
Tool to calculate baseline, project and/or leakage emissions from electricity consumption
Project emissions from flaring
ACM0018: Consolidated methodology for electricity generation from biomass residues in power-only plants --- Version 2.0.0
Tool to calculate project or leakage CO2 emissions from fossil fuel combustion
Emissions from solid waste disposal sites
Tool to calculate baseline, project and/or leakage emissions from electricity consumption
Tool to calculate the emission

34
factor for an electricity system
Assessment of the validity of the original/current baseline and update of the baseline at the renewal of the crediting period
Project and leakage emissions from transportation of freight
ACM0022: Alternative waste treatment processes --- Version 1.0.0
Combined tool to identify the baseline scenario and demonstrate additionality
Tool to calculate project or leakage CO2 emissions from fossil fuel combustion
Emissions from solid waste disposal sites
Tool to calculate baseline, project and/or leakage emissions from electricity consumption
Project emissions from flaring
Tool to determine the mass flow of a greenhouse gas in a gaseous stream
Tool to determine the baseline efficiency of thermal or electric energy generation systems
Assessment of the validity of the original/current baseline and update of the baseline at the renewal of the crediting period
Project and leakage emissions from composting
Project and leakage emissions from anaerobic digesters
Transport Can be used as a reference to calculate and monitor baseline emissions related to non-stationary energy applications (e.g. transport fuel)
AMS-III.AK.: Biodiesel production and use for transport applications --- Version 1.0
Tool to calculate project or leakage CO2 emissions from fossil fuel combustion
Tool to calculate baseline, project and/or leakage emissions from electricity consumption
Tool for the identification of degraded or degrading lands for consideration in implementing CDM A/R project activities
AMS-III.AQ.: Introduction of Bio-CNG in transportation applications --- Version 1.0
Tool to calculate project or leakage CO2 emissions from fossil fuel combustion
Tool to calculate baseline, project and/or leakage emissions from electricity consumption
Tool for the identification of degraded or degrading lands for consideration in implementing CDM A/R project

35
activities
AMS-III.T.: Plant oil production and use for transport applications --- Version 2.0
Tool to calculate project or leakage CO2 emissions from fossil fuel combustion
Tool to calculate baseline, project and/or leakage emissions from electricity consumption
Waste diversion
Landfill gas Can be used as a reference to calculate and monitor baseline emissions related CH4/N2O emissions from organic waste stream and/or biomass residues
ACM0001: Flaring or use of landfill gas --- Version 13.0.0
Combined tool to identify the baseline scenario and demonstrate additionality
Tool to calculate project or leakage CO2 emissions from fossil fuel combustion
Emissions from solid waste disposal sites
Tool to calculate baseline, project and/or leakage emissions from electricity consumption
Project emissions from flaring
Tool to determine the mass flow of a greenhouse gas in a gaseous stream
Tool to determine the baseline efficiency of thermal or electric energy generation systems
Tool to determine the remaining lifetime of equipment
Methane avoidance
AM0057: Avoided emissions from biomass wastes through use as feed stock in pulp and paper, cardboard, fibreboard or bio-oil production --- Version 3.0.1
Tool for the demonstration and assessment of additionality
Tool to calculate project or leakage CO2 emissions from fossil fuel combustion
Emissions from solid waste disposal sites
Tool to calculate baseline, project and/or leakage emissions from electricity consumption
Project emissions from flaring
Assessment of the validity of the original/current baseline and update of the baseline at the renewal of the crediting period
AMS-III.AO. Methane recovery through controlled anaerobic digestion
Tool to calculate project or leakage CO2 emissions from fossil fuel combustion
Emissions from solid waste disposal sites
Project emissions from flaring
Tool to calculate the emission factor for an electricity system
AMS-III.BE.: Avoidance of methane and nitrous oxide
Tool to calculate project or leakage CO2 emissions from
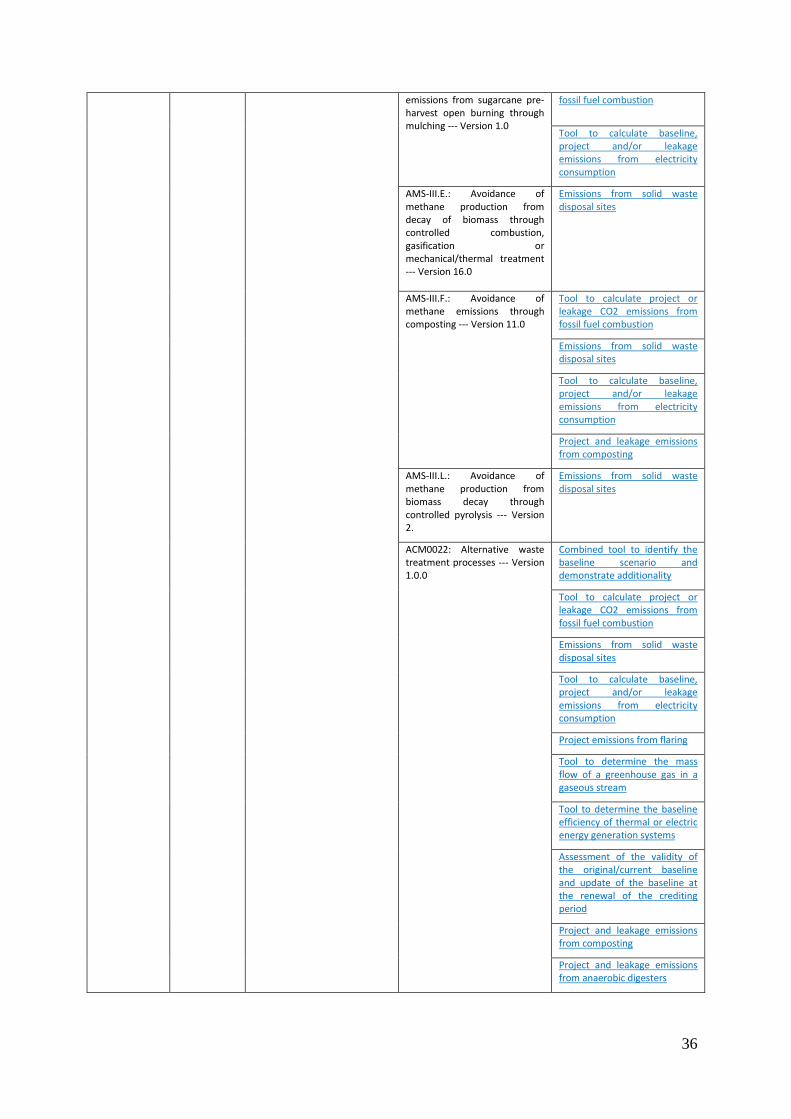
36
emissions from sugarcane pre-harvest open burning through mulching --- Version 1.0
fossil fuel combustion
Tool to calculate baseline, project and/or leakage emissions from electricity consumption
AMS-III.E.: Avoidance of methane production from decay of biomass through controlled combustion, gasification or mechanical/thermal treatment --- Version 16.0
Emissions from solid waste disposal sites
AMS-III.F.: Avoidance of methane emissions through composting --- Version 11.0
Tool to calculate project or leakage CO2 emissions from fossil fuel combustion
Emissions from solid waste disposal sites
Tool to calculate baseline, project and/or leakage emissions from electricity consumption
Project and leakage emissions from composting
AMS-III.L.: Avoidance of methane production from biomass decay through controlled pyrolysis --- Version 2.
Emissions from solid waste disposal sites
ACM0022: Alternative waste treatment processes --- Version 1.0.0
Combined tool to identify the baseline scenario and demonstrate additionality
Tool to calculate project or leakage CO2 emissions from fossil fuel combustion
Emissions from solid waste disposal sites
Tool to calculate baseline, project and/or leakage emissions from electricity consumption
Project emissions from flaring
Tool to determine the mass flow of a greenhouse gas in a gaseous stream
Tool to determine the baseline efficiency of thermal or electric energy generation systems
Assessment of the validity of the original/current baseline and update of the baseline at the renewal of the crediting period
Project and leakage emissions from composting
Project and leakage emissions from anaerobic digesters
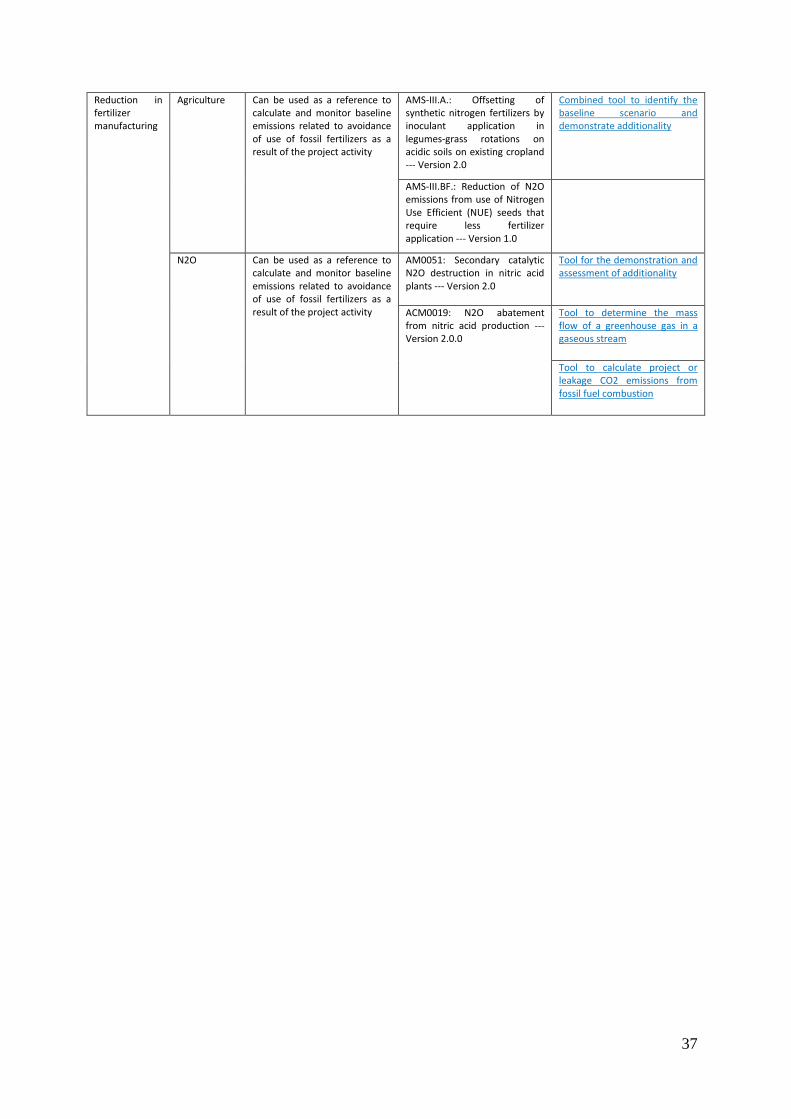
37
Reduction in fertilizer manufacturing
Agriculture Can be used as a reference to calculate and monitor baseline emissions related to avoidance of use of fossil fertilizers as a result of the project activity
AMS-III.A.: Offsetting of synthetic nitrogen fertilizers by inoculant application in legumes-grass rotations on acidic soils on existing cropland --- Version 2.0
Combined tool to identify the baseline scenario and demonstrate additionality
AMS-III.BF.: Reduction of N2O emissions from use of Nitrogen Use Efficient (NUE) seeds that require less fertilizer application --- Version 1.0
N2O Can be used as a reference to calculate and monitor baseline emissions related to avoidance of use of fossil fertilizers as a result of the project activity
AM0051: Secondary catalytic N2O destruction in nitric acid plants --- Version 2.0
Tool for the demonstration and assessment of additionality
ACM0019: N2O abatement from nitric acid production --- Version 2.0.0
Tool to determine the mass flow of a greenhouse gas in a gaseous stream
Tool to calculate project or leakage CO2 emissions from fossil fuel combustion