Embed Size (px)
Citation preview

Biochar production for white radish cultivation for higher productivity and
CO2 capture
Dr. Thavivongse SriburiManaging Director
Chula UnisearchChulalongkorn University
DirectorPadeng Biochar Research Center

Presentation
▫ Objective▫ Biochar production and properties▫ Growing white radish▫ Results▫ Other experiments
Dr. Thavivongse Sriburi
Objective:
▫ To investigate the use of biochar as a soil amendment for cultivation of white radish, and examines its effect on production and amount of carbon capture.
Dr. Thavivongse Sriburi

Experimental sites:The experiment was conducted at Padeng Biochar Research Center (PdBRC), Tambon Padeng, Amphoe Kaeng Krachan, Petchaburi Province, in southern Thailand. The site is situated 250 kilometers to the south of Bangkok. The site was selected because of severe soil degradation and annual water shortages prevailing in the area. The majority of laboratory analyses was done on-site, with some samples sent for analysis to Chulalongkorn University in Bangkok.
Dr. Thavivongse Sriburi

Severe soil degradationWater shortages

Biochar production and properties
Dr. Thavivongse Sriburi

Controlled Temperature Biochar Retort for Slow Pyrolysis Process
Dr. Thavivongse Sriburi

Biochar Standards set by Food and Agriculture Organization (FAO) in the year 1994
Pyrolysis
Flash low Temp.
(FLT)
Flash high Temp.
(FHT)
Slow
(SLW)
Feedstock size small small moderateMoisture Parameters
v. low v. low low
Temp °C 450-600 650-900 500-600Pressure, bar 1 0.1- 1 1Max. input, t/h 0.05 0.02 5ProductsGas, % wt dry 12 70 40MJ/Nm3 10-20 10-20 5-10Liquid % 62 20 30MJ/Kg 23 23 23Solid % 26 10 30MJ/Kg 30 30 30Dr. Thavivongse Sriburi

8
8
51
6
7
1. Metal tank5. Concrete cesspool6. Concrete cesspool
cover7. Chimney8. Air inlet
Details of OutsideBiochar Retort
Controlled Temperature Biochar Retort for Slow Pyrolysis Process
Dr. Thavivongse Sriburi

Controlled Temperature Biochar Retort for Slow Pyrolysis Process
2
1
4
3
1. Metal tank2. Tank cover3. Tank bind4. Syngas outlet
hole
Biochar Retort Details of Inside
Dr. Thavivongse Sriburi

• Materials used to build Biochar Retort
Dr. Thavivongse Sriburi

Biochar retort assembly and temperature measurement
Dr. Thavivongse Sriburi

Controlled Temperature Biochar Retort for Slow Pyrolysis Process
Temperature(degree Celsius)
Time (15 min.)
T1
T2
T1 is temperature inside retortT2 is temperature at chimney
Dr. Thavivongse Sriburi

Grinding process
Dr. Thavivongse Sriburi

Laboratory Analysis:▫ C-H-N Analysis▫ Heating Value▫ Surface and Interface Analyses▫ Water Holding Capacity
Dr. Thavivongse Sriburi
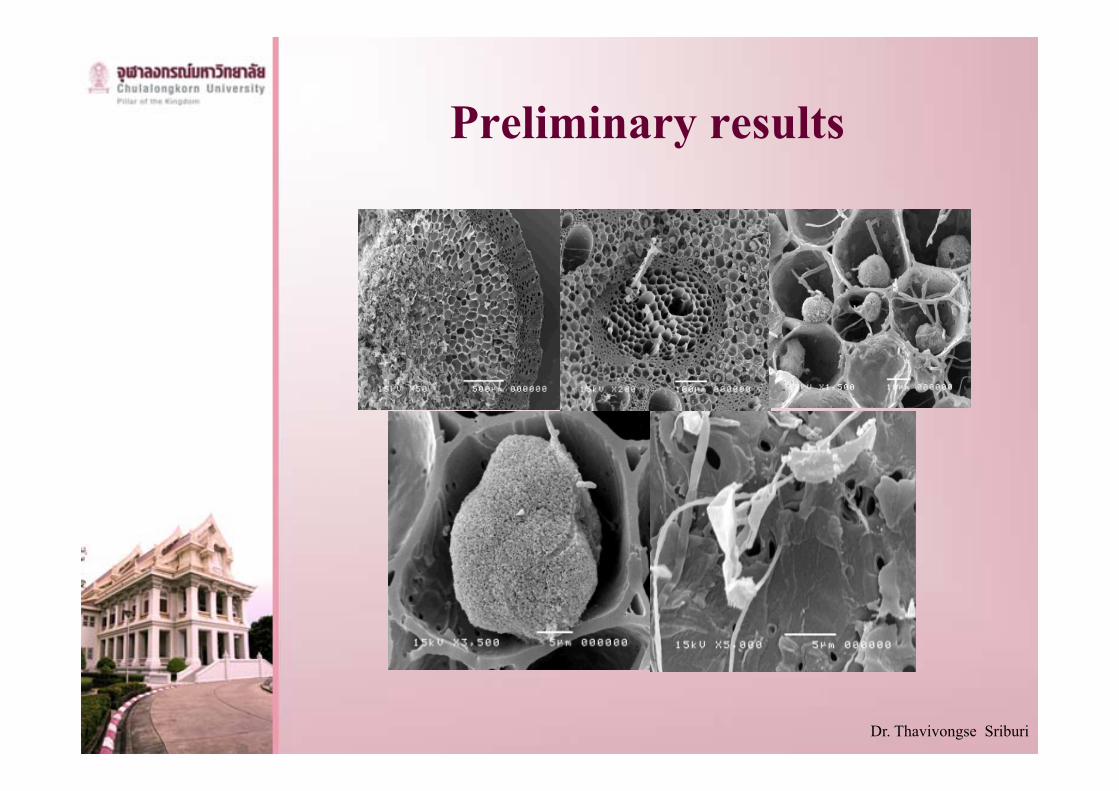
Preliminary results
Dr. Thavivongse Sriburi

White radish experiments
Dr. Thavivongse Sriburi

This study investigates the use of biochar as a soil additive in white radish (Raphanus sativus var. longipinnatus) cultivation, and examines its effect on production and net CO2 emissions. Field experiments were conducted over 2 growing seasons (dry and wet), with five treatments (untreated soil only, untreated soil+organic fertilizer, and 3 sets of untreated soil+organic fertilizer+biochar).
Dr. Thavivongse Sriburi

Soil preparation
untreated soil untreated soil+organic fertilizer
3 sets of untreated soil+organic fertilizer+biochar
Dr. Thavivongse Sriburi

50 days crops
untreated soil untreated soil+organic fertilizer
3 sets of untreated soil+organic fertilizer+biocharDr. Thavivongse Sriburi

Harvesting
Dr. Thavivongse Sriburi

Measuring
Dr. Thavivongse Sriburi

Biomass measurement
Dr. Thavivongse Sriburi

Drying process
Dr. Thavivongse Sriburi
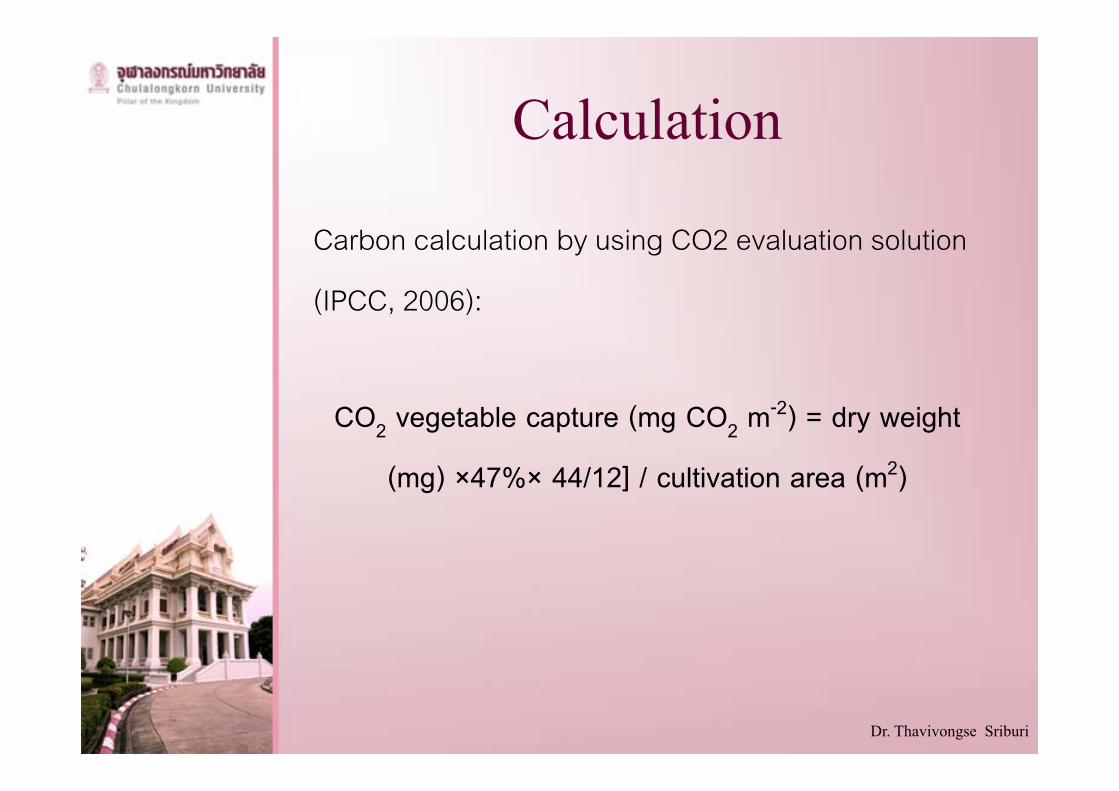
Calculation
Carbon calculation by using CO2 evaluation solution
(IPCC, 2006):
CO2 vegetable capture (mg CO2 m-2) = dry weight
(mg) ×47%× 44/12] / cultivation area (m2)
Dr. Thavivongse Sriburi

Treatment average length (cm) average diameter (cm) average weight (gm)
1st crop
2nd crop
average 1st crop
2nd
cropaverage 1st
crop2nd
crop2
average
Untreated soil 24.43 11.13 17.78 3.10 2.08 2.59 91.17 14.34 52.76
Untreated soil + organic fertilizer 22.04 20.42 21.23 2.44 3.52 2.98 90.40 103.75 97.08
Untreated soil + organic fertilizer+ 1 kg. of biochar 19.00 23.75 21.38 2.38 3.18 2.78 101.90 93.50 97.70
Untreated soil + organic fertilizer+ 2 kg. of biochar 25.03 23.98 24.51 2.53 3.25 2.89 117.80 129.52 123.66
Untreated soil + organic fertilizer+ 3 kg. of biochar 17.45 25.68 21.57 2.33 3.42 2.88 82.00 118.04 100.02
White radish production for 2 crops with different treatments
Dr. Thavivongse Sriburi

Treatment Average dry weight (gm)
CO2 capture (mg CO2 m-2)
1st crop 2nd crop 1st crop 2nd crop average
Untreated soil 6.54 0.88 195,771.90 16,127.45 105,949.68
Untreated soil + organic fertilizer 6.49 3.95 207,758.43 72,877.65 140,318.04
Untreated soil + organic fertilizer+ 1 kg. of biochar 7.38 2.96 235,414.71 54,510.78 144,962.75
Untreated soil + organic fertilizer+ 2 kg. of biochar 8.01 3.52 233,249.02 64,847.71 149,048.37
Untreated soil + organic fertilizer+ 3 kg. of biochar 6.07 4.00 208,458.82 73,633.33 141,046.08
Carbon capture in form of biomass
Dr. Thavivongse Sriburi

Results
• The findings of this study confirmed our hypothesis that high quality biochar can boost yield and contribute to climate change mitigation through carbon sequestration in the soil.
• In soil amended with 13 % of biochar the length, diameter, weight and dry weight of the harvested radish were, respectively, 37.85%, 11.58%, 134.38% and 55.39% greater than in control plots.
• CO2 capture also was 40.68 % higher than in untreated soil.
Dr. Thavivongse Sriburi

This provides new evidence to support the hypothesis that untreated soil incorporation of farm-produced biochar can contribute to mitigation of GHG emissions from agricultural activities, while boosting productivity.
Dr. Thavivongse Sriburi

Problems:1.1st crop cultivation (dry season), during 3 weeks of experiment we were facing insects problem.2.2nd crop cultivation (wet season), from 2nd
to 4th week of experiment there were heavy rainfall.
Dr. Thavivongse Sriburi

3rd experiments
Dr. Thavivongse Sriburi

Other Experiments at PdBRC
Dr. Thavivongse Sriburi

Chinese mustard experiments on CO2 release
Dr. Thavivongse Sriburi

▫ Chinese mustard is popular and important components of the daily diet in Asian countries, and farmers are being encouraged to grow more widely both to improve nutrition and their livelihoods. For these reasons, the crop was selected for the current study, based on normal farmer practice.
Dr. Thavivongse Sriburi

CO2 capture process from experiment cultivation to measure CO2 release
Dr. Thavivongse Sriburi

The equation used for carbon capture is as follows:
▫ Volume of CO2 captured (mg CO2 m-2) = [Crop weight after oven dry (mg) x 0.5 x 44/12]/ cultivation area (m2)
Dr. Thavivongse Sriburi
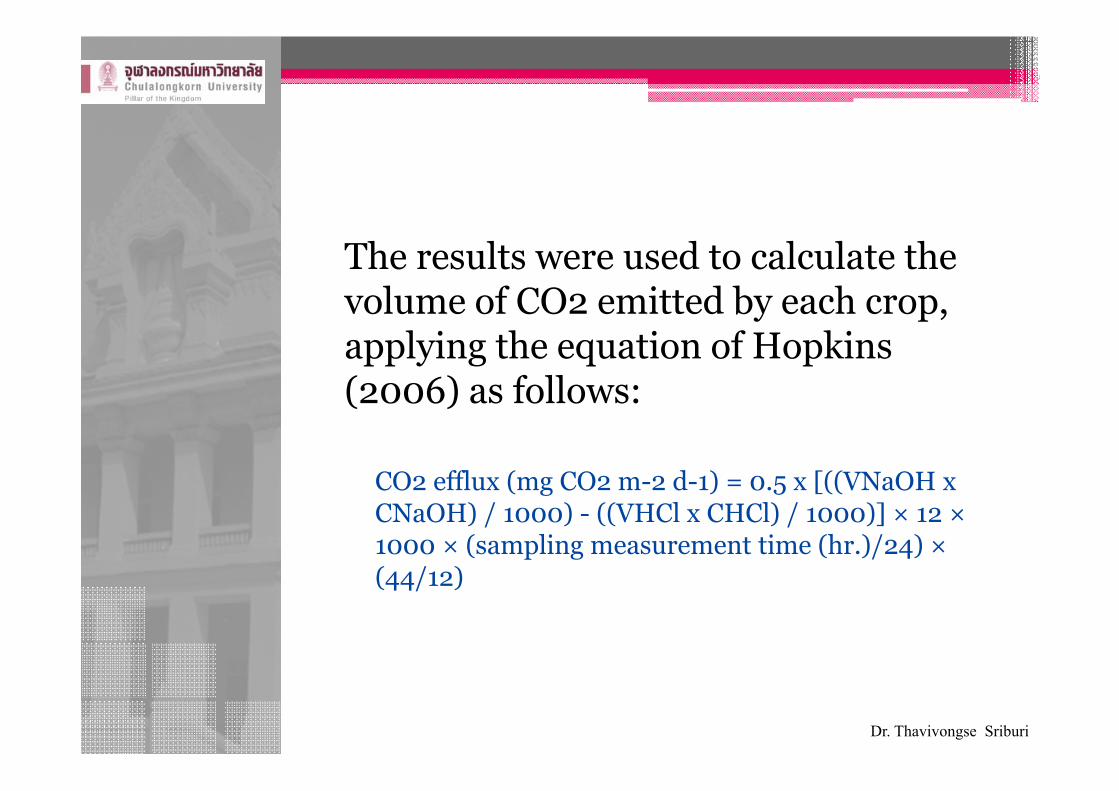
The results were used to calculate the volume of CO2 emitted by each crop, applying the equation of Hopkins (2006) as follows:
CO2 efflux (mg CO2 m-2 d-1) = 0.5 x [((VNaOH x CNaOH) / 1000) - ((VHCl x CHCl) / 1000)] × 12 ×1000 × (sampling measurement time (hr.)/24) ×(44/12)
Dr. Thavivongse Sriburi

Where:
▫ VNaOH is volume of NaOH (ml)
▫ CNaOH is concentration of NaOH (mol L-1)
▫ VHCl is volume of HCl for titration (ml)
▫ CHCl is concentration of HCl for titration (mol L-1)
Dr. Thavivongse Sriburi

For the whole cycle of crop, CO2 efflux was calculated using the following formula:
▫ CO2 efflux = Volume of CO2 release from cultivation - volume of CO2 released from bare soil
Dr. Thavivongse Sriburi

Total volume of CO2 released was calculated as
the sum of weekly volumes measured from the first
day of cultivation. Weekly volume of CO2 was
calculated as follows:•
CO2 release within 1 week (mg CO2 m–2) =
Dr. Thavivongse Sriburi
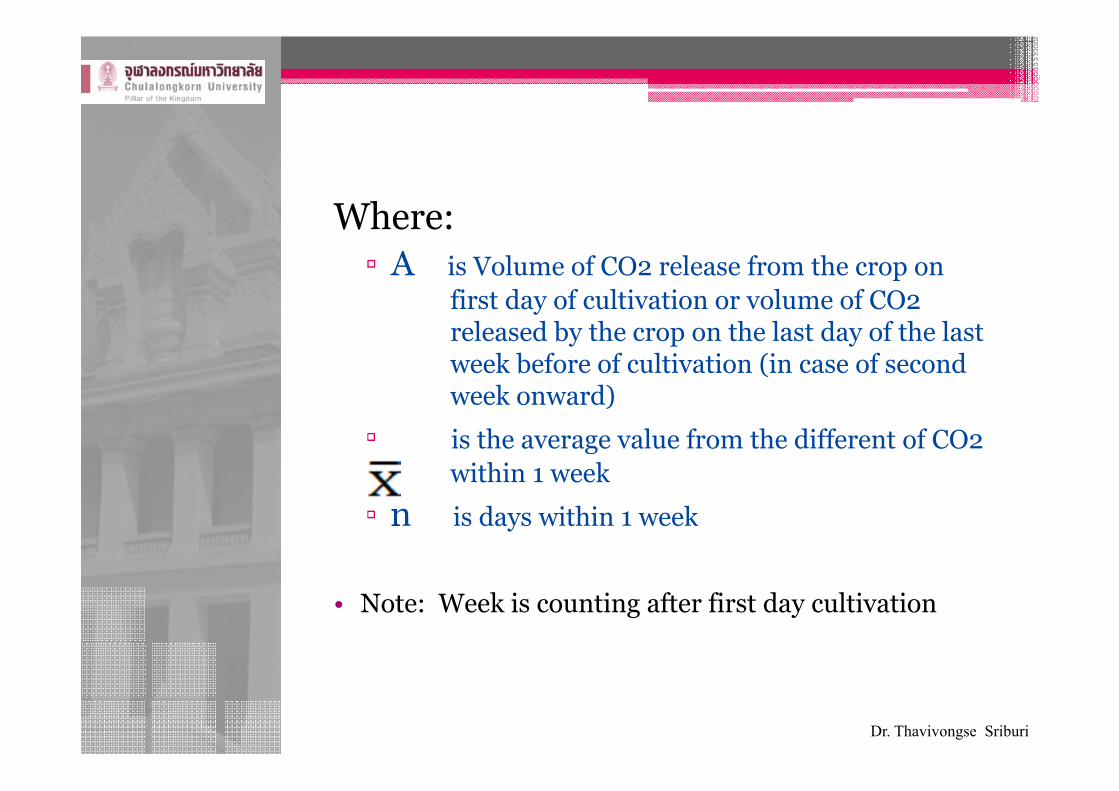
Where:▫ A is Volume of CO2 release from the crop on
first day of cultivation or volume of CO2 released by the crop on the last day of the last week before of cultivation (in case of second week onward)
▫ is the average value from the different of CO2 within 1 week
▫ n is days within 1 week
• Note: Week is counting after first day cultivation
Dr. Thavivongse Sriburi

Treatment Average wet
weight
(gram)
Average dry
weight
(gram)
Untreated soil 28.75 3.44
Untreated soil + organic fertilizer 158.90 13.98
Untreated soil + biochar 41.80 4.26
Untreated soil + organic fertilizer +
biochar 168.46 13.25
Wet and dry weight of Chinese mustard, by treatment
Dr. Thavivongse Sriburi

Gross (wet) weight of Chinese mustard after 50 days
Dr. Thavivongse Sriburi

Gross dry weight of Chinese mustard after 50 days
Dr. Thavivongse Sriburi
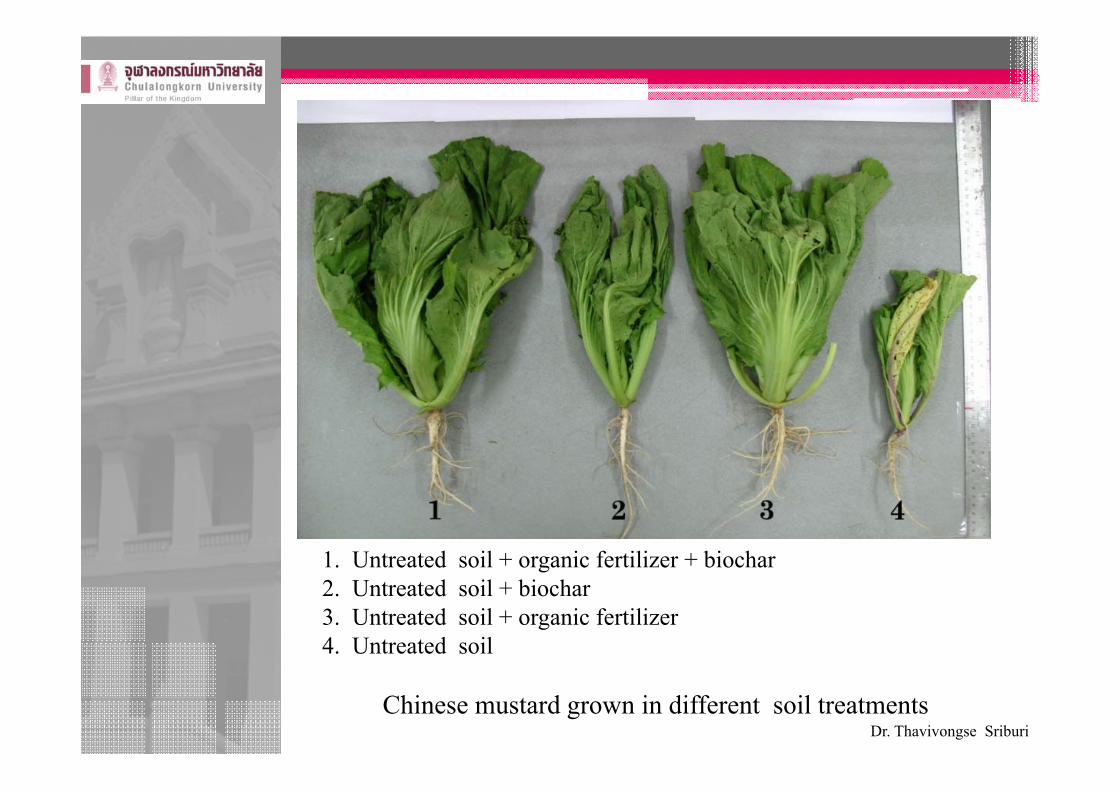
1. Untreated soil + organic fertilizer + biochar2. Untreated soil + biochar3. Untreated soil + organic fertilizer4. Untreated soil
Chinese mustard grown in different soil treatmentsDr. Thavivongse Sriburi

Treatment
Average dry weight
after oven
(mg)
Gross CO2
captured
(mg CO2 m-2)
Untreated soil 3,435.00 67,352.94
Untreated soil + organic fertilizer 13,975.00 274,019.61
Untreated soil + biochar 4,260.00 83,529.41
Untreated soil + organic fertilizer
+ biochar 13,250.00 259,803.92
Gross CO2 captured by weight of dry Chinese mustard
Note: Carbon volume collected as biomass (mg CO2 m-2) Calculated from:
[Dry weight after oven (mg)× 0.5× 44/12] / cultivation area (m2)
Dr. Thavivongse Sriburi

Treatment
Volume of CO2 release from Chinese mustard (g CO2 m-2 d-1)Total Volume
of CO2 release
(mg CO2 m-2)Day 1 Day 8 Day 15 Day 22 Day 29 Day 36 Day 43 Day 50
Untreated soil 2,485.13 -2,430.49 3,968.08 1,121.49 -4,369.03 477.50 -3,004.57 -1,771.62 -26,805.16
Untreated soil +
organic fertilizer 12,049.95 -6,576.00 519.20 -2,133.25 -4,460.97 -4,655.49 -5,614.32 -3,515.12 -126,306.57
Untreated soil +
biochar 1,334.12 -4,609.36 5,053.55 -2,395.97 -531.95 -1,356.72 -10,418.35 -4,026.81 -110,582.35
Untreated soil +
organic fertilizer
+ biochar -138.93 -2,013.06 10,117.67 2,243.92 -2,215.19 8.26 -10,842.00 142.69 -18,887.77
Volume of CO2 released from Chinese mustard cultivation over 50 days
Note: Total CO2 released collected from day 1 to day 50.
Dr. Thavivongse Sriburi

Treatment
A B A-B
CO2 Volume
collected in
form of
biomass
(mg CO2 m-2)
CO2 Volume
released by
Chinese
mustard
(mg CO2 m-2)
Gross CO2
Volume
collected
(mg CO2 m-2)
Untreated soil 67,352.94 -26,805.16 94,158.1
Untreated soil + organic
fertilizer 274,019.61 -126,306.57 400,326.18
Untreated soil + biochar 83,529.41 -110,582.35 194,111.76
Untreated sol + organic
fertilizer + biochar 259,803.92 -18,887.77 278,691.69
Gross CO2 volume collected by Chinese mustard
Dr. Thavivongse Sriburi

Volume of CO2 released from Chinese mustard cultivation over 50 days
Dr. Thavivongse Sriburi

Other experiments

Vegetable experiment plots

Orchid plantation by using biochar

• Orchids

• Rice Plantation

Cassava Experiment

Corn Experiments

Thank You for Your Attention
Dr. Thavivongse Sriburi

![Shifting Cultivation[Date] Today I will: -Be introduced to the main characteristics of shifting cultivation Higher Rural](https://img.pdfslide.net/doc/110x75/56649cac5503460f9496d359/shifting-cultivationdate-today-i-will-be-introduced-to-the-main-characteristics.jpg)