Embed Size (px)
Citation preview
Biochemical and Immunological Characterization
of Plasmodium falciparum (Welch, 1897)
Erythrocyte Membrane Protein (PfEMP) -1
Domains
Dissertation
Submitted in partial fulfillment of the requirements for the doctoral degree
from the Department of Biology, Faculty of Mathematics, Informatics and
Natural Sciences, University of Hamburg, Germany
By
Yu-Shan Chia
from Kuala Lumpur, Malaysia
Hamburg, 2006
List of Abbreviations
1. Introduction................................................................................................................. 1
1.1 Malaria - the disease ........................................................................................... 1
1.2 The life cycle of Plasmodium falciparum........................................................... 1
1.3 The P. falciparum-infected erythrocytes ............................................................ 3
1.3.1 Knob formation........................................................................................... 3
1.3.2 Expression of var gene encoded Plasmodium falciparum erythrocyte
membrane protein (PfEMP)-1 proteins....................................................................... 4
1.4 Cytoadhesion to host endothelial cells and parasite sequestration ..................... 7
1.5 Pregnancy-associated malaria (PAM)................................................................. 8
1.5.1 Placental sequestration and binding to CSA............................................... 9
1.5.2 DBL-γ domains as CSA-binding ligands.................................................. 12
1.5.3 var genes implicated in PAM ................................................................... 13
1.6 Objectives of this study..................................................................................... 15
2. Materials ................................................................................................................... 16
2.1 Chemicals and reagents..................................................................................... 16
2.2 Instruments and apparatuses ............................................................................. 17
2.3 Laboratory consumables ................................................................................... 18
2.4 Bacteria cells, mammalian cells and Plasmodium falciparum- infected
erythrocytes................................................................................................................... 19
2.4.1 Escherichia coli cells ................................................................................ 19
2.4.2 Mammalian chinese hamster ovary (CHO) cells ...................................... 19
2.4.3 P. falciparum-infected erythrocytes (IE) .................................................. 20
2.5 GenBank accession numbers ............................................................................ 20
2.6 Plasma sample collection and patient data........................................................ 21
2.7 Plasmids ............................................................................................................ 21
2.8 Oligonucleotides ............................................................................................... 22
2.9 Enzymes............................................................................................................ 22
2.10 Antibiotics......................................................................................................... 22
2.11 DNA and protein standards............................................................................... 22
2.12 Antibodies ......................................................................................................... 23
2.13 Buffers............................................................................................................... 23
2.14 Media and plates ............................................................................................... 26
2.14.1 E. coli cultures .......................................................................................... 26
2.14.2 P. falciparum cultures............................................................................... 27
2.14.3 Chinese Hamster Ovary (CHO) cell cultures............................................ 28
2.15 Solutions ........................................................................................................... 28
3. Methods..................................................................................................................... 31
3.1 Handling of cultures.......................................................................................... 31
3.1.1 Bacteria culture ......................................................................................... 31
3.1.2 Plasmodium falciparum culture............................................................... 31
3.1.2.1 Giemsa staining of thin blood films...................................................... 32
3.1.2.2 Estimation of parasitaemia.................................................................... 32
3.1.2.3 Selection of cytoadherent P. falciparum-infected erythrocytes (IE) .... 33
3.1.2.3.1 Selection of CSA-binding IE .......................................................... 33
3.1.2.3.2 Selection of CD36- and ICAM-1-binding IE.................................. 33
3.1.2.4 Sorbitol synchronization of IE .............................................................. 34
3.1.2.5 Enrichment of late-stage IE by magnetic cell sorting (MACS)............ 34
3.1.2.6 Removal of surface expressed PfEMP-1 by trypsin treatment ............. 35
3.1.3 Mammalian cell culture ............................................................................ 35
3.2 Molecular biology............................................................................................. 35
3.2.1 Polymerase chain reaction (PCR) ............................................................. 35
3.2.2 Purification of PCR product...................................................................... 36
3.2.3 TOPO TA Cloning.................................................................................... 37
3.2.3.1 Transformation...................................................................................... 37
3.2.3.2 Analysis of positive clones ................................................................... 38
3.2.4 DNA isolation ........................................................................................... 39
3.2.4.1 Miniprep................................................................................................ 39
3.2.4.2 Maxiprep............................................................................................... 40
3.2.5 DNA purity and concentration determination........................................... 41
3.2.6 DNA agarose gel electrophoreses............................................................. 41
3.2.7 DNA extraction from agarose gel ............................................................. 41
3.2.8 Protein expression in bacterial cells.......................................................... 42
3.2.9 Purification of recombinant protein .......................................................... 43
3.3 Immunological methods.................................................................................... 44
3.3.1 Western blot .............................................................................................. 44
3.3.2 Stripping membrane of bound antibodies ................................................. 45
3.3.3 Enzyme-linked immunosorbent assay (ELISA) ....................................... 46
3.3.4 Animal immunization ............................................................................... 47
3.3.4.1 Mouse.................................................................................................... 47
3.3.4.2 Chicken ................................................................................................. 47
3.3.4.3 Immunoglobulin G (IgG) purification .................................................. 48
3.3.4.4 Immunoglobulin Y (IgY) purification .................................................. 49
3.4 Imaging techniques ........................................................................................... 50
3.4.1 Light microscopy ...................................................................................... 50
3.4.1.1 Binding of antibodies to IE cell surface................................................ 50
3.4.1.2 Binding of recombinant proteins to CHO cells..................................... 50
3.4.2 Image processing ...................................................................................... 51
3.5 Biochemical methods........................................................................................ 51
3.5.1 SDS-Polyacrylamide gel electrophoresis (SDS-PAGE)........................... 51
3.5.2 MALDI-tof peptide mass fingerprinting analysis..................................... 52
3.5.3 In vitro static binding assays of IE............................................................ 53
3.5.3.1 Binding assays using immobilized receptors........................................ 53
3.5.3.1.1 Co-incubation with polyclonal antibody or human plasma ............ 54
3.5.3.1.2 Co-incubation with recombinant proteins....................................... 55
3.5.3.2 Binding assays using CHO cell lines .................................................... 56
3.5.3.2.1 Co-incubation with recombinant proteins....................................... 56
3.6 Statistical analysis............................................................................................. 56
3.7 Supplementary data........................................................................................... 57
3.7.1 Amino acid alignment............................................................................... 57
3.7.2 Protein secondary structure prediction...................................................... 57
4. Results....................................................................................................................... 58
4.1 Establishment of protocols................................................................................ 58
4.1.1 Mammalian Chinese Hamster Ovary cells ............................................... 58
4.1.2 Enrichment of late-stages infected erythrocyte (IE) ................................. 59
4.1.3 P. falciparum infected-erythrocyte receptor binding phenotype .............. 60
4.1.4 Specificity of the binding of IE to glycosaminoglycans (GAG)............... 61
4.2 Analysis of recombinant PfEMP-1 DBL-γ domains from placental isolates .. 62
4.2.1 Cloning, expression and purification of recombinant proteins................. 63
4.2.2 Biochemical characterizations of PfEMP-1 DBL-γ domains ................... 65
4.2.2.1 Static in vitro binding assay using CHO-cells ...................................... 65
4.2.2.2 Competitive inhibition of IE-CSA binding to CHO-K1 cells............... 67
4.2.3 Immunological characterizations of PfEMP-1 DBL-γ domains ............... 68
4.2.3.1 Immunogenicity of the recombinant DBL domains ............................. 68
4.2.3.2 Status of placental infection and antibody recognition......................... 69
4.2.3.3 Correlation of antibodies with parasitaemias........................................ 70
4.2.3.4 Correlation of antibodies with maternal haematocrit............................ 70
4.2.3.5 Correlation of antibodies with parity .................................................... 72
4.2.3.6 Correlation of antibodies between varPAM DBL-γ domains............... 72
4.2.4 Assessment of anti-482 and anti-732 DBL-γ polyclonal antibodies......... 73
4.2.4.1 Specificity of recognition...................................................................... 73
4.2.4.2 Inhibition of IE binding to CSA by the α-DBL-γ antibody.................. 74
4.2.4.3 Surface staining of live IE..................................................................... 75
4.3 Analysis of a placental var gene: 732var.......................................................... 77
4.3.1 732var and the PfEMP-1 domains............................................................ 77
4.3.1.1 Comparisons of CIDR-1α and DBL-3γ domains ................................. 78
4.3.1.1.1 Comparison of the 732 CIDR-1α domain with other CIDR-
α domains ........................................................................................................ 78
4.3.1.1.2 Comparison of the 732 DBL-3γ domain with the FCR3CSA DBL-γ
domain…………………………………………………………………………79
4.3.2 Cloning, expression and purification of recombinant 732var domains.... 80
4.3.3 Biochemical characterizations of different 732var domains .................... 81
4.3.3.1 Static in vitro binding assay using CHO-cells ...................................... 82
4.3.3.2 Specificity of the binding of 732 DBL-3γ to glycosaminoglycans....... 84
4.3.3.3 Competitive inhibition of IE binding to different CHO-cells............... 85
4.3.4 Immunological characterizations of the recombinant 732var domains.... 86
4.3.4.1 Immunogenicity of recombinant proteins............................................. 86
4.3.4.2 Correlation of antibodies with parasitaemias........................................ 87
4.3.4.3 Correlation of antibodies with maternal haematocrit............................ 87
4.3.4.4 Correlation of antibodies with parity and age....................................... 88
5. Discussion................................................................................................................. 90
5.1 Materials and methods used in this study ......................................................... 90
5.1.1 Host receptors for biochemical characterization of PfEMP-1 domains.... 90
5.1.2 Establishment of IE isogenic lines that bind CSA, CD36 and ICAM-1... 91
5.1.2.1 Specificity of the CSA-binding phenotype of the IE ............................ 91
5.1.3 Expression of PfEMP-1 recombinant domains in Escherichia coli cells . 92
5.1.3.1 Gb23a DBL-1α domain as control ....................................................... 92
5.1.3.2 3D7chr5var DBL-5γ domain as control................................................ 93
5.2 Analysis of recombinant varPAM DBL-γ domains.......................................... 93
5.2.1 Biochemical characterization of recombinant varPAM DBL-γ domains. 94
5.2.1.1 Production of functional recombinant varPAM DBL-γ domains......... 94
5.2.1.2 Inhibition of IE-CSA binding by the recombinant varPAM DBL-γ
domains……......................................................................................................... 94
5.2.3 Immunological characterization of the recombinant varPAM DBL-γ
domains……............................................................................................................. 95
5.2.3.1 Pregnancy-specific of varPAM DBL-γ domains .................................. 95
5.2.3.2 Contribution of human antibodies in placenta infection control .......... 96
5.2.3.3 Absence of parity-dependent recognition ............................................. 97
5.2.3.4 Generation of adhesion blocking antibodies in experimental animals . 98
5.2.4 Putative CSA-binding ligands................................................................... 99
5.3 Analysis of 732var gene originating from a placental isolate ........................ 102
5.3.1 732var domain organization as type 15 var gene ................................... 102
5.3.2 Conservation of the minimal CD36-binding region in 732var ............... 102
5.3.3 Biochemical characterization of the recombinant 732var domains........ 104
5.3.3.1 Production of functional CIDR-1α and DBL-3γ domains.................. 104
5.3.3.2 Inhibition of IE binding by the recombinant 732var domains............ 105
5.3.4 Immunological characterization of the recombinant 732var domains ... 105
5.3.4.1 Pregnant specificity of 732var recombinant domains ........................ 105
5.3.4.2 Association of antibodies with parasitaemia....................................... 106
5.3.5 IE surface expression of 732 DBL-3γ domains ...................................... 106
5.3.6 732var and the dichotomy in CSA and CD36 binding ........................... 107
5.3.6.1 Implication of 732var in PAM............................................................ 108
6. Summary ................................................................................................................. 109
Reference List ................................................................................................................. 111
Acknowledgements......................................................................................................... 120
Appendix......................................................................................................................... 122
List of Abbreviations:
ATS Acidic terminal sequence
bp base-pair
BSA Bovine serum albumin
BVH Bovine vitreous humor
C2 Constant 2
Ca2+ Calcium
CHO Chinese hamster ovary cell
CIDR Cysteine-rich interdomain regions
CR-1 Complement receptor-1
CSA/ CSB/ CSC Chondroitin sulfate A, B or C
d day
DBL Duffy-binding like
DEAE Diethylaminoethyl
DNA Deoxyribonucleic acid
dNTP Deoxynucleotide triphosphates
ds / ss DNA Double or single stranded DNA
DTT Dithiothreitol
EDTA Ethylene-diamine-tetraacetic acid
ELISA Enzyme-linked immunosorbent assay
EtBr Ethidium bromide
FCS Fetal calf serum
GAG Glycosaminoglycan
h hour
HA Hyaluronic acid
HCl Hydrochloride acid
HRP Horse-radish peroxidase
HUC Human umbilical cord
ICAM-1 Intercellular adhesion molecule-1
IE Plasmodium falciparum-infected erythrocytes
Ig G / M Immunoglobulin G / M
IPTG Isopropyl β-D-1-thiogalactopyranoside
K / Na PO4 Potassium or sodium phosphate
KAHRP Knob-associated histidine-rich protein
kD kilodalton
LB Luria Bertani
MESA Plasmodium falciparum mature erythrocyte surface antigen
mg milligram
min minutes
ml milliliter
NaOH sodium hydroxide
NTS N-terminal sequence
OD Optical density
PAM Pregnancy-Associated Malaria
PBS phosphate-buffered saline
PCR Polymerase chain reaction
PFA Paraformaldehyde
PfEMP-1 Plasmodium falciparum erythrocyte membrane protein-1
RNA Ribonucleic acid
RT Room temperature
SDS Sodium dodecyl sulfate
SDS-PAGE Sodium dodecyl sulfate polyacrylamide gel electrophoresis
sec second
TBE Tris-borate buffer with EDTA
TBS Tris-buffered saline
TE Tris EDTA
UV Ultraviolet
V Volts
VSA Variant surface antigen
µg microgram
Introduction 1
1. Introduction
1.1 Malaria - the disease
Malaria remains one of the major infectious diseases in tropical and subtropical areas,
causing high mortality and morbidity. Of the four species of Plasmodium that naturally
infect humans, Plasmodium vivax, P. ovale and P. malaria cause severe morbidity,
whereas P. falciparum is responsible for nearly all malaria-specific mortality. It has been
recently estimated that 2.2 billion people are exposed to the threat of P. falciparum
malaria; there are around 300 and 600 million clinical attacks per year, and 1.1 million
deaths of children under the age of five (Snow et al., 2005).
1.2 The life cycle of Plasmodium falciparum
The life cycle of P. falciparum in the human host starts with the sporozoites being
injected through the bite of an infected female anopheline mosquito. The sporozoites are
transported via the bloodstream to infect the hepatocyte cells of the liver. Within the
hepatocytes, the parasite matures, differentiates, and undergoes several rounds of asexual
division. Thousands of infective merozoites are formed and released into the bloodstream.
The time taken for the exoerythrocytic cycle to occur is approximately 15 d and during
this pre-patent period, the infected individual is asymptomatic (Taylor, Strickland, 2000;
White, 2003). Merozoites released from the hepatocytes invade host erythrocytes within
seconds, and again undergo a process of growth and asexual division to produce 6 – 32
daughter merozoites over a period of 48 h (Taylor, Strickland, 2000; White, 2003). When
Introduction 2
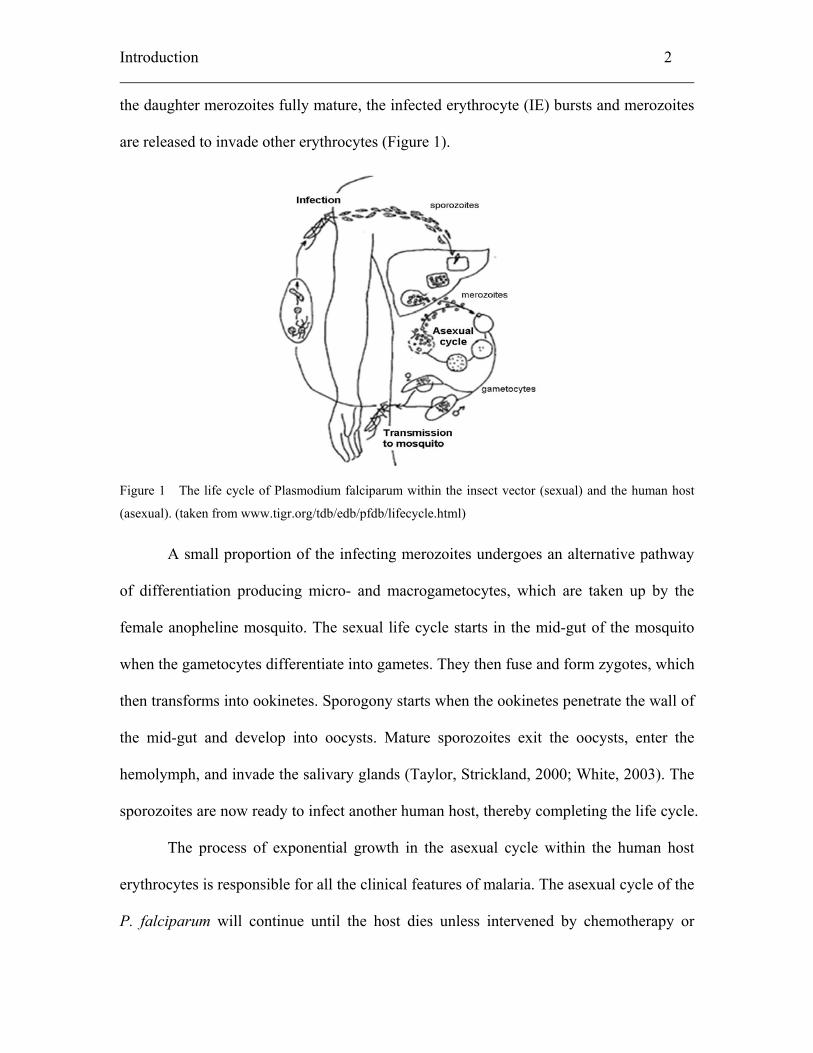
the daughter merozoites fully mature, the infected erythrocyte (IE) bursts and merozoites
are released to invade other erythrocytes (Figure 1).
Figure 1 The life cycle of Plasmodium falciparum within the insect vector (sexual) and the human host
(asexual). (taken from www.tigr.org/tdb/edb/pfdb/lifecycle.html)
A small proportion of the infecting merozoites undergoes an alternative pathway
of differentiation producing micro- and macrogametocytes, which are taken up by the
female anopheline mosquito. The sexual life cycle starts in the mid-gut of the mosquito
when the gametocytes differentiate into gametes. They then fuse and form zygotes, which
then transforms into ookinetes. Sporogony starts when the ookinetes penetrate the wall of
the mid-gut and develop into oocysts. Mature sporozoites exit the oocysts, enter the
hemolymph, and invade the salivary glands (Taylor, Strickland, 2000; White, 2003). The
sporozoites are now ready to infect another human host, thereby completing the life cycle.
The process of exponential growth in the asexual cycle within the human host
erythrocytes is responsible for all the clinical features of malaria. The asexual cycle of the
P. falciparum will continue until the host dies unless intervened by chemotherapy or
Introduction 3
immune response. The growth of the parasite within the erythrocyte is roughly
synchronous. The rupture of the IE and the concomitant release of material that induces
pyrogenic cytokines tend to occur at the same time of the day and coincide with the onset
of periodic fever and chills, which are notable features of the disease.
1.3 The P. falciparum infected erythrocytes
The mature erythrocytes are terminally differentiated, devoid of all intracellular organelle
and incapable of de novo protein or lipid synthesis (Haldar et al., 2002). As P. falciparum
develops in the host erythrocyte, a number of changes that are important for parasite
survival take place, including: (1) modification of the host cell membrane to form knob-
like structures, leading to an increase in the rigidity of the cells, (2) alteration in
metabolite transport, and (3) insertion of parasitic proteins onto the surface of the
erythrocyte membrane (Craig, Scherf, 2001).
1.3.1 Knob formation
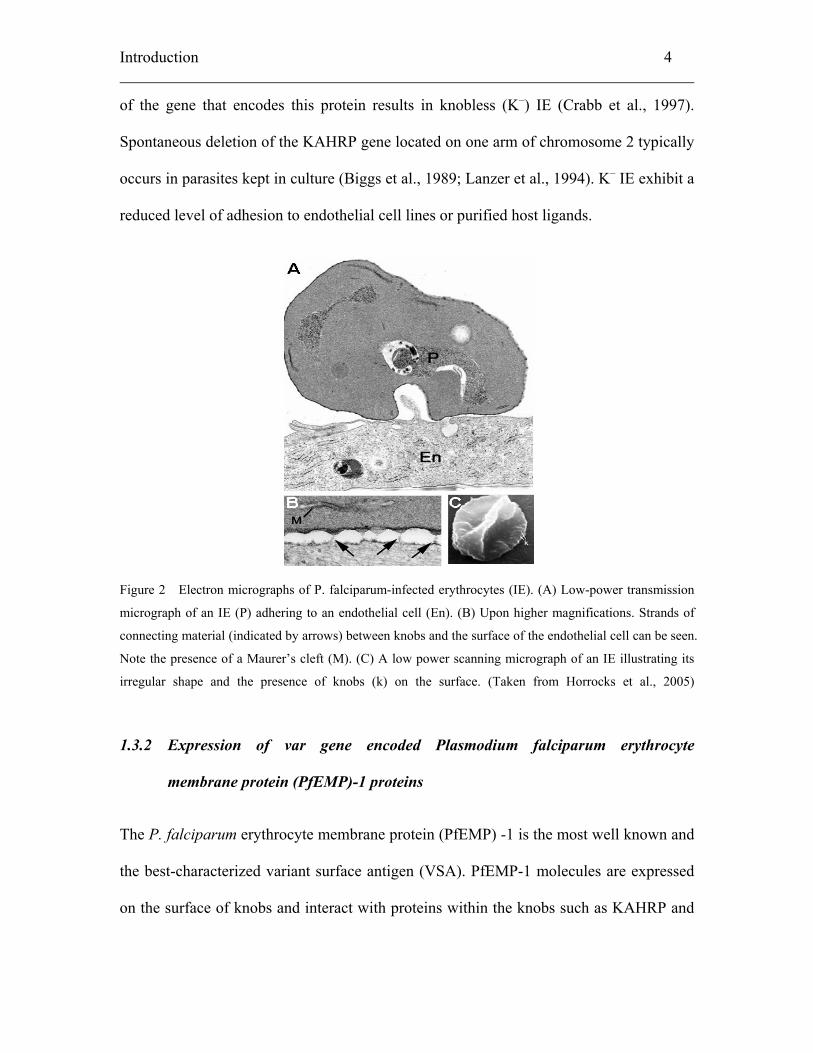
The most obvious modification at the IE surface is knob formation around 16-18
h post-infection (Nagao et al., 2000; Horrocks et al., 2005). Knobs are electron-dense,
cup-shaped structure (~100 nm diameter) that underlie a protrusion of the erythrocyte’s
membrane and act as attachment points of sequestered parasites (Figure 2). Knobs consist
of a number of parasite-encoded proteins, including knob-associated histidine-rich
protein (KAHRP), P. falciparum erythrocyte membrane protein-3 (PfEMP-3) and P.
falciparum mature erythrocyte surface antigen (MESA). Although exported to the IE
plasma membrane, these proteins are not exposed on the external face (Deitsch, Wellems,
1996). KAHRP is known to be a major structural component of knobs since the deletion
Introduction 4
of the gene that encodes this protein results in knobless (K–) IE (Crabb et al., 1997).
Spontaneous deletion of the KAHRP gene located on one arm of chromosome 2 typically
occurs in parasites kept in culture (Biggs et al., 1989; Lanzer et al., 1994). K– IE exhibit a
reduced level of adhesion to endothelial cell lines or purified host ligands.
Figure 2 Electron micrographs of P. falciparum-infected erythrocytes (IE). (A) Low-power transmission
micrograph of an IE (P) adhering to an endothelial cell (En). (B) Upon higher magnifications. Strands of
connecting material (indicated by arrows) between knobs and the surface of the endothelial cell can be seen.
Note the presence of a Maurer’s cleft (M). (C) A low power scanning micrograph of an IE illustrating its
irregular shape and the presence of knobs (k) on the surface. (Taken from Horrocks et al., 2005)
1.3.2 Expression of var gene encoded Plasmodium falciparum erythrocyte
membrane protein (PfEMP)-1 proteins
The P. falciparum erythrocyte membrane protein (PfEMP) -1 is the most well known and
the best-characterized variant surface antigen (VSA). PfEMP-1 molecules are expressed
on the surface of knobs and interact with proteins within the knobs such as KAHRP and
B
Introduction 5
PfEMP-3. PfEMP-1 molecules are multi-domain proteins of 200 – 400 kDa. The genes
that encode these proteins have been identified as var genes.
The var genes are rich in A/T content and are located predominantly in the
subtelomeric regions of all fourteen chromosomes (Rubio et al., 1996). There are ~ 60
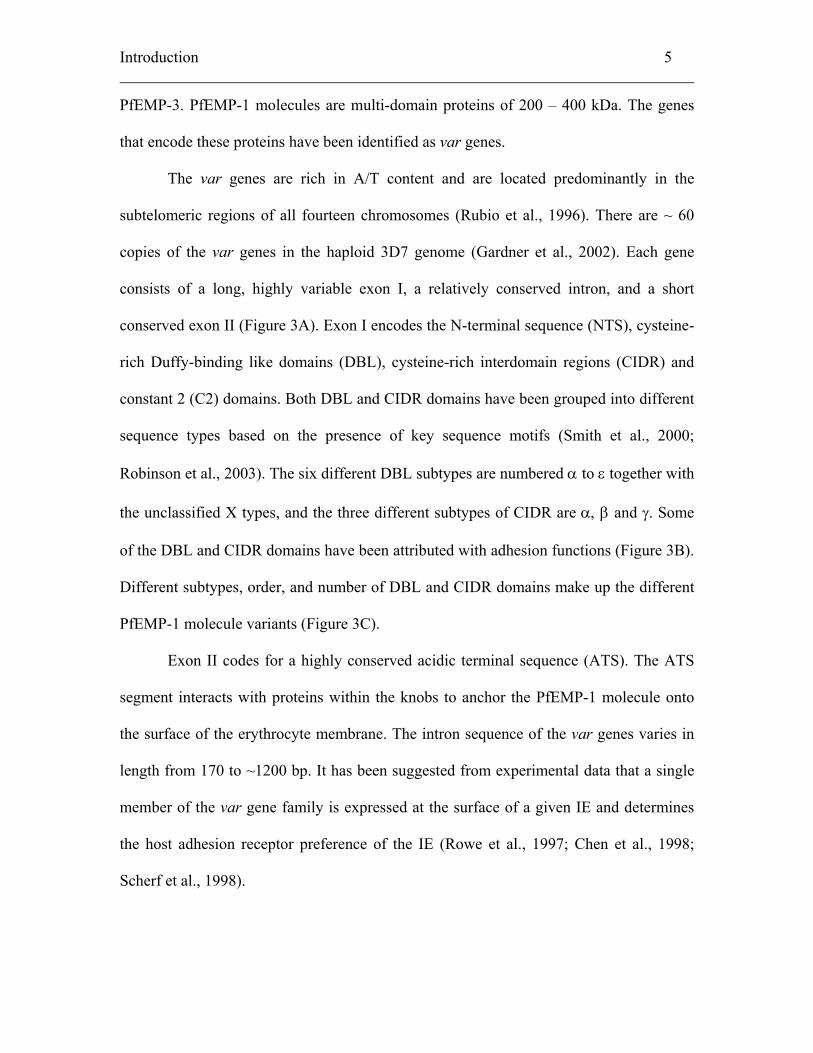
copies of the var genes in the haploid 3D7 genome (Gardner et al., 2002). Each gene
consists of a long, highly variable exon I, a relatively conserved intron, and a short
conserved exon II (Figure 3A). Exon I encodes the N-terminal sequence (NTS), cysteine-
rich Duffy-binding like domains (DBL), cysteine-rich interdomain regions (CIDR) and
constant 2 (C2) domains. Both DBL and CIDR domains have been grouped into different
sequence types based on the presence of key sequence motifs (Smith et al., 2000;
Robinson et al., 2003). The six different DBL subtypes are numbered α to ε together with
the unclassified X types, and the three different subtypes of CIDR are α, β and γ. Some
of the DBL and CIDR domains have been attributed with adhesion functions (Figure 3B).
Different subtypes, order, and number of DBL and CIDR domains make up the different
PfEMP-1 molecule variants (Figure 3C).
Exon II codes for a highly conserved acidic terminal sequence (ATS). The ATS
segment interacts with proteins within the knobs to anchor the PfEMP-1 molecule onto
the surface of the erythrocyte membrane. The intron sequence of the var genes varies in
length from 170 to ~1200 bp. It has been suggested from experimental data that a single
member of the var gene family is expressed at the surface of a given IE and determines
the host adhesion receptor preference of the IE (Rowe et al., 1997; Chen et al., 1998;
Scherf et al., 1998).
Introduction 6
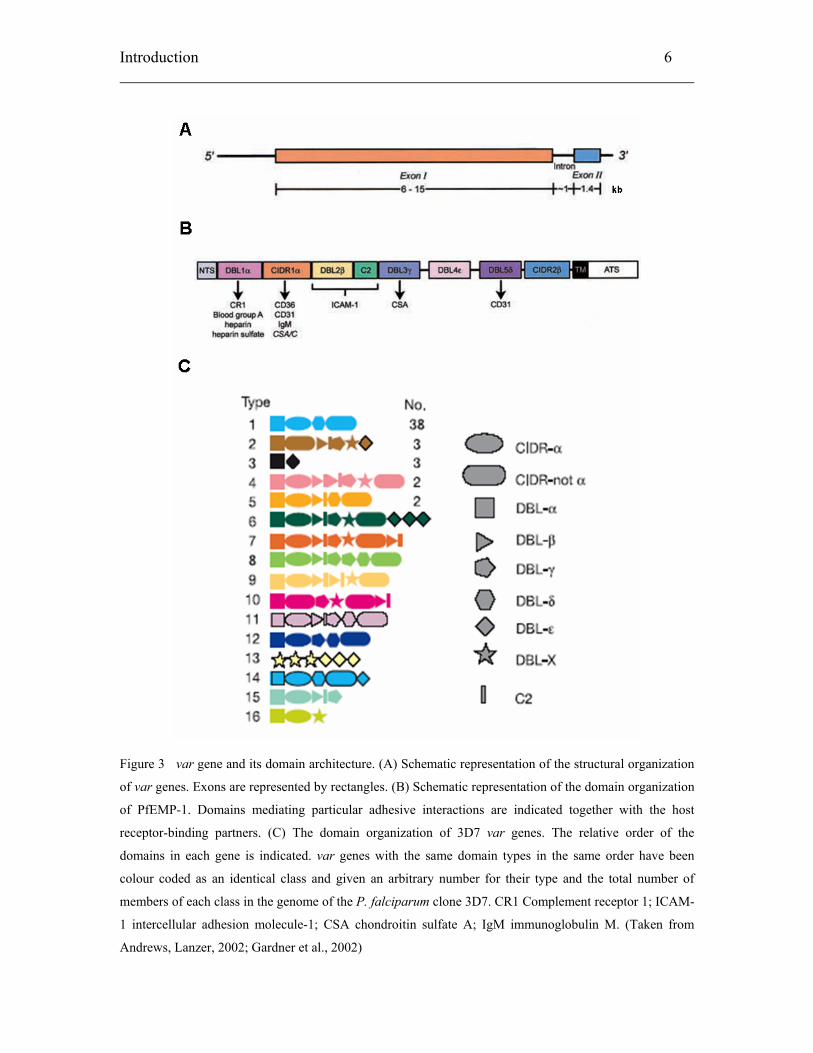
Figure 3 var gene and its domain architecture. (A) Schematic representation of the structural organization
of var genes. Exons are represented by rectangles. (B) Schematic representation of the domain organization
of PfEMP-1. Domains mediating particular adhesive interactions are indicated together with the host
receptor-binding partners. (C) The domain organization of 3D7 var genes. The relative order of the
domains in each gene is indicated. var genes with the same domain types in the same order have been
colour coded as an identical class and given an arbitrary number for their type and the total number of
members of each class in the genome of the P. falciparum clone 3D7. CR1 Complement receptor 1; ICAM-
1 intercellular adhesion molecule-1; CSA chondroitin sulfate A; IgM immunoglobulin M. (Taken from
Andrews, Lanzer, 2002; Gardner et al., 2002)
Introduction 7
1.4 Cytoadhesion to host endothelial cells and parasite sequestration
Erythrocytes infected with young forms of the parasite circulate freely, whereas
erythrocytes infected with the more mature forms of the parasite “disappear” from the
circulation, in a process called sequestration. It is a means that the IE has evolved to
escape splenic clearance. The result of sequestration is the obstruction of the capillary, a
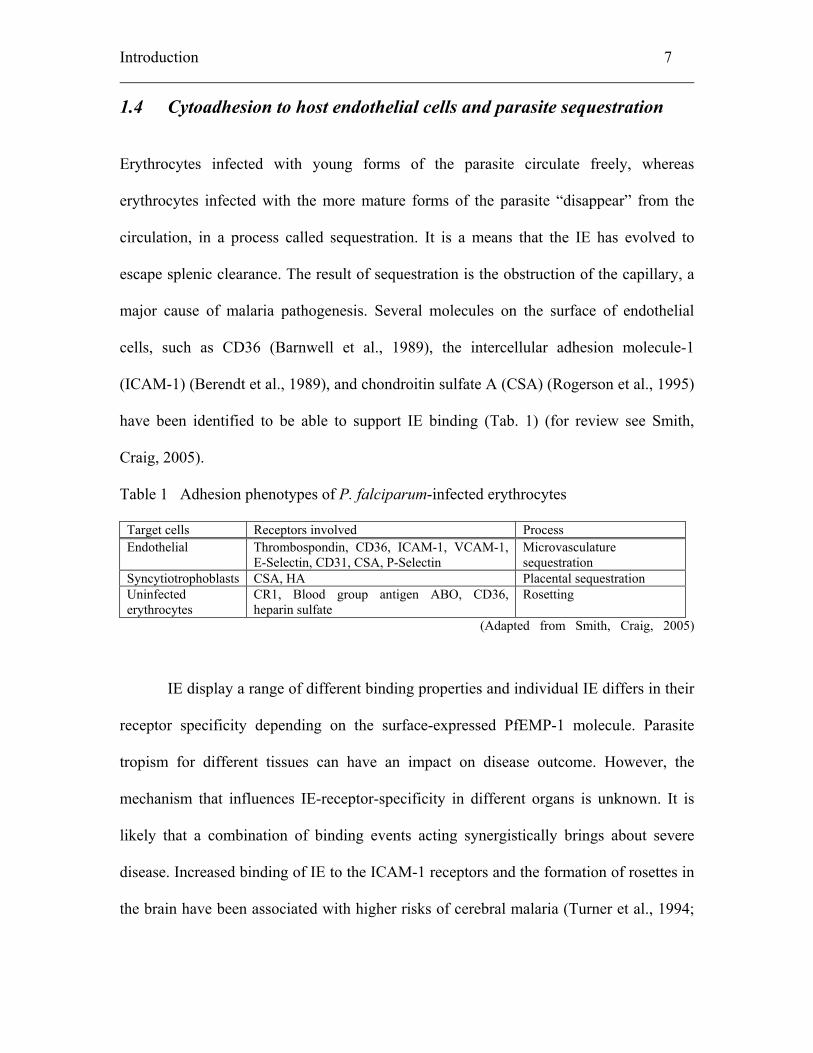
major cause of malaria pathogenesis. Several molecules on the surface of endothelial
cells, such as CD36 (Barnwell et al., 1989), the intercellular adhesion molecule-1
(ICAM-1) (Berendt et al., 1989), and chondroitin sulfate A (CSA) (Rogerson et al., 1995)
have been identified to be able to support IE binding (Tab. 1) (for review see Smith,
Craig, 2005).
Table 1 Adhesion phenotypes of P. falciparum-infected erythrocytes
Target cells Receptors involved Process Endothelial Thrombospondin, CD36, ICAM-1, VCAM-1,
E-Selectin, CD31, CSA, P-Selectin Microvasculature sequestration
Syncytiotrophoblasts CSA, HA Placental sequestration Uninfected erythrocytes
CR1, Blood group antigen ABO, CD36, heparin sulfate
Rosetting
(Adapted from Smith, Craig, 2005)
IE display a range of different binding properties and individual IE differs in their
receptor specificity depending on the surface-expressed PfEMP-1 molecule. Parasite
tropism for different tissues can have an impact on disease outcome. However, the
mechanism that influences IE-receptor-specificity in different organs is unknown. It is
likely that a combination of binding events acting synergistically brings about severe
disease. Increased binding of IE to the ICAM-1 receptors and the formation of rosettes in
the brain have been associated with higher risks of cerebral malaria (Turner et al., 1994;
Introduction 8
Fernandez-Reyes et al., 1997; Rowe et al., 1995). Severe malaria patient isolates have
been reported to bind multiple receptors (Heddini et al., 2001).
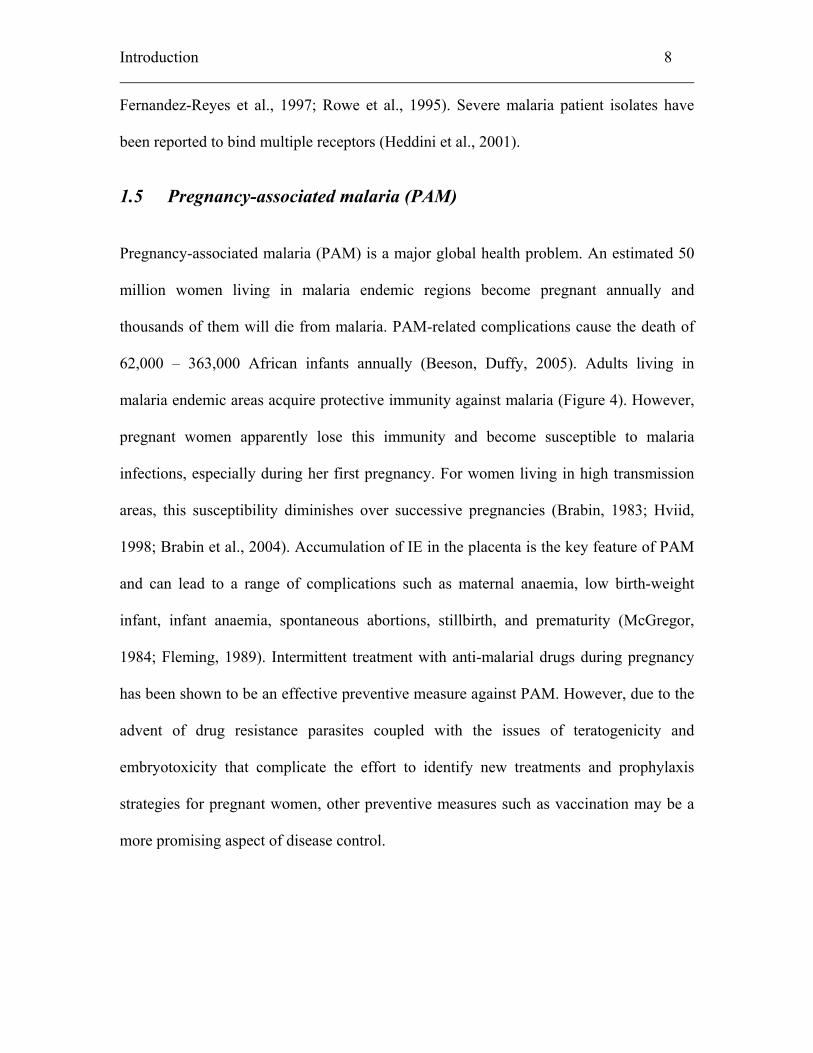
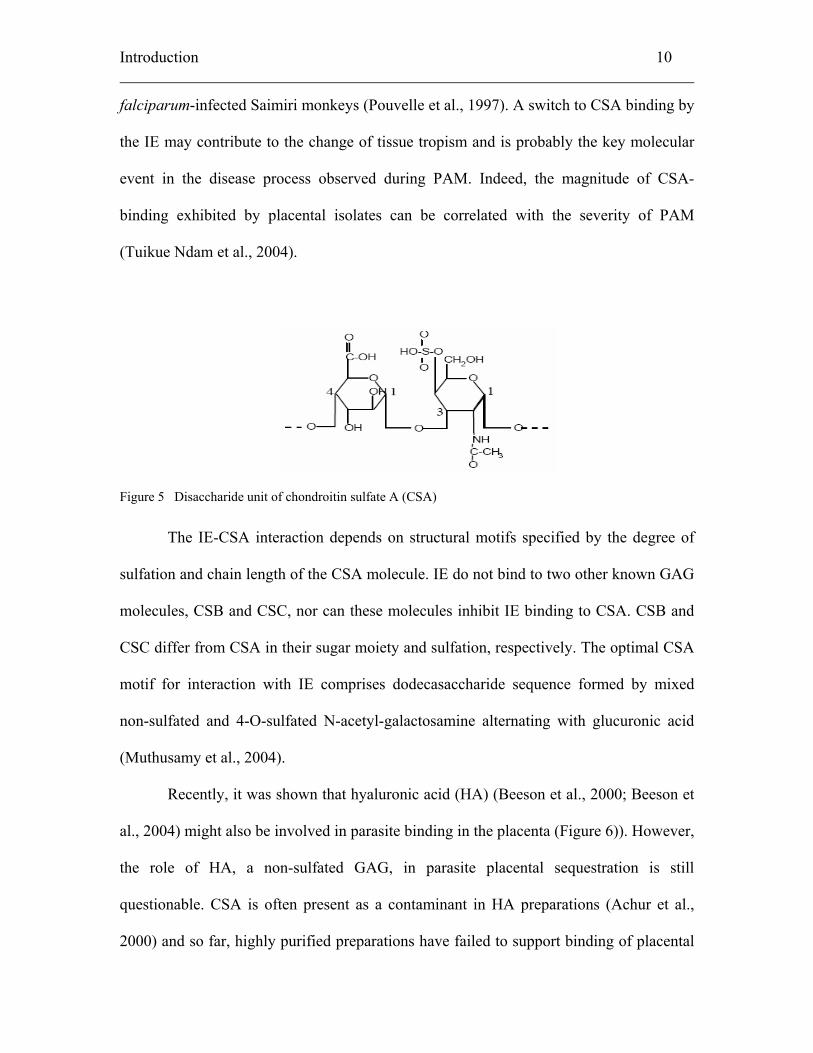
1.5 Pregnancy-associated malaria (PAM)
Pregnancy-associated malaria (PAM) is a major global health problem. An estimated 50
million women living in malaria endemic regions become pregnant annually and
thousands of them will die from malaria. PAM-related complications cause the death of
62,000 – 363,000 African infants annually (Beeson, Duffy, 2005). Adults living in
malaria endemic areas acquire protective immunity against malaria (Figure 4). However,
pregnant women apparently lose this immunity and become susceptible to malaria
infections, especially during her first pregnancy. For women living in high transmission
areas, this susceptibility diminishes over successive pregnancies (Brabin, 1983; Hviid,
1998; Brabin et al., 2004). Accumulation of IE in the placenta is the key feature of PAM
and can lead to a range of complications such as maternal anaemia, low birth-weight
infant, infant anaemia, spontaneous abortions, stillbirth, and prematurity (McGregor,
1984; Fleming, 1989). Intermittent treatment with anti-malarial drugs during pregnancy
has been shown to be an effective preventive measure against PAM. However, due to the
advent of drug resistance parasites coupled with the issues of teratogenicity and
embryotoxicity that complicate the effort to identify new treatments and prophylaxis
strategies for pregnant women, other preventive measures such as vaccination may be a
more promising aspect of disease control.
Introduction 9
Figure 4 Schematic representation of the resistance to P. falciparum-infection. The different levels of
immunity to malaria are shown for (A) non-immune individuals infected for the first time, (B) individuals
with acquired immunity to P. falciparum, and (C) women with acquired immunity undergoing her first
pregnancy. Different antigenic variants of IE have been designated Pf1-6 in the figure. (Taken from Hviid,
1998)
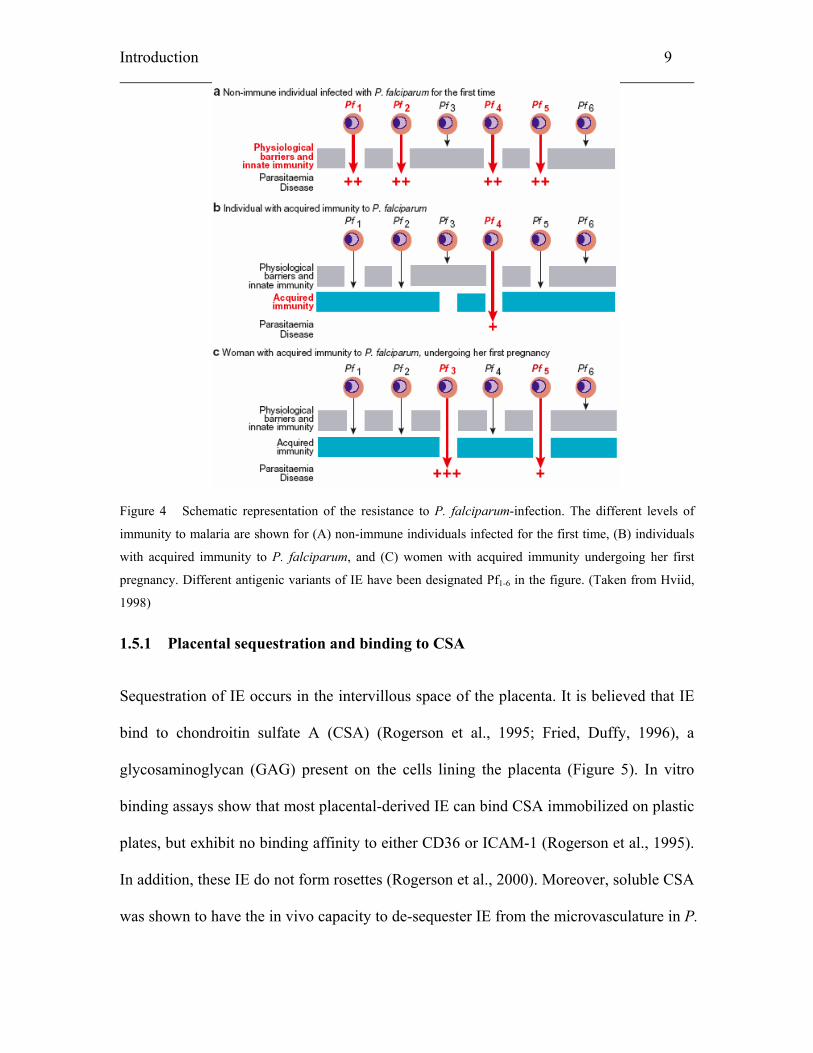
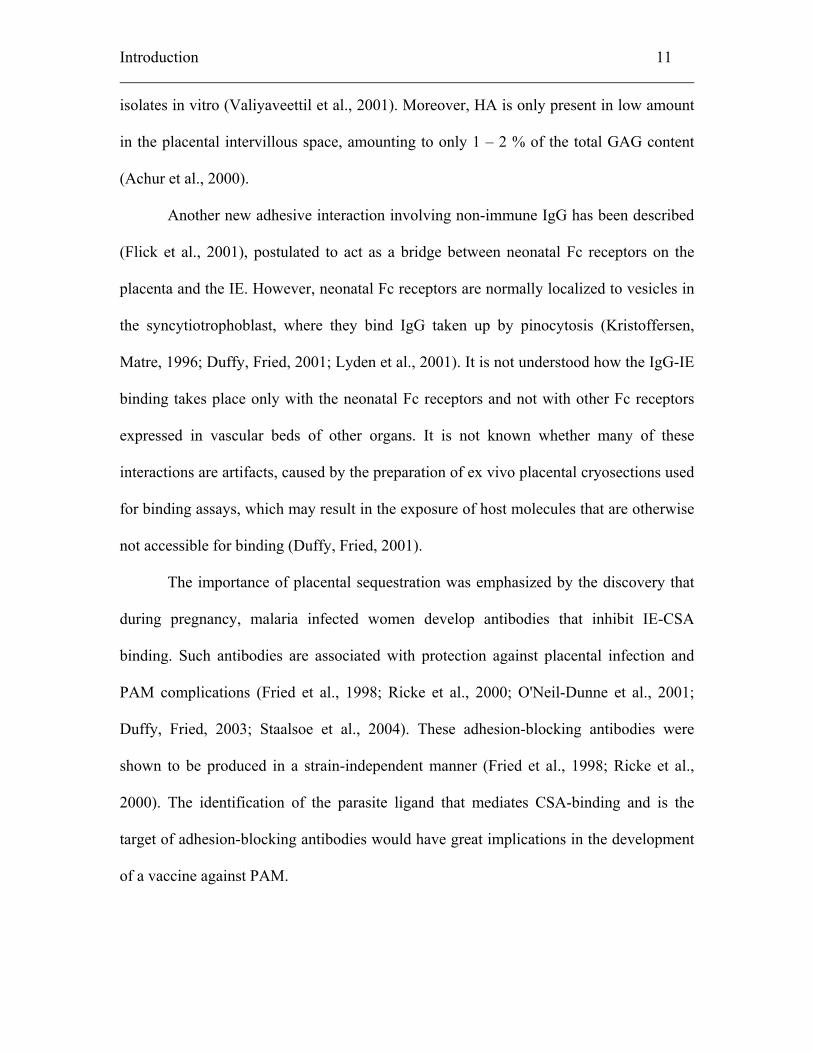
1.5.1 Placental sequestration and binding to CSA
Sequestration of IE occurs in the intervillous space of the placenta. It is believed that IE
bind to chondroitin sulfate A (CSA) (Rogerson et al., 1995; Fried, Duffy, 1996), a
glycosaminoglycan (GAG) present on the cells lining the placenta (Figure 5). In vitro
binding assays show that most placental-derived IE can bind CSA immobilized on plastic
plates, but exhibit no binding affinity to either CD36 or ICAM-1 (Rogerson et al., 1995).
In addition, these IE do not form rosettes (Rogerson et al., 2000). Moreover, soluble CSA
was shown to have the in vivo capacity to de-sequester IE from the microvasculature in P.
Introduction 10
falciparum-infected Saimiri monkeys (Pouvelle et al., 1997). A switch to CSA binding by
the IE may contribute to the change of tissue tropism and is probably the key molecular
event in the disease process observed during PAM. Indeed, the magnitude of CSA-
binding exhibited by placental isolates can be correlated with the severity of PAM
(Tuikue Ndam et al., 2004).
Figure 5 Disaccharide unit of chondroitin sulfate A (CSA)
The IE-CSA interaction depends on structural motifs specified by the degree of
sulfation and chain length of the CSA molecule. IE do not bind to two other known GAG
molecules, CSB and CSC, nor can these molecules inhibit IE binding to CSA. CSB and
CSC differ from CSA in their sugar moiety and sulfation, respectively. The optimal CSA
motif for interaction with IE comprises dodecasaccharide sequence formed by mixed
non-sulfated and 4-O-sulfated N-acetyl-galactosamine alternating with glucuronic acid
(Muthusamy et al., 2004).
Recently, it was shown that hyaluronic acid (HA) (Beeson et al., 2000; Beeson et
al., 2004) might also be involved in parasite binding in the placenta (Figure 6)). However,
the role of HA, a non-sulfated GAG, in parasite placental sequestration is still
questionable. CSA is often present as a contaminant in HA preparations (Achur et al.,
2000) and so far, highly purified preparations have failed to support binding of placental
Introduction 11
isolates in vitro (Valiyaveettil et al., 2001). Moreover, HA is only present in low amount
in the placental intervillous space, amounting to only 1 – 2 % of the total GAG content
(Achur et al., 2000).
Another new adhesive interaction involving non-immune IgG has been described
(Flick et al., 2001), postulated to act as a bridge between neonatal Fc receptors on the
placenta and the IE. However, neonatal Fc receptors are normally localized to vesicles in
the syncytiotrophoblast, where they bind IgG taken up by pinocytosis (Kristoffersen,
Matre, 1996; Duffy, Fried, 2001; Lyden et al., 2001). It is not understood how the IgG-IE
binding takes place only with the neonatal Fc receptors and not with other Fc receptors
expressed in vascular beds of other organs. It is not known whether many of these
interactions are artifacts, caused by the preparation of ex vivo placental cryosections used
for binding assays, which may result in the exposure of host molecules that are otherwise
not accessible for binding (Duffy, Fried, 2001).
The importance of placental sequestration was emphasized by the discovery that
during pregnancy, malaria infected women develop antibodies that inhibit IE-CSA
binding. Such antibodies are associated with protection against placental infection and
PAM complications (Fried et al., 1998; Ricke et al., 2000; O'Neil-Dunne et al., 2001;
Duffy, Fried, 2003; Staalsoe et al., 2004). These adhesion-blocking antibodies were
shown to be produced in a strain-independent manner (Fried et al., 1998; Ricke et al.,
2000). The identification of the parasite ligand that mediates CSA-binding and is the
target of adhesion-blocking antibodies would have great implications in the development
of a vaccine against PAM.
Introduction 12
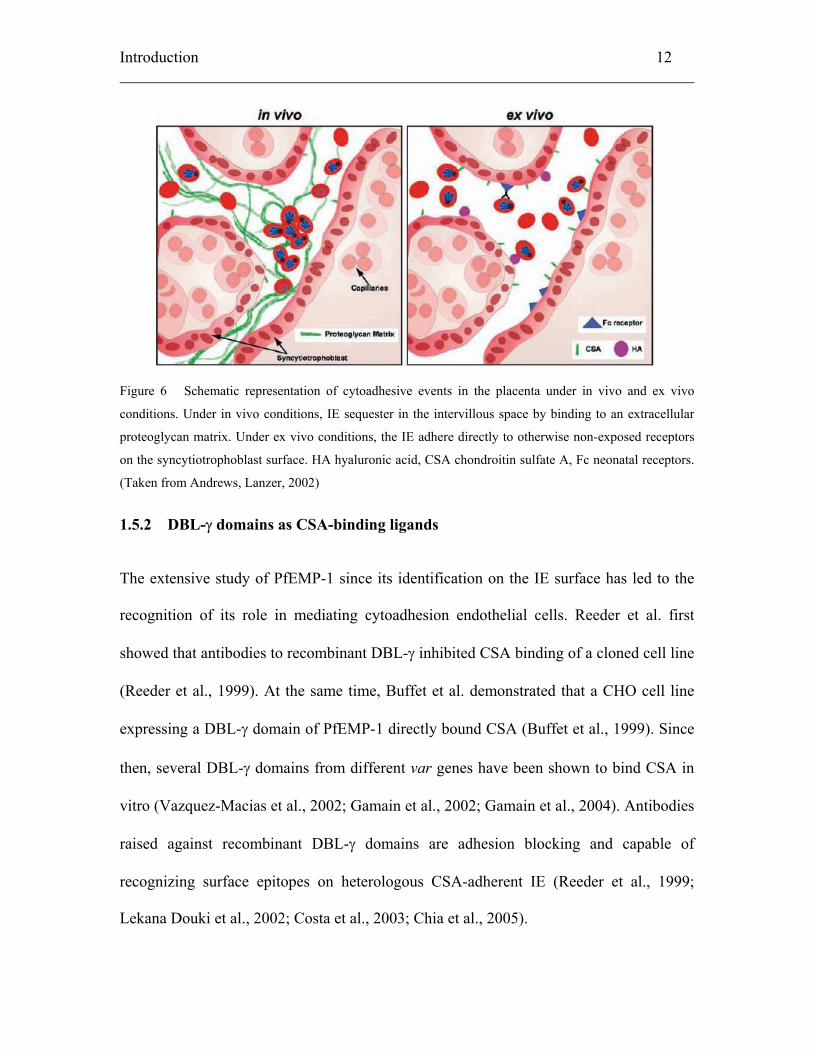
Figure 6 Schematic representation of cytoadhesive events in the placenta under in vivo and ex vivo
conditions. Under in vivo conditions, IE sequester in the intervillous space by binding to an extracellular
proteoglycan matrix. Under ex vivo conditions, the IE adhere directly to otherwise non-exposed receptors
on the syncytiotrophoblast surface. HA hyaluronic acid, CSA chondroitin sulfate A, Fc neonatal receptors.
(Taken from Andrews, Lanzer, 2002)
1.5.2 DBL-γ domains as CSA-binding ligands
The extensive study of PfEMP-1 since its identification on the IE surface has led to the
recognition of its role in mediating cytoadhesion endothelial cells. Reeder et al. first
showed that antibodies to recombinant DBL-γ inhibited CSA binding of a cloned cell line
(Reeder et al., 1999). At the same time, Buffet et al. demonstrated that a CHO cell line
expressing a DBL-γ domain of PfEMP-1 directly bound CSA (Buffet et al., 1999). Since
then, several DBL-γ domains from different var genes have been shown to bind CSA in
vitro (Vazquez-Macias et al., 2002; Gamain et al., 2002; Gamain et al., 2004). Antibodies
raised against recombinant DBL-γ domains are adhesion blocking and capable of
recognizing surface epitopes on heterologous CSA-adherent IE (Reeder et al., 1999;
Lekana Douki et al., 2002; Costa et al., 2003; Chia et al., 2005).
Introduction 13
Furthermore, DBL-γ domains cloned from placental var genes demonstrated CSA
binding capacities and conservation in placental isolate in a spatial and temporal manner
(Khattab et al., 2001; Khattab et al., 2003). These placental DBL-γ domains were termed
varPAM DBL-γ and members of this group exhibited sequences with 39 – 55 % amino
acid identities between each other (Khattab et al., 2001). Together these observations
provided first clues that the DBL-γ domain may be the elusive conserved antigen
recognized by immune pregnant women antibodies, thereby raising hopes to develop a
potential vaccine candidate based on information on the DBL-γ domain.
1.5.3 var genes implicated in PAM
The DBL-γ domains identified in 1999 were encoded by two different var genes, the
FCR3varCSA (Buffet et al., 1999) and CS2var (Reeder et al., 1999). Detailed studies
have shown that the FCR3varCSA gene was equally transcribed in all isolates (in both
CSA-binding and non-CSA-binding IE), so that a role of this var gene in causing PAM
has become questionable (Fried, Duffy, 2002; Winter et al., 2003; Fried et al., 2004). A
similar argument against a role of CS2var gene is such that the gene was transcribed at
low or undetectable levels, and levels do not increase in CSA-binding parasites (Duffy et
al., 2002; Fried, Duffy, 2002; Fried et al., 2004). In contrast, a third PAM-related var
gene, termed var2csa, was shown to be up-regulated in CSA-binding parasites (Salanti et
al., 2003). Moreover, maternal antibody recognition to protein domains of the var2csa
gene correlated to parity (Salanti et al., 2004), an observation that the FCR3varCSA and
CS2var domains were lacking. However, an analysis of IE membrane proteins by mass
spectrometry did not show a preferential expression of either var2csa or FCR3varCSA
Introduction 14
proteins by CSA-binding or placental isolates. Interestingly, several novel PfEMP-1
sequences were reported to be preferentially expressed but as yet their link to causing
disease awaits to be demonstrated (Fried et al., 2004).
These observations highlight the var gene diversity between different parasites.
The need to extend the study of var genes, particularly those originating from wild
isolates, is great. Clearly, work carried out so far on laboratory-adapted clones cannot
provide a true picture of the natural situation.
Introduction 15
1.6 Objectives of this study
1. To clone, express and purify varPAM DBL-γ domains identified from placental
isolates as histidine-tagged fusion proteins in Escherichia coli,
2. To biochemically characterize the recombinant proteins for their capacity to bind
receptor molecules expressed on CHO cell surface and to inhibit in vitro IE
binding to CSA,
3. To evaluate their immunogenicities in a cohort of plasma samples collected from
pregnant women in ELISA and to correlate their antibody levels to disease states,
4. To clone and express in E. coli individual domains of the full-length 732var gene
of a placental isolate,
5. To investigate the in vitro binding properties of the recombinant proteins,
6. To compare their immune recognition by pregnant women sera, aimed at
understanding a possible involvement in PAM.
Materials 16
2. Materials
2.1 Chemicals and reagents
1,4-dithio-DL-threitol (DTT) Roth, Germany
Acetic acid Roth, Germany
Acrylamide/bis solution Merck, USA
Agar Roth, Germany
Albumax Gibco, USA
Ammonium persulfate (APS) Roth, Germany
Bacto-tryptone Roth, Germany
Bacto-yeast extracts Roth, Germany
Borate Roth, Germany
Chondroitin sulfate A, B and C (CSA, CSB, CSC) Sigma, USA
Coomassie Brilliant Blue Roth, Germany
DMSO Sigma, USA
Ethanol Roth, Germany
Freund’s complete/incomplete adjuvant Sigma, Germany
Glucose Roth, Germany
Glycine Roth, Germany
HEPES Roth, Germany
Hyaluronic acid from bovine vitreous humour Sigma, USA
Hyaluronic acid from human umbilical cord Sigma, USA
Hypoxanthine Sigma, USA
Materials 17
Imidazole Sigma, USA
Isopropyl β-D-thiogalactopyranoside (IPTG) Roth, Germany
KCl Roth, Germany
KH2PO4 Roth, Germany
L-glutamine PAA, Austria
Low-fat dried milk powder Roth, Germany
Methanol Roth, Germany
Na lactate Sigma, USA
Na2 EDTA Roth, Germany
Na2HPO4-2H2O Roth, Germany
Na2HPO4-7H2O Roth, Germany
NaCl Roth, Germany
NaH2PO4-H2O Roth, Germany
sodium bicarbonate Sigma, USA
Ponceau S Roth, Germany
Sodium dodecyl sulfate (SDS) Roth, Germany
Trichloracetic acid Sigma, USA
Trizma base Roth, Germany
2.2 Instruments and apparatuses
Beckmann JA 12 centrifuge Beckmann, USA
Centrifuge 5415 D and 5810 R Eppendorf, Germany
Leitz inverted microscope Leitz, Germany
Materials 18
Leitz fluorescence microscope Leitz, Germany
Mini Protean II Gel Electrophoresis Chamber Bio-Rad, Germany
Power Pac 300 Bio-Rad, Germany
Primus Thermal Cycler MWG Biotech, Germany
varioMACS Miltenyi Biotec, Germany
2.3 Laboratory consumables
0.2 ml PCR reaction tubes Sarstedt, Germany
15 ml Falcon tubes Greiner, Germany
50 ml Falcon tubes Greiner, Germany
Aluminium foils Roth, Germany
96-well EIA/RIA Flat Bottom Plate Corning, USA
Cell culture flasks (25 cm2, 75 cm2) Sarstedt, Germany
Combitips (10 ml) Eppendorf, Germany
Coverslips Sarstedt, Germany
Cryovials Sarstedt, Germany
Gloves Kimberley Clark, USA
Immersion oil Roth, Germany
Immunoblot cellulose membrane Bio-Rad, Germany
MACS column CS Becton Dickinson, Germany
Microfuge tubes (0.5 ml, 1.5 ml, 2.0 ml) Sarstedt, Germany
Microscope glass slides Roth, Germany
Petri dishes (Cat. Num. 351016) Becton Dickinson, Germany
Materials 19
Petri dishes Roth, Germany
Pipette tips (10 µl, 200 µl, 1000 µl) Sarstedt, Germany
Saran wraps Roth, Germany
Sterile filter units (0.45 µm, 0.2 µm) Roth, Germany
Sterile filter units 0.2 µm (250 ml, 500 ml) Millipore, Germany
Whatmann™ 3MM paper Roth, Germany
2.4 Bacteria cells, mammalian cells and Plasmodium falciparum-
infected erythrocytes
2.4.1 Escherichia coli cells
TOP10
F-mcrA∆(mrr-hsdRMS-mcrBC)Φ80lacZ∆M15∆lacX74recA1deoRaraD139∆
(ara-leu)7697galUgalKrpsL(StrR)endA1nup (Invitrogen)
2.4.2 Mammalian Chinese hamster ovary (CHO) cells
Chinese ovary cell (CHO) K1
Chinese hamster ovary wild type cell expresses a wide repertoire of glcosaminoglycans
(GAG) including chondroitin sulfates and hyaluronic acids on the cell surface.
(Invitrogen)
CHO-pgsa-745 (CHO-745)
CHO mutant cell line with a defect in xylosyltransferase, which is involved in the early
initiation step of GAG de novo synthesis, and do not express GAG molecules. (Gift from
T. Staalsoe, Copenhagen)
Materials 20
CHO-CD36
CHO-745 stable transfectant expressing human CD36 receptor on the cell surface. (Gift
from T. Staalsoe, Copenhagen)
CHO-ICAM-1
CHO-745 stable transfectant expressing the human intracellular adhesion molecule
(ICAM)-1 on the cell surface. (Gift from T. Staalsoe, Copenhagen)
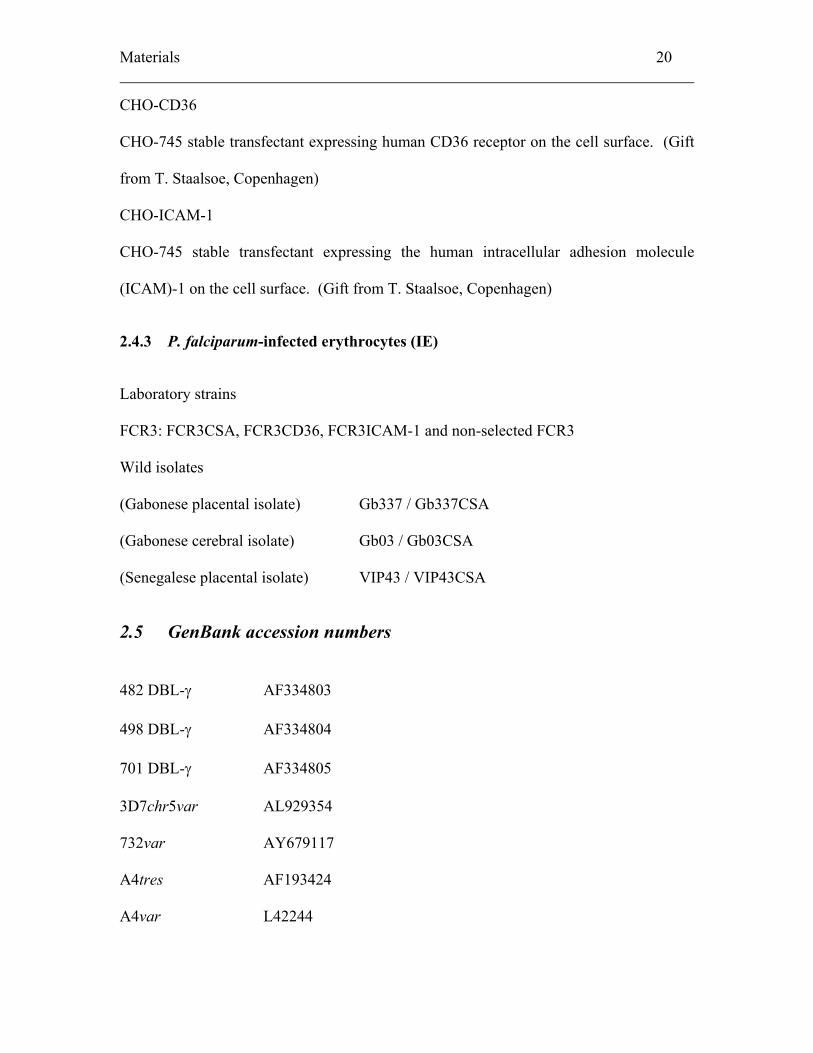
2.4.3 P. falciparum-infected erythrocytes (IE)
Laboratory strains
FCR3: FCR3CSA, FCR3CD36, FCR3ICAM-1 and non-selected FCR3
Wild isolates
(Gabonese placental isolate) Gb337 / Gb337CSA
(Gabonese cerebral isolate) Gb03 / Gb03CSA
(Senegalese placental isolate) VIP43 / VIP43CSA
2.5 GenBank accession numbers
482 DBL-γ AF334803
498 DBL-γ AF334804
701 DBL-γ AF334805
3D7chr5var AL929354
732var AY679117
A4tres AF193424
A4var L42244
Materials 21
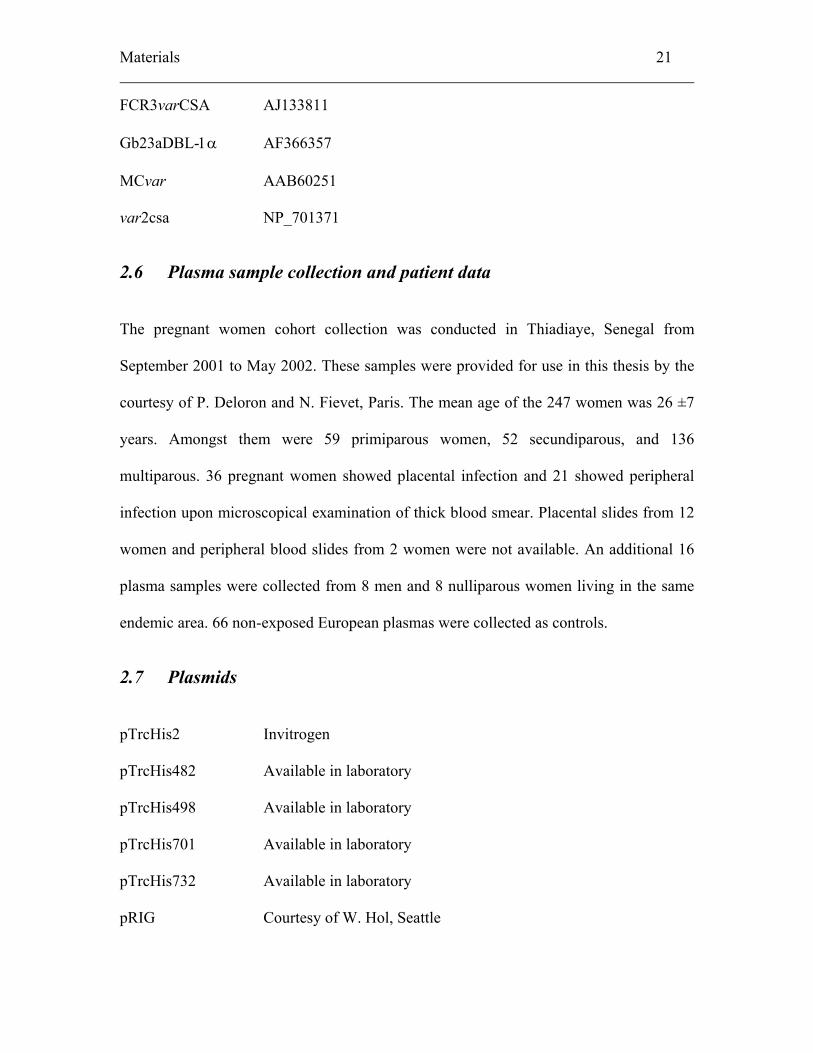
FCR3varCSA AJ133811
Gb23aDBL-1α AF366357
MCvar AAB60251
var2csa NP_701371
2.6 Plasma sample collection and patient data
The pregnant women cohort collection was conducted in Thiadiaye, Senegal from
September 2001 to May 2002. These samples were provided for use in this thesis by the
courtesy of P. Deloron and N. Fievet, Paris. The mean age of the 247 women was 26 ±7
years. Amongst them were 59 primiparous women, 52 secundiparous, and 136
multiparous. 36 pregnant women showed placental infection and 21 showed peripheral
infection upon microscopical examination of thick blood smear. Placental slides from 12
women and peripheral blood slides from 2 women were not available. An additional 16
plasma samples were collected from 8 men and 8 nulliparous women living in the same
endemic area. 66 non-exposed European plasmas were collected as controls.
2.7 Plasmids
pTrcHis2 Invitrogen
pTrcHis482 Available in laboratory
pTrcHis498 Available in laboratory
pTrcHis701 Available in laboratory
pTrcHis732 Available in laboratory
pRIG Courtesy of W. Hol, Seattle
Materials 22
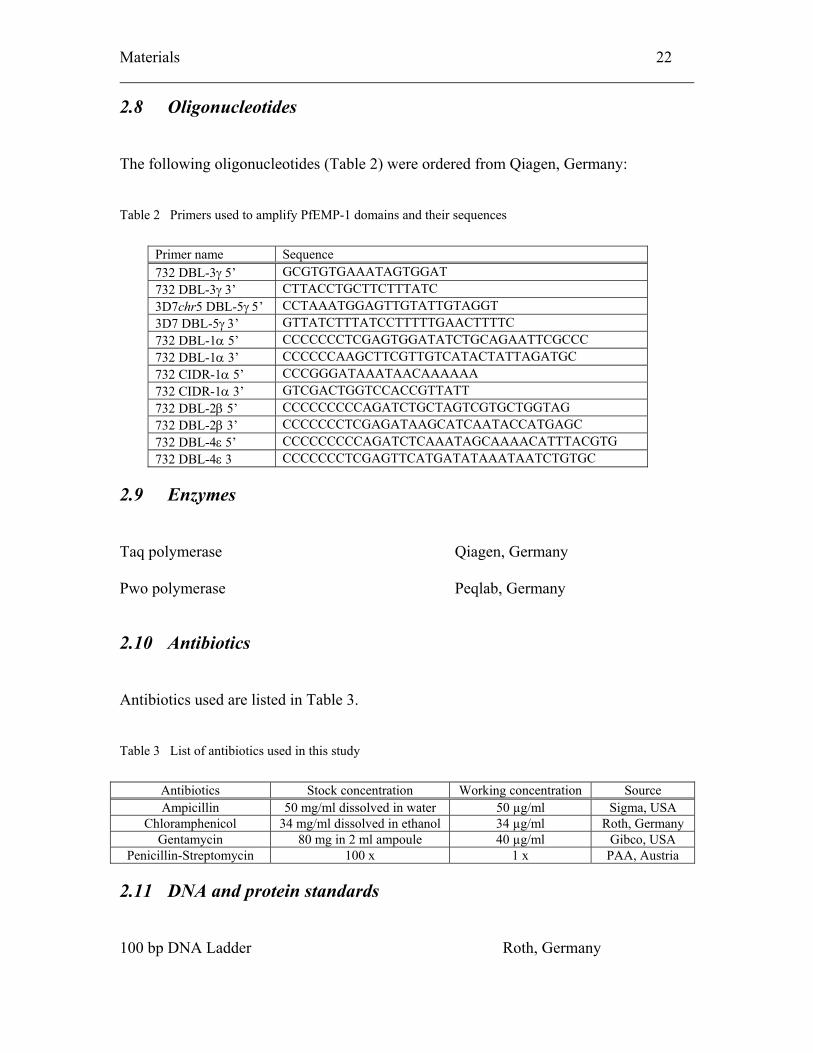
2.8 Oligonucleotides
The following oligonucleotides (Table 2) were ordered from Qiagen, Germany:
Table 2 Primers used to amplify PfEMP-1 domains and their sequences
Primer name Sequence 732 DBL-3γ 5’ GCGTGTGAAATAGTGGAT 732 DBL-3γ 3’ CTTACCTGCTTCTTTATC 3D7chr5 DBL-5γ 5’ CCTAAATGGAGTTGTATTGTAGGT 3D7 DBL-5γ 3’ GTTATCTTTATCCTTTTTGAACTTTTC 732 DBL-1α 5’ CCCCCCCTCGAGTGGATATCTGCAGAATTCGCCC 732 DBL-1α 3’ CCCCCCAAGCTTCGTTGTCATACTATTAGATGC 732 CIDR-1α 5’ CCCGGGATAAATAACAAAAAA 732 CIDR-1α 3’ GTCGACTGGTCCACCGTTATT 732 DBL-2β 5’ CCCCCCCCCAGATCTGCTAGTCGTGCTGGTAG 732 DBL-2β 3’ CCCCCCCTCGAGATAAGCATCAATACCATGAGC 732 DBL-4ε 5’ CCCCCCCCCAGATCTCAAATAGCAAAACATTTACGTG 732 DBL-4ε 3 CCCCCCCTCGAGTTCATGATATAAATAATCTGTGC
2.9 Enzymes
Taq polymerase Qiagen, Germany
Pwo polymerase Peqlab, Germany
2.10 Antibiotics
Antibiotics used are listed in Table 3.
Table 3 List of antibiotics used in this study
Antibiotics Stock concentration Working concentration Source Ampicillin 50 mg/ml dissolved in water 50 µg/ml Sigma, USA
Chloramphenicol 34 mg/ml dissolved in ethanol 34 µg/ml Roth, Germany Gentamycin 80 mg in 2 ml ampoule 40 µg/ml Gibco, USA
Penicillin-Streptomycin 100 x 1 x PAA, Austria
2.11 DNA and protein standards
100 bp DNA Ladder Roth, Germany
Materials 23
1 kb DNA Ladder Roth, Germany
Prestained Protein Marker, Broad Range New England Biolabs, USA
Prestained Protein Marker Roth, Germany
Molecular Protein Marker Biorad, USA
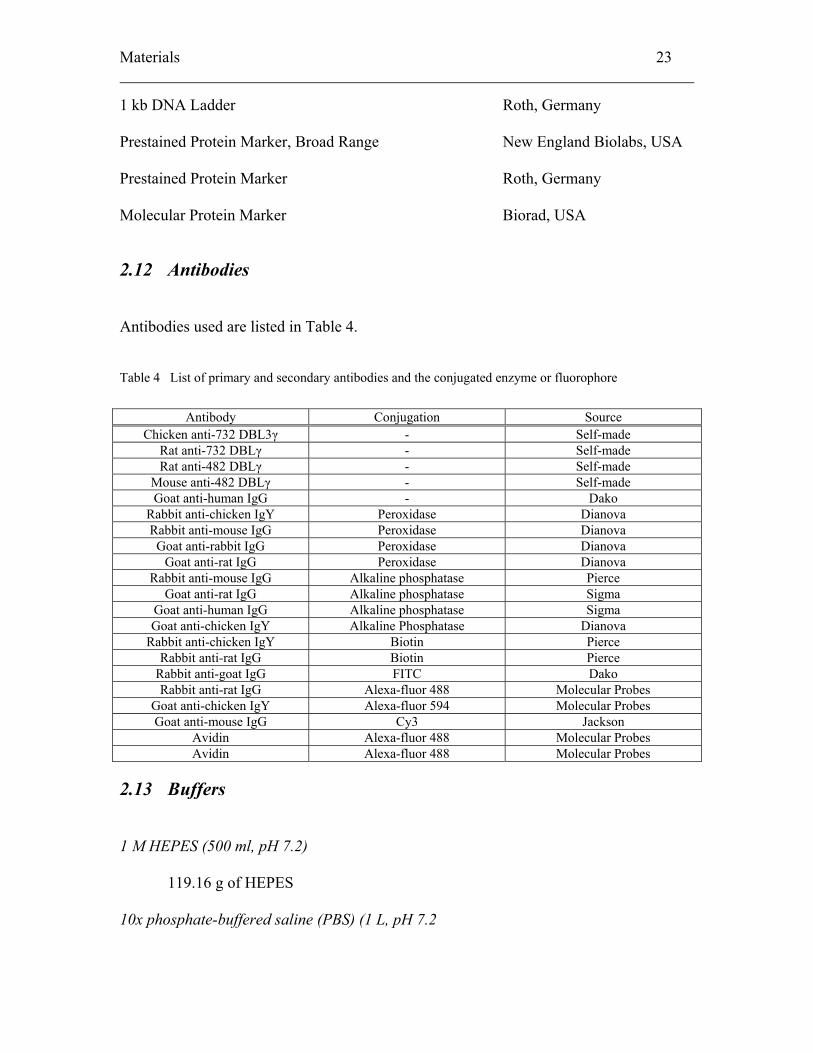
2.12 Antibodies
Antibodies used are listed in Table 4.
Table 4 List of primary and secondary antibodies and the conjugated enzyme or fluorophore
Antibody Conjugation Source Chicken anti-732 DBL3γ - Self-made
Rat anti-732 DBLγ - Self-made Rat anti-482 DBLγ - Self-made
Mouse anti-482 DBLγ - Self-made Goat anti-human IgG - Dako
Rabbit anti-chicken IgY Peroxidase Dianova Rabbit anti-mouse IgG Peroxidase Dianova Goat anti-rabbit IgG Peroxidase Dianova
Goat anti-rat IgG Peroxidase Dianova Rabbit anti-mouse IgG Alkaline phosphatase Pierce
Goat anti-rat IgG Alkaline phosphatase Sigma Goat anti-human IgG Alkaline phosphatase Sigma Goat anti-chicken IgY Alkaline Phosphatase Dianova
Rabbit anti-chicken IgY Biotin Pierce Rabbit anti-rat IgG Biotin Pierce
Rabbit anti-goat IgG FITC Dako Rabbit anti-rat IgG Alexa-fluor 488 Molecular Probes
Goat anti-chicken IgY Alexa-fluor 594 Molecular Probes Goat anti-mouse IgG Cy3 Jackson
Avidin Alexa-fluor 488 Molecular Probes Avidin Alexa-fluor 488 Molecular Probes
2.13 Buffers
1 M HEPES (500 ml, pH 7.2)
119.16 g of HEPES
10x phosphate-buffered saline (PBS) (1 L, pH 7.2
Materials 24
80 g NaCl
2 g KCl
26.8 g Na2HPO4-7H2O
2.4 g KH2HPO4
**Osmolarity: 0.3 mol/kg
Tris buffer (500 ml)
1.5 M Tris, pH 8.8: 90.86 g of Trizma base
1.0 M Tris, pH 6.8: 60.57 g of Trizma base
1x Tris-buffered saline (TBS) (1 L, pH 7.5)
6.05 g of Tris
8.76 g of NaCl
**TBS is stable at 4ºC for 3 months.
1x TBS - 0.1 % Tween (1 L)
1 ml Tween-20 was dissolved in 1 L of TBS buffer
**TBS-Tween is stable at 4°C for 3 months
10x Tris-Borate EDTA buffer (TBE) buffer (1 L, pH 8)
108 g Tris
55 g Borate
40 ml of 0.5 M of Na2EDTA
8x phosphate buffer (100 ml, pH 7.4)
1.42 g Na2HPO4-2H2O
1.11 g NaH2PO4-H2O
23.38 g NaCl
Materials 25
10x SDS-PAGE running buffer (1 L)
10 g SDS
30.3 g Tris
144.1 g glycine
**1x SDS-PAGE running buffer was prepared fresh prior to use.
5x Western blot transfer buffer (for wet blots)(1 L)
72.06 g glycine
15.14 g tris
1.87 g SDS
**1x transfer buffer was completed with 20 % methanol prior to use and
discarded after 5 times of use.
0.1 M Na Phosphate (NaPO4) buffer (200 ml, pH6.5)
27.6 g NaH2PO4-H2O (MW=138) dissolved in 1 L of water
53.62 g Na2HPO4-7 H2O (MW=268.1) dissolved in 1 L of water
68.5 ml of Na mono-salt solution was mixed with 31.5 ml of Na di-salt solution
and the volume adjusted to 200 ml with water.
1 M K Phosphate (KPO4) buffer (200 ml, pH7.2)
179.25 ml K2HPO4
70.75 ml KH2PO4
KPO4 / 7 % PEG 6000 buffer (500 ml)
35 g PEG 6000 in 500 ml KPO4 buffer
KPO4 / 24 % PEG 6000 buffer (500 ml)
120 g PEG 6000 in 500 ml KPO4 buffer
Materials 26
2.14 Media and plates
All culture media and sera were purchased from PAA, Austria unless stated otherwise.
2.14.1 E. coli cultures
Luria-Bertani (LB) Medium (1 L, pH 7.2)
10 g bacto-tryptone
5 g bacto-yeast extract
10 g NaCl
Luria-Bertani (LB) agar (1 L, pH 7.2)
10 g bacto-tryptone
5 g bacto-yeast extract
10 g NaCl
20 g agar
**The agar was cooled to 55ºC after autoclaving and poured into Petri dishes.
Approximately 25 ml of liquid agar was poured into one 100 mm Petri dish.
LB-Ampicillin agar (1 L, pH 7.2)
10 g bacto-tryptone
5 g bacto-yeast extract
10 g NaCl
20 g agar
**25 mg of filter-sterilized ampicillin was added to the cooled liquid agar before
pouring in to Petri dishes. For double antibiotic selection with ampicillin and
Materials 27
chloramphenicol, 50 µl of chloramphenicol (100µg/ml) was plated into the agar
prior to use.
Super Medium (1 L, pH 7.2)
25 g bacto-tryptone
10 g bacto-yeast extract
5 g NaCl
2.14.2 P. falciparum cultures
Supplemented RPMI-1640 Medium (500 ml)
500 ml of RPMI-1640 medium
25 mM of HEPES (pH 7.2)
50 ml 10x Albumax
10 ml human serum (blood group AB+)
50 mg/ml gentamycin
10x Albumax (500 ml, pH 7.2)
5.2 g RPMI-1640 powder
2.98 g HEPES
1.67 g sodium bicarbonate
1 g glucose
0.1 g hypoxanthine
25 g Albumax II
50 mg/ml gentamycin
Glycerolyte freezing solution (100 ml, pH 6.8)
57 % v/v glycerol
Materials 28
1.6 g Na-lactate (Sigma)
30 mg KCl
100 ml of 25 mM sodium phosphate buffer (pH6.8)
Thawing solution
12 % and 1.6 % sterile saline
Binding medium (500 ml, pH 6.8)
5.2 g RPMI powder (without bicarbonate)
1.44 g Glucose
3.75 g HEPES (35.7 mM)
2.5 g BSA
2.14.3 Chinese Hamster Ovary (CHO) cell cultures
Supplemented Ham’s Medium
500 ml of Hank’s medium
10 % heat-inactivated FCS
100x penicillin-streptomycin
2 mM L-glutamine
Freezing solution
Complete Hank’s medium
20 % heat-inactivated FCS
10 % DMSO
2.15 Solutions
Glycosaminoglycan (GAG) solutions
Materials 29
Chondroitin sulfate A, B, and C
Hyaluronic acid from bovine vitreous humor and human umbilical cord
**Stock solutions of 10 mg/ml were prepared by dissolving the GAG powder in
PBS and stored at -20ºC. Working solutions were prepared by diluting the stock
in PBS to the appropriate concentration.
10 % Sodium dodecyl sulfate (SDS)
10 g SDS was dissolved in 100 ml of water by heating to 68°C.
10 % Ammonium persulfate (APS) (10 ml)
1 g ammonium persulfate
The solution was aliquoted and kept at -20°C, at 4°C it is stable for 2 weeks.
Coomassie blue stain (1 L)
2.5 g Coomassie blue powder
450 ml methanol
100 ml acetic acid
Coomassie destaining buffer (1 L)
450 ml methanol
100 ml acetic acid
Ponceau S Solution (100 ml)
2 g Ponceau S
30 g trichloracetic acid
30 g sulfosalicylic acid
Western blot blocking solution
3 g of low-fat dried milk was dissolved in 100 ml of TBS buffer (3 %)
Materials 30
** The blocking solution are prepared fresh prior to use
1 M isopropyl β-D-thiogalactopyranoside (IPTG) (5 ml)
1.19 g IPTG (238.3 g/mol) was dissolved in 5 ml water
The IPTG was kept at -20°C in 1 ml aliquots
1 M 1,4-dithio-DL-threitol (DTT) (20 ml)
3.085 g DTT (154.25 g/mol) was dissolved in 20 ml water.
The solution was kept in 1 ml aliquots at -20°C.
Methods 31
3. Methods
3.1 Handling of cultures
3.1.1 Bacteria culture
Escherichia coli cells were cultured in Luria Bertani (LB) medium. The culture was
supplemented with ampicillin (for pTrcHis2 plasmid) and/or chloramphenicol (for pRIG
plasmid) to maintain the recombinant plasmids within the transformed bacterial cells (see
Section 3.2.3.1). E. coli strains were grown in shaking cultures at 37ºC. Transformed
bacteria clones were streaked on LB agar and kept at 4ºC. Glycerol (1:1 ratio to the
culture) was added to the bacterial culture and kept at -70ºC.
3.1.2 Plasmodium falciparum culture
Plasmodium falciparum cultures were cultivated in T-25 and T-75 tissue culture flasks at
5 % haematocrit in 5 ml and 20 ml of completed RPMI-1640 medium, respectively. The
cultures were kept in a special gas environment consisting of 5 % carbon dioxide, 5 %
oxygen and 90 % nitrogen. Daily change of the culture medium was performed. Thin-
blood films were prepared daily on glass slides to check the parasitaemia. Sub-cultures
were prepared when the parasitaemia exceeds 5 %.
Frozen vials were removed from liquid nitrogen storage and thawed quickly in a
37°C water bath. The blood was transferred into a 50 ml Falcon tube and the volume
within the vial was estimated (V). One-tenth of the blood volume (1/10 V) of 12 % warm
NaCl was added to the blood slowly drop-wise while gently swirling the tube. The
Methods 32
solution was left standing at RT for 5 min. Following this, 10 V of 1.6 % warm NaCl was
added to the solution slowly and drop-wise. The blood-saline solution was centrifuged at
1500 rpm for 5 min to pellet the blood cells. The supernatant was aspirated and the pellet
was washed with 10 volumes of complete medium. The suspension was centrifuged and
the medium removed. The pellet was resuspended in 5 ml complete medium and the
haematocrit adjusted to 5 % before putting into culture.
Cultures containing erythrocytes parasitized by ring-stages of the parasite were
centrifuged at 2000 rpm for 5 min. The supernatant was removed and the pellet volume
of the packed cells, V, was estimated. One-third V (1/3 V) of glycerolyte was added
slowly into the pellet and mixed gently. The suspension was left to stand for 5 min at RT.
Then 4/3 V of glycerolyte was added drop by drop and mixed gently. Aliquots of 1 ml of
blood were frozen at -70ºC for a minimum of 18 h before putting into liquid nitrogen
storage tanks for long-term storage.
3.1.2.1 Giemsa staining of thin blood films
A thin blood film was prepared from 40 µl of erythrocyte suspension, air-dried and fixed
by immersing it in methanol for 30 sec. 10 % Giemsa solution was prepared in a staining
jar. The glass slide was immersed in the Giemsa solution for 20 min then washed and
dried.
3.1.2.2 Estimation of parasitaemia
The Giemsa-stained thin-blood film was observed under 100x magnifications. An area
where the erythrocytes are evenly distributed was chosen for estimation of parasitaemia.
Methods 33
All erythrocytes and infected erythrocytes (IE) within the field were counted. This was
done for 10 fields. Parasitaemia is calculated as:
Parasitaemia = number of IE/uninfected erythrocyte x 100%
3.1.2.3 Selection of cytoadherent P. falciparum-infected erythrocytes (IE)
3.1.2.3.1 Selection of CSA-binding IE
Three-ml of CSA (10 µg/ml in PBS) was used to coat Petri dishes overnight at 4ºC. The
CSA solution was aspirated and the plates blocked with filtered sterile 2 % BSA (in PBS)
for 1 h at RT. Three-ml of parasite culture (at 5 % haematocrit, >10 % parasitaemia) was
added after the removal of the blocking solution and incubated for 1 h at 37ºC. The plate
was gently agitated to resuspend the erythrocytes every 15 min. After this, the parasite
culture was aspirated and the plate was washed 3-5 times with binding medium.
Thereafter 3 ml of completed medium at 5 % haematocrit was added into the plate. Seven
such plates were used for every 20 ml parasite culture.
3.1.2.3.2 Selection of CD36- and ICAM-1-binding IE
CHO-CD36 and CHO-ICAM-1 cells were seeded and grown in T-25 flasks. The parasite
(at 5 % haematocrit, > 5 %. parasitaemia) was washed once with binding medium and
resuspended in 5 ml of binding medium. CHO cells were washed once with binding
medium to remove growth medium and overlaid with the erythrocyte suspension. The
parasite was incubated with CHO cells at 37ºC for 1-1.5 h. The flask was gently shaken
every 15 min to resuspend the erythrocytes. Thereafter the flask was gently washed three
times with binding medium to remove unbound erythrocytes. Binding of erythrocytes
Methods 34
was checked using an inverted microscope. Completed malaria medium and blood were
added to the flask at 5 % haematocrit. The next day, the culture was collected and
cultured in a new flask with fresh medium.
3.1.2.4 Sorbitol synchronization of IE
Synchronization was performed with young ring-stages of the IE. Four-ml of parasite
culture was centrifuged at 2000 rpm for 5 min and the medium (supernatant) was
removed. The cell pellet was resuspended in 4 ml of 5 % sorbitol (dissolved in water and
filtered through a 0.2 µm membrane) and incubated for 10 min at RT. The suspension
was shaken 2-3 times. The suspension was centrifuged and the supernatant removed. The
pellet was washed 3 times with RPMI-1640 medium. The pellet was resuspended in
complete medium (at 5 % haematocrit) after the last wash and put into culture.
Synchronization was performed in four individual tubes for a 20 ml parasite culture.
3.1.2.5 Enrichment of late-stage IE by magnetic cell sorting (MACS)
A MACS column was first washed and flooded with 2 % FCS –PBS before insertion into
the varioMACS. The flow-rate of the buffer from the column was adjusted until it is
drop-wise. When the buffer was only a thin layer above the column bed, the parasite
culture (at > 5 % haematocrit, containing mainly late-stage IE) was added into the column.
The late-stage IE were retained in the column and washed with 30 ml of buffer before
elution from the column. The IE was eluted from the column by flushing the column with
50 ml of buffer and was collected in a 50 ml Falcon tube. The IE was pelleted by
centrifugation and the pellet resuspended in the appropriate volume of buffer. The
enriched late-stage IE is now ready for downstream application.
Methods 35
3.1.2.6 Removal of surface expressed PfEMP-1 by trypsin treatment
100 µg/ml of trypsin was used to remove IE surface expressed PfEMP-1 molecules.
Treatment was performed at 37ºC for 10 min followed by extensive washes with buffer to
remove traces of trypsin.
3.1.3 Mammalian cell culture
Chinese hamster ovary (CHO) cells were detached from the surface of a T-25 culture
flask with 1 ml of trypsin. The complete removal of medium before addition of trypsin is
essential, as the Ca2+ in the medium will inactivate the trypsin. The cells were incubated
with the trypsin buffer for 10-15 min at 37ºC until all cells have detached from the
surface. Fresh culture medium was added into the flask to stop the reaction. For routine
sub-culturing, a new culture was initiated with 1:20 dilution.
To freeze CHO cells, the cells were detached as described and pelleted. The cells
were resuspended in pre-chilled freezing solution at 1x10⁷ cells/ml. Aliquots of the cell
suspension was put on ice until transferred into -70ºC freezer or in liquid nitrogen for
long-term storage.
CHO cells were thawed in a warm water bath quickly and transferred to fresh
warm medium to initiate a new culture. The medium was replaced with fresh medium to
remove traces of the cryo-preservatives.
3.2 Molecular biology
3.2.1 Polymerase chain reaction (PCR)
Routine PCR reactions were performed in 50 µl reaction volumes as following:
Methods 36
PCR reaction: 1 µl DNA template
5 µl 10x PCR buffer
1 µl 2 mM dNTPs
1 µl Forward primer (10 µM)
1 µl Reverse primer (10 µM)
40.5 µl Sterile water
0.5 µl Taq polymerase (1 unit/µl)
The following cycling profile was used:
95ºC 3 min
(5 cycles): 95ºC 30 sec
55ºC 1 min
68ºC 3 min
(5 cycles): 95ºC 30 sec
50ºC 1 min
68ºC 3 min
(25 cycles): 95ºC 30 sec
45ºC 1 min
68ºC 3 min
68ºC 10 min
3.2.2 Purification of PCR product
The QIAquick PCR Purification Kit (Qiagen, Germany) was used to purify DNA
fragments (100 bp to 10 kb) after PCR or enzymatic reactions. Five volumes of Buffer
PB was added to 1 volume of the PCR sample and mixed. A QIAquick spin column was
Methods 37
placed in a 2 ml collection tube. The column was briefly centrifuged to bind the DNA to
the column. The flow-through was discarded and the column was placed in the same
collection tube. 0.75 ml of Buffer PE was added to wash the DNA bound on the column
and centrifuged for 1 min. The flow-through was discarded and the column centrifuged
for another 1 min to remove all traces of Buffer PE. Fifty-µl of Buffer EB (10 mM Tris
Cl, pH 8.5) was added to the membrane and incubated for 1 min and then centrifuged for
1 min to elute the DNA.
3.2.3 TOPO TA Cloning
Five-µl of TOPO cloning reaction was set up consisting of 4 µl of PCR product and 1 µl
of TOPO vector from the TOPO TA Cloning Kit (Invitrogen, USA). The reaction was
mixed gently and incubated for not more than 5 min at RT or the transformation
efficiencies may decrease. The TOPO cloning reaction may be kept at -20°C for 24 h if
necessary although this will lower the transformation efficiency.
3.2.3.1 Transformation
This was carried out according to the manufacturer’s instructions. Two µl of TOPO
cloning reaction was added into a vial of TOP10 bacterial competent cells (Invitrogen,
USA) and mixed gently. The suspension should not be mixed by pipetting up and down.
The mixture was incubated on ice for 30 min and then heat shocked for 45 sec at 42°C
without shaking. The tube was transferred immediately to ice before adding 250 µl of
SOC medium (pre-warmed to RT). The tube was closed tightly and incubated at 37°C for
30 min with vigorous shaking. The transformation reaction was spread out on a pre-
Methods 38
warmed LB-Amp selection plate. Two different volumes were plated, i.e. at 250 µl and at
a smaller volume of 50 µl to ensure well-spaced colonies. The plates were incubated at
37°C overnight. Colony screening for positive colonies were performed on the following
morning.
For transformation with plasmid DNA, 1-10 ng of DNA was used for 0.1 ml of
competent bacterial cells. The plasmid DNA stock was diluted with water to the
appropriate concentration. In the case, that RIL plasmid is present in the bacterial cell, the
selection plate contains chloramphenicol in addition to ampicillin.
3.2.3.2 Analysis of positive clones
PCR screening procedure was used to identify transformed E. coli carrying the
recombinant plasmids. A PCR was first performed using vector-specific forward and
reverse primers (available with the cloning kit from the manufacturer) to identify clones
that carry the recombinant plasmid. A second PCR was then performed using vector-
specific forward primer and the insert-specific reverse primer to determine the orientation
of the inserted DNA fragment within the plasmid. The identified plasmid was confirmed
by nucleotide sequencing (Agowa, Germany).
Positive clones were analyzed directly by PCR. A PCR cocktail was prepared and
dispensed in 50 µl aliquots. Ten colonies were picked with a clean toothpick and dipped
into the PCR reaction. The toothpick was then used to inoculate 2 ml of LB medium
containing the appropriate antibiotics overnight at 37ºC with vigorous shaking. The
amplified PCR product was visualized by agarose gel electrophoresis. Positive clones
were then tested for recombinant protein expression.
Methods 39
3.2.4 DNA isolation
Bacterial plasmid DNA isolation was performed using the QIAprep Miniprep or
Maxiprep kits (Qiagen, Germany) depending on the concentration of DNA required for
downstream application of the plasmid. For nucleotide sequencing and PCR analysis,
plasmid was isolated by miniprep. However, for higher concentration of plasmid,
Maxiprep was used to prepare the DNA plasmid.
3.2.4.1 Miniprep
One ml of bacterial culture was centrifuged at maximum speed for 1 min and
resuspended in 250 µl of Buffer P1. 250 µl of Buffer P2 was added and the tube gently
inverted for 4-6 times to mix. The suspension left standing at RT for 3 min before adding
350 µl of Buffer N3. The tube was inverted 4-6 times immediately after adding Buffer N3
and then centrifuged for 10 min at maximum speed. The supernatant was then transferred
into a fresh QIAprep column in a 2 ml collection tube and then centrifuged again for 1
min. The flow-through was discarded. The QIAprep column was washed with 0.75 ml of
Buffer PE and centrifuging again for 1 min. The flow-through was discarded and
centrifuged for an additional 1 min. The QIAprep column was placed in a clean 1.5 ml
microfuge tube. The DNA was eluted by adding 50µl of Buffer EB (10 mM TrisCl, pH
8.5) to the centre of the column and incubating it for 1 min before centrifugation. The
miniprep yield was analyzed in agarose gel.
Methods 40
3.2.4.2 Maxiprep
A single colony was picked and inoculated into a 100 ml of selective LB medium. The
culture was grown at 37°C overnight with vigorous shaking. The bacterial cells were
harvested by centrifugation at 6000 g for 15 min at 4°C. The bacterial pellet was
completely resuspended in 4 ml Buffer P1 by vortexing and pipetting until no cell clumps
were visible. Ten ml of Buffer P2 was added and mixed gently by inverting the tube 4-6
times before incubating it for 5 min at RT. Ten ml of chilled Buffer P3 was added and
mixed immediately by inverting the tubes. The suspension was incubated on ice for 20
min. Following this, the suspension was centrifuged at 12000 g for 30 min at 4°C. The
supernatant containing the plasmid DNA was removed immediately. The supernatant was
centrifuged again. In the meantime, a QIAGEN-tip 500 was equilibrated by applying 10
ml of Buffer QBT and the column was allowed to empty by gravity flow. The plasmid
containing supernatant was added into the column. The QIAGEN-tip was washed twice
with 30 ml of Buffer QC. The DNA was eluted with 15 ml Buffer QF and precipitated
with 10.5 ml (0.7 volumes) of isopropanol by centrifuging immediately after addition of
isopropanol at 12000 g for 30 min at 4°C. The supernatant was decanted carefully
without disturbing the DNA pellet. The DNA pellet was washed with 70 % ethanol and
centrifuged at 12000 g for 10 min. The supernatant was decanted carefully. The pellet
was air-dried and the DNA redissolved in a suitable volume of sterile buffer (TE, ph 8.0,
sterile filtered). The yield was determined by both quantitative agarose gel
electrophoresis and by UV spectrophotometry.
Methods 41
3.2.5 DNA purity and concentration determination
Five µl of DNA was diluted in 95 µl of water (1/50 dilution) and the absorbance
measured at 260 nm and 280 nm. The integrity of the DNA was analysed by gel
electrophoresis. The purity of the DNA was determined from the A260/A280 ratio.
A260/A280 ≥1.8 indicates pure DNA
A260/A280 >2.0 indicates possible contamination with RNA
A260/A280 <1.8 indicates contamination with proteins and aromatic substances
The following formula was used to estimate the DNA concentration:
1 A260 Unit of dsDNA = 50 µg/ml in water
3.2.6 DNA agarose gel electrophoreses
Thirty-five-ml of 1.5 % agarose solution in 1x TBE buffer containing 1µg/ml EtBr was
used. The electrophoresis was performed with 1x TBE running buffer at 100 V until
separation is complete. The agarose gel was removed from the chamber and viewed with
a UV lamp. A picture was taken for documentation.
3.2.7 DNA extraction from agarose gel
The QIAquick Gel Extraction Kit (Qiagen, Germany) was used to extract DNA from a
low-melting agarose gel after gel electrophoresis. The DNA fragment was excised from
the agarose gel with a clean sharp scalpel. The gel slice was weighed in a microfuge.
Three volumes of Buffer QG was added to 1 volume of gel (100 mg = 100 µl) and
incubated at 50ºC for 10 min or until the gel has completely dissolved. The tube was
vortexed every 2-3 min to help dissolve the gel. One gel volume of isopropanol was
Methods 42
added to the mix if the DNA fragment was <500 bp or >4kb. The mixture was placed in a
QIAquick spin column and centrifuged for 1 min at maximum speed to bind the DNA to
the column. To wash the DNA, 0.75 ml of Buffer PE was added and the column
centrifuged for 1 min. The flow-through containing the Buffer PE was centrifuged for
another 1 min to remove all traces of the buffer. The column was placed in a clean tube
and 50 µl of Buffer EB was added, the column was left to stand for 1 min and centrifuged
for another min. Alternatively, for a more concentrated DNA, only 30 µl of the buffer
was used to elute the DNA.
3.2.8 Protein expression in bacterial cells
Two-ml of LB medium containing the necessary antibiotics were inoculated with a single
recombinant E. coli colony and grown overnight at 37°C under agitation. Ten ml of Super
medium containing 50 µg/ml ampicillin (and 34 µg/ml chloramphenicol if the pRIG
plasmid is present) was inoculated with 0.2 ml of the overnight culture. The culture was
grown at 37°C with vigorous shaking to an optical density (OD600) of 0.9. One-ml aliquot
of cells was kept as zero time point sample. IPTG was added to the culture to a final
concentration of 1 mM (9µl of a 1 M IPTG stock to 9 ml of culture) to initiate protein
expression. The induced culture was incubated at 37°C with vigorous shaking for a
further 5 hours. One-ml sample was taken at the end of the induction period. The 8 ml
culture was pelleted and frozen for further analysis.
The 1 ml pre- and post-induction samples were centrifuged at maximum speed
and the supernatant aspirated. The cell pellet was boiled at 95°C for 5 min with 50 µl of
2x SDS-PAGE loading buffer. The buffer was transferred to a fresh tube and stored at -
20°C. Fifteen µl of the sample was loaded into and analyzed in 12 % SDS-PAGE gel.
Methods 43
The gel was stained with Coomassie blue and a band with increased intensity in the post-
and not in the pre-induction sample corresponding to the expected size range of the
recombinant protein was sought. Western blot analysis was performed and probed with
anti-6xHis antibody to confirm the identity of the expressed recombinant protein band.
For scale-up expression, the conditions determined previously were used to grow
and induce 500 ml of cell culture. The induced cell culture was centrifuged and the cell
pellets frozen at -20ºC if protein purification was performed at a later date.
3.2.9 Purification of recombinant protein
Frozen pellets of the induced E. coli cells were thawed on ice. Twenty-ml of lysis buffer
provided by the Ni-NTA Agarose kit (Qiagen, Germany) was used to resuspend the cell
pellets from 400 ml of culture. The bacteria cells were lysed by repeated freeze-thaw
cycles with liquid nitrogen. The cell suspension was then briefly sonicated to ensure
complete lysis of the bacterial cells. The cell debris was collected by centrifuging at
maximum speed for 40 min at 4ºC. The supernatant was collected and filtered through a
0.45 µm membrane to remove cell debris. The pellet was dissolved in lysis buffer
containing 8 M urea. Twenty-µl from the supernatant fraction and the dissolved pellet
fraction was then analysed by SDS-PAGE and Western blot to confirm in which fraction
is the protein compartmentalised.
The supernatant containing the recombinant protein was used for purification. The
supernatant was incubated with 500 µl of 50 % Ni-NTA resin, which was equilibrated
beforehand with lysis buffer (20 mM Phosphate buffer, 0.5 M NaCl and 10 mM
imidazole), for 1 h at 4ºC. Following the 1 h incubation, the Ni-NTA resin was loaded
into a column and washed with 30 ml of lysis buffer. The protein was eluted in a stepwise
Methods 44
increase of imidazole concentration (100, 300 and 500 mM imidazole) in 1 ml fractions.
The protein was stored at 4ºC for immediate use. The resin was washed with water,
followed by 5 ml of 0.5 M NaOH, 10 ml of water and stored in 1 ml of water at 4ºC. The
recombinant protein is unstable and has a tendency to precipitate after having undergone
freeze-thawing. Therefore, proteins were purified and stored at 4ºC for a maximum
period of 2 weeks or used immediately. All protein fractions obtained during the
purification procedure, including the flow-through and wash, were analyzed by SDS-
PAGE and Western blot.
3.3 Immunological methods
3.3.1 Western blot
Four pieces of Whatmann 3MM paper and one piece of nitrocellulose membrane was cut
to the exact size of the SDS-polyacrylamide gel. The filter papers and the membrane were
pre-wet in transfer buffer. Two of the Whatmann papers that have been soaked in transfer
buffer were placed onto the plastic cover. The sheets was stacked one on top of the other
so that they are exactly aligned. The membrane was placed on the stack of Whatmann
paper making sure that the filter is exactly aligned. A glass pipette was used to roll on the
stack of Whatmann papers and membrane to remove any trapped air bubbles. The gel was
transferred on top of the membrane. The final two sheets of Whatmann paper was placed
on the gel. Any trapped air bubbles were squeezed out using a glass pipette. The protein
was wet blotted at 400 mA for 1 h, taking care that the orientation of the sandwich within
the chamber is correct. The membrane was removed from the chamber and incubated
briefly with a Ponceau-S stain to visualize the protein bands. Relevant protein bands were
Methods 45
marked on the membrane before transferring to the blocking buffer (3 % milk in TBS).
After 1 h of blocking, the membrane was incubated with the specific primary antibody for
1 h at RT or overnight at 4°C. This was followed with an appropriate secondary antibody
for 1 h at RT. The membrane was washed extensively with TBS containing 0.1 % Tween-
20 after antibody incubation. The western blot was detected with NBT/BCIP solution.
The substrate reaction proceeded for 2-30 min with AP developing mixture. The
membrane was washed briefly in water and dried.
Alternatively, detection was performed using chemiluminescence reagents, such
as the ECL system. The immunoblot was probed with an appropriate secondary that is
conjugated with a peroxidase enzyme. The washed blot was placed protein-side up on a
clean plastic sheet on a flat surface. The ECL substrate was prepared as instructed by the
product manual. The substrate was applied at 100 µl/cm2 of membrane so that the blot is
completely covered and incubated at RT for 1 min. The blot was carefully removed and
excess reagents removed by blotting. The blot was sealed in Saran wrap. At this point the
blot should be kept in the dark before imaging. The chemifluorescence signal intensity
typically increases exponentially during the first 30 min of incubation and then begins to
plateau. The blot was exposed to film for the desired time (typically between 30 sec to 20
min depending on the antibody). The membrane was washed several times in TBS-Tween
and stored at 4°C if the membrane is stripped within the next day or two.
3.3.2 Stripping membrane of bound antibodies
The immunoblot can be stripped of antibody complexes and re-probed for up to five
times if using the ECL system. The blot was incubated in 10 ml of stripping solution (0.2
Methods 46
M Glycine-HCl, pH 2.5, 0.05 % Tween-20 and 100 mM DTT) at 60°C for 60 min in a
sealed plastic container in a shaking water bath. The stripping procedure was performed
twice to ensure a cleaner strip. The blot was rinsed with TBS-Tween and blocked before
re-probing with antibody. Alternatively, the blot can be stored at 4°C for 1 week.
3.3.3 Enzyme-linked immunosorbent assay (ELISA)
ELISA was used to analyse human responses to the various purified recombinant proteins.
Plates were coated with 100 µl of 0.5 µg/ml of antigen in coating buffer overnight at 4ºC.
The wells were then blocked with 100 µl of blocking buffer (3 % milk in PBS). Wells
were then incubated with 100 µl of human serum (1:200), followed by HRP-conjugated
anti-human IgG (1:15000). The wells were washed extensively in washing buffer (PBS
containing 0.5 % Tween-20) after the antibody incubations. The wells were incubated in
the developing solutions for approximately 10 min and the reaction stopped by adding
100 µl of phosphoric acid. The optical density (OD) of each well was measured in a
spectrophotometer at 450 nm. The OD was obtained by subtracting the average OD of
duplicate wells from the control well. Values were converted into arbitrary units (AU) as
follows:
Antibody responders were those having an AU value greater than two standard deviations
above the mean AU of the negative control (non-exposed European) samples.
)()()()(*100 ODnegLnODposLn
ODnegLnODtestLnAU −−= ;
Whereby, neg is negative serum control, pos is positive serum control and test is the test serum.
Methods 47
3.3.4 Animal immunization
3.3.4.1 Mouse
Serum from non-immunized BALB mice was first tested by Western blot for reactivity
against parasitic and human erythrocytic antigens prior to immunization. Non-reactive
BALB mouse was injected subcutaneously with 150 µl of purified recombinant protein
(30 µg) emulsified in an equal volume of Freund’s complete adjuvant. A second injection
was performed with 750 µl of purified recombinant protein (33 µg) emulsified in an
equal volume of Freund’s incomplete adjuvant two weeks later. After another two-week
interval venous blood was collected from the tail and tested in immunoblot against the
recombinant protein for the presence of specific antibodies in the antiserum. A third
booster was performed similarly to the second injection and blood was collected at the
end of two weeks post-injection. Blood was collected by cardiac puncture into a sterile
microfuge tube and left to stand for 30 min at RT. Serum was collected by centrifuging
the clotted blood for 15 min at high speed and stored at -20ºC in aliquots.
3.3.4.2 Chicken
One hundred µg of recombinant 732 DBL-3γ protein in 300 µl of phosphate buffer
suspended with Freund’s complete adjuvant was used for immunization. Each chicken
was given 2 further boosts with the same amount of protein. After six weeks after the
initial immunization, the polyclonal immunoglobulin (Ig) Y antibody can be detected in
the egg yolk of the eggs. IgY antibody was purified from the egg yolk by polyethylene
Methods 48
glycol precipitation. Specificity of antibodies was tested by immunoblot using goat anti-
chicken IgY antibodies (diluted 1:15000) (Sigma).
3.3.4.3 Immunoglobulin G (IgG) purification
One-ml of animal antiserum was centrifuged at 3000 g for 30 min to remove large protein
aggregates that will precipitate at low ammonium sulfate concentration. The supernatant
was transferred to a small clean glass beaker and gently stirred. 0.5 ml of saturated
ammonium sulfate (761 g in 1 L of distilled water) was added slowly drop-wise into the
beaker over a span of 30 min. The ammonium sulfate must be added slowly and in small
volumes while constantly stirring the supernatant to prevent changes in the local
ammonium sulfate concentration in the suspension. The suspension was stirred
continuously overnight at 4ºC. On the next day, the suspension was centrifuged to
precipitate the proteins. The supernatant was transferred to another fresh beaker and
another 0.5 ml of ammonium sulfate was added drop-wise slowly and stirred for an
additional 6 h at 4°C. The suspension was then centrifuged and the supernatant carefully
discarded. The precipitated protein, which contains the IgG, was carefully dissolved in
0.3 ml of 5 mM NaPO4 buffer and transferred into a clean dialysis tubing. The
ammonium sulfate-purified antibodies were dialyzed against three changes of 5 mM
NaPO4 buffer. The dialysed IgG suspension was then purified by DEAE-cellulose affinity
chromatography.
The DEAE-cellulose matrix (Amersham Pharmacia, Sweden) was washed
extensively prior to use as instructed by the product manual. The matrix was then
equilibrated with 20 volumes of 5 mM NaPO4 buffer (pH 6.5). The matrix was washed
until the pH is 6.5. The dialyzed antibodies were combined with the washed DEAE-
Methods 49
matrix. The slurry was agitated for 1 h at RT. For most DEAE matrix, 2 ml of wet matrix
will bind the proteins found in 1 ml of serum. The slurry was gently centrifuged and the
antibodies-containing supernatant carefully collected. The concentration and purity of the
antibodies were analysed by SDS-PAGE. The antibodies will yield polypeptides of
approximately 25 and 55 kD. The pure antibodies were stored at 4ºC as working stock or
at -20 ºC in 20 % glycerol for long term storage. The DEAE-matrix was regenerated by
sequential washes with 0.5 M HCl and 0.5 NaOH.
3.3.4.4 Immunoglobulin Y (IgY) purification
The egg yolk was separated from the egg white. The cords were cut with a sharp scalpel
without damaging the egg yolk sac. The egg yolk was rinsed with water to remove traces
of egg white. The yolk sac was sniped and the yolk drained into a clean measuring
cylinder. The volume of the egg yolk was estimated (V). The yolk was mixed with equal
volumes (V) of KPO4 buffer and then transferred into a 50 ml Falcon tube. Double
volumes (2V) of KPO4/7 % PEG 6000 was added into the suspension and mixed for 30
min at 4ºC. The suspension was centrifuged at 10000 rpm for 10 min 4ºC in a Beckmann
JA 12 centrifuge. The pellet was discarded. The supernatant was carefully filtered
through double layered gauze and funnelled into a fresh 50 ml Falcon tube. Following
this, 10 % w/v PEG 6000 powder was dissolved in the solution to give a final PEG
concentration of 12 %. The solution was centrifuged and the supernatant discarded. The
pellet was resuspended in 10 ml of KPO4 buffer and mixed for 30 min at 4ºC. Ten-ml of
KPO4/24 % PEG 6000 buffer was added into the solution thus giving a PEG final
concentration of 12 %. The suspension was centrifuged. The pellet containing the IgY
was washed with 5 ml of KPO4 buffer. The suspension was centrifuged at 12000 rpm for
Methods 50
30 – 60 min at 4ºC. The supernatant was carefully transferred into 1 ml aliquots and
stored at -20ºC with 0.02 % Na-azide.
3.4 Imaging techniques
3.4.1 Light microscopy
3.4.1.1 Binding of antibodies to IE cell surface
Late stages of CSA-binding and the isogenic non-CSA-binding strains were enriched and
tested in parallel. Nuclear DNA staining was visualized by incubating with DAPI (4
µg/ml) at RT for 30 min. IE were stained with specific primary antibodies (1:100) and
counterstained with a appropriate secondary antibody conjugated to Alexa Fluor 488 or
594 (6 µg/ml). Each incubation was performed for 30 min at 4°C. In control experiments,
IE were treated with 0.1 mg/ml trypsin at 37°C for 10 min prior to staining. Cells were
resuspended with 10 µl of 2 % FCS-PBS and observed under 40x magnification.
3.4.1.2 Binding of recombinant proteins to CHO cells
CHO cells were seeded on coverslips at a cell density of 3x10⁵ cells/ml. The cells were
fixed with 2 % paraformaldehyde (PFA) in PBS for 30 min at RT, washed and blocked
with 3 % BSA in PBS (BSA-PBS) for 30 min at RT. Cells were incubated with 0.5 µM of
recombinant protein in BSA-PBS for 40 min at RT. Protein binding was detected using a
specific primary antibody (1:500 in BSA-PBS), followed by a secondary antibody
conjugated to Alexa-Fluor 594 or Alexa-Fluor 488 (1:1000), each incubated for 30 min at
4°C. Cell nuclei were visualized by DAPI (5 µg/ml). The cells were mounted in
Methods 51
MOWIOL and observed under 20x magnification. To demonstrate the specificity of the
binding of the recombinant protein to the CHO cells expressing CSA, soluble CSA, CSB
and CSC (100 µg/ml) were co-incubated with the protein on the cells.
3.4.2 Image processing
Adobe Photoshop, USA or Volocity, USA were used to process the images. The images
were further processed using Adobe Illustrator, USA.
3.5 Biochemical methods
3.5.1 SDS-Polyacrylamide gel electrophoresis (SDS-PAGE)
The glass plates, spacers and combs were assembled following the manufacturer’s
instructions. The appropriate volume of the components for the desired concentration of
acrylamide was prepared and mixed together by swirling. The acrylamide solution was
poured into the gap between the glass plates leaving sufficient space for the stacking gel
(the length of the teeth of the comb plus 0.5 cm). The acrylamide solution was overlaid
with a thin layer of isopropanol. The isopropanol was poured off and the gel rinsed with
water after polymerization was completed (approximately 30 minutes). The stacking gel
containing the appropriate amount of acrylamide was prepared and poured into the
surface of the separating gel. The combs were placed into the stacking gel and left to
polymerize (approximately 15 min). The gel can be kept at 4oC wrapped in a wet tissue
and Saran wrap. The gel was placed into the electrophoresis chamber and the chambers
filled with 1x running buffer. The combs were removed from the stacking gel and the
sample wells were washed with the running buffer by pipetting the buffer up and down
Methods 52
into the wells. The protein sample was dissolved in equal volume of 2x Laemmli sample
buffer, heated at 95oC for 5 minutes and the samples loaded into the bottom of the wells.
The chamber was connected to the power supply and a voltage of 60 V was applied until
the samples reach the separating gel. At this time, the voltage was increased to 120 V.
When the dye front reaches the bottom of the gel the power supply was turned off. The
glass plates were removed from the electrophoresis chamber.
The gel was fixed and stained with Coomassie staining solution for 1 h to
overnight. The gel was incubated successively in Coomassie destaining solution to
visualize the protein bands.
3.5.2 MALDI-tof peptide mass fingerprinting analysis
This technique was a service provided by the institute. In-gel digests were performed
using the In-Gel-Digest-Kit-ZP (Millipore, USA), following a modified protocol, but
using the solutions provided with the kit. Polyacrylamide gel plugs from Coomassie Blue
stained bands representing the candidate proteins were punched out of the gel, using a
cut-off, thin walled pipette tip and deposited in the wells of a ZIPplate, together with 100
µl of Solution 1. After 20 min, the ZIPplate was placed on a vacuum manifold, and the
Solution 1 was filtered through the bottom resin of the plate. A hundred µl of Solution 2
(destaining solution) was added and incubation at RT was continued for 20 min. Vaccum
was applied to remove the destaining solution, and the step was repeated. The destained
gel plugs were dehydrated with 200 µl each of acetonitrile at RT for 10 min. The
acetonitrile was removed by vacuum filtration, and 15 µl of Trypsin solution (30 µg/ml in
40 mM NH4HCO3, 5% acetonitrile) were added to the dehydrated gel plugs. The ZIPplate,
Methods 53
with lid and collection plate were placed inside a sealed plastic bag and incubated at 37°C
for 4 h.
Eight-µl of acetonitrile was added and incubation at 37°C was continued for 15
min. After addition of 130 µl of Solution 6 (extraction/wash solution) and 30 min
incubation at RT, the extract was filtered through the C18 resin at the bottom of the wells
by applying a gentle vacuum. The bound peptides were then washed with another 100 µl
of Solution 6. The wells were emptied completely using full vacuum. Eight-µl of
Solution 7 (Elution) was added to each well, and the ZIPplate was placed on the
collection plate. Extraction was performed by centrifugation of the plate assembly at
2000 rpm for 30 sec. Four-µl of the eluate was then spotted onto an AnchorPlate600 mass
spectrometry target. The dried spots were then overlaid with 1.5 µl of matrix solution, i.e.
saturated (RT) alpha-cyano-4-hydroxy-cinnamic acid in 50% acetonitrile, 0.1 % trifluor
acetic acid with 0.2 pM each of angiotensin II, angiotensin I, and ACTH clip 1-17.
Mass spectra were recorded on a Bruker Autoflex MALDI-TOF unit, using the
internal peptide standards for calibration. Peptide masses were then compared with
theoretical trypsin digest products of the expressed recombinant proteins, obtained with
the MS-Digest algorithm (http://prospector.ucsf.edu/ucsfhtml4.0/msdigest.htm).
3.5.3 In vitro static binding assays of IE
3.5.3.1 Binding assays using immobilized receptors
Circles were drawn at the back of Petri dish to indicate where the receptors will be
immobilized. Circles should be large enough to accommodate 10 µl of parasite
suspension. Six-µl of CSA (100 µg/ml), HA (100 µg/ml) or BSA (5 % BSA in PBS, as
Methods 54
control) was dropped on the interior surface of the Petri dish at sites designated by the
marked circles. The CSA, HA and BSA were allowed to adsorb to the surface of the dish
for 1 h at RT. The dishes were covered with wet paper towels to avoid evaporation. The
receptor solution was removed by suction through a yellow tip and the whole Petri dish
was blocked with 3 ml of 2 % BSA in PBS for 2 hours at RT. The blocking solution was
removed and 3 ml of parasite culture (2 % parasitaemia and 5 % haematocrit) was added
to the dish. The dish was incubated for 1 h at 37°C with gentle shaking every 15 min to
resuspend the culture. After the incubation time, the dish was washed 3-5 times with PBS
to remove unbound infected erythrocytes. The PBS solution was gently added into the
dish at the edge of the dish to prevent dislodging of bound IE. After addition of PBS the
plate was swirled gently to wash unbound IE. The PBS was collected by suction at the
side of the dish. Care was taken to prevent the dish from drying in between washes.
Bound cells were fixed with 0.5 % glutardialdehyde for 10 min and stained with 1 %
Giemsa solution for 15 min. The dish was washed repeatedly with water and allowed to
dry. IE were counted under 40x magnification with an inverted microscope (Leitz,
Germany). 10 randomly selected fields were counted to give the total number of bound
IE/mm2, from which the background number of IE bound to BSA-coated control spots
was subtracted.
3.5.3.1.1 Co-incubation with polyclonal antibody or human plasma
CSA was immobilized on plates as described before (see Section 3.1.2.3). Inhibitory
activities of polyclonal antibody or human serum (both diluted at 1:100 in the parasite
suspension) were determined by pre-incubating IE (5 % haematocrit, 2% parasitaemia)
for 1 h at 37°C with antibody prior to addition in prepared dish. BSA (5 %) and CSC
Methods 55
(100 µg/ml in PBS) served as controls. The pre-treated parasite culture was then added
into the prepared dish and the assay proceeded for 1 h at 37°C. Bound IE were counted
under 40x magnification in 10 randomly selected fields to give the total number of bound
IE/mm2, from which the background number of IE bound to BSA-coated control spots
was subtracted. Adhesion results were presented as a percentage of bound IE/mm2 in the
test sample (with CSC or antibody) to bound IE/mm2 in the control sample (without CSC
or antibody).
3.5.3.1.2 Co-incubation with recombinant proteins
To investigate the inhibitory activities of recombinant protein, the assay was slightly
modified as described earlier. Six µl of CSA (100 µg/ml) and BSA (5 % BSA in PBS)
were dropped to the interior surface of the Petri dish within the 1 cm circles drawn by a
DakoCytomation pen. The CSA and BSA were adsorbed to the surface for 1 h at RT. The
solution were aspirated and blocked with BSA. In the meanwhile, IE were enriched and
resuspended to 3x10⁸ IE/ml. One hundred-µl of IE was mixed with the recombinant
protein at various concentrations (1-20 µM final concentration) before overlaying on the
CSA within the circles. The protein Rifin that has no known role in CSA binding was
incorporated in the assay as a negative control. Ten randomly selected fields were
counted to give the total number of bound IE/mm2, from which the background number
of IE bound to BSA-coated control spots was subtracted. Inhibition results are presented
as the difference of bound IE/mm2 in the test sample (with recombinant protein) to bound
IE/mm2 in the control sample (without recombinant protein) in percentage
Methods 56
3.5.3.2 Binding assays using CHO cell lines
CHO cells were grown in 6-well plates as described in Sect. 3.1.2.3. Late-stage IE were
enriched and resuspended to 3x10⁸ IE/ml. The IE suspension was incubated with the
CHO cells for 1 h at RT. The culture plate was gently shaken every 15 min to resuspend
the IE. The wells were washed gently for three times with binding medium to remove
unbound IE. Binding of IE to CHO cells were observed with an inverted microscope. The
number of IE bound to 300 CHO cells were counted under 40x magnification. IE binding
was expressed as the number of IE bound to 100 CHO cells.
3.5.3.2.1 Co-incubation with recombinant proteins
CHO cells were grown in 6-well plates as described previously. IE were enriched and
resuspended to 3x10⁸ IE/ml. The IE was mixed with the recombinant proteins at various
concentrations to a final volume of 100 µl. 2.5 – 250 nM recombinant DBL-γ protein
concentration and 20 – 2000 nM 732 recombinant domains was used in this assay. The
IE-protein suspension was then overlaid on the CHO cells. The binding assay then
proceeds as described above.
3.6 Statistical analysis
Differences between groups were tested by the Student unpaired t-test. Correlations were
examined by the Pearson test. A multiple linear regression model that included parity was
used to assess the relationship between placental parasite density (after log transformation)
and antibody levels. The significance limit (P) was set at 0.05. Statistical analysis was
performed using JMP 5 program.
Methods 57
3.7 Supplementary data
3.7.1 Amino acid alignment
The amino acid alignments were performed at http://www.ncbi.nlm.nih.gov/blast/bl2seq
/wblast2.cgi. Multiple sequence alignments were performed by Clustal W at
http://align.genome.jp.
3.7.2 Protein secondary structure prediction
Protein secondary structures were predicted by Predator at
http://bioweb.pasteur.fr/seqanal/interfaces/predator-simple.html
4. Results 58
4. Results
4.1 Establishment of protocols
4.1.1 Mammalian Chinese Hamster Ovary cells
The commercially available wild-type Chinese hamster ovary (CHO) cell line, from
which the CHO-K1 cell line is derived, is one of the most common mammalian cell lines
kept in culture. These cells have a smooth surface and grow in a “fibroblast-like” fashion,
in elongated structures that tend to align in parallel fashion to form colonies with rough
edges (Figure 7 first row first column). CHO-K1 cells readily express glycosaminoglycan
(GAG) molecules, in particular chondroitin sulfate A (CSA) on their surface. CHO-CD36
and CHO-ICAM-1 cells are stable cell lines derived from a mutant CHO cell line, CHO-
745, which is devoid of surface GAG. As shown in Figure 7 (first row second and third
column) they grow in a manner similar to CHO-K1.
Surface expression of CSA, CD36 and intercellular adhesion molecule -1 (ICAM-
1) receptors on the three CHO cell lines were controlled by indirect immunofluorescence
assays (IFA) in the presence of commercially available antibodies raised against the
corresponding surface receptors (Figure 7 second row). The expression of CSA receptors
were observed only on CHO-K1 cells and not on CHO-CD36 or CHO-ICAM-1 cells
(Figure 7 second row first column). CHO-CD36 expresses only CD36 receptors but not
CSA or ICAM-1 (Figure 7 second row second column). Similarly, CHO-ICAM-1
expresses only ICAM-1 receptors (Figure 7 second row third column).
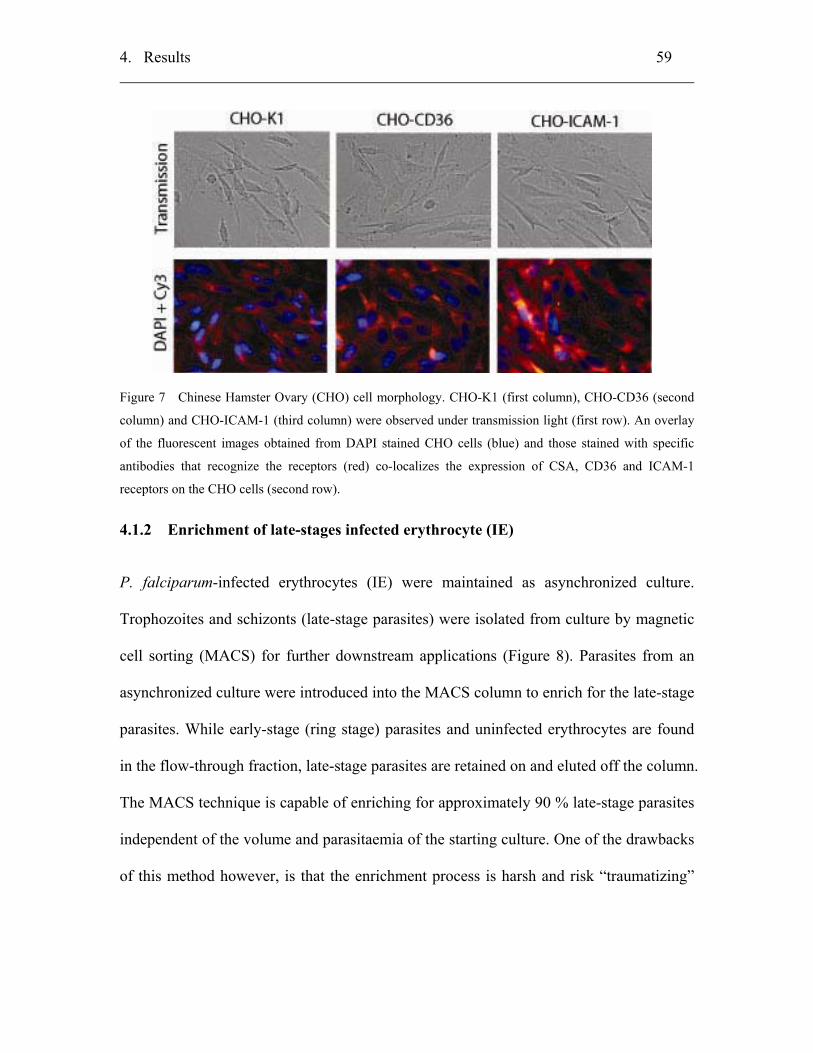
4. Results 59
Figure 7 Chinese Hamster Ovary (CHO) cell morphology. CHO-K1 (first column), CHO-CD36 (second
column) and CHO-ICAM-1 (third column) were observed under transmission light (first row). An overlay
of the fluorescent images obtained from DAPI stained CHO cells (blue) and those stained with specific
antibodies that recognize the receptors (red) co-localizes the expression of CSA, CD36 and ICAM-1
receptors on the CHO cells (second row).
4.1.2 Enrichment of late-stages infected erythrocyte (IE)
P. falciparum-infected erythrocytes (IE) were maintained as asynchronized culture.
Trophozoites and schizonts (late-stage parasites) were isolated from culture by magnetic
cell sorting (MACS) for further downstream applications (Figure 8). Parasites from an
asynchronized culture were introduced into the MACS column to enrich for the late-stage
parasites. While early-stage (ring stage) parasites and uninfected erythrocytes are found
in the flow-through fraction, late-stage parasites are retained on and eluted off the column.
The MACS technique is capable of enriching for approximately 90 % late-stage parasites
independent of the volume and parasitaemia of the starting culture. One of the drawbacks
of this method however, is that the enrichment process is harsh and risk “traumatizing”
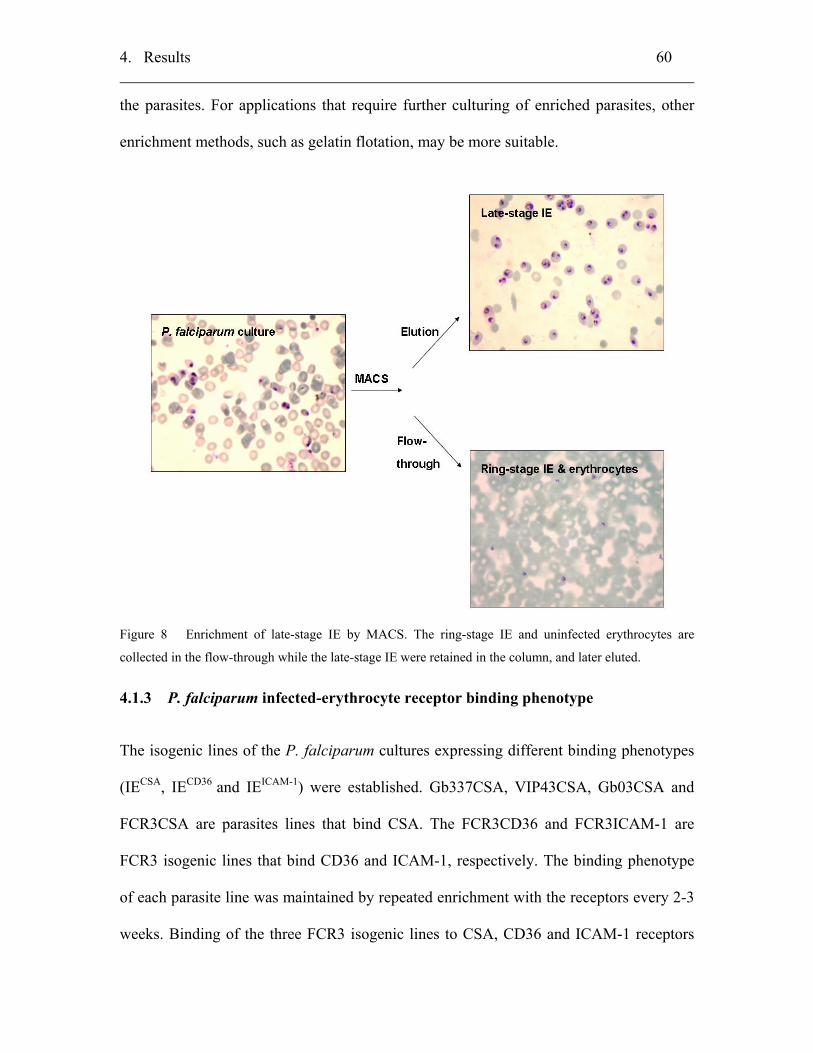
4. Results 60
the parasites. For applications that require further culturing of enriched parasites, other
enrichment methods, such as gelatin flotation, may be more suitable.
Figure 8 Enrichment of late-stage IE by MACS. The ring-stage IE and uninfected erythrocytes are
collected in the flow-through while the late-stage IE were retained in the column, and later eluted.
4.1.3 P. falciparum infected-erythrocyte receptor binding phenotype
The isogenic lines of the P. falciparum cultures expressing different binding phenotypes
(IECSA, IECD36 and IEICAM-1) were established. Gb337CSA, VIP43CSA, Gb03CSA and
FCR3CSA are parasites lines that bind CSA. The FCR3CD36 and FCR3ICAM-1 are
FCR3 isogenic lines that bind CD36 and ICAM-1, respectively. The binding phenotype
of each parasite line was maintained by repeated enrichment with the receptors every 2-3
weeks. Binding of the three FCR3 isogenic lines to CSA, CD36 and ICAM-1 receptors
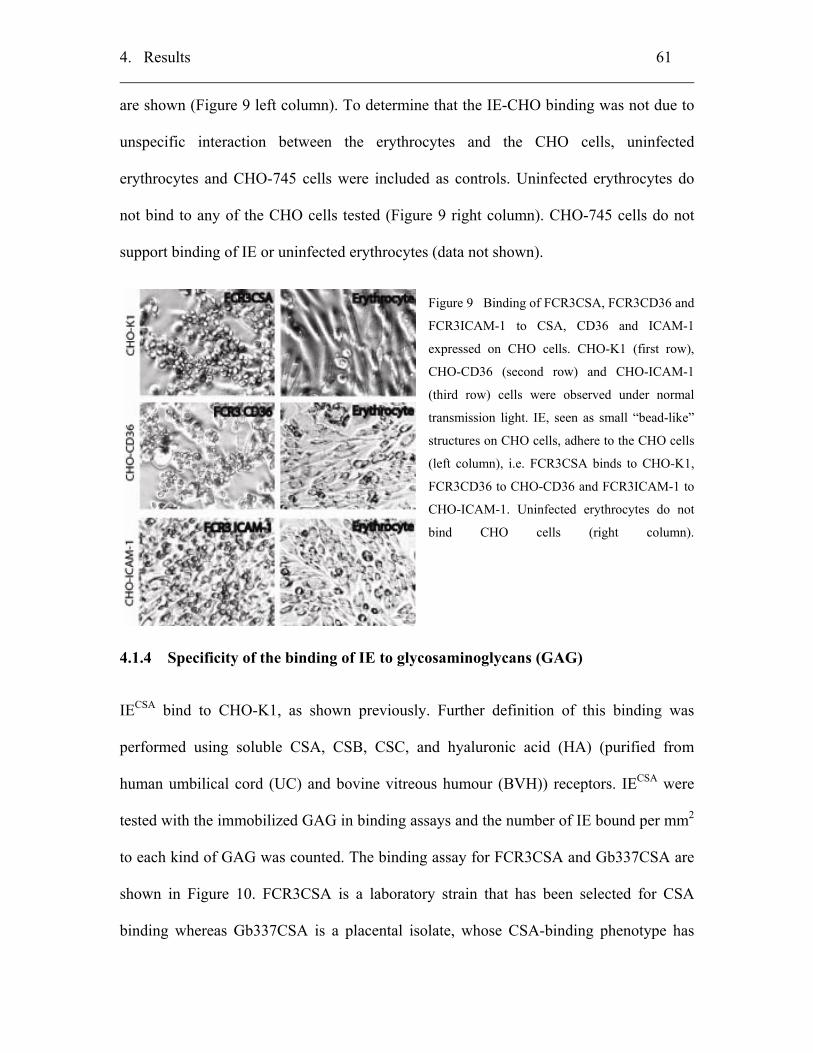
4. Results 61
are shown (Figure 9 left column). To determine that the IE-CHO binding was not due to
unspecific interaction between the erythrocytes and the CHO cells, uninfected
erythrocytes and CHO-745 cells were included as controls. Uninfected erythrocytes do
not bind to any of the CHO cells tested (Figure 9 right column). CHO-745 cells do not
support binding of IE or uninfected erythrocytes (data not shown).
Figure 9 Binding of FCR3CSA, FCR3CD36 and
FCR3ICAM-1 to CSA, CD36 and ICAM-1
expressed on CHO cells. CHO-K1 (first row),
CHO-CD36 (second row) and CHO-ICAM-1
(third row) cells were observed under normal
transmission light. IE, seen as small “bead-like”
structures on CHO cells, adhere to the CHO cells
(left column), i.e. FCR3CSA binds to CHO-K1,
FCR3CD36 to CHO-CD36 and FCR3ICAM-1 to
CHO-ICAM-1. Uninfected erythrocytes do not
bind CHO cells (right column).
4.1.4 Specificity of the binding of IE to glycosaminoglycans (GAG)
IECSA bind to CHO-K1, as shown previously. Further definition of this binding was
performed using soluble CSA, CSB, CSC, and hyaluronic acid (HA) (purified from
human umbilical cord (UC) and bovine vitreous humour (BVH)) receptors. IECSA were
tested with the immobilized GAG in binding assays and the number of IE bound per mm2
to each kind of GAG was counted. The binding assay for FCR3CSA and Gb337CSA are
shown in Figure 10. FCR3CSA is a laboratory strain that has been selected for CSA
binding whereas Gb337CSA is a placental isolate, whose CSA-binding phenotype has
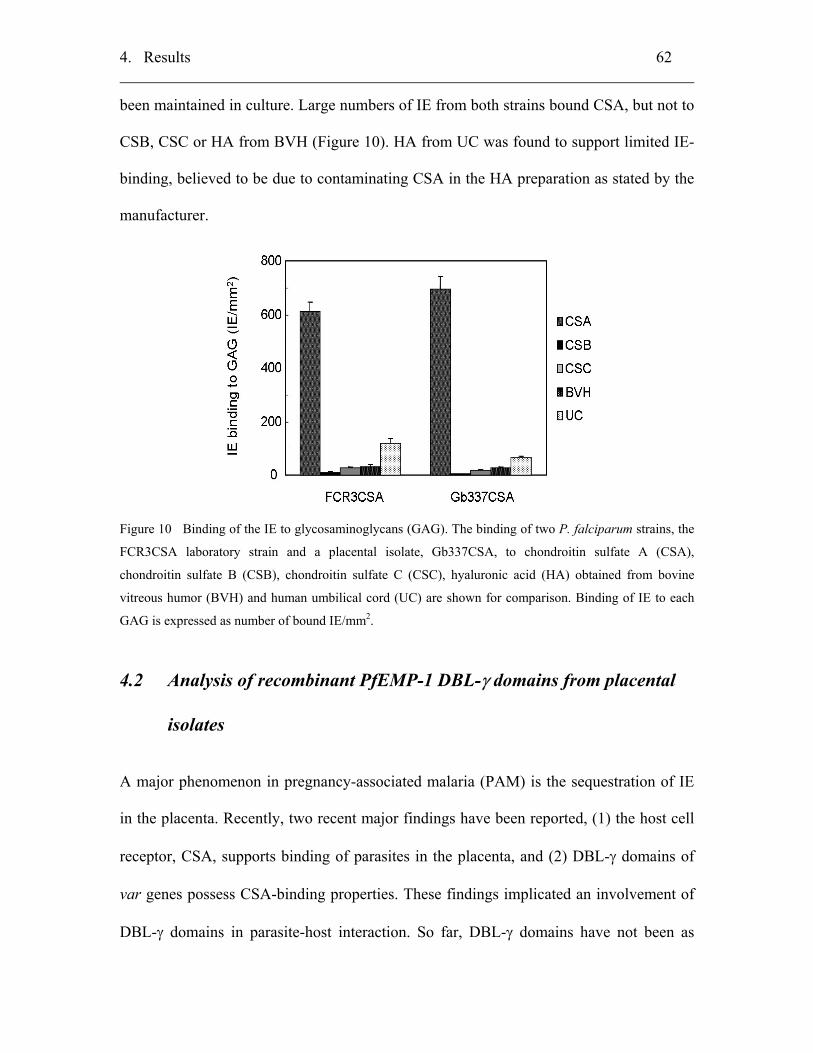
4. Results 62
been maintained in culture. Large numbers of IE from both strains bound CSA, but not to
CSB, CSC or HA from BVH (Figure 10). HA from UC was found to support limited IE-
binding, believed to be due to contaminating CSA in the HA preparation as stated by the
manufacturer.
Figure 10 Binding of the IE to glycosaminoglycans (GAG). The binding of two P. falciparum strains, the
FCR3CSA laboratory strain and a placental isolate, Gb337CSA, to chondroitin sulfate A (CSA),
chondroitin sulfate B (CSB), chondroitin sulfate C (CSC), hyaluronic acid (HA) obtained from bovine
vitreous humor (BVH) and human umbilical cord (UC) are shown for comparison. Binding of IE to each
GAG is expressed as number of bound IE/mm2.
4.2 Analysis of recombinant PfEMP-1 DBL-γ domains from placental
isolates
A major phenomenon in pregnancy-associated malaria (PAM) is the sequestration of IE
in the placenta. Recently, two recent major findings have been reported, (1) the host cell
receptor, CSA, supports binding of parasites in the placenta, and (2) DBL-γ domains of
var genes possess CSA-binding properties. These findings implicated an involvement of
DBL-γ domains in parasite-host interaction. So far, DBL-γ domains have not been as
4. Results 63
extensively characterized as the DBL-1α and CIDR-1α domains, which together form the
“head structure” of PfEMP-1 and represent the most conserved region in PfEMP-1
molecules compared to the other DBL domains.
A group of DBL-γ domains, cloned from expressed var genes of placental isolates
482, 498, 701 and 732, have been identified in earlier works and collectively termed
varPAM domains. In this study, the biochemical properties of these DBL-γ domains were
characterized and their immunogenicities evaluated. The 3D7chr5 DBL-5γ (subsequently
called the 3D7chr5 DBL-γ) and the Gb23aDBL-1α served as DBL domain controls in
this study. The 3D7chr5 DBL-γ was cloned from a var gene on chromosome 5 of the
3D7 laboratory strain whereas Gb23aDBL-1α was from a field isolate of a Gabonese
child with mild malaria.
4.2.1 Cloning, expression and purification of recombinant proteins
Six recombinant domains, 482, 498, 701, 732 and 3D7chr5 DBL-γ and Gb23aDBL-1α
domains were expressed in this work. The 482, 498 and 701 DBL-γ domains were
available in the expression vector, pTrcHis2, in the laboratory and could be used directly
for recombinant protein expression. The 732 DBL-3γ, 3D7chr5 DBL-γ and Gb23a DBL-
1α had to be first cloned into expression vectors. All DBL domains were expressed as
recombinant protein fused with a C-terminal 6xHis tag. The presence of 6xHis tag
enables a direct one-step affinity purification of the recombinant protein. Furthermore,
the recombinant protein can be easily detected using specific anti-6xHis antibody in
Western blots and immunofluorescence assays (IFA). Specific primers covering the
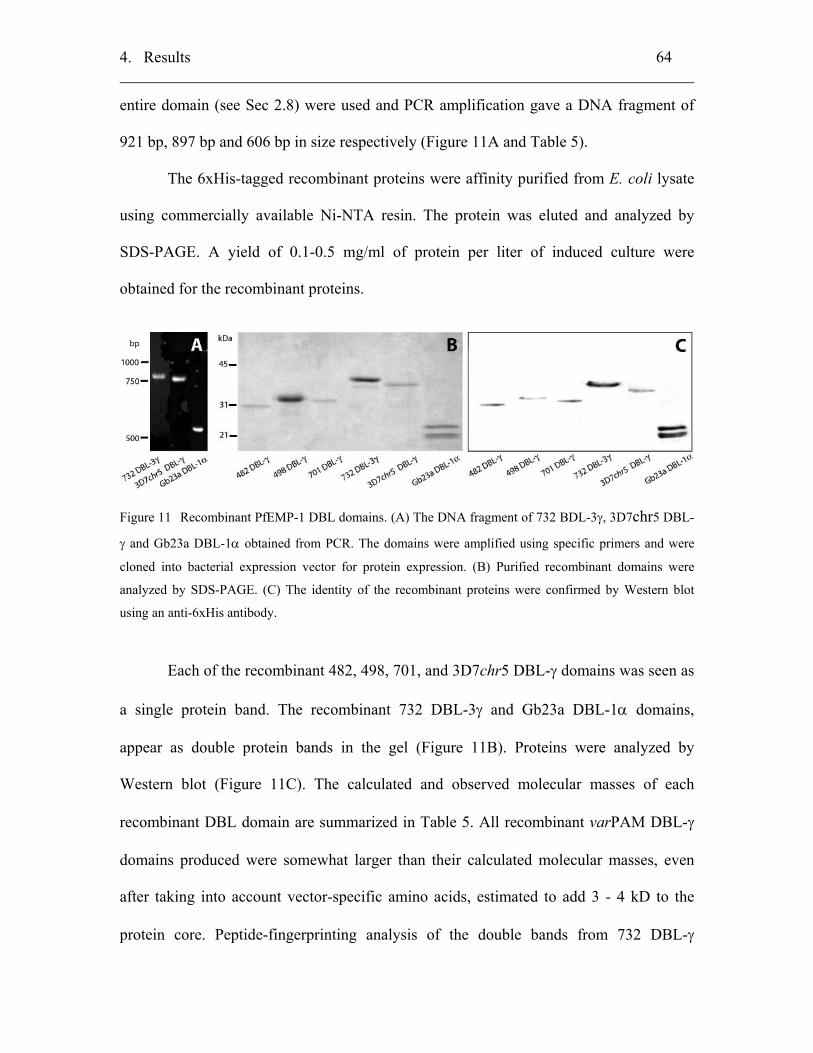
4. Results 64
entire domain (see Sec 2.8) were used and PCR amplification gave a DNA fragment of
921 bp, 897 bp and 606 bp in size respectively (Figure 11A and Table 5).
The 6xHis-tagged recombinant proteins were affinity purified from E. coli lysate
using commercially available Ni-NTA resin. The protein was eluted and analyzed by
SDS-PAGE. A yield of 0.1-0.5 mg/ml of protein per liter of induced culture were
obtained for the recombinant proteins.
Figure 11 Recombinant PfEMP-1 DBL domains. (A) The DNA fragment of 732 BDL-3γ, 3D7chr5 DBL-
γ and Gb23a DBL-1α obtained from PCR. The domains were amplified using specific primers and were
cloned into bacterial expression vector for protein expression. (B) Purified recombinant domains were
analyzed by SDS-PAGE. (C) The identity of the recombinant proteins were confirmed by Western blot
using an anti-6xHis antibody.
Each of the recombinant 482, 498, 701, and 3D7chr5 DBL-γ domains was seen as
a single protein band. The recombinant 732 DBL-3γ and Gb23a DBL-1α domains,
appear as double protein bands in the gel (Figure 11B). Proteins were analyzed by
Western blot (Figure 11C). The calculated and observed molecular masses of each
recombinant DBL domain are summarized in Table 5. All recombinant varPAM DBL-γ
domains produced were somewhat larger than their calculated molecular masses, even
after taking into account vector-specific amino acids, estimated to add 3 - 4 kD to the
protein core. Peptide-fingerprinting analysis of the double bands from 732 DBL-γ
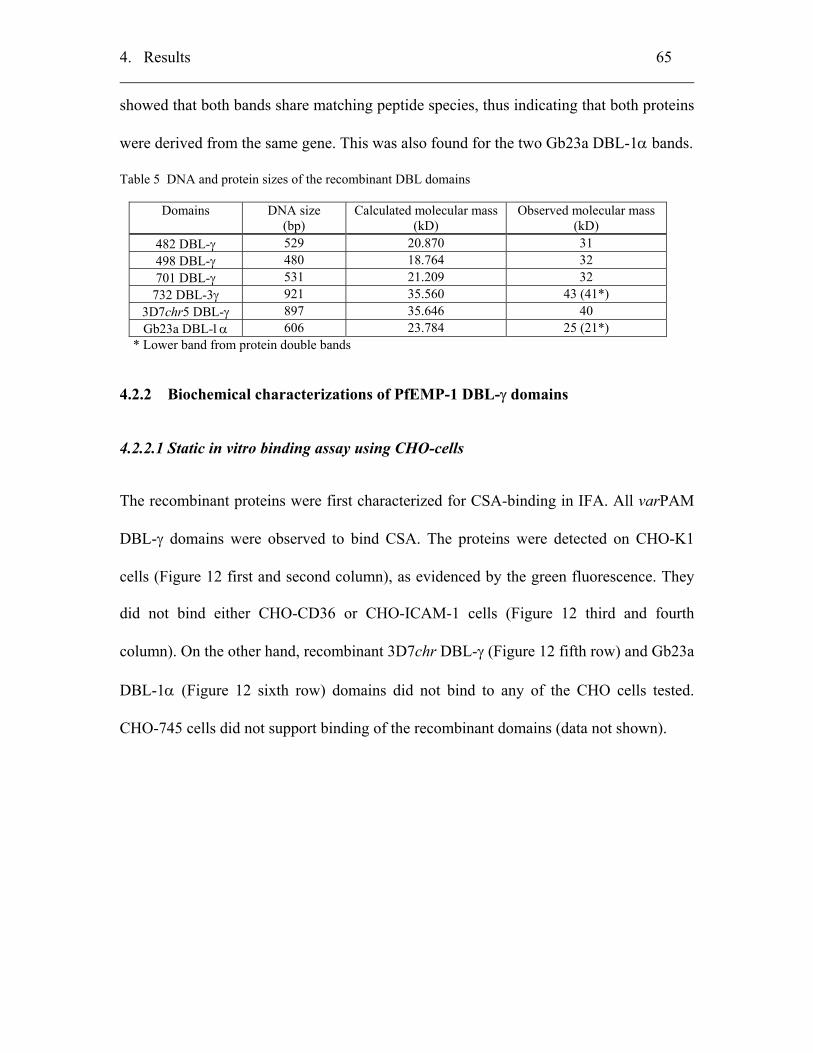
4. Results 65
showed that both bands share matching peptide species, thus indicating that both proteins
were derived from the same gene. This was also found for the two Gb23a DBL-1α bands.
Table 5 DNA and protein sizes of the recombinant DBL domains
Domains DNA size (bp)
Calculated molecular mass (kD)
Observed molecular mass (kD)
482 DBL-γ 529 20.870 31 498 DBL-γ 480 18.764 32 701 DBL-γ 531 21.209 32
732 DBL-3γ 921 35.560 43 (41*) 3D7chr5 DBL-γ 897 35.646 40 Gb23a DBL-1α 606 23.784 25 (21*)
* Lower band from protein double bands
4.2.2 Biochemical characterizations of PfEMP-1 DBL-γ domains
4.2.2.1 Static in vitro binding assay using CHO-cells
The recombinant proteins were first characterized for CSA-binding in IFA. All varPAM
DBL-γ domains were observed to bind CSA. The proteins were detected on CHO-K1
cells (Figure 12 first and second column), as evidenced by the green fluorescence. They
did not bind either CHO-CD36 or CHO-ICAM-1 cells (Figure 12 third and fourth
column). On the other hand, recombinant 3D7chr DBL-γ (Figure 12 fifth row) and Gb23a
DBL-1α (Figure 12 sixth row) domains did not bind to any of the CHO cells tested.
CHO-745 cells did not support binding of the recombinant domains (data not shown).
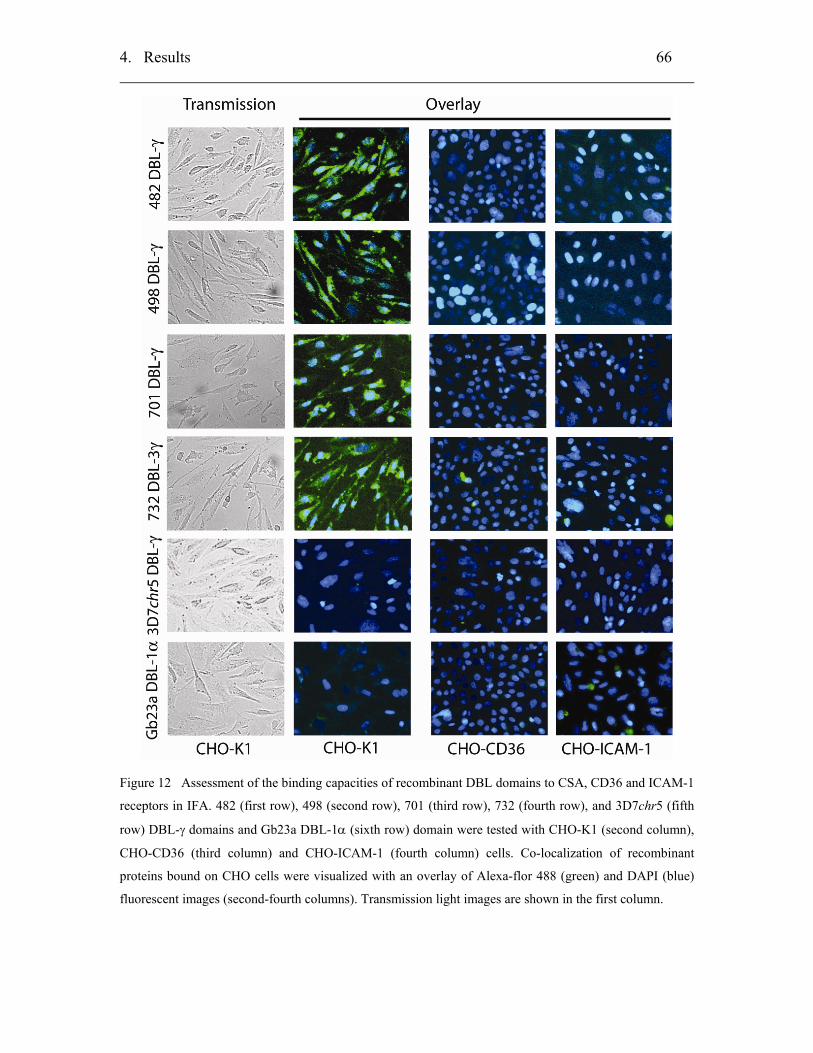
4. Results 66
Figure 12 Assessment of the binding capacities of recombinant DBL domains to CSA, CD36 and ICAM-1
receptors in IFA. 482 (first row), 498 (second row), 701 (third row), 732 (fourth row), and 3D7chr5 (fifth
row) DBL-γ domains and Gb23a DBL-1α (sixth row) domain were tested with CHO-K1 (second column),
CHO-CD36 (third column) and CHO-ICAM-1 (fourth column) cells. Co-localization of recombinant
proteins bound on CHO cells were visualized with an overlay of Alexa-flor 488 (green) and DAPI (blue)
fluorescent images (second-fourth columns). Transmission light images are shown in the first column.
4. Results 67
4.2.2.2 Competitive inhibition of IE-CSA binding to CHO-K1 cells
Recombinant proteins were further characterized in a static IE binding assay to see if they
can competitively inhibit the IE-CSA binding. To this end, CSA-receptor immobilized on
plastic Petri dishes was used. Recombinant DBL domains were incubated (at 10 nM) with
IE prior to the binding assay. A protein Rifin, which has no known relevant function in IE
binding, was included in the assay to rule out unspecific protein interactions. The results
of the binding assay for VIP43CSA are shown in Figure 13A. Similar results were
obtained for the other CSA-binding isolates. The DBL-γ domains were able to inhibit the
binding of VIP43CSA to CSA when compared to control (calculated as 100 %), where no
recombinant protein was included in the assay. The 732 DBL-3γ was able to reduce the
IE-CSA binding by 80 %, whereas 482 and 498 DBL-γ were able to inhibit up to 62 %
and 55 %, respectively. The 701 DBL-γ was only able to reduce IE binding by 40 %. As
expected, the 3D7chr5 DBL-γ did not bind CSA and did not inhibit IE-CSA binding.
Additionally, the proteins Gb23a DBL-1α and Rifin had no affect on IE-CSA binding.
Incubating the IECSA with increasing concentrations (2.5 – 250 nM) of varPAM
DBL-γ domains showed that 482, 498 and 732 DBL-γ competitively inhibited IE–binding
in a concentration-dependent manner (shown for FCR3CSA in Figure 13B). In contrast,
701 DBL-γ did not affect the IE-binding even at high concentrations. 3D7chr5 DBL-γ,
Gb23a DBL-1α and Rifin were not included in this assay because they have been shown
earlier that they neither bound CSA (see Figure 12) nor had an effect on IE-CSA binding
(see Figure 13A). At the highest 482, 498 and 732 DBL-γ concentration tested (250 nM);
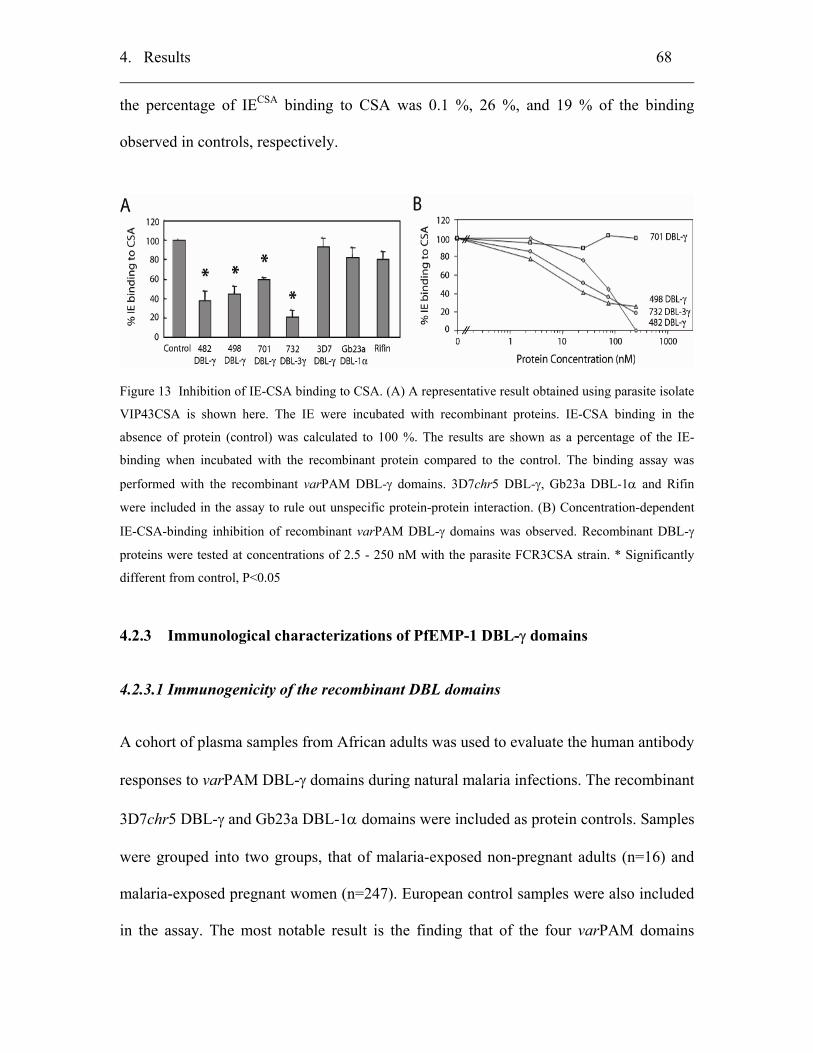
4. Results 68
the percentage of IECSA binding to CSA was 0.1 %, 26 %, and 19 % of the binding
observed in controls, respectively.
Figure 13 Inhibition of IE-CSA binding to CSA. (A) A representative result obtained using parasite isolate
VIP43CSA is shown here. The IE were incubated with recombinant proteins. IE-CSA binding in the
absence of protein (control) was calculated to 100 %. The results are shown as a percentage of the IE-
binding when incubated with the recombinant protein compared to the control. The binding assay was
performed with the recombinant varPAM DBL-γ domains. 3D7chr5 DBL-γ, Gb23a DBL-1α and Rifin
were included in the assay to rule out unspecific protein-protein interaction. (B) Concentration-dependent
IE-CSA-binding inhibition of recombinant varPAM DBL-γ domains was observed. Recombinant DBL-γ
proteins were tested at concentrations of 2.5 - 250 nM with the parasite FCR3CSA strain. * Significantly
different from control, P<0.05
4.2.3 Immunological characterizations of PfEMP-1 DBL-γ domains
4.2.3.1 Immunogenicity of the recombinant DBL domains
A cohort of plasma samples from African adults was used to evaluate the human antibody
responses to varPAM DBL-γ domains during natural malaria infections. The recombinant
3D7chr5 DBL-γ and Gb23a DBL-1α domains were included as protein controls. Samples
were grouped into two groups, that of malaria-exposed non-pregnant adults (n=16) and
malaria-exposed pregnant women (n=247). European control samples were also included
in the assay. The most notable result is the finding that of the four varPAM domains
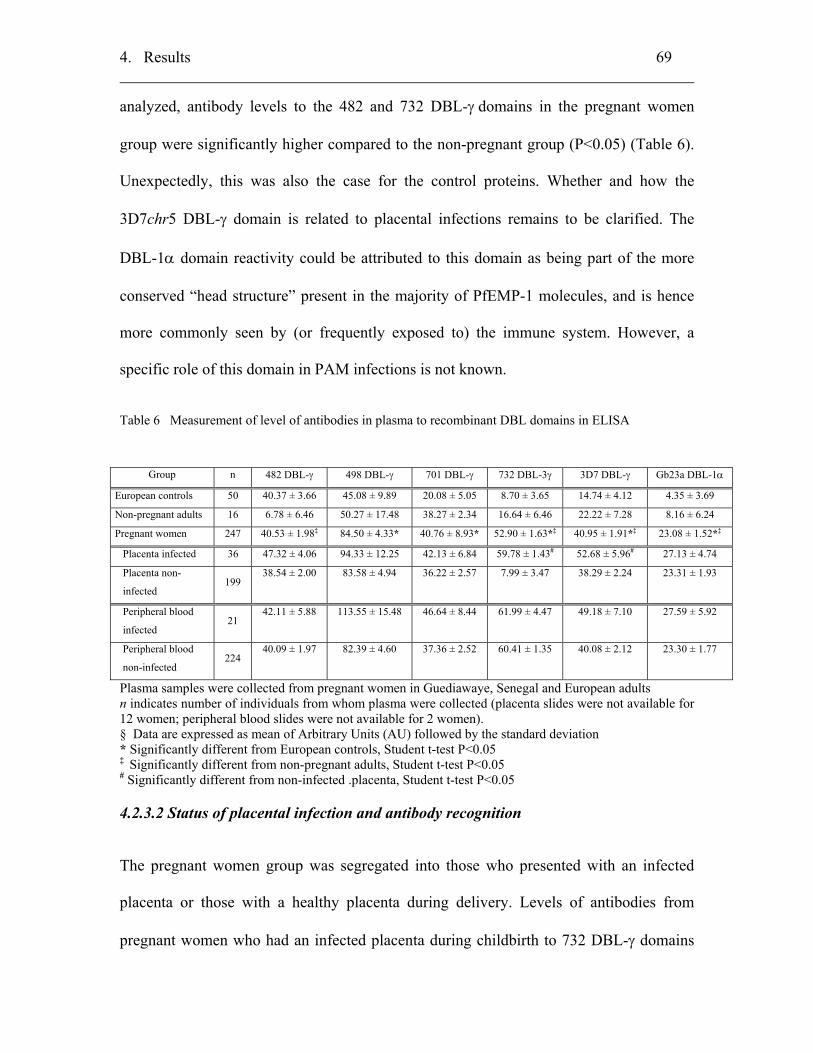
4. Results 69
analyzed, antibody levels to the 482 and 732 DBL-γ domains in the pregnant women
group were significantly higher compared to the non-pregnant group (P<0.05) (Table 6).
Unexpectedly, this was also the case for the control proteins. Whether and how the
3D7chr5 DBL-γ domain is related to placental infections remains to be clarified. The
DBL-1α domain reactivity could be attributed to this domain as being part of the more
conserved “head structure” present in the majority of PfEMP-1 molecules, and is hence
more commonly seen by (or frequently exposed to) the immune system. However, a
specific role of this domain in PAM infections is not known.
Table 6 Measurement of level of antibodies in plasma to recombinant DBL domains in ELISA
Group n 482 DBL-γ 498 DBL-γ 701 DBL-γ 732 DBL-3γ 3D7 DBL-γ Gb23a DBL-1α
European controls 50 40.37 ± 3.66 45.08 ± 9.89 20.08 ± 5.05 8.70 ± 3.65 14.74 ± 4.12 4.35 ± 3.69
Non-pregnant adults 16 6.78 ± 6.46 50.27 ± 17.48 38.27 ± 2.34 16.64 ± 6.46 22.22 ± 7.28 8.16 ± 6.24
Pregnant women 247 40.53 ± 1.98‡ 84.50 ± 4.33* 40.76 ± 8.93* 52.90 ± 1.63*‡ 40.95 ± 1.91*‡ 23.08 ± 1.52*‡
Placenta infected 36 47.32 ± 4.06 94.33 ± 12.25 42.13 ± 6.84 59.78 ± 1.43# 52.68 ± 5.96# 27.13 ± 4.74
Placenta non-
infected 199
38.54 ± 2.00 83.58 ± 4.94 36.22 ± 2.57 7.99 ± 3.47 38.29 ± 2.24 23.31 ± 1.93
Peripheral blood
infected 21
42.11 ± 5.88 113.55 ± 15.48 46.64 ± 8.44 61.99 ± 4.47 49.18 ± 7.10 27.59 ± 5.92
Peripheral blood
non-infected 224
40.09 ± 1.97 82.39 ± 4.60 37.36 ± 2.52 60.41 ± 1.35 40.08 ± 2.12 23.30 ± 1.77
Plasma samples were collected from pregnant women in Guediawaye, Senegal and European adults n indicates number of individuals from whom plasma were collected (placenta slides were not available for 12 women; peripheral blood slides were not available for 2 women). § Data are expressed as mean of Arbitrary Units (AU) followed by the standard deviation * Significantly different from European controls, Student t-test P<0.05 ‡ Significantly different from non-pregnant adults, Student t-test P<0.05 # Significantly different from non-infected .placenta, Student t-test P<0.05
4.2.3.2 Status of placental infection and antibody recognition
The pregnant women group was segregated into those who presented with an infected
placenta or those with a healthy placenta during delivery. Levels of antibodies from
pregnant women who had an infected placenta during childbirth to 732 DBL-γ domains
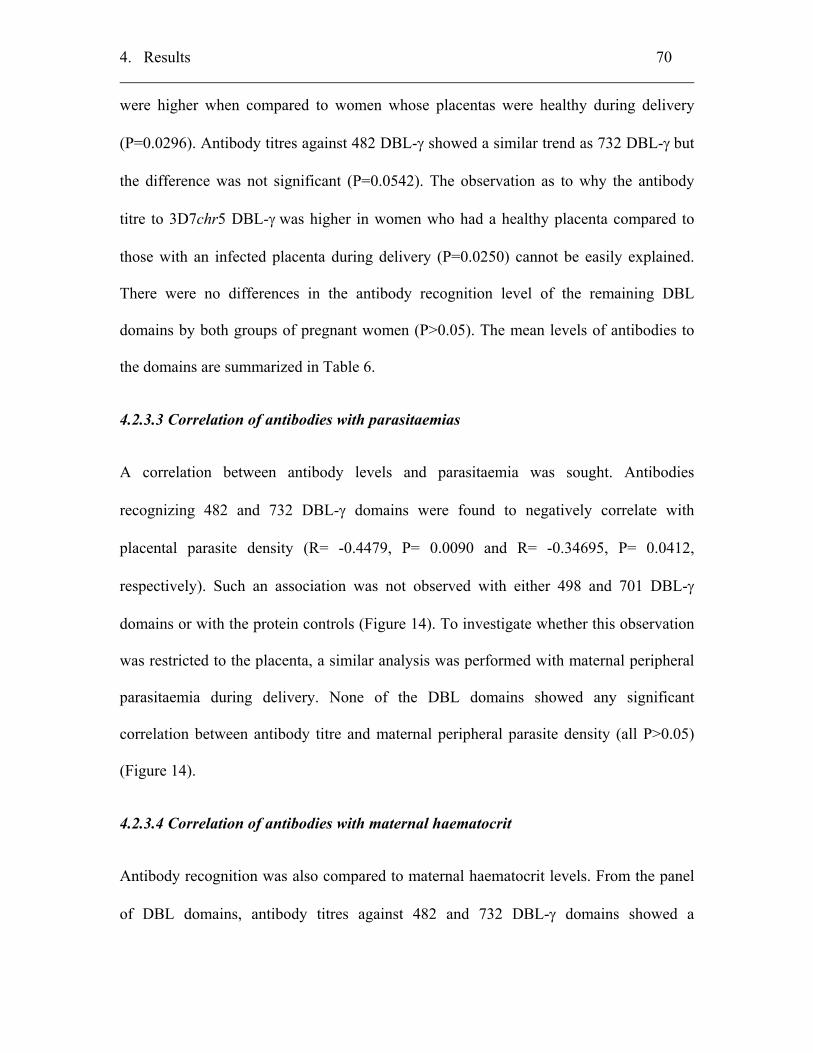
4. Results 70
were higher when compared to women whose placentas were healthy during delivery
(P=0.0296). Antibody titres against 482 DBL-γ showed a similar trend as 732 DBL-γ but
the difference was not significant (P=0.0542). The observation as to why the antibody
titre to 3D7chr5 DBL-γ was higher in women who had a healthy placenta compared to
those with an infected placenta during delivery (P=0.0250) cannot be easily explained.
There were no differences in the antibody recognition level of the remaining DBL
domains by both groups of pregnant women (P>0.05). The mean levels of antibodies to
the domains are summarized in Table 6.
4.2.3.3 Correlation of antibodies with parasitaemias
A correlation between antibody levels and parasitaemia was sought. Antibodies
recognizing 482 and 732 DBL-γ domains were found to negatively correlate with
placental parasite density (R= -0.4479, P= 0.0090 and R= -0.34695, P= 0.0412,
respectively). Such an association was not observed with either 498 and 701 DBL-γ
domains or with the protein controls (Figure 14). To investigate whether this observation
was restricted to the placenta, a similar analysis was performed with maternal peripheral
parasitaemia during delivery. None of the DBL domains showed any significant
correlation between antibody titre and maternal peripheral parasite density (all P>0.05)
(Figure 14).
4.2.3.4 Correlation of antibodies with maternal haematocrit
Antibody recognition was also compared to maternal haematocrit levels. From the panel
of DBL domains, antibody titres against 482 and 732 DBL-γ domains showed a
4. Results 71
correlation that was of statistical significance (Figure 14). The pregnant women anti-482
antibody titre showed a negative association to haematocrit (R=-0.1578, P=0.0399) and
similarly for anti-732 DBL-γ antibody titres (R=-0.1756, P=0.0058).
Figure 14 Correlation between antibody titres to varPAM DBL-γ domains (first-fourth rows), 3D7chr5
DBLγ (fifth row) and Gb23a DBL-1α (sixth row) and log placental parasitaemia (left column), log
peripheral parasitaemia (middle column) and maternal haematocrit (right column). Level of antibodies to
the 482 and 732 DBL−γ domain correlates negatively to log placental parasitaemia (Pearson’s regression
analysis yielded R=-0.4479, P=0.009 and R=-0.34695, P=0.0412, respectively) and not to log peripheral
parasitaemia (both P>0.05). Anti-482 and 732 DBL-γ domain antibody titres also correlated negatively to
maternal haematocrit (R=-0.1578, P=0.0399 and R=-0.1756, P=0.0058, respectively). The other DBL
domains did not show any correlation to log placental parasitaemia, log peripheral parasitaemia or maternal
haematocrit (all P>0.05).
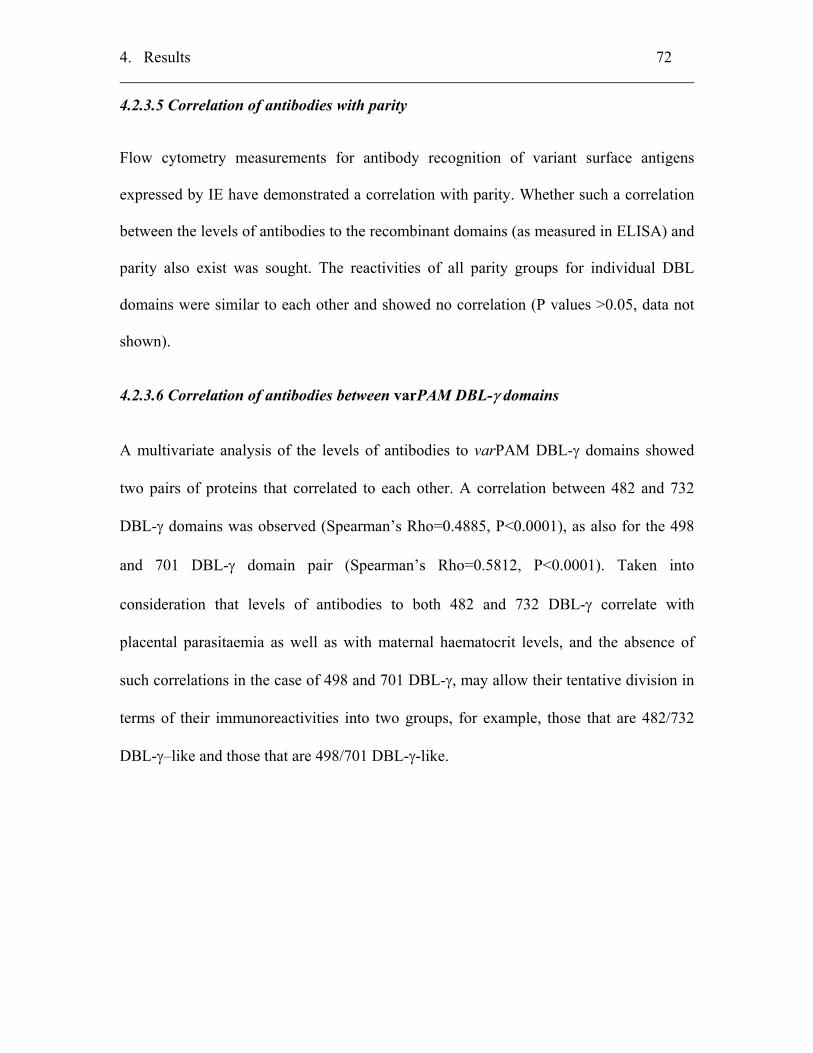
4. Results 72
4.2.3.5 Correlation of antibodies with parity
Flow cytometry measurements for antibody recognition of variant surface antigens
expressed by IE have demonstrated a correlation with parity. Whether such a correlation
between the levels of antibodies to the recombinant domains (as measured in ELISA) and
parity also exist was sought. The reactivities of all parity groups for individual DBL
domains were similar to each other and showed no correlation (P values >0.05, data not
shown).
4.2.3.6 Correlation of antibodies between varPAM DBL-γ domains
A multivariate analysis of the levels of antibodies to varPAM DBL-γ domains showed
two pairs of proteins that correlated to each other. A correlation between 482 and 732
DBL-γ domains was observed (Spearman’s Rho=0.4885, P<0.0001), as also for the 498
and 701 DBL-γ domain pair (Spearman’s Rho=0.5812, P<0.0001). Taken into
consideration that levels of antibodies to both 482 and 732 DBL-γ correlate with
placental parasitaemia as well as with maternal haematocrit levels, and the absence of
such correlations in the case of 498 and 701 DBL-γ, may allow their tentative division in
terms of their immunoreactivities into two groups, for example, those that are 482/732
DBL-γ–like and those that are 498/701 DBL-γ-like.
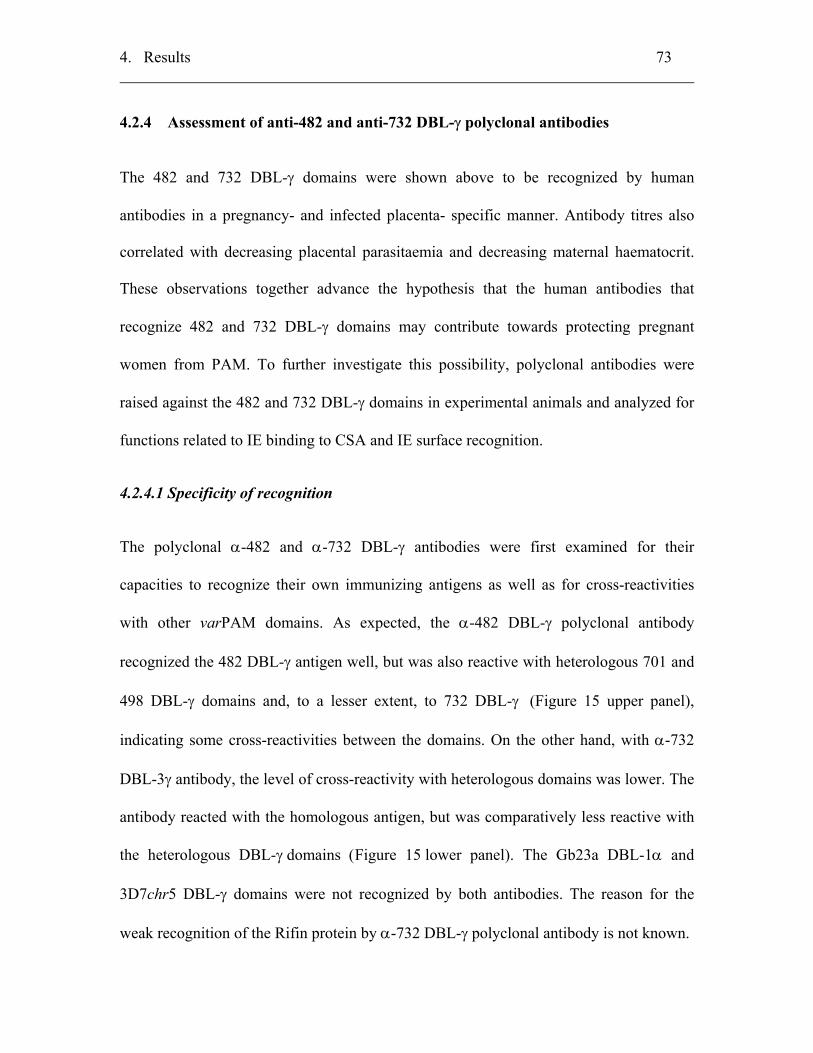
4. Results 73
4.2.4 Assessment of anti-482 and anti-732 DBL-γ polyclonal antibodies
The 482 and 732 DBL-γ domains were shown above to be recognized by human
antibodies in a pregnancy- and infected placenta- specific manner. Antibody titres also
correlated with decreasing placental parasitaemia and decreasing maternal haematocrit.
These observations together advance the hypothesis that the human antibodies that
recognize 482 and 732 DBL-γ domains may contribute towards protecting pregnant
women from PAM. To further investigate this possibility, polyclonal antibodies were
raised against the 482 and 732 DBL-γ domains in experimental animals and analyzed for
functions related to IE binding to CSA and IE surface recognition.
4.2.4.1 Specificity of recognition
The polyclonal α-482 and α-732 DBL-γ antibodies were first examined for their
capacities to recognize their own immunizing antigens as well as for cross-reactivities
with other varPAM domains. As expected, the α-482 DBL-γ polyclonal antibody
recognized the 482 DBL-γ antigen well, but was also reactive with heterologous 701 and
498 DBL-γ domains and, to a lesser extent, to 732 DBL-γ (Figure 15 upper panel),
indicating some cross-reactivities between the domains. On the other hand, with α-732
DBL-3γ antibody, the level of cross-reactivity with heterologous domains was lower. The
antibody reacted with the homologous antigen, but was comparatively less reactive with
the heterologous DBL-γ domains (Figure 15 lower panel). The Gb23a DBL-1α and
3D7chr5 DBL-γ domains were not recognized by both antibodies. The reason for the
weak recognition of the Rifin protein by α-732 DBL-γ polyclonal antibody is not known.
4. Results 74
Figure 15 Reactivity of the α-482 and α-732 DBL-γ antibodies to recombinant DBL domains. The α-482
antibody (upper panel) showed a higher recognition to heterologous DBL-γ domains compared to α-732
DBL-γ antibody (lower panel). The reactivity of the antibodies is expressed as optical density (OD).
4.2.4.2 Inhibition of IE binding to CSA by the α-DBL-γ antibody
To test if the polyclonal antibodies can inhibit IE-CSA binding, the antibodies were first
incubated with the IE prior to the static binding assay. The level of binding of IE to CSA
in the absence of either human plasma or animal antiserum was calculated as 100 %
binding (control), and used as a basis of comparison. A representative result obtained
using the isolate Gb337CSA is shown in Figure 16. The α-482 DBL-γ antibody was able
to reduce the CSA-binding of Gb337CSA to 30 % and α-732 DBL-3γ antibody to 45 %.
The inhibition by α-482 DBL-γ antibody was comparable to those achieved by plasma
from a multiparid woman. Soluble CSA and not CSC abolished binding of the
Gb337CSA thus showing that the IE binding was CSA specific. On the other hand, α-
4. Results 75
rifin antibody, used as a negative control, and the pre-immune plasma did not affect IE-
CSA binding. Plasma from African men did not reduce the binding of IECSA significantly.
Figure 16 Inhibition of IE-CSA binding by specific α-482 and α-732 DBL-γ polyclonal antibody in a static
binding assay. The results for Gb337CSA is shown here.
4.2.4.3 Surface staining of live IE
The antibodies were also examined for surface recognition of live IE in IFA (Figure 17).
Both α-DBL-γ antibodies were visualized with a rim-like surface on live heterologous
IECSA but not the non-CSA-binding isogenic lines (Gb337CSA and Gb337 shown in
Figure 17A). This fluorescent rim is interpreted to correspond to the staining of the
erythrocyte-membrane. No staining was seen within the IE indicating that the antibody-
complex was not internalized by endocytosis or diffused through permeabilised
membrane. When the α-DBL-γ polyclonal antibodies were used to stain non-CSA-
binding IE, no fluorescence was detected (Figure 17A). Pre-immune sera did not
recognize any IE (Figure 17A). To quantify the fluorescence staining, fluorescent rates
were calculated (Figure 17B). Anti-482 and α-732 DBL-γ polyclonal antibodies showed
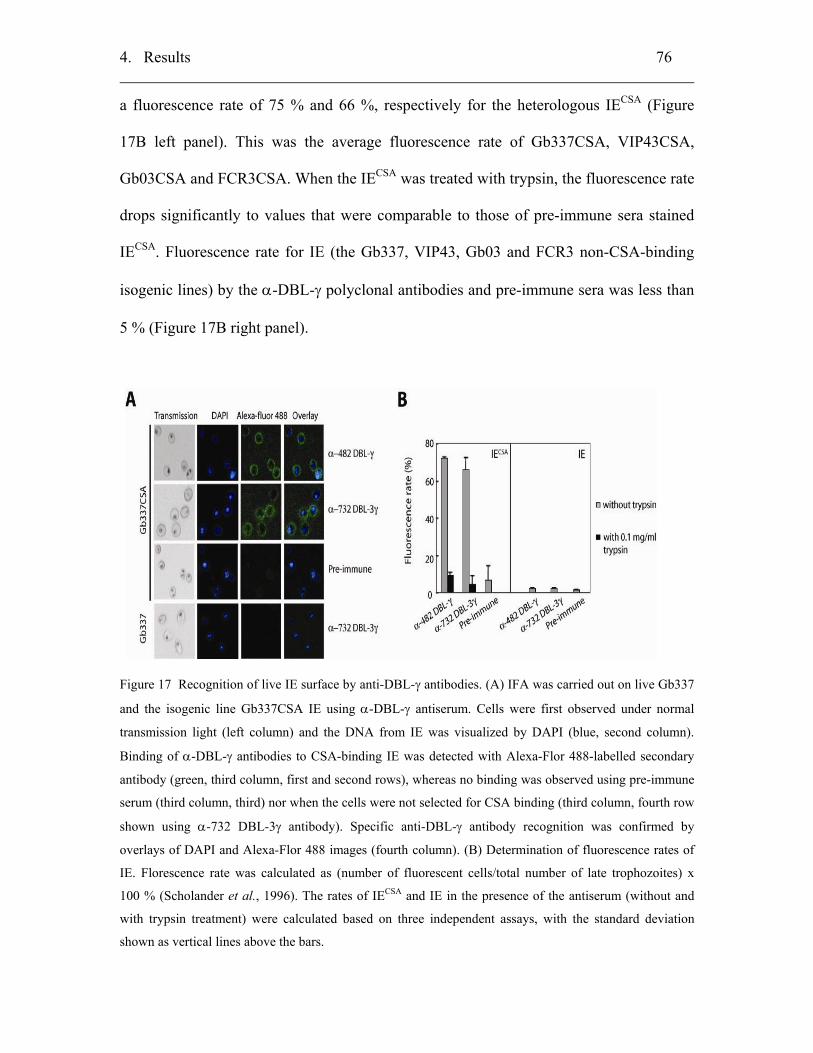
4. Results 76
a fluorescence rate of 75 % and 66 %, respectively for the heterologous IECSA (Figure
17B left panel). This was the average fluorescence rate of Gb337CSA, VIP43CSA,
Gb03CSA and FCR3CSA. When the IECSA was treated with trypsin, the fluorescence rate
drops significantly to values that were comparable to those of pre-immune sera stained
IECSA. Fluorescence rate for IE (the Gb337, VIP43, Gb03 and FCR3 non-CSA-binding
isogenic lines) by the α-DBL-γ polyclonal antibodies and pre-immune sera was less than
5 % (Figure 17B right panel).
Figure 17 Recognition of live IE surface by anti-DBL-γ antibodies. (A) IFA was carried out on live Gb337
and the isogenic line Gb337CSA IE using α-DBL-γ antiserum. Cells were first observed under normal
transmission light (left column) and the DNA from IE was visualized by DAPI (blue, second column).
Binding of α-DBL-γ antibodies to CSA-binding IE was detected with Alexa-Flor 488-labelled secondary
antibody (green, third column, first and second rows), whereas no binding was observed using pre-immune
serum (third column, third) nor when the cells were not selected for CSA binding (third column, fourth row
shown using α-732 DBL-3γ antibody). Specific anti-DBL-γ antibody recognition was confirmed by
overlays of DAPI and Alexa-Flor 488 images (fourth column). (B) Determination of fluorescence rates of
IE. Florescence rate was calculated as (number of fluorescent cells/total number of late trophozoites) x
100 % (Scholander et al., 1996). The rates of IECSA and IE in the presence of the antiserum (without and
with trypsin treatment) were calculated based on three independent assays, with the standard deviation
shown as vertical lines above the bars.
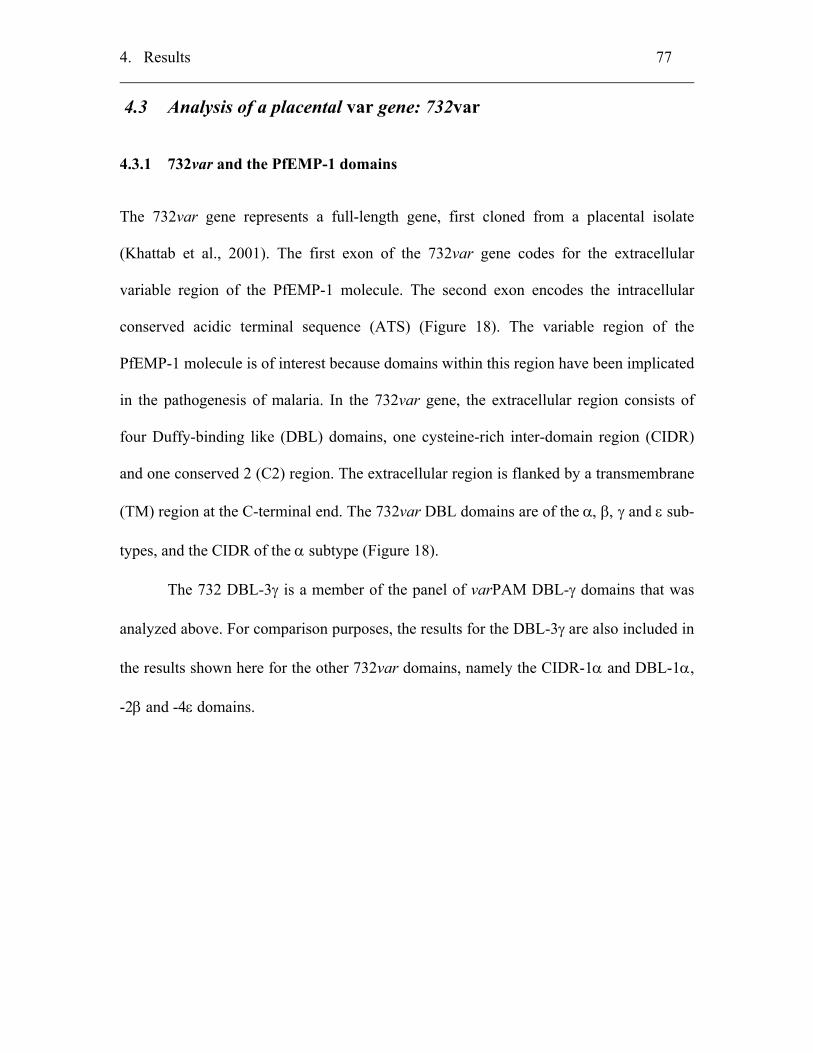
4. Results 77
4.3 Analysis of a placental var gene: 732var
4.3.1 732var and the PfEMP-1 domains
The 732var gene represents a full-length gene, first cloned from a placental isolate
(Khattab et al., 2001). The first exon of the 732var gene codes for the extracellular
variable region of the PfEMP-1 molecule. The second exon encodes the intracellular
conserved acidic terminal sequence (ATS) (Figure 18). The variable region of the
PfEMP-1 molecule is of interest because domains within this region have been implicated
in the pathogenesis of malaria. In the 732var gene, the extracellular region consists of
four Duffy-binding like (DBL) domains, one cysteine-rich inter-domain region (CIDR)
and one conserved 2 (C2) region. The extracellular region is flanked by a transmembrane
(TM) region at the C-terminal end. The 732var DBL domains are of the α, β, γ and ε sub-
types, and the CIDR of the α subtype (Figure 18).
The 732 DBL-3γ is a member of the panel of varPAM DBL-γ domains that was
analyzed above. For comparison purposes, the results for the DBL-3γ are also included in
the results shown here for the other 732var domains, namely the CIDR-1α and DBL-1α,
-2β and -4ε domains.
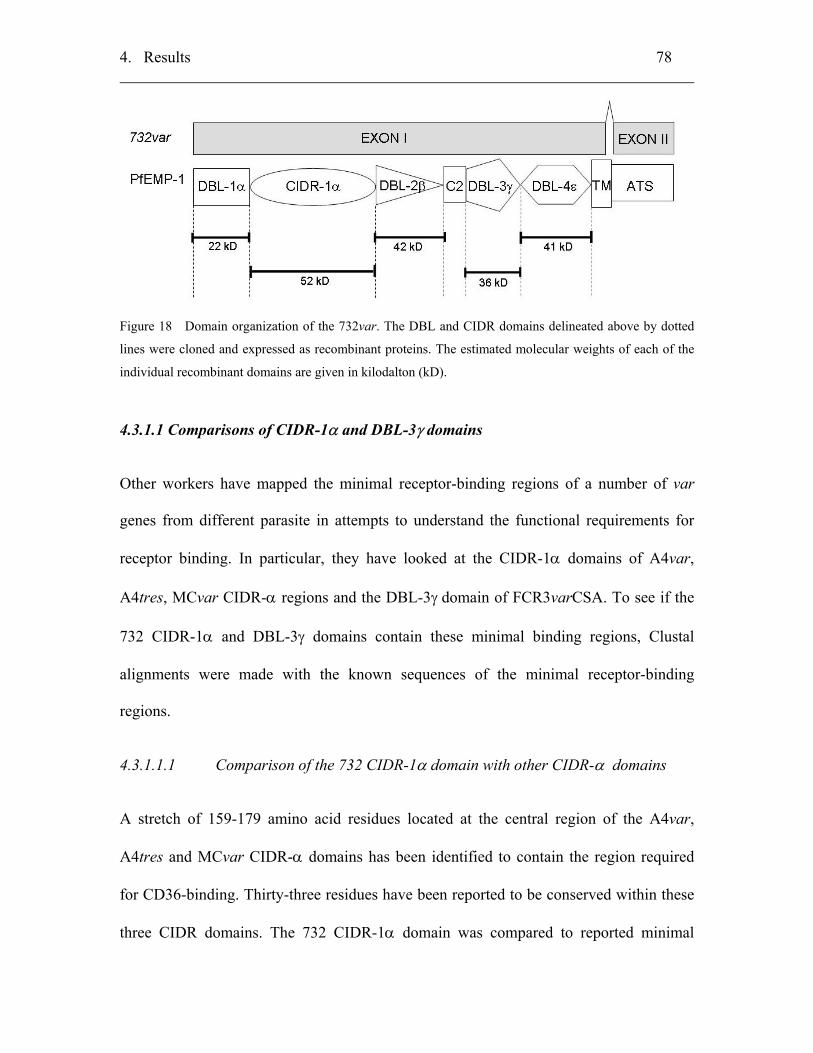
4. Results 78
Figure 18 Domain organization of the 732var. The DBL and CIDR domains delineated above by dotted
lines were cloned and expressed as recombinant proteins. The estimated molecular weights of each of the
individual recombinant domains are given in kilodalton (kD).
4.3.1.1 Comparisons of CIDR-1α and DBL-3γ domains
Other workers have mapped the minimal receptor-binding regions of a number of var
genes from different parasite in attempts to understand the functional requirements for
receptor binding. In particular, they have looked at the CIDR-1α domains of A4var,
A4tres, MCvar CIDR-α regions and the DBL-3γ domain of FCR3varCSA. To see if the
732 CIDR-1α and DBL-3γ domains contain these minimal binding regions, Clustal
alignments were made with the known sequences of the minimal receptor-binding
regions.
4.3.1.1.1 Comparison of the 732 CIDR-1α domain with other CIDR-α domains
A stretch of 159-179 amino acid residues located at the central region of the A4var,
A4tres and MCvar CIDR-α domains has been identified to contain the region required
for CD36-binding. Thirty-three residues have been reported to be conserved within these
three CIDR domains. The 732 CIDR-1α domain was compared to reported minimal
4. Results 79
binding regions. Out of the 33 identified conserved residues, 31 residues were found in
the 732 CIDR-1α (Figure 19).
Figure 19 Conservation of the minimal binding region for CD36 in 732 CIDR-1α. A Clustal alignment of
the central region of 732 CIDR-1α, A4var CIDR-α, A4tres CIDR-α and MCvar CIDR-α was made.
Thirty-three 100 % identical residues (shaded black) were identified between the latter three var genes, 31
of which are present in 732 CIDR-1α. The two non-identical amino acids are marked with an asterisk. The
alignment was made with Clustal W (http://align.genome.jp).
4.3.1.1.2 Comparison of the 732 DBL-3γ domain with the FCR3CSA DBL-γ
domain
Recently, a 67 amino acid residue region was identified in the FCR3CSA DBL-γ domain
to be the minimal CSA-binding region. This region has been shown to be conserved in
ItR29 DBL-2γ and 3D7chr5 DBL-3γ. Out of the 41 conserved residues between
FCR3varCSA, It29 and 3D7chr5 DBL-γ domains, only 16 were found in 732 DBL-3γ
(Figure 20).
732 CIDR LCVLKNEKELGCKKKSMEYIDFFELWVTHVLNDSINWRKKLNNCINNTKSNKCKKGCKSNA4var CIDR ------------VKKQKTFNNFFNFWVAHVLKDSIDWRTQLTKCLSEDKLKKCEKGCKSNA4tres CIDR ------------EEIQKSFFDFFTYWVAHMLKDSEDWKTKLSKCLKN-KEQLCINNCNRNMCvar CIDR -------------DKIMSYNAFFWMWVHDMLIDSIKWRDEHGRCINKDKGKTCIKGCNKK * 732 CIDR CECFKNWVEKKKEEWIDIKKYFEKQTNLPEGG--HFTTLEMFLEEQFLPVIEEAYGDKKSA4var CIDR CECFKKWIEKKEKEWIKVKDQFNKQTDFLEWK--HYLVLETILENYYFENIQKAYGDLKSA4tres CIDR CKCYEKWIEKKEEEWEKIKVHYEKQK-LPEGA--HYVILEGVLELQFIKGITNAYGEQKEMCvar CIDR CICFQKWVEQKKTEWGKIKDHFRKQKDIPKDWTHDDFLQTLLMKDLLLEIIQDTYGDANE * 732 CIDR IEKIRQLLNKSNSKGEDNVLKK-----------EDILDKLLKHEKDDAELCIDNHPEDEKA4var CIDR IQEMKKMIKE-NKQNKNRTKDD-----------EDALDVLFDHEKEEAEDCLDIHEDD--A4tres CIDR VQRIAELLRNKTKEGPDDATQR-----------KTIIDELLDHELEEAHECRENNPEE--MCvar CIDR IKRIEALLEQAGVGGIDFAALAGLYTKGFVAEKDTTIDKLLQHEQKEADKCLKTHTDDTC 732 CIDR CTDEDDSDEDDHDEPPIIRRNPCATPSGSTYPVLANKAAHLMHETAKTQLASRAGRSALRA4var CIDR --DDDDECVEEIEKIPNN------------------------------------------A4tres CIDR ---------KNCSKEPH-------------------------------------------MCvar CIDR PPQEDRSVARSE------------------------------------------------
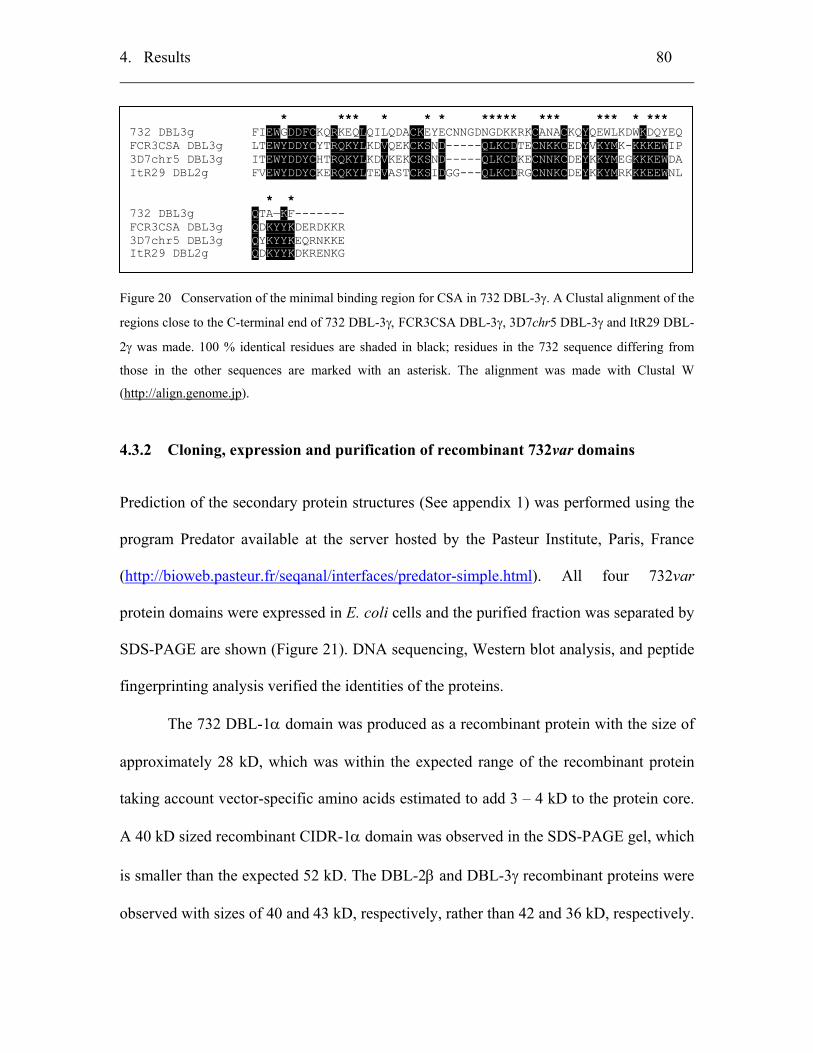
4. Results 80
Figure 20 Conservation of the minimal binding region for CSA in 732 DBL-3γ. A Clustal alignment of the
regions close to the C-terminal end of 732 DBL-3γ, FCR3CSA DBL-3γ, 3D7chr5 DBL-3γ and ItR29 DBL-
2γ was made. 100 % identical residues are shaded in black; residues in the 732 sequence differing from
those in the other sequences are marked with an asterisk. The alignment was made with Clustal W
(http://align.genome.jp).
4.3.2 Cloning, expression and purification of recombinant 732var domains
Prediction of the secondary protein structures (See appendix 1) was performed using the
program Predator available at the server hosted by the Pasteur Institute, Paris, France
(http://bioweb.pasteur.fr/seqanal/interfaces/predator-simple.html). All four 732var
protein domains were expressed in E. coli cells and the purified fraction was separated by
SDS-PAGE are shown (Figure 21). DNA sequencing, Western blot analysis, and peptide
fingerprinting analysis verified the identities of the proteins.
The 732 DBL-1α domain was produced as a recombinant protein with the size of
approximately 28 kD, which was within the expected range of the recombinant protein
taking account vector-specific amino acids estimated to add 3 – 4 kD to the protein core.
A 40 kD sized recombinant CIDR-1α domain was observed in the SDS-PAGE gel, which
is smaller than the expected 52 kD. The DBL-2β and DBL-3γ recombinant proteins were
observed with sizes of 40 and 43 kD, respectively, rather than 42 and 36 kD, respectively.
* *** * * * ***** *** *** * ***732 DBL3g FIEWGDDFCKQRKEQLQILQDACKEYECNNGDNGDKKRKCANACKQYQEWLKDWKDQYEQFCR3CSA DBL3g LTEWYDDYCYTRQKYLKDVQEKCKSND-----QLKCDTECNKKCEDYVKYMK-KKKEWIP3D7chr5 DBL3g ITEWYDDYCHTRQKYLKDVKEKCKSND-----QLKCDKECNNKCDEYKKYMEGKKKEWDAItR29 DBL2g FVEWYDDYCKERQKYLTEVASTCKSIDGG---QLKCDRGCNNKCDEYKKYMRKKKEEWNL * * 732 DBL3g QTA—KF------- FCR3CSA DBL3g QDKYYKDERDKKR 3D7chr5 DBL3g QYKYYKEQRNKKE ItR29 DBL2g QDKYYKDKRENKG
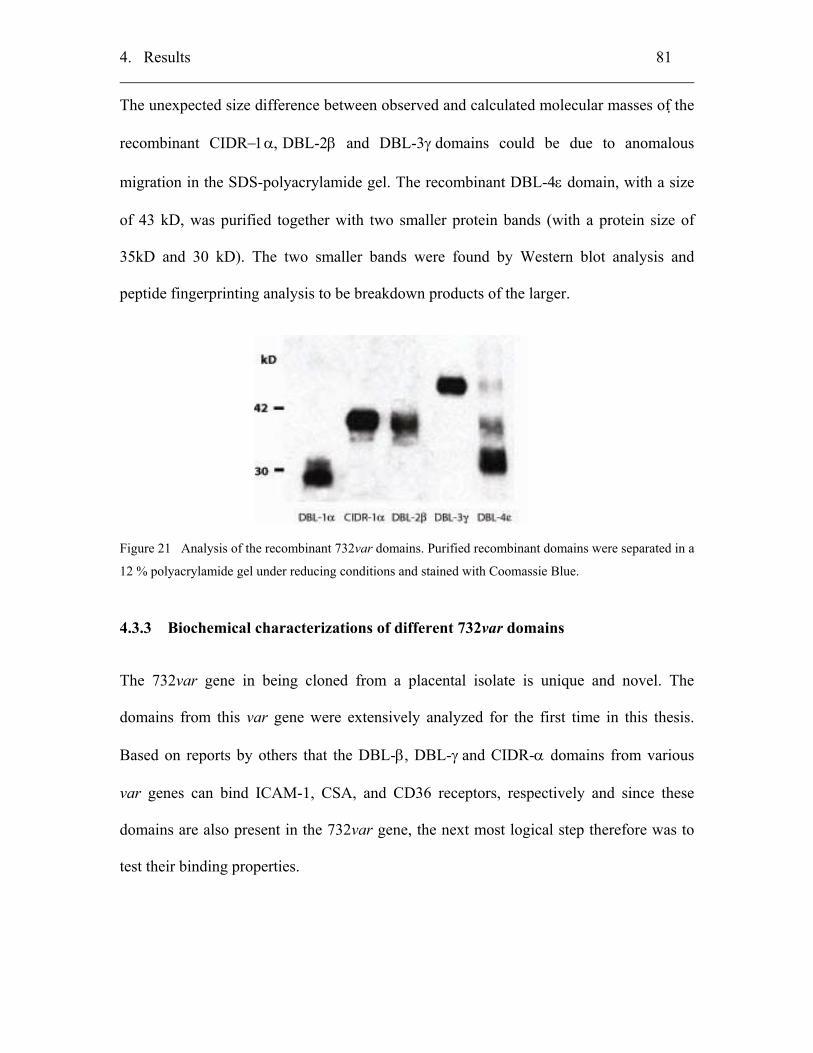
4. Results 81
The unexpected size difference between observed and calculated molecular masses of the
recombinant CIDR−1α, DBL-2β and DBL-3γ domains could be due to anomalous
migration in the SDS-polyacrylamide gel. The recombinant DBL-4ε domain, with a size
of 43 kD, was purified together with two smaller protein bands (with a protein size of
35kD and 30 kD). The two smaller bands were found by Western blot analysis and
peptide fingerprinting analysis to be breakdown products of the larger.
Figure 21 Analysis of the recombinant 732var domains. Purified recombinant domains were separated in a
12 % polyacrylamide gel under reducing conditions and stained with Coomassie Blue.
4.3.3 Biochemical characterizations of different 732var domains
The 732var gene in being cloned from a placental isolate is unique and novel. The
domains from this var gene were extensively analyzed for the first time in this thesis.
Based on reports by others that the DBL-β, DBL-γ and CIDR-α domains from various
var genes can bind ICAM-1, CSA, and CD36 receptors, respectively and since these
domains are also present in the 732var gene, the next most logical step therefore was to
test their binding properties.
4. Results 82
4.3.3.1 Static in vitro binding assay using CHO-cells
CHO cells expressing the receptors CSA (CHO-K1), CD36 (CHO-CD36) and ICAM-1
(CHO-ICAM-1) were used in this assay. Recombinant 732 CIDR-1α and DBL-3γ
domains were able to bind CHO-CD36 and CHO-K1 cells, respectively, but not CHO-
ICAM-1 (Figure 22 second and fourth row). The 732 DBL-2β did not bind to the ICAM-
1 receptor (CHO-ICAM-1) or to any other receptors (Figure 22 third row), similarly for
the 732 DBL-1α protein (Figure 22 first row). Further controls were included in this
preliminary binding assay to prevent detection of non-specific protein interaction with the
surface of the CHO cells. Rifin, a P. falciparum recombinant protein with no known
relevant function in receptor binding, was included in the assay as a protein control. As
expected, CHO-745 cells, which is devoid of surface expression of all three receptors, did
not support the binding of any of the recombinant proteins tested (data not shown).
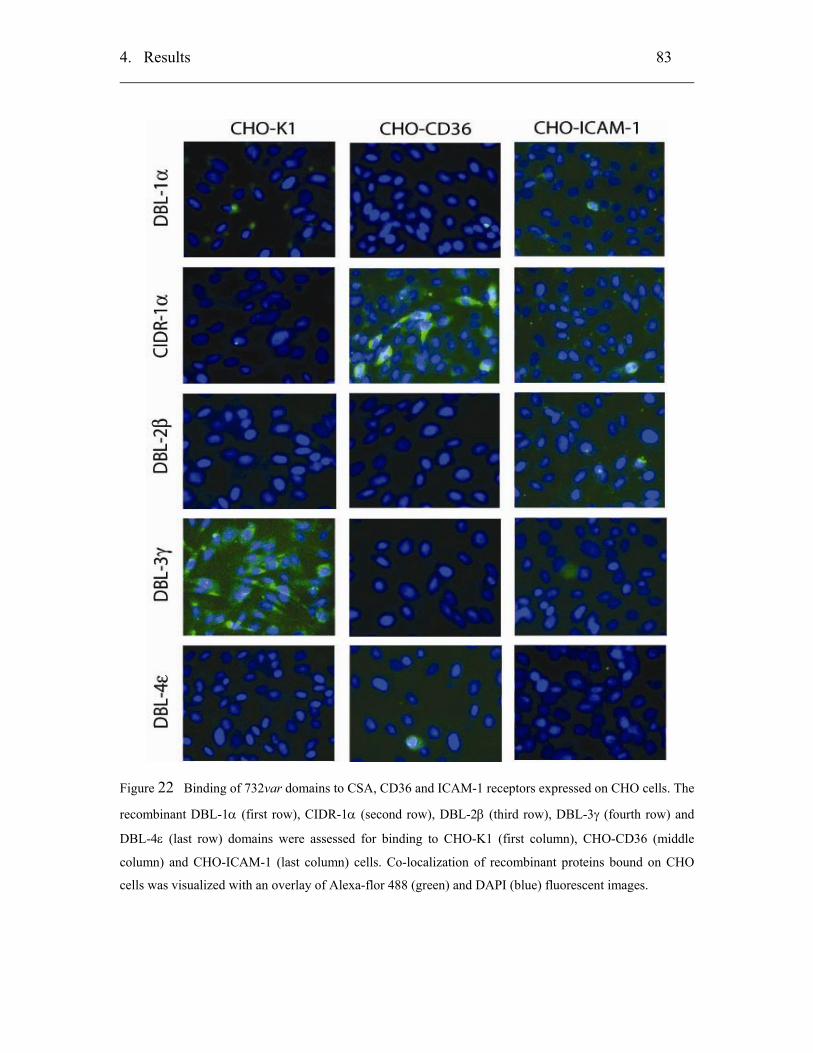
4. Results 83
Figure 22 Binding of 732var domains to CSA, CD36 and ICAM-1 receptors expressed on CHO cells. The
recombinant DBL-1α (first row), CIDR-1α (second row), DBL-2β (third row), DBL-3γ (fourth row) and
DBL-4ε (last row) domains were assessed for binding to CHO-K1 (first column), CHO-CD36 (middle
column) and CHO-ICAM-1 (last column) cells. Co-localization of recombinant proteins bound on CHO
cells was visualized with an overlay of Alexa-flor 488 (green) and DAPI (blue) fluorescent images.
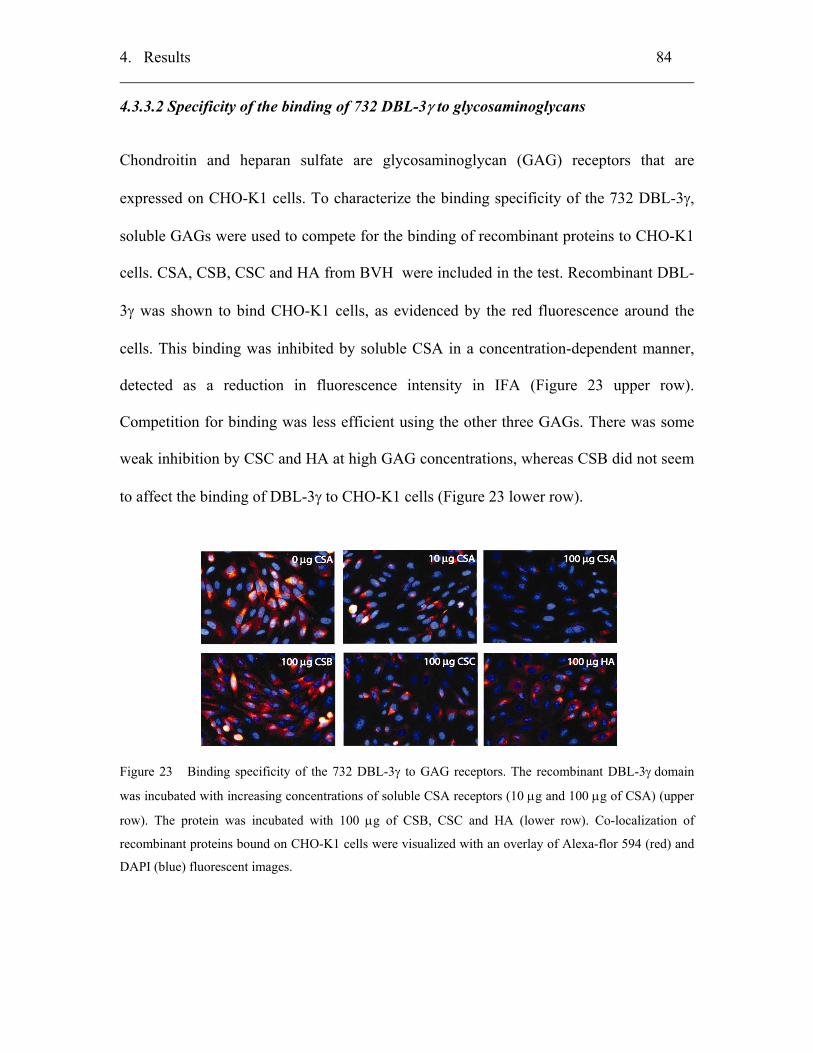
4. Results 84
4.3.3.2 Specificity of the binding of 732 DBL-3γ to glycosaminoglycans
Chondroitin and heparan sulfate are glycosaminoglycan (GAG) receptors that are
expressed on CHO-K1 cells. To characterize the binding specificity of the 732 DBL-3γ,
soluble GAGs were used to compete for the binding of recombinant proteins to CHO-K1
cells. CSA, CSB, CSC and HA from BVH were included in the test. Recombinant DBL-
3γ was shown to bind CHO-K1 cells, as evidenced by the red fluorescence around the
cells. This binding was inhibited by soluble CSA in a concentration-dependent manner,
detected as a reduction in fluorescence intensity in IFA (Figure 23 upper row).
Competition for binding was less efficient using the other three GAGs. There was some
weak inhibition by CSC and HA at high GAG concentrations, whereas CSB did not seem
to affect the binding of DBL-3γ to CHO-K1 cells (Figure 23 lower row).
Figure 23 Binding specificity of the 732 DBL-3γ to GAG receptors. The recombinant DBL-3γ domain
was incubated with increasing concentrations of soluble CSA receptors (10 µg and 100 µg of CSA) (upper
row). The protein was incubated with 100 µg of CSB, CSC and HA (lower row). Co-localization of
recombinant proteins bound on CHO-K1 cells were visualized with an overlay of Alexa-flor 594 (red) and
DAPI (blue) fluorescent images.
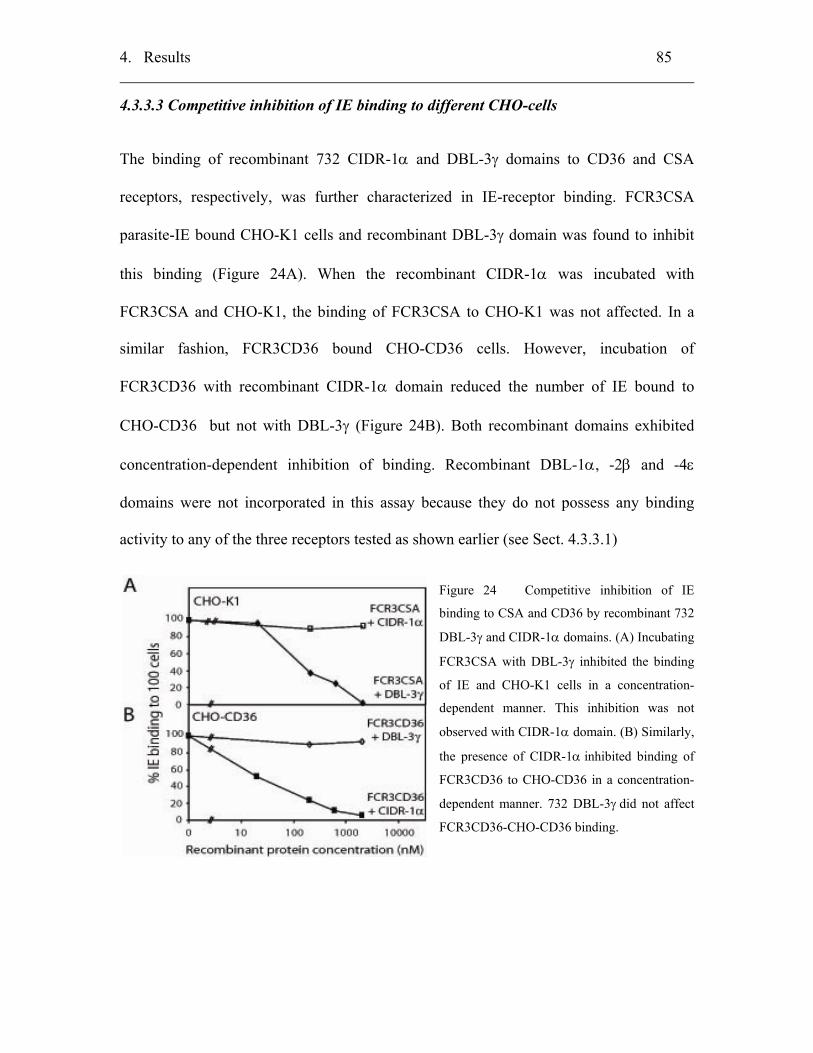
4. Results 85
4.3.3.3 Competitive inhibition of IE binding to different CHO-cells
The binding of recombinant 732 CIDR-1α and DBL-3γ domains to CD36 and CSA
receptors, respectively, was further characterized in IE-receptor binding. FCR3CSA
parasite-IE bound CHO-K1 cells and recombinant DBL-3γ domain was found to inhibit
this binding (Figure 24A). When the recombinant CIDR-1α was incubated with
FCR3CSA and CHO-K1, the binding of FCR3CSA to CHO-K1 was not affected. In a
similar fashion, FCR3CD36 bound CHO-CD36 cells. However, incubation of
FCR3CD36 with recombinant CIDR-1α domain reduced the number of IE bound to
CHO-CD36 but not with DBL-3γ (Figure 24B). Both recombinant domains exhibited
concentration-dependent inhibition of binding. Recombinant DBL-1α, -2β and -4ε
domains were not incorporated in this assay because they do not possess any binding
activity to any of the three receptors tested as shown earlier (see Sect. 4.3.3.1)
Figure 24 Competitive inhibition of IE
binding to CSA and CD36 by recombinant 732
DBL-3γ and CIDR-1α domains. (A) Incubating
FCR3CSA with DBL-3γ inhibited the binding
of IE and CHO-K1 cells in a concentration-
dependent manner. This inhibition was not
observed with CIDR-1α domain. (B) Similarly,
the presence of CIDR-1α inhibited binding of
FCR3CD36 to CHO-CD36 in a concentration-
dependent manner. 732 DBL-3γ did not affect
FCR3CD36-CHO-CD36 binding.
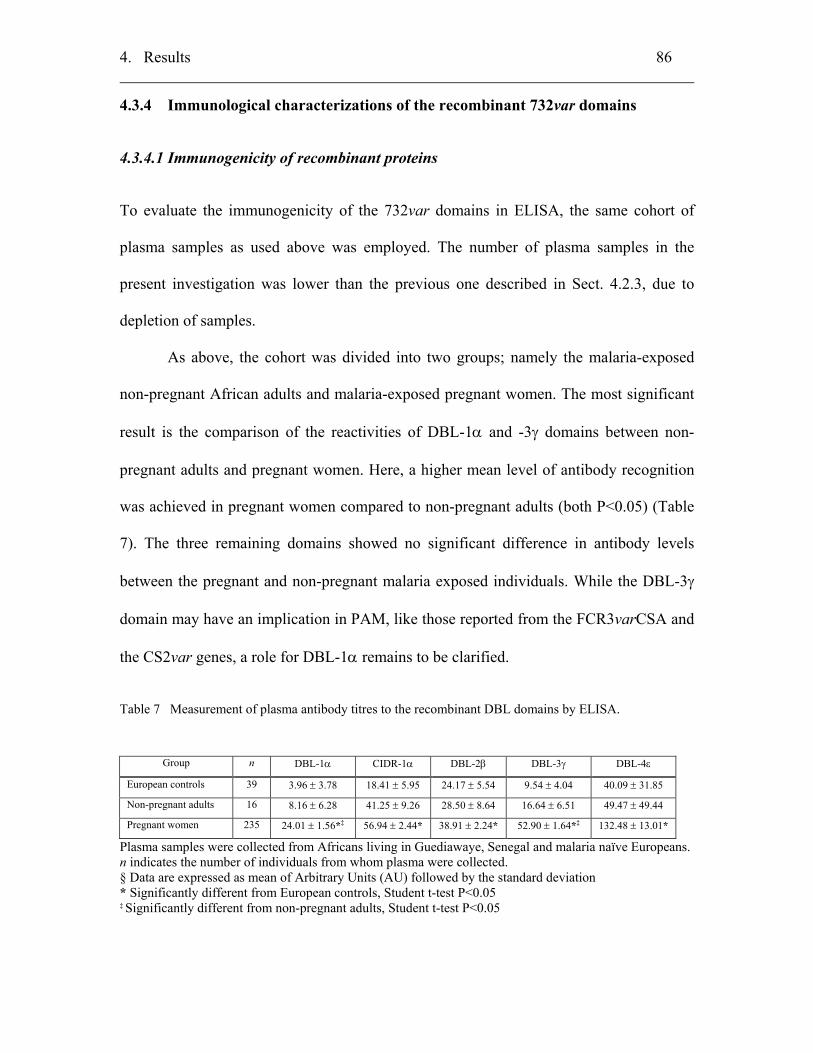
4. Results 86
4.3.4 Immunological characterizations of the recombinant 732var domains
4.3.4.1 Immunogenicity of recombinant proteins
To evaluate the immunogenicity of the 732var domains in ELISA, the same cohort of
plasma samples as used above was employed. The number of plasma samples in the
present investigation was lower than the previous one described in Sect. 4.2.3, due to
depletion of samples.
As above, the cohort was divided into two groups; namely the malaria-exposed
non-pregnant African adults and malaria-exposed pregnant women. The most significant
result is the comparison of the reactivities of DBL-1α and -3γ domains between non-
pregnant adults and pregnant women. Here, a higher mean level of antibody recognition
was achieved in pregnant women compared to non-pregnant adults (both P<0.05) (Table
7). The three remaining domains showed no significant difference in antibody levels
between the pregnant and non-pregnant malaria exposed individuals. While the DBL-3γ
domain may have an implication in PAM, like those reported from the FCR3varCSA and
the CS2var genes, a role for DBL-1α remains to be clarified.
Table 7 Measurement of plasma antibody titres to the recombinant DBL domains by ELISA.
Group n DBL-1α CIDR-1α DBL-2β DBL-3γ DBL-4ε
European controls 39 3.96 ± 3.78 18.41 ± 5.95 24.17 ± 5.54 9.54 ± 4.04 40.09 ± 31.85
Non-pregnant adults 16 8.16 ± 6.28 41.25 ± 9.26 28.50 ± 8.64 16.64 ± 6.51 49.47 ± 49.44
Pregnant women 235 24.01 ± 1.56*‡ 56.94 ± 2.44* 38.91 ± 2.24* 52.90 ± 1.64*‡ 132.48 ± 13.01*
Plasma samples were collected from Africans living in Guediawaye, Senegal and malaria naïve Europeans. n indicates the number of individuals from whom plasma were collected. § Data are expressed as mean of Arbitrary Units (AU) followed by the standard deviation * Significantly different from European controls, Student t-test P<0.05 ‡ Significantly different from non-pregnant adults, Student t-test P<0.05
4. Results 87
4.3.4.2 Correlation of antibodies with parasitaemias
The antibody responses of the pregnant women were further analyzed for clinical
associations. Interestingly, level of antibodies to 732 DBL-3γ domain correlated with a
decreasing placental parasitaemia in the pregnant women (R= -0.3366, P=0.0447) (Figure
25 left column). This negative correlation could indicate that the antibodies are capable of
controlling parasite growth. While the levels of antibodies to DBL-1α, -2β and -4ε did
not show any correlation to placental parasitaemia (all P>0.05), there was a positive
correlation of placental parasite density with anti-CIDR-1α antibody titres (R= +0.49929,
P=0.0080) (Figure 25 left column). The significance of the reactivity of anti-CIDR-1α
antibodies in PAM is not yet clear, but possibly these antibodies could serve as an
indicator of infection. To investigate whether these observations are restricted to the
placenta, a similar analysis was performed with maternal peripheral parasitaemia during
delivery. None of the antibody titres to the 732var domains was observed to significantly
correlate with maternal peripheral parasitaemia (all P>0.05) (Figure 25 middle column).
4.3.4.3 Correlation of antibodies with maternal haematocrit
Further analysis of the ELISA reactivities showed that anti-DBL-3γ antibody titres
correlated negatively to maternal haematocrit (R= -0.1756, P=0.0058). No correlation
was observed between levels of antibodies to the 732var domains and maternal
haematocrit (P>0.05) (Figure 25 right column).
4. Results 88
4.3.4.4 Correlation of antibodies with parity and age
Further analysis was performed to investigate if levels of antibodies to the 732var
domains correlated to the pregnant women’s parity and age. The level of antibodies were
similar when the women were categorized by parity and age being investigated (P>0.05)
(data not shown). This was observed in all 732 DBL and CIDR domains. Further multiple
linear regression analysis showed that antibody recognition to 732var domains is not
influenced by parity or age (P>0.05).
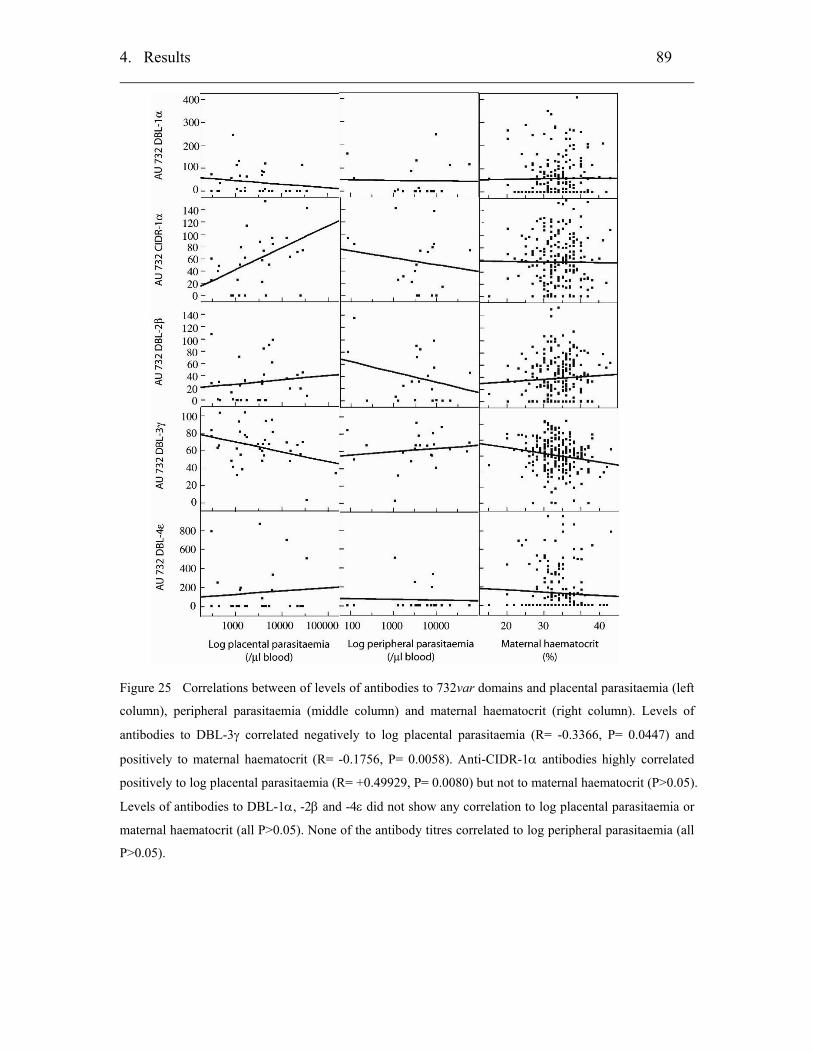
4. Results 89
Figure 25 Correlations between of levels of antibodies to 732var domains and placental parasitaemia (left
column), peripheral parasitaemia (middle column) and maternal haematocrit (right column). Levels of
antibodies to DBL-3γ correlated negatively to log placental parasitaemia (R= -0.3366, P= 0.0447) and
positively to maternal haematocrit (R= -0.1756, P= 0.0058). Anti-CIDR-1α antibodies highly correlated
positively to log placental parasitaemia (R= +0.49929, P= 0.0080) but not to maternal haematocrit (P>0.05).
Levels of antibodies to DBL-1α, -2β and -4ε did not show any correlation to log placental parasitaemia or
maternal haematocrit (all P>0.05). None of the antibody titres correlated to log peripheral parasitaemia (all
P>0.05).
Discussion 90
5. Discussion
5.1 Materials and methods used in this study
In order to investigate the biochemical characteristics of the various P. falciparum
erythrocyte membrane-1 (PfEMP-1) domains, three essential starting materials were
required: (a) the host-receptor molecules as binding partners to parasite ligands, (b) the
isogenic lines of P. falciparum-infected erythrocytes (IE) that bind to different host
receptors, and (c) various PfEMP-1 domains in recombinant proteins to function as
receptor-binding ligands. Efforts were therefore taken to acquire these materials as
outlined below.
5.1.1 Host receptors for biochemical characterization of PfEMP-1 domains
Various receptors have been implicated with a role in host-parasite interactions in malaria,
amongst them CD36, intercellular adhesion molecule-1 (ICAM-1) and CSA. Substantial
evidence has supported the role of CSA as the binding partner of placental IE in PAM.
CSA is a glycosaminoglycan (GAG), and shares structural similarities with
chondroitin sulfate B and C (CSB and CSC) and hyaluronic acid (HA). The GAG
molecules are commercially available as purified receptors. These purified receptors can
be immobilized on plastic surfaces for binding assays. GAG molecules are also expressed
naturally on the surface of Chinese hamster ovary (CHO) cells, CHO-K1 (Tjio, Puck,
1958; Esko et al., 1985) which serve in this work as an alternative source of CSA and HA
for binding studies.
Discussion 91
Since CD36 and ICAM-1 receptors were not readily available as purified
receptors, CHO cells that express these receptors on their surface were used instead.
These CHO-CD36 and -ICAM-1 cells are stable transfectants of a mutant CHO cell line,
CHO-pgsA-745 cells (referred to as CHO-745 in this thesis), that is devoid of
endogenous CSA expression. CHO-745 cells lack an active xylosyltransferase enzyme
that participates in the concomitant first sugar transfer in the GAG biosynthesis pathway,
which is common for CSA and HA (Esko et al., 1985). As a result, the CHO-745 cell is
unable to synthesize GAG and therefore the cell surface is devoid of CSA and HA.
CSA/HA-expressing CHO-K1 cells can thus be compared with transfectant CD36- and
ICAM-1-expressing CHO lines for their interaction with IE.
5.1.2 Establishment of IE isogenic lines that bind CSA, CD36 and ICAM-1
IE that sequesters in the placenta has been shown to bind CSA only but not CD36 or
ICAM-1 (Rogerson et al., 1995; Fried, Duffy, 1996). The study of placental isolates (or
laboratory strains that have been selected to bind to CSA) requires the inclusion of IE that
bind receptors other than CSA as controls in binding assays. For the purpose of this study,
three isogenic lines of FCR3were used: FCR3CSA that binds CSA receptor, FCR3CD36
to CD36, and FCR3ICAM-1 to ICAM-1 (see Fig 9).
5.1.2.1 Specificity of the CSA-binding phenotype of the IE
All CSA-binding IE (IECSA) strains used in this study (the Gb337CSA and VIP43CSA
placental isolates, the Gb03CSA cerebral isolate and the FCR3CSA laboratory strain)
bind specifically to CSA and only marginally to HA (see Fig 10). These strains show no
affinity to CSB and CSC. It has been reported that IE strains that were selected to bind to
Discussion 92
CSA can also bind to HA, an alternative receptor reported to be involved in IE binding
(Beeson et al., 2000; Beeson, Brown, 2004). However, this was not found to be the case
here.
5.1.3 Expression of PfEMP-1 recombinant domains in Escherichia coli cells
In order to characterize the DBL and CIDR domains, they were first produced as soluble
recombinant proteins. Proteins synthesized in this form are expected to retain properties
related to their biological function. However, it is not uncommon that proteins produced
by E. coli do not fold properly, post-translational processing does not occur normally, and
they tend to aggregate in inclusion bodies within the bacterial cell. Proteins that are
produced within bacterial inclusion bodies require extraction under denaturing conditions
and subsequent tedious “re-folding” steps. The baculovirus/insect cell system is ideal for
producing correctly folded and post-translational modified proteins, but overall is slow
and difficult to use, involving multiple steps to produce the recombinant baculovirus and
to infect insect cells with the virus. Consequently, it was decided to express the proteins
in E. coli cells, given that a number of PfEMP-1 domains have been successfully
extracted from the bacterial cytoplasm as soluble and functional proteins (Smith et al.,
1998 ;Reeder et al., 1999; Degen et al., 2000).
5.1.3.1 Gb23a DBL-1α domain as control
The Gb23a DBL-1α domain was included in this study as a control. This domain has
been previously characterized using sera from semi-immune children in an earlier work
(Oguariri et al., 2001). The DBL-1α exhibits adhesive features associated with severe
Discussion 93
malaria including blood group antigen A, heparin sulfate A and complement receptor
(CR) 1 binding. It shows no affinity to CD36, ICAM-1 and CSA (Smith, Craig, 2005).
5.1.3.2 3D7chr5var DBL-5γ domain as control
The 3D7chr5var gene has 62 % amino acid identity with the FCR3varCSA gene, and has
been shown to be highly conserved in various IE (Rowe et al., 2002; Winter et al., 2003).
The FCR3varCSA is one of the first var genes to be implicated in PAM (Buffet et al.,
1999). The 3D7chr5var sequence is truncated at the end of DBL-7ε and does not contain
the expected intron and exon II sequence (Rowe et al., 2002; Winter et al., 2003). The
resulting protein is consequently not exported to the surface and is therefore non-
functional (Winter et al., 2003). The 3D7chr5var contains two DBL-γ domains, DBL-3γ
and -5γ (Vazquez-Macias et al., 2002; Kyes et al., 2003). The latter has been shown to
have no CSA-binding property (Vazquez-Macias et al., 2002; Gamain et al., 2005) and
therefore used in this study as a negative control for the varPAM DBL-γ domain binding
assays.
5.2 Analysis of recombinant varPAM DBL-γ domains
Pregnant women, particularly those in their first and second pregnancies, are vulnerable
to PAM. The observation that multiparious women are less affected has been linked to
the development of strain-transcendent antibodies in these individuals that prevent the
binding of IE to the placenta (Fried et al., 1998; Beeson, Duffy, 2005). These anti-
adhesion antibodies probably recognize conserved parasite antigens that are essential for
CSA-binding in a subpopulation of parasites. The corresponding DBL-γ domains from
Discussion 94
the FCR3varCSA and CS2var genes have been established to bind specifically to CSA
(Buffet et al., 1999; Reeder et al., 1999), as shown also for placental-derived isolates
(Rogerson et al., 1995). Work on DBL-γ domains from placental isolates has supported
this observation (Khattab et al., 2001). These DBL-γ domains, known as varPAM DBL-γ
domains bind CSA and are conserved among wild isolates that infect placenta from
different geographical regions and sampled at different times (Khattab et al., 2001;
Khattab et al., 2003). This observation agrees with the consensus that CSA-binding
placental IE express conserved PfEMP-1 variants.
5.2.1 Biochemical characterization of recombinant varPAM DBL-γ domains
5.2.1.1 Production of functional recombinant varPAM DBL-γ domains
In this study, the four varPAM DBL-γ domains together with the control 3D7chr5 DBL-γ
and Gb23a DBL-1α domains were produced as correctly folded and functional proteins.
They have been in-part characterized by their specific binding to CSA but not to CD36 or
ICAM-1 receptors expressed on CHO cells (see Fig. 12). The observed binding of the
recombinant varPAM proteins to CSA was also shown to be specific. Neither the
3D7chr5 DBL-γ nor Gb23a DBL-1α recombinant domains were found to bind CSA.
5.2.1.2 Inhibition of IE-CSA binding by the recombinant varPAM DBL-γ domains
Recombinant 482, 498 and 732 DBL-γ domains not only bound CSA in vitro, but they
also competitively inhibited the binding of IE to CSA in a concentration-dependent
manner (see Fig 13). The differences in the level of inhibition by the recombinant
domains may be attributed to the differences in amino acid sequence of the proteins.
Discussion 95
Costa et al. had earlier obtained similar observations where the recombinant proteins of
the FCR3CSA and 3D7 DBL-3γ proteins could bind CSA, but showed differences in
their capabilities to inhibit IE-CSA binding in vitro (Costa et al., 2003). It is not
understood why the 701 DBL-γ domain did not compete out IE-CSA binding despite its
affinity to CSA in vitro. Presumably, it only binds CSA weakly and is thus unable to
compete with the stronger IE-CSA interaction. Binding assays performed here are only
qualitative measurements and an interaction analysis using a surface resonance biosensor,
such as a BIAcore system, could be employed in future experiments to provide
quantitative information on the rate and affinity of each recombinant domain binding to
CSA (Horan et al., 1999; Maeda et al., 2003).
5.2.3 Immunological characterization of the recombinant varPAM DBL-γ domains
5.2.3.1 Pregnancy-specific of varPAM DBL-γ domains
Variant surface antigens (VSA), mainly PfEMP-1 variants encoded by var genes, are
targeted by the human immune system. Adults gradually become immune to clinical
malaria after repeated infections through the acquisition of a broad repertoire of anti-VSA
antibodies (Bull et al., 1998). One of the rationales behind this thesis was that var gene
products from placental isolates were similarly the target of immunity in the pregnant
woman. One first step was the evaluation of the immunogenicity of the cloned varPAM
DBL-γ domains in ELISA. Overall, some antigens analyzed were found to induce a
pregnancy-specific antibody response in the study cohort of African adults.
Discussion 96
5.2.3.2 Contribution of human antibodies in placenta infection control
Further analysis of the antibody responses in pregnant women showed that antibodies to
two of the domains, 482 and 732 BDL-γ, associated negatively with placenta parasite
density (see Fig. 14). This association was observed only with placental parasites but not
with parasites from peripheral blood. This finding implies a role of the antibodies in
controlling placental infection. For the first time, a link between a defined parasite CSA-
binding ligand and a decrease in placental parasitaemia is shown, thereby raising hopes in
the development of a subunit PAM vaccine based on a recombinant molecule.
Earlier works have shown an association between low placental parasitaemia and
high levels of antibodies that blocked adhesion of IE to CSA (Tuikue Ndam et al., 2004;
Taylor et al., 2004; Fried et al., 1998). Reported ELISA observations have currently only
been able to show an association between antibody response to DBL-6ε (a domain
encoded by var2csa gene) and low-birth-weight babies, a PAM complication (Salanti et
al., 2004). Human antibody response to 2O2CSAvar DBL-1α, CIDR-1α and DBL-2β
domains was not correlated with PAM complications (Jensen et al., 2003). Thus far,
decreasing placental parasitaemia has only been associated with anti-RESA and anti-
MSP1-19 antibody titers (Mvondo et al., 1992; Taylor et al., 2004; Astagneau et al.,
1994). The antibodies to RESA and MSP1-19 contribute to immune protection against
blood-stage parasite multiplication in the pregnant women but are not PAM-specific.
An unexpected observation worthy of discussion is the association of anti-482 and
anti-732 DBL-γ antibody titers with decreasing maternal haematocrit. In the first instance,
this appears to be contradictory to a protective role of the anti-482 and anti-732 DBL-γ
antibodies. One likely explanation would be that women in the study group have become
Discussion 97
infected by malaria parasites over a prolonged period, the consequence of which is a low
haematocrit level, but in being constantly exposed, the women are also simultaneously
mounting a sturdy antibody response to the antigens.
5.2.3.3 Absence of parity-dependent recognition
Human antibodies that recognize 482 and 732 DBL-γ domains do not display the parity-
dependent antibody recognition pattern. Flow cytometry measurements have shown that
antibodies from pregnant women recognize placental isolates as well as IE selected to
bind CSA in a gender- and parity-dependent manner. The level of recognition of these
anti-VSA antibodies correlated with protection of mothers from PAM as well as other
clinical complications of PAM such as maternal anaemia, low-birth-weight and
premature babies (O'Neil-Dunne et al., 2001; Duffy, Fried, 2003; Tuikue Ndam et al.,
2004; Staalsoe et al., 2004; Khattab et al., 2004).
However, the existence of adhesion blocking antibody that are independent of
parity and VSA recognition has been reported (Beeson et al., 2004; Tuikue Ndam et al.,
2004). These anti-adhesion antibodies appear to target distinct and overlapping epitopes
that are different from those recognized by anti-VSA antibodies measured in flow
cytometry (Beeson et al., 2004; Tuikue Ndam et al., 2004). Based on these findings, it is
postulated that anti-482 and anti-732 DBL-γ antibodies form a discrete population of
antibodies within those found in human plasma. They exist in small quantities in the
human plasma and are likely to be detected only in the presence of specific antigens.
Discussion 98
5.2.3.4 Generation of adhesion blocking antibodies in experimental animals
The recombinant 482 and 732 DBL-γ domains induced in experimental animals
adhesion-blocking antibodies that were IE strain independent. In IFA, these antibodies
recognize conserved epitopes on the surface of heterologous IECSA (see Fig. 17). These
results are consistent with those observed using antibodies generated against the
FCR3varCSA and 3D7chr5 DBL-3γ domains (Costa et al., 2003). Hence, these
experimentally induced anti-DBL-γ antibodies are probably similar in function to those
protective antibodies that are present in multiparous women.
The anti-482 DBL-γ polyclonal antibody can inhibit IE-CSA binding better than
the anti-732 DBL-γ polyclonal antibody (see Fig. 16) even though both antibodies stain
the IECSA surface efficiently (see Fig. 17). The anti-482 DBL-γ polyclonal antibody
shows a higher reactivity to heterologous DBL-γ domains compared to anti-732 DBL-3γ
polyclonal antibody, which was more specific to its homologous recombinant DBL-3γ
protein. These observations can be interpreted in the following way: the anti-482 DBL-γ
polyclonal antibody recognizes epitopes that are more conserved in DBL-γ domains,
whereas anti-732 DBL-3γ polyclonal antibody recognizes specific overlapping CSA-
binding epitopes. The different properties of the antibodies can alternatively be explained
by differences per se in the anti-DBL-γ antibody content (such as antibodies with
different specificities) defined by the individual host factors rather than being antigen-
dependent.
Discussion 99
5.2.4 Putative CSA-binding ligands
PAM is a complicated and not well-understood phenomenon. Several var genes have
been implicated to play a role in causing PAM (Buffet et al., 1999; Reeder et al., 1999;
Rowe et al., 2002; Salanti et al., 2003), however, to date conclusive evidence is still
lacking. In an attempt to resolve some of these issues, Rowe and Kyes recently suggested
a number of criteria that a PAM causing var gene product should fulfill, as listed in Table
1 (Rowe, Kyes, 2004). Properties of the different varPAM DBL-γ domains in relation to
the listed criteria are summarized in Table 8. Accordingly, the two 482 and 732 DBL-γ
domains appear to display most of the characteristics of a PAM ligand.
On the other hand, the 498 and 701 DBL-γ domains bind CSA in vitro but
antibodies to them do not associate with malaria complications. The fact that 498 and 701
DBL-γ domains were cloned from expressed var genes in placental isolates could mean
that these var genes are involved in PAM in other ways. It is likely, for example, that
there are multiple CSA-binding domains on the var genes. It has been shown that CIDR-
1α and DBL-X domains can bind CSA (Reeder et al., 2000; Degen et al., 2000; Gamain
et al., 2005). Evidence is also accumulating that there are other host receptors involved in
the host-parasite interaction.
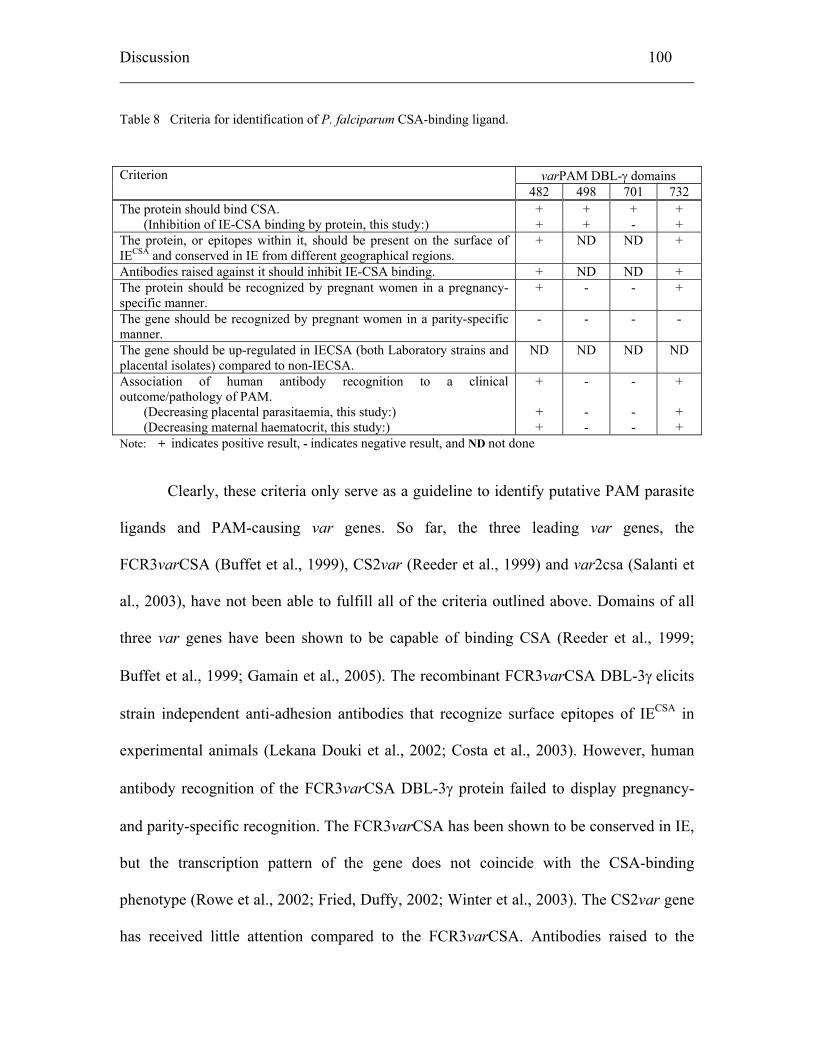
Discussion 100
Table 8 Criteria for identification of P. falciparum CSA-binding ligand.
varPAM DBL-γ domains Criterion 482 498 701 732
The protein should bind CSA. (Inhibition of IE-CSA binding by protein, this study:)
+ +
+ +
+ -
+ +
The protein, or epitopes within it, should be present on the surface of IECSA and conserved in IE from different geographical regions.
+ ND ND +
Antibodies raised against it should inhibit IE-CSA binding. + ND ND + The protein should be recognized by pregnant women in a pregnancy-specific manner.
+ - - +
The gene should be recognized by pregnant women in a parity-specific manner.
- - - -
The gene should be up-regulated in IECSA (both Laboratory strains and placental isolates) compared to non-IECSA.
ND ND ND ND
Association of human antibody recognition to a clinical outcome/pathology of PAM.
(Decreasing placental parasitaemia, this study:) (Decreasing maternal haematocrit, this study:)
+
+ +
- - -
- - -
+
+ +
Note: + indicates positive result, - indicates negative result, and ND not done
Clearly, these criteria only serve as a guideline to identify putative PAM parasite
ligands and PAM-causing var genes. So far, the three leading var genes, the
FCR3varCSA (Buffet et al., 1999), CS2var (Reeder et al., 1999) and var2csa (Salanti et
al., 2003), have not been able to fulfill all of the criteria outlined above. Domains of all
three var genes have been shown to be capable of binding CSA (Reeder et al., 1999;
Buffet et al., 1999; Gamain et al., 2005). The recombinant FCR3varCSA DBL-3γ elicits
strain independent anti-adhesion antibodies that recognize surface epitopes of IECSA in
experimental animals (Lekana Douki et al., 2002; Costa et al., 2003). However, human
antibody recognition of the FCR3varCSA DBL-3γ protein failed to display pregnancy-
and parity-specific recognition. The FCR3varCSA has been shown to be conserved in IE,
but the transcription pattern of the gene does not coincide with the CSA-binding
phenotype (Rowe et al., 2002; Fried, Duffy, 2002; Winter et al., 2003). The CS2var gene
has received little attention compared to the FCR3varCSA. Antibodies raised to the
Discussion 101
CS2var DBL-2γ domain inhibit IE-CSA binding (Reeder et al., 1999). Transcription of
CS2var gene consistently up-regulated in all IE strains regardless of their binding
phenotype (Rowe, Kyes, 2004). In contrast, the most recently characterized var2csa gene
has been shown to be up-regulated in IECSA. Moreover, human antibody recognition of
the DBL-6ε domain is pregnancy- and parity-specific. An equally important finding is
that pregnant women who have antibodies recognizing the var2csa DBL-6ε are at a lower
risk of giving birth to an underweight infant (Salanti et al., 2003; Salanti et al., 2004).
Despite these PAM-linked characteristics, to date there is no experimental evidence that
the var2csa encoded protein is on the surface of IE and inhibition of IE-CSA-binding by
anti-var2csa antibodies has not been shown. To further complicate matter, analyses of IE
membrane proteins by mass spectrometry have also indicated that CSA-binding or
placental isolates do not preferentially express FCR3varCSA, CS2var or var2csa gene
products, but rather novel PfEMP-1 sequences (Fried et al., 2004). In summary, there are
probably at least two possibilities to explain why none of the var genes characterized to
date has been successfully identified as the gene involved in causing PAM. The
responsible var gene (if indeed a var gene plays an active role) has so far eluded
identification. Alternatively, there are more than one var gene product linked to the
disease.
Discussion 102
5.3 Analysis of 732var gene originating from a placental isolate
The 732var gene described in this thesis is a novel var gene. Most importantly, it
originates from a placenta-infecting isolate in contrast to FCR3varCSA, CS2var and
var2CSA, which were isolated from laboratory-adapted strains. It has a unique domain
organization not seen before in any of the var genes described in the 3D7 reference strain.
This is indicative that differences in var genes between laboratory strains and field
isolates exist, thereby emphasizing the importance of extending var-related studies
beyond laboratory strains.
5.3.1 732var domain organization as type 15 var gene
The first exon of the 732var encodes four DBL and one CIDR domains in the following
order: DBL-1α, CIDR-1α, DBL-2β, -3γ and -4ε domains (see Fig 18). The domain
organization of the 732var gene is most similar to that of the type 15 var gene (Gardner
et al., 2002), differing only by the presence of an additional DBL-4ε domain in the
732var gene. An analysis of the 732var gene showed that it has relatively low homology
with the FCR3varCSA and CS2var genes, with overall identities of 42 % and 28 %,
respectively (Chia et al., 2005).
5.3.2 Conservation of the minimal CD36-binding region in 732var
Some DBL and CIDR domains of the PfEMP-1 molecule have been assigned adhesive
roles, possibly related to cytoadhesion of the IE (Smith, Craig, 2005). Examples of host
receptors to which the DBL and CIDR domains bind are CR1, CD36, ICAM-1 and CSA
(Smith et al., 2001). Miller et al. have shown that the CD36-binding minimal region of
Discussion 103
the CIDR-α domains of A4var, A4tres and MCvar genes lies within the central region of
the domain (Miller et al., 2002). A recombinant protein consisting of the CD36-minimal
binding region produced from MCvar has been shown to be able to inhibit adhesion of IE
to CD36 under flow condition (Yipp et al., 2003). This was interpreted to mean that the
region of the MCvar CIDR-1α (by inference, also the other two CIDR-1α) is essential
for CD36 binding. This region is conserved in 732 CIDR-1α.
Gamain et al. have mapped the minimal CSA-binding region of the FCR3CSA
DBL-3γ to a 67-amino acid stretch located in the C-terminal region (Gamain et al., 2004).
This 67-amino acid stretch is not conserved in the 732 DBL-3γ, even though it has
significant amino acid identity to the equivalent segments of the IT-29var and the
3D7chr5 DBL-3γ domains, both known to bind CSA. However, significance of this
stretch of amino acids remains unclear particularly since such stretches are also present in
other DBL-γ domains that do not bind CSA (Gamain et al., 2004; Gamain et al., 2005).
The varPAM DBL-γ domains from placental isolates that were examined by Khattab et al.
were capable of binding CSA, even though they were truncated in the C-terminal ends
and hence did not encompass the apparent CSA-binding motif (Khattab et al., 2001).
These observations indicate the presence of additional CSA-binding sites within the
central two-thirds of the DBL-γ domains. Further structural characteristics of DBL-γ
domains and their interaction with the CSA-receptor remain to be defined.
Discussion 104
5.3.3 Biochemical characterization of the recombinant 732var domains
5.3.3.1 Production of functional CIDR-1α and DBL-3γ domains
CD36-, ICAM-1- and CSA-binding properties of several different PfEMP1 molecules has
been localized to the CIDR-1α, DBL-β and DBL-γ domains, respectively. In an initial
approach to identify adhesive interactions on the 732var gene, recombinant domains were
tested on receptors expressed on CHO cells. From binding assays, it was observed that
CIDR-1α and DBL-3γ bound to CD36- and CSA-receptors, respectively, but DBL-2β did
not bind any receptors tested (see Fig. 22). The binding of CIDR-1α can be explained by
the presence of the CD36-binding minimal region, as illustrated in Section 4.3.2.1. Even
though the DBL-3γ recombinant protein does not contain the postulated minimal CSA-
binding region it can still bind CSA. This is probably through the presence of alternate
binding sites. The DBL-2β did not bind ICAM-1 receptors. The missing C2 region
downstream of the DBL-2β domain is believed to restrict ICAM-1-binding, as an
interdependence between the two has been previously reported (Chattopadhyay et al.,
2004; Springer et al., 2004). It is also likely that the 732var gene product does not contain
an active ICAM-1-binding DBL-2β domain, as the var gene was isolated from a placental
strain (Khattab et al., 2001; Chia et al., 2005), and in line with the observation that the
majority of placental isolates has no ICAM-1 binding phenotype. The lack of ICAM-1-
binding capacity has been reported in the DBL-2β domain of the A4var gene (Smith et al.,
1998). Neither DBL-1α nor -4ε bound any of the three receptors tested. Since other
receptors such as heparan sulfate A and CR1 were not tested in the framework of this
thesis, the binding activity of the recombinant 732 DBL-1α remains unknown. To date no
Discussion 105
known interacting partner has been demonstrated for DBL-ε domains (Smith, Craig,
2005).
5.3.3.2 Inhibition of IE binding by the recombinant 732var domains
Results described in this thesis have demonstrated that the CIDR-1α and DBL-3γ
domains are not only capable of binding to CD36 and CSA receptors, respectively, but
that the proteins can also compete with IE for receptor binding (see Fig. 24). This IE-
receptor inhibition exerted by the recombinant domains was not due to unspecific
protein-protein interaction. For example, DBL-3γ did not affect the binding of
FCR3CD36 to CHO-CD36, nor did CIDR-1α interfere with the binding of FCR3CSA to
CHO-CSA. Similar observations were reported for the 179-amino acid MCvar CIDR-1α
where the recombinant protein under flow conditions not only inhibited binding of IE to
CD36 but also was able to detache previously adhered clinical isolates from CD36 under
flow conditions (Yipp et al., 2003).
5.3.4 Immunological characterization of the recombinant 732var domains
5.3.4.1 Pregnant specificity of 732var recombinant domains
The immunogenicity of the panel of recombinant proteins was analyzed in ELISA. The
levels of antibodies to DBL-1α and -3γ were higher in pregnant women when compared
to African adults (men but also nulliparous women). DBL-γ domain has been implicated
with a role in PAM; therefore, it was not surprising to observe a stronger reactivity to the
732 DBL-3γ domain by pregnant women antibodies. The pregnancy-specific antibody
Discussion 106
recognition to DBL-1α is not so clear, since the function of this domain in placental
infection and the role of the antibodies in PAM are still unknown.
5.3.4.2 Association of antibodies with parasitaemia
In the analysis of placental parasitaemia, anti-DBL-3γ and CIDR-1α antibody titres
showed contradictory correlations (see Fig. 25). While the former is negatively associated
with parasite density, the latter is positively associated. It is speculated that anti-DBL-3γ
antibodies help to curb the progression of the disease by controlling placental parasite
infection. While a direct protective role of human antibodies that recognise CIDR-1α is
not obvious, the simplest explanation would be that these antibodies are part of the
general repertoire of antibodies produced by women in response to malaria infection but
are not specifically induced during PAM.
5.3.5 IE surface expression of 732 DBL-3γ domains
Results of live IFA presented here show that anti-DBL-3γ polyclonal antibodies raised in
experimental animals are pan reactive, that is to say they are able to recognize the surface
of IE from different parasite strains (see Fig. 17). Based on this observation, it can be
postulated that the DBL-3γ domain generally has a surface localization and the antibodies
recognize one or more epitopes on this protein domain that appear to be conserved on the
surface of heterologous IECSA strains.
Discussion 107
5.3.6 732var and the dichotomy in CSA and CD36 binding
The 732var codes for two active domains, namely the CIDR-1α and DBL-γ domains
exhibiting active binding properties. So far, all placental isolates have been reported to
bind to CSA. To date, none of the PAM implicated var genes known to possess CIDR-1α
domains with functional CD36-binding properties (Reeder et al., 2000; Robinson et al.,
2003). The var genes instead have been reported to express multiple adhesive domains,
such as CIDR-α and DBL-X, that has been reported to bind CSA (Reeder et al., 2000;
Robinson et al., 2003; Gamain et al., 2005). Therefore, the in vivo function of the 732var
encoded CIDR-1α domain that binds CD36 in PAM is unknown. In general, the
syncytiotrophoblast cells lining the placenta lack the capacity of CD36 expression.
Moreover, ex vivo desequestration of placental IE using anti-CD36 antibodies in lieu of
soluble CSA was not successful (Gysin et al., 1999). CIDR-1α is a multiple-adhesive
domain and has been shown to bind CD36 (Gamain et al., 2002; Smith et al., 1998) and
CSA (Reeder et al., 2000; Degen et al., 2000). However, CIDR-1α domains of placental
origins mostly bind CSA (Reeder et al., 2000; Degen et al., 2000), although there are also
some with no CSA-binding property (Robinson et al., 2003).
The binding capacities of 732var domains are similar to those of the A4tres gene.
The CIDR-1α and DBL-3γ domains of the A4tres var gene bind to CD36 and CSA,
respectively (Smith et al., 1998; Gamain et al., 2002). The parasite from which the A4tres
gene was isolated from binds CD36. The presence of a DBL-3γ domain in the gene has
no apparent influence on the binding phenotype of the parasite and current observations
appear to support the hypothesis that two different binding phenotypes cannot co-exist
within the same PfEMP-1 molecule. The exclusive CD36-binding capacity of the A4tres
Discussion 108
gene product has been explained by a direct domain-domain interaction of the DBL-2β
with either CIDR-1α or DBL-3γ domains to discriminate the binding phenotype.
Alternatively, it can also be explained by the modification of one of the active domains to
suppress the adhesive properties of the other (Smith et al., 1998). This may hold true for
the 732var gene to favour a CSA-binding phenotype.
5.3.6.1 Implication of 732var in PAM
In this study, recombinant 732var gene domains have been extensively characterized, and
two of the domains, CIDR-1α and DBL-3γ, have been shown to bind CD36 and CSA,
respectively. Pregnant women antibodies that recognize the former domain are
hypothesized to indicate the presence of an infection. Iin contrast, antibodies that
recognize the latter domain appear to help control placental infection and hence the
disease. These observations suggest that both domains are involved in the pathogenesis of
PAM.
The discovery of new var genes, such as var2CSA (Salanti et al., 2003; Salanti et
al., 2004), and new binding phenotypes of PfEMP-1 domains, such as binding of CSA by
CIDR-α, DBL-X and DBL-ε domains (Degen et al., 2000), have underscored the limited
understanding of var genes and their functional constraints for adhesion to receptors.
Studies of additional var genes especially those originating from field isolates, such as
the 732var, is important for the basic understanding of the pathogenesis of malaria in the
pregnant woman and her newborn. This in turn, contributes to a broader picture of
adhesive interactions of parasites with host receptors, all of which will have implications
for the ongoing efforts in the design of a PAM vaccine.
6. Summary 109
6. Summary
The accumulation of infected erythrocytes (IE) in the placenta is a key feature of
pregnancy-associated malaria (PAM). The first receptor molecule shown to be
responsible for cytoadhesion in the syncytiotrophoblast lining of the placenta is
chondroitin sulfate A (CSA). When a woman is infected during pregnancy, she develops
anti-adhesion antibodies that are strain-independent of the infecting IE, indicating that a
conserved parasite ligand is in effect mediating the binding to CSA. The first putative
parasite ligand proposed in the host-parasite interaction was a domain present on the
protein PfEMP-1, a major variant surface antigen encoded by the multicopy var gene
family. The ligand in play was the DBL-γ domain, first identified from two var genes, the
FCR3varCSA gene and CS2var gene.
The first part of this thesis concerns the study of four different DBL-γ protein
domains (482, 498, 701 and 732 DBL-γ domains), named after the numbers given to each
of the placental isolates from which they originate. These domains, collectively called
varPAM DBL-γ were previously demonstrated to bind CSA. As an extension of this
study, my work here showed that immune recognition of 482 and 732 DBL-γ domains by
plasma samples from a pregnant women cohort is pregnancy-specific. Pregnant women
who have higher antibody reactivities to these two domains appear to be less vulnerable
to placental infections. Based on these findings, it is postulated that 482 and 732 DBL-γ
domains contain some important epitopes for CSA-binding, that are probably also the
target of protective maternal antibodies. So far, evidence has also accumulated to show
that other PfEMP-1 domains like CIDR-α and DBL-X can interact with CSA. This
6. Summary 110
supports the notion that CSA-binding motifs are probably structurally very similar to
each other, differing only in their primary amino acid sequences. Studying the physico-
chemical behaviour of these domains, eventually leading to an elucidation of their crystal
structures, will help to unfold basic structural requirements for CSA binding.
The different domains from the full-length 732var gene, which comprises four
DBL domains and one CIDR domain were characterized in the second part of this thesis.
Interestingly, two of these domains, CIDR-1α and DBL-3γ, were shown to bind CD36
and CSA receptors, respectively. Given that the majority of placental parasites are
generally known to bind CSA only, the observed CD36 recognition was an unexpected
finding. The molecular mechanism that suppresses the adhesive characteristic of CIDR-
1α within a CSA-binding PfEMP-1 molecule is unknown. Therefore, future work could
be directed at understanding this mechanism responsible for the dichotomy in adhesion.
When analyzed for their reactivities with pregnant women sera in ELISA, the two
domains showed differential antibody recognition. Specifically, the level of antibodies to
recombinant 732 DBL-3γ correlated with a decrease of parasite density in the placenta. In
contrast, anti-CIDR-1α antibody titres increased with placental parasite density. From
this result, it is tempting to conclude that antibodies to DBL-3γ may play a role in
protecting a woman from placental infections. However, what remains a riddle is the
immunological significance of the presence of antibodies to CIDR-1α in PAM
In summary, results presented in this thesis provide a basis for further
understanding molecular mechanisms of CSA-cytoadhesion and development of
immunity in pregnant women, and may have important implications in the search for a
PAM vaccine. .
References 111
Reference List
Achur RN, Valiyaveettil M, Alkhalil A, Ockenhouse CF, Gowda DC. 2000. Characterization of proteoglycans of human placenta and identification of unique chondroitin sulfate proteoglycans of the intervillous spaces that mediate the adherence of Plasmodium falciparum-infected erythrocytes to the placenta. J Biol Chem 275:40344-40356.
Andrews KT, Lanzer M. 2002. Maternal malaria: Plasmodium falciparum sequestration in the placenta. Parasitol Res 88:715-723.
Astagneau P, Steketee RW, Wirima JJ, Khoromana CO, Millet P. 1994. Antibodies to ring-infected erythrocyte surface antigen (Pf155/RESA) protect against P. falciparum parasitemia in highly exposed multigravidas women in Malawi. Acta Trop 57:317-325.
Barnwell JW, Asch AS, Nachman RL, Yamaya M, Aikawa M, Ingravallo P. 1989. A human 88-kD membrane glycoprotein (CD36) functions in vitro as a receptor for a cytoadherence ligand on Plasmodium falciparum-infected erythrocytes. J Clin Invest 84:765-772.
Beeson JG, Brown GV. 2004. Plasmodium falciparum-infected erythrocytes demonstrate dual specificity for adhesion to hyaluronic acid and chondroitin sulfate A and have distinct adhesive properties. J Infect Dis 189:169-179.
Beeson JG, Duffy PE. 2005. The immunology and pathogenesis of malaria during pregnancy. Curr Top Microbiol Immunol 297:187-227.
Beeson JG, Mann EJ, Elliott SR, Lema VM, Tadesse E, Molyneux ME, Brown GV, Rogerson SJ. 2004. Antibodies to variant surface antigens of Plasmodium falciparum-infected erythrocytes and adhesion inhibitory antibodies are associated with placental malaria and have overlapping and distinct targets. J Infect Dis 189:540-551.
Beeson JG, Rogerson SJ, Cooke BM, Reeder JC, Chai W, Lawson AM, Molyneux ME, Brown GV. 2000. Adhesion of Plasmodium falciparum-infected erythrocytes to hyaluronic acid in placental malaria. Nat Med 6:86-90.
Berendt AR, Simmons DL, Tansey J, Newbold CI, Marsh K. 1989. Intercellular adhesion molecule-1 is an endothelial cell adhesion receptor for Plasmodium falciparum. Nature 341:57-59.
Biggs BA, Kemp DJ, Brown GV. 1989. Subtelomeric chromosome deletions in field isolates of Plasmodium falciparum and their relationship to loss of cytoadherence in vitro. Proc Natl Acad Sci U S A 86:2428-2432.
References 112
Brabin BJ, Romagosa C, Abdelgalil S, Menendez C, Verhoeff FH, McGready R, Fletcher KA, Owens S, D'Alessandro U, Nosten F, Fischer PR, Ordi J. 2004. The sick placenta-the role of malaria. Placenta 25:359-378.
Brabin BJ. 1983. An analysis of malaria in pregnancy in Africa. Bull World Health Organ 61:1005-1016.
Buffet PA, Gamain B, Scheidig C, Baruch D, Smith JD, Hernandez-Rivas R, Pouvelle B, Oishi S, Fujii N, Fusai T, Parzy D, Miller LH, Gysin J, Scherf A. 1999. Plasmodium falciparum domain mediating adhesion to chondroitin sulfate A: a receptor for human placental infection. Proc Natl Acad Sci U S A 96:12743-12748.
Bull PC, Lowe BS, Kortok M, Molyneux CS, Newbold CI, Marsh K. 1998. Parasite antigens on the infected red cell surface are targets for naturally acquired immunity to malaria. Nat Med 4:358-360.
Chattopadhyay R, Taneja T, Chakrabarti K, Pillai CR, Chitnis CE. 2004. Molecular analysis of the cytoadherence phenotype of a Plasmodium falciparum field isolate that binds intercellular adhesion molecule-1. Mol Biochem Parasitol 133:255-265.
Chen Q, Fernandez V, Sundstrom A, Schlichtherle M, Datta S, Hagblom P, Wahlgren M. 1998. Developmental selection of var gene expression in Plasmodium falciparum. Nature 394:392-395.
Chia YS, Badaut C, Tuikue Ndam NG, Khattab A, Igonet S, Fievet N, Bentley GA, Deloron P, Klinkert MQ. 2005. Functional and Immunological Characterization of a Duffy Binding-Like- gamma Domain from Plasmodium falciparum Erythrocyte Membrane Protein-1 Expressed by a Placental Isolate. J Infect Dis 192:1284-1293.
Costa FT, Fusai T, Parzy D, Sterkers Y, Torrentino M, Douki JB, Traore B, Petres S, Scherf A, Gysin J. 2003. Immunization with recombinant duffy binding-like-gamma3 induces pan-reactive and adhesion-blocking antibodies against placental chondroitin sulfate A-binding Plasmodium falciparum parasites. J Infect Dis 188:153-164.
Crabb BS, Cooke BM, Reeder JC, Waller RF, Caruana SR, Davern KM, Wickham ME, Brown GV, Coppel RL, Cowman AF. 1997. Targeted gene disruption shows that knobs enable malaria-infected red cells to cytoadhere under physiological shear stress. Cell 89:287-296.
Craig A, Scherf A. 2001. Molecules on the surface of the Plasmodium falciparum infected erythrocyte and their role in malaria pathogenesis and immune evasion. Mol Biochem Parasitol 115:129-143.
Degen R, Weiss N, Beck HP. 2000. Plasmodium falciparum: cloned and expressed CIDR domains of PfEMP1 bind to chondroitin sulfate A. Exp Parasitol 95:113-121.
Deitsch KW, Wellems TE. 1996. Membrane modifications in erythrocytes parasitized by Plasmodium falciparum. Mol Biochem Parasitol 76:1-10.
References 113
Duffy MF, Brown GV, Basuki W, Krejany EO, Noviyanti R, Cowman AF, Reeder JC. 2002. Transcription of multiple var genes by individual, trophozoite-stage Plasmodium falciparum cells expressing a chondroitin sulphate A binding phenotype. Mol Microbiol 43:1285-1293.
Duffy PE, Fried M. 2001. Biomedicine. Turncoat antibodies. Science 293:2009-2010.
Duffy PE, Fried M. 2003. Antibodies that inhibit Plasmodium falciparum adhesion to chondroitin sulfate A are associated with increased birth weight and the gestational age of newborns. Infect Immun 71:6620-6623.
Esko JD, Stewart TE, Taylor WH. 1985. Animal cell mutants defective in glycosaminoglycan biosynthesis. Proc Natl Acad Sci U S A 82:3197-3201.
Fernandez-Reyes D, Craig AG, Kyes SA, Peshu N, Snow RW, Berendt AR, Marsh K, Newbold CI. 1997. A high frequency African coding polymorphism in the N-terminal domain of ICAM-1 predisposing to cerebral malaria in Kenya. Hum Mol Genet 6:1357-1360.
Fleming AF. 1989. Tropical obstetrics and gynaecology. 1. Anaemia in pregnancy in tropical Africa. Trans R Soc Trop Med Hyg 83:441-448.
Flick K, Scholander C, Chen Q, Fernandez V, Pouvelle B, Gysin J, Wahlgren M. 2001. Role of nonimmune IgG bound to PfEMP1 in placental malaria. Science 293:2098-2100.
Fried M, Duffy PE. 1996. Adherence of Plasmodium falciparum to chondroitin sulfate A in the human placenta. Science 272:1502-1504.
Fried M, Duffy PE. 2002. Two DBLgamma subtypes are commonly expressed by placental isolates of Plasmodium falciparum. Mol Biochem Parasitol 122:201-210.
Fried M, Nosten F, Brockman A, Brabin BJ, Duffy PE. 1998. Maternal antibodies block malaria. Nature 395:851-852.
Fried M, Wendler JP, Mutabingwa TK, Duffy PE. 2004. Mass spectrometric analysis of Plasmodium falciparum erythrocyte membrane protein-1 variants expressed by placental malaria parasites. Proteomics 4:1086-1093.
Gamain B, Gratepanche S, Miller LH, Baruch DI. 2002. Molecular basis for the dichotomy in Plasmodium falciparum adhesion to CD36 and chondroitin sulfate A. Proc Natl Acad Sci U S A 99:10020-10024.
Gamain B, Smith JD, Avril M, Baruch DI, Scherf A, Gysin J, Miller LH. 2004. Identification of a 67-amino-acid region of the Plasmodium falciparum variant surface antigen that binds chondroitin sulphate A and elicits antibodies reactive with the surface of placental isolates. Mol Microbiol 53:445-455.
References 114
Gamain B, Trimnell AR, Scheidig C, Scherf A, Miller LH, Smith JD. 2005. Identification of Multiple Chondroitin Sulfate A (CSA)-Binding Domains in the var2CSA Gene Transcribed in CSA-Binding Parasites. J Infect Dis 191:1010-1013.
Gardner MJ, Hall N, Fung E, White O, Berriman M, Hyman RW, Carlton JM, Pain A, Nelson KE, Bowman S, Paulsen IT, James K, Eisen JA, Rutherford K, Salzberg SL, Craig A, Kyes S, Chan MS, Nene V, Shallom SJ, Suh B, Peterson J, Angiuoli S, Pertea M, Allen J, Selengut J, Haft D, Mather MW, Vaidya AB, Martin DM, Fairlamb AH, Fraunholz MJ, Roos DS, Ralph SA, McFadden GI, Cummings LM, Subramanian GM, Mungall C, Venter JC, Carucci DJ, Hoffman SL, Newbold C, Davis RW, Fraser CM, Barrell B. 2002. Genome sequence of the human malaria parasite Plasmodium falciparum. Nature 419:498-511.
Gysin J, Pouvelle B, Fievet N, Scherf A, Lepolard C. 1999. Ex vivo desequestration of Plasmodium falciparum-infected erythrocytes from human placenta by chondroitin sulfate A. Infect Immun 67:6596-6602.
Haldar K, Mohandas N, Samuel BU, Harrison T, Hiller NL, Akompong T, Cheresh P. 2002. Protein and lipid trafficking induced in erythrocytes infected by malaria parasites. Cell Microbiol 4:383-395.
Heddini A, Pettersson F, Kai O, Shafi J, Obiero J, Chen Q, Barragan A, Wahlgren M, Marsh K. 2001. Fresh isolates from children with severe Plasmodium falciparum malaria bind to multiple receptors. Infect Immun 69:5849-5856.
Horan N, Yan L, Isobe H, Whitesides GM, Kahne D. 1999. Nonstatistical binding of a protein to clustered carbohydrates. Proc Natl Acad Sci U S A 96:11782-11786.
Horrocks P, Pinches RA, Chakravorty SJ, Papakrivos J, Christodoulou Z, Kyes SA, Urban BC, Ferguson DJ, Newbold CI. 2005. PfEMP1 expression is reduced on the surface of knobless Plasmodium falciparum infected erythrocytes. J Cell Sci 118:2507-2518.
Hviid L. 1998. Clinical disease, immunity and protection against Plasmodium falciparum malaria in populations living in endemic areas. Expert Rev Mol Med 1998:1-10.
Jensen AT, Zornig HD, Buhmann C, Salanti A, Koram KA, Riley EM, Theander TG, Hviid L, Staalsoe T. 2003. Lack of gender-specific antibody recognition of products from domains of a var gene implicated in pregnancy-associated Plasmodium falciparum malaria. Infect Immun 71:4193-4196.
Khattab A, Kremsner PG, Klinkert MQ. 2003. Common surface-antigen var genes of limited diversity expressed by Plasmodium falciparum placental isolates separated by time and space. J Infect Dis 187:477-483.
Khattab A, Kun J, Deloron P, Kremsner PG, Klinkert MQ. 2001. Variants of Plasmodium falciparum erythrocyte membrane protein 1 expressed by different placental parasites are closely related and adhere to chondroitin sulfate A. J Infect Dis 183:1165-1169.
References 115
Khattab A, Reinhardt C, Staalsoe T, Fievet N, Kremsner PG, Deloron P, Hviid L, Klinkert MQ. 2004. Analysis of IgG with specificity for variant surface antigens expressed by placental Plasmodium falciparum isolates. Malar J 3:21.
Kristoffersen EK, Matre R. 1996. Co-localization of the neonatal Fc gamma receptor and IgG in human placental term syncytiotrophoblasts. Eur J Immunol 26:1668-1671.
Kyes SA, Christodoulou Z, Raza A, Horrocks P, Pinches R, Rowe JA, Newbold CI. 2003. A well-conserved Plasmodium falciparum var gene shows an unusual stage-specific transcript pattern. Mol Microbiol 48:1339-1348.
Lanzer M, Wertheimer SP, de Bruin D, Ravetch JV. 1994. Chromatin structure determines the sites of chromosome breakages in Plasmodium falciparum. Nucleic Acids Res 22:3099-3103.
Lekana Douki JB, Traore B, Costa FT, Fusai T, Pouvelle B, Sterkers Y, Scherf A, Gysin J. 2002. Sequestration of Plasmodium falciparum-infected erythrocytes to chondroitin sulfate A, a receptor for maternal malaria: monoclonal antibodies against the native parasite ligand reveal pan-reactive epitopes in placental isolates. Blood 100:1478-1483.
Lyden TW, Robinson JM, Tridandapani S, Teillaud JL, Garber SA, Osborne JM, Frey J, Budde P, Anderson CL. 2001. The Fc receptor for IgG expressed in the villus endothelium of human placenta is Fc gamma RIIb2. J Immunol 166:3882-3889.
Maeda N, He J, Yajima Y, Mikami T, Sugahara K, Yabe T. 2003. Heterogeneity of the chondroitin sulfate portion of phosphacan/6B4 proteoglycan regulates its binding affinity for pleiotrophin/heparin binding growth-associated molecule. J Biol Chem 278:35805-35811.
McGregor IA. 1984. Epidemiology, malaria and pregnancy. Am J Trop Med Hyg 33:517-525.
Miller LH, Hudson-Taylor D, Gamain B, Saul AJ. 2002. Definition of the minimal domain of CIDR1alpha of Plasmodium falciparum PfEMP1 for binding CD36. Mol Biochem Parasitol 120:321-323.
Muthusamy A, Achur RN, Valiyaveettil M, Madhunapantula SV, Kakizaki I, Bhavanandan VP, Gowda CD. 2004. Structural characterization of the bovine tracheal chondroitin sulfate chains and binding of Plasmodium falciparum-infected erythrocytes. Glycobiology 14:635-645.
Mvondo JL, James MA, Sulzer AJ, Campbell CC. 1992. Malaria and pregnancy in Cameroonian women. Naturally acquired antibody responses to asexual blood-stage antigens and the circumsporozoite protein of Plasmodium falciparum. Trans R Soc Trop Med Hyg 86:486-490.
References 116
Nagao E, Kaneko O, Dvorak JA. 2000. Plasmodium falciparum-infected erythrocytes: qualitative and quantitative analyses of parasite-induced knobs by atomic force microscopy. J Struct Biol 130:34-44.
Oguariri RM, Borrmann S, Klinkert MQ, Kremsner PG, Kun JF. 2001. High prevalence of human antibodies to recombinant Duffy binding-like alpha domains of the Plasmodium falciparum-infected erythrocyte membrane protein 1 in semi-immune adults compared to that in nonimmune children. Infect Immun 69:7603-7609.
O'Neil-Dunne I, Achur RN, Agbor-Enoh ST, Valiyaveettil M, Naik RS, Ockenhouse CF, Zhou A, Megnekou R, Leke R, Taylor DW, Gowda DC. 2001. Gravidity-dependent production of antibodies that inhibit binding of Plasmodium falciparum-infected erythrocytes to placental chondroitin sulfate proteoglycan during pregnancy. Infect Immun 69:7487-7492.
Pouvelle B, Meyer P, Robert C, Bardel L, Gysin J. 1997. Chondroitin-4-sulfate impairs in vitro and in vivo cytoadherence of Plasmodium falciparum infected erythrocytes. Mol Med 3:508-518.
Reeder JC, Cowman AF, Davern KM, Beeson JG, Thompson JK, Rogerson SJ, Brown GV. 1999. The adhesion of Plasmodium falciparum-infected erythrocytes to chondroitin sulfate A is mediated by P. falciparum erythrocyte membrane protein 1. Proc Natl Acad Sci U S A 96:5198-5202.
Reeder JC, Hodder AN, Beeson JG, Brown GV. 2000. Identification of glycosaminoglycan binding domains in Plasmodium falciparum erythrocyte membrane protein 1 of a chondroitin sulfate A-adherent parasite. Infect Immun 68:3923-3926.
Ricke CH, Staalsoe T, Koram K, Akanmori BD, Riley EM, Theander TG, Hviid L. 2000. Plasma antibodies from malaria-exposed pregnant women recognize variant surface antigens on Plasmodium falciparum-infected erythrocytes in a parity-dependent manner and block parasite adhesion to chondroitin sulfate A. J Immunol 165:3309-3316.
Robinson BA, Welch TL, Smith JD. 2003. Widespread functional specialization of Plasmodium falciparum erythrocyte membrane protein 1 family members to bind CD36 analysed across a parasite genome. Mol Microbiol 47:1265-1278.
Rogerson SJ, Beeson JG, Mhango CG, Dzinjalamala FK, Molyneux ME. 2000. Plasmodium falciparum rosette formation is uncommon in isolates from pregnant women. Infect Immun 68:391-393.
Rogerson SJ, Chaiyaroj SC, Ng K, Reeder JC, Brown GV. 1995. Chondroitin sulfate A is a cell surface receptor for Plasmodium falciparum-infected erythrocytes. J Exp Med 182:15-20.
Rowe JA, Obeiro J, Newbold CI, Marsh K. 1995. Plasmodium falciparum rosetting is associated with malaria severity in Kenya. Infect Immun 63:2323-2326.
References 117
Rowe JA, Kyes SA, Rogerson SJ, Babiker HA, Raza A. 2002. Identification of a conserved Plasmodium falciparum var gene implicated in malaria in pregnancy. J Infect Dis 185:1207-1211.
Rowe JA, Kyes SA. 2004. The role of Plasmodium falciparum var genes in malaria in pregnancy. Mol Microbiol 53:1011-1019.
Rowe JA, Moulds JM, Newbold CI, Miller LH. 1997. P. falciparum rosetting mediated by a parasite-variant erythrocyte membrane protein and complement-receptor 1. Nature 388:292-295.
Rubio JP, Thompson JK, Cowman AF. 1996. The var genes of Plasmodium falciparum are located in the subtelomeric region of most chromosomes. EMBO J 15:4069-4077.
Salanti A, Dahlbäck M, Turner L, Nielsen MA, Barfod L, Magistrado P, Jensen ATR, Lavstsen T, Ofori MF, Marsch K, Hviid L, Theander TG. 2004. Evidence for the involvement of var2CSA in pregnancy-associated malaria. J Exp Med 200.
Salanti A, Staalsoe T, Lavstsen T, Jensen AT, Sowa MP, Arnot DE, Hviid L, Theander TG. 2003. Selective upregulation of a single distinctly structured var gene in chondroitin sulphate A-adhering Plasmodium falciparum involved in pregnancy-associated malaria. Mol Microbiol 49:179-191.
Scherf A, Hernandez-Rivas R, Buffet P, Bottius E, Benatar C, Pouvelle B, Gysin J, Lanzer M. 1998. Antigenic variation in malaria: in situ switching, relaxed and mutually exclusive transcription of var genes during intra-erythrocytic development in Plasmodium falciparum. EMBO J 17:5418-5426.
Scholander C, Treutiger CJ, Hultenby K, Wahlgren M. 1996. Novel fibrillar structure confers adhesive property to malaria-infected erythrocytes. Nat Med 2:204-208.
Smith JD, Craig AG. 2005. The surface of the Plasmodium falciparum-infected erythrocyte. Curr Issues Mol Biol 7:81-93. Smith JD, Gamain B, Baruch DI, Kyes S. 2001. Decoding the language of var genes and Plasmodium falciparum sequestration. Trends Parasitol 17:538-545.
Smith JD, Kyes S, Craig AG, Fagan T, Hudson-Taylor D, Miller LH, Baruch DI, Newbold CI. 1998. Analysis of adhesive domains from the A4VAR Plasmodium falciparum erythrocyte membrane protein-1 identifies a CD36 binding domain. Mol Biochem Parasitol 97:133-148.
Smith JD, Subramanian G, Gamain B, Baruch DI, Miller LH. 2000. Classification of adhesive domains in the Plasmodium falciparum erythrocyte membrane protein 1 family. Mol Biochem Parasitol 110:293-310.
Snow RW, Guerra CA, Noor AM, Myint HY, Hay SI. 2005. The global distribution of clinical episodes of Plasmodium falciparum malaria. Nature 434:214-217.
References 118
Springer AL, Smith LM, Mackay DQ, Nelson SO, Smith JD. 2004. Functional interdependence of the DBLbeta domain and c2 region for binding of the Plasmodium falciparum variant antigen to ICAM-1. Mol Biochem Parasitol 137:55-64.
Staalsoe T, Shulman CE, Bulmer JN, Kawuondo K, Marsh K, Hviid L. 2004. Variant surface antigen-specific IgG and protection against clinical consequences of pregnancy-associated Plasmodium falciparum malaria. Lancet 363:283-289.
Taylor DW, Zhou A, Marsillio LE, Thuita LW, Leke EB, Branch O, Gowda DC, Long C, Leke RF. 2004. Antibodies that inhibit binding of Plasmodium falciparum-infected erythrocytes to chondroitin sulfate A and to the C terminus of merozoite surface protein 1 correlate with reduced placental malaria in Cameroonian women. Infect Immun 72:1603-1607.
Taylor TE, Strickland GT. 2000. Malaria. In: Strickland GT, ed. Hunter's tropical medicine and emerging infectious diseases. Pennsylvania: W.B. Saunder's Company. pp 614-643.
Tjio JH, Puck TT. 1958. Genetics of somatic mammalian cells. II. Chromosomal constitution of cells in tissue culture. J Exp Med 108:259-268.
Tuikue Ndam NG, Fievet N, Bertin G, Cottrell G, Gaye A, Del P. 2004. Variable adhesion abilities and overlapping antigenic properties in placental Palsmodium falciparum isolates. J Infect Dis In Press.
Turner GD, Morrison H, Jones M, Davis TM, Looareesuwan S, Buley ID, Gatter KC, Newbold CI, Pukritayakamee S, Nagachinta B, . 1994. An immunohistochemical study of the pathology of fatal malaria. Evidence for widespread endothelial activation and a potential role for intercellular adhesion molecule-1 in cerebral sequestration. Am J Pathol 145:1057-1069.
Valiyaveettil M, Achur RN, Alkhalil A, Ockenhouse CF, Gowda DC. 2001. Plasmodium falciparum cytoadherence to human placenta: evaluation of hyaluronic acid and chondroitin 4-sulfate for binding of infected erythrocytes. Exp Parasitol 99:57-65.
Vazquez-Macias A, Martinez-Cruz P, Castaneda-Patlan MC, Scheidig C, Gysin J, Scherf A, Hernandez-Rivas R. 2002. A distinct 5' flanking var gene region regulates Plasmodium falciparum variant erythrocyte surface antigen expression in placental malaria. Mol Microbiol 45:155-167.
White NJ. 2003. Malaria. In: Cook GC, Zumla AI, eds. Manson's tropical diseases. London: Elsevier Science Limited. pp 1205-1295.
Winter G, Chen Q, Flick K, Kremsner P, Fernandez V, Wahlgren M. 2003. The 3D7var5.2 (var COMMON) type var gene family is commonly expressed in non-placental Plasmodium falciparum malaria. Mol Biochem Parasitol 127:179-191.

References 119
Yipp BG, Baruch DI, Brady C, Murray AG, Looareesuwan S, Kubes P, Ho M. 2003. Recombinant PfEMP1 peptide inhibits and reverses cytoadherence of clinical Plasmodium falciparum isolates in vivo. Blood 101:331-337.

Acknowledgements
Acknowledgements
I wish to express my deepest appreciation for my thesis supervisor, PD Dr. Mo-
Quen Klinkert for providing me with the opportunity to work on this very interesting
research topic, for her excellent support, continuous encouragement and enthusiastic
commitment throughout the thesis and last but not least, for her assistance in editing the
dissertation. I am also greatly indebted to Dr. Ayman Khattab for his generous and
incisive advice on laboratory techniques and his valuable insights during all stages of the
work. The many useful discussions have led to fruitful developments. My special thanks
extend to Michaela Petter and Insa Bonow for their patience and consideration for
bearing with me in the laboratory. Particular acknowledgements go also to Prof. Dr. Rolf
Horstmann for demonstrating interest in my research and for providing me the
benchspace to work in his department and to PD Dr. Joachim Clos for performing the
MALDI-tof analysis. There are also many from "behind the scenes" at the institute,
whose friendship and help I value and appreciate, but I hesitate to name them here, in
case I leave anyone out. I am grateful to Dr. P. Deloron and Dr. N. Fievet for allowing
me to use the plasma samples from their pregnant women cohort, Dr. G. Bentley for his
feedback on protein expression protocols and to Dr. T. Staalsoe for the kind gifts of CHO
cell lines.
I would not have been able to complete the thesis without the love and tireless
support of Hilmar. Thank you for putting up with lost weekends and odd working hours. I
am also grateful to Sigrid and Helmut for their encouragement and those wonderful home
cooked meals. Finally, I most fully thank my family for inspiring me on with their
seemingly unlimited belief in me. A big hug and a big thank you to my father for critical

Acknowledgements
reading of my dissertation drafts; to my mother for her efforts to cheer me up and her
wise advices; and to my siblings for lending a long-distance sympathetic ear to listen to
my complaints. Thank you, all of you.
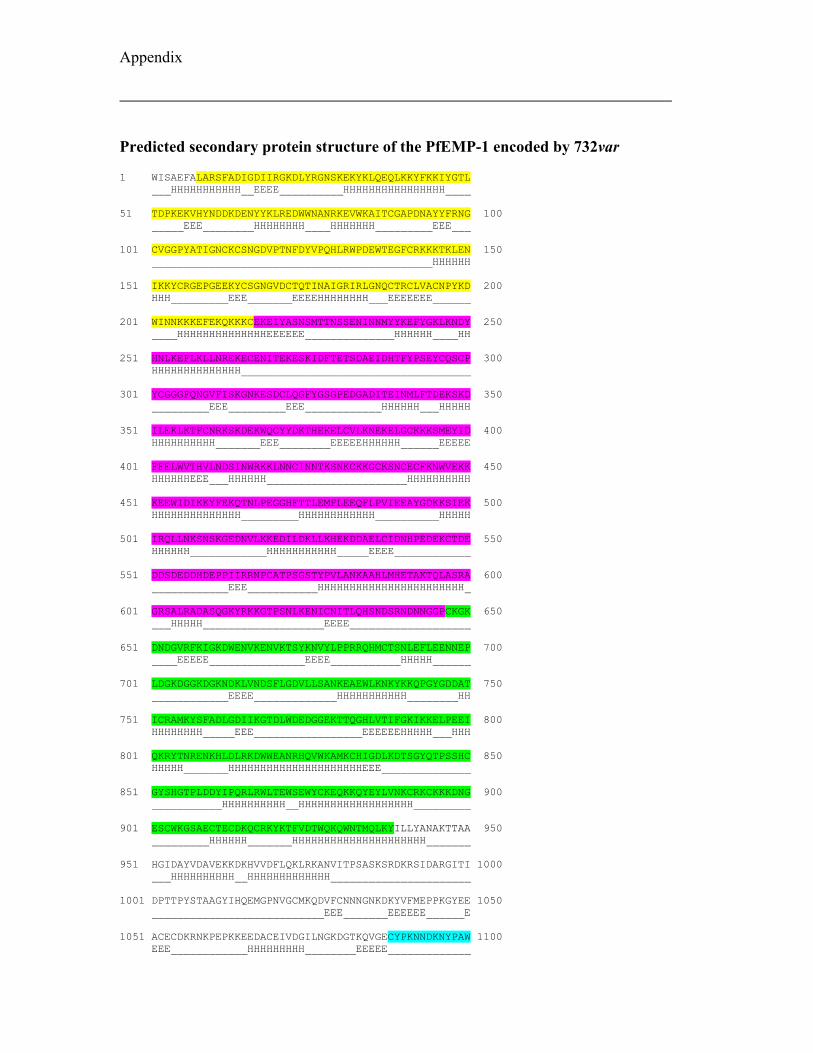
Appendix
Predicted secondary protein structure of the PfEMP-1 encoded by 732var
1 WISAEFALARSFADIGDIIRGKDLYRGNSKEKYKLQEQLKKYFKKIYGTL ___HHHHHHHHHHH__EEEE__________HHHHHHHHHHHHHHHH____ 51 TDPKEKVHYNDDKDENYYKLREDWWNANRKEVWKAITCGAPDNAYYFRNG 100 _____EEE________HHHHHHHH____HHHHHHH_________EEE___ 101 CVGGPYATIGNCKCSNGDVPTNFDYVPQHLRWPDEWTEGFCRKKKTKLEN 150 ____________________________________________HHHHHH 151 IKKYCRGEPGEEKYCSGNGVDCTQTINAIGRIRLGNQCTRCLVACNPYKD 200 HHH_________EEE_______EEEEHHHHHHHH___EEEEEEE______ 201 WINNKKKEFEKQKKKCEKEIYASNSMTTNSSENINNMYYKEFYGKLKNDY 250 ____HHHHHHHHHHHHHHEEEEEE______________HHHHHH____HH 251 HNLKEFLKLLNREKECENITEKESKIDFTETSDAEIDHTFYPSEYCQSCP 300 HHHHHHHHHHHHHH____________________________________ 301 YCGGGFQNGVFISKGNKESDCLQGFYGSGPEDGADITEINMLFTDEKSKD 350 _________EEE_________EEE____________HHHHHH___HHHHH 351 ILEKLKTFCNRKSKDEKWQCYYDKTHEKELCVLKNEKELGCKKKSMEYID 400 HHHHHHHHHH_______EEE________EEEEEHHHHHH______EEEEE 401 FFELWVTHVLNDSINWRKKLNNCINNTKSNKCKKGCKSNCECFKNWVEKK 450 HHHHHHEEE___HHHHHH______________________HHHHHHHHHH 451 KEEWIDIKKYFEKQTNLPEGGHFTTLEMFLEEQFLPVIEEAYGDKKSIEK 500 HHHHHHHHHHHHHH_________HHHHHHHHHHHH__________HHHHH 501 IRQLLNKSNSKGEDNVLKKEDILDKLLKHEKDDAELCIDNHPEDEKCTDE 550 HHHHHH____________HHHHHHHHHHH_____EEEE____________ 551 DDSDEDDHDEPPIIRRNPCATPSGSTYPVLANKAAHLMHETAKTQLASRA 600 ____________EEE___________HHHHHHHHHHHHHHHHHHHHHHH_ 601 GRSALRADASQGKYRKKGTPSNLKENICNITLQHSNDSRNDNNGGPCKGK 650 ___HHHHH___________________EEEE___________________ 651 DNDGVRFKIGKDWENVKENVKTSYKNVYLPPRRQHMCTSNLEFLEENNEP 700 ____EEEEE_______________EEEE___________HHHHH______ 701 LDGKDGGKDGKNDKLVNDSFLGDVLLSANKEAEWLKNKYKKQPGYGDDAT 750 ____________EEEE_____________HHHHHHHHHHH________HH 751 ICRAMKYSFADLGDIIKGTDLWDEDGGEKTTQGHLVTIFGKIKKELPEEI 800 HHHHHHHH_____EEE_________________EEEEEEHHHHH___HHH 801 QKRYTNRENKHLDLRKDWWEANRHQVWKAMKCHIGDLKDTSGYQTPSSHC 850 HHHHH_______HHHHHHHHHHHHHHHHHHHHHEEE______________ 851 GYSHGTPLDDYIPQRLRWLTEWSEWYCKEQKKQYEYLVNKCRKCKKKDNG 900 ___________HHHHHHHHHH__HHHHHHHHHHHHHHHHHH_________ 901 ESCWKGSAECTECDKQCRKYKTFVDTWQKQWNTMQLKYILLYANAKTTAA 950 _________HHHHHH_______HHHHHHHHHHHHHHHHHHHHH_______ 951 HGIDAYVDAVEKKDKHVVDFLQKLRKANVITPSASKSRDKRSIDARGITI 1000 ___HHHHHHHHHH__HHHHHHHHHHHHH______________________ 1001 DPTTPYSTAAGYIHQEMGPNVGCMKQDVFCNNNGNKDKYVFMEPPKGYEE 1050 ___________________________EEE_______EEEEEE______E 1051 ACECDKRNKPEPKKEEDACEIVDGILNGKDGTKQVGECYPKNNDKNYPAW 1100 EEE____________HHHHHHHHH________EEEEE_____________
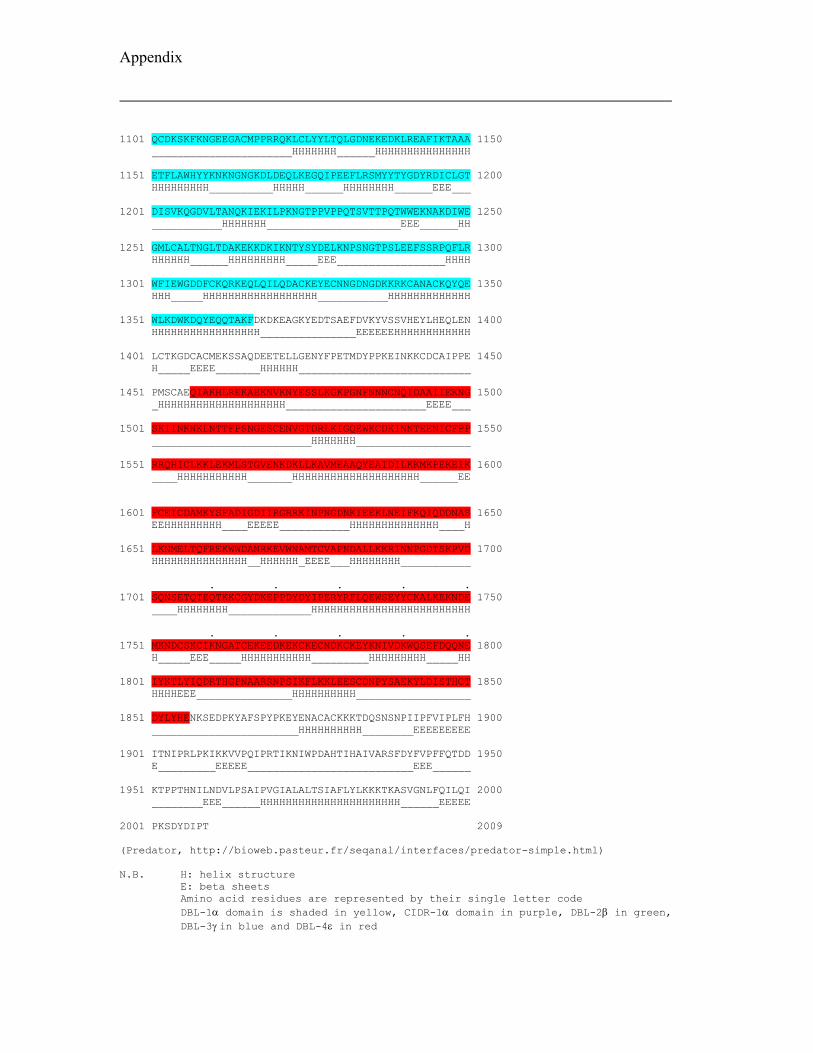
Appendix
1101 QCDKSKFKNGEEGACMPPRRQKLCLYYLTQLGDNEKEDKLREAFIKTAAA 1150 ______________________HHHHHHH______HHHHHHHHHHHHHHH 1151 ETFLAWHYYKNKNGNGKDLDEQLKEGQIPEEFLRSMYYTYGDYRDICLGT 1200 HHHHHHHHH__________HHHHH______HHHHHHHH______EEE___ 1201 DISVKQGDVLTANQKIEKILPKNGTPPVPPQTSVTTPQTWWEKNAKDIWE 1250 ___________HHHHHHH_____________________EEE______HH 1251 GMLCALTNGLTDAKEKKDKIKNTYSYDELKNPSNGTPSLEEFSSRPQFLR 1300 HHHHHH______HHHHHHHHH_____EEE_________________HHHH 1301 WFIEWGDDFCKQRKEQLQILQDACKEYECNNGDNGDKKRKCANACKQYQE 1350 HHH_____HHHHHHHHHHHHHHHHHH___________HHHHHHHHHHHHH 1351 WLKDWKDQYEQQTAKFDKDKEAGKYEDTSAEFDVKYVSSVHEYLHEQLEN 1400 HHHHHHHHHHHHHHHHH_______________EEEEEEHHHHHHHHHHHH 1401 LCTKGDCACMEKSSAQDEETELLGENYFPETMDYPPKEINKKCDCAIPPE 1450 H_____EEEE_______HHHHHH___________________________ 1451 PMSCAEQIAKHLREKAEKNVKNYESSLKGKPGNFNNNCNQIDAAIIEKNG 1500 _HHHHHHHHHHHHHHHHHHHH______________________EEEE___ 1501 SKIINKNKLNTTFPSNGESCENVGTDRLKIGQEWKCDKINNTEENICFPP 1550 _________________________HHHHHHH__________________ 1551 RRQHICLKKLEKMLSTGVENKDKLLKAVMEAAQYEAIDILKKMKPEKEIK 1600 ____HHHHHHHHHHH_______HHHHHHHHHHHHHHHHHHHH______EE 1601 FCEICDAMKYSFADIGDIIRGRRKINPNGDNKIEEKLNEIFKQIQDDNAS 1650 EEHHHHHHHHH____EEEEE___________HHHHHHHHHHHHHH____H 1651 LKNMELTQFREKWWDANRKEVWNAMTCVAPNDALLKKRINNPGDTSKPVD 1700 HHHHHHHHHHHHHHH__HHHHHH_EEEE___HHHHHHHH___________ . . . . . 1701 SQNSETQTEQTKKCGYDKEPPDYDYIPERYRFLQEWSEYYCKALKEKNDE 1750 ____HHHHHHHH_____________HHHHHHHHHHHHHHHHHHHHHHHHH . . . . . 1751 MKNDCSKCIKNGATCEKEEDKEKCKECNDKCKEYKNIVDKWQSEFDQQNE 1800 H_____EEE_____HHHHHHHHHHH_________HHHHHHHHH_____HH 1801 IYKTLYIQDRTHGPNAARRNPSIKFLKKLEESCDNPYSAEKYLDISTHCT 1850 HHHHEEE_______________HHHHHHHHHH__________________ 1851 DYLYHENKSEDPKYAFSPYPKEYENACACKKKTDQSNSNPIIPFVIPLFH 1900 _______________________HHHHHHHHHH________EEEEEEEEE 1901 ITNIPRLPKIKKVVPQIPRTIKNIWPDAHTIHAIVARSFDYFVPFFQTDD 1950 E_________EEEEE__________________________EEE______ 1951 KTPPTHNILNDVLPSAIPVGIALALTSIAFLYLKKKTKASVGNLFQILQI 2000 ________EEE______HHHHHHHHHHHHHHHHHHHHHH______EEEEE 2001 PKSDYDIPT 2009 (Predator, http://bioweb.pasteur.fr/seqanal/interfaces/predator-simple.html) N.B. H: helix structure E: beta sheets Amino acid residues are represented by their single letter code DBL-1α domain is shaded in yellow, CIDR-1α domain in purple, DBL-2β in green, DBL-3γ in blue and DBL-4ε in red