Embed Size (px)
Citation preview

1
BIOCHEMICAL AND STRUCTURAL CHARACTERIZATION OF Lactobacillus johnsonii FERULOYL ESTERASES
By
KIN-KWAN LAI
A DISSERTATION PRESENTED TO THE GRADUATE SCHOOL OF THE UNIVERSITY OF FLORIDA IN PARTIAL FULFILLMENT
OF THE REQUIREMENTS FOR THE DEGREE OF DOCTOR OF PHILOSOPHY
UNIVERSITY OF FLORIDA
2011

2
© 2011 Kin-Kwan Lai

3
To my parents, Hon-Yuen Lai and Lai-Yin Kong, and to my brothers, Ping-Kwan Lai and King-Kwan Lai, for their unlimited love and support.

4
ACKNOWLEDGMENTS
I express my highest gratitude to my primary advisor, Dr. Claudio Gonzalez, for his
unwavering guidance throughout my entire graduate school experience. His support
and constant push for improvement has made my experience as a graduate student
successful and more rewarding. I also thank Dr. Graciela Lorca for her indispensable
insight as well as my other committee members Dr. Julie Maupin-Furlow, Dr. Joseph
Larkin III, Dr. Nicole Horenstein, and Dr. Veronika Butterweck for their advice and the
faculty of the Microbiology and Cell Science Department for their support.
I would like to express my appreciation for the help and support provided by my
fellow members of the Gonzalez and Lorca labs: graduate students Santosh Pande,
Ricardo Valladares, Algevis Wrench; undergraduate students Sara Molloy and Clara
Vu; scientist Fernando Pagliai; and lab technician Beverly Driver. I would also like to
thank the members of Banting and Best Department of Medical Research in the
University of Toronto, especially Peter Stogios and Xiaohui Xu for their invaluable
contribution with the protein crystal structures.
Finally, I would like to thank my family and close friends especially Anastasia Potts
for their kind encouragement that helped motivate me throughout my graduate school
career.

5
TABLE OF CONTENTS page
ACKNOWLEDGMENTS .................................................................................................. 4
LIST OF TABLES ............................................................................................................ 8
LIST OF FIGURES ........................................................................................................ 10
LIST OF ABBREVIATIONS ........................................................................................... 12
ABSTRACT ................................................................................................................... 16
CHAPTER
1 INTRODUCTION .................................................................................................... 18
Phytophenols .......................................................................................................... 18
Health Beneficial Properties of Phenolic Acids ................................................. 20
Common Phytophenols Present in Human Diets ............................................. 22
Limitation on Phenolic Acid Absorption ............................................................ 23
Microbial Interaction with Food Components .................................................... 24
Esterases ................................................................................................................ 26
Ferulic Acid Esterases (FAEs) .......................................................................... 27
General Characteristic of FAEs ........................................................................ 28
Reaction Mechanism of FAEs .......................................................................... 29
Structural Binding Mechanism of FAEs ............................................................ 31
Classification of FAEs ...................................................................................... 32
Applications of FAEs ........................................................................................ 34
Project Rationale and Design ................................................................................. 36
2 MATERIALS AND METHODS ................................................................................ 47
Chemicals, Media, and Strains ............................................................................... 47
Chemicals ......................................................................................................... 47
Growth Conditions of E. coli Strains ................................................................. 47
Preparation of Competent E. coli Cells ............................................................. 48
Isolation and Growth Condition of Lactobacillus strains ................................... 49
DNA Procedures ..................................................................................................... 49
Lactobacillus Strain identification ..................................................................... 49
In silico Selection of Potential FAE Encoding Genes ....................................... 49
Cloning of Potential FAEs................................................................................. 50
Cloning of Human Valacylovir Hydrolase (VACVase) ...................................... 51
Generating LJ0536 Protein Variants ................................................................ 52
DNA Gel Electrophoresis .................................................................................. 53
Protein Procedures ................................................................................................. 53
Protein Purification ........................................................................................... 53
6
Sodium Dodecyl Sulfate-Polyacrylamide Gel Electrophoresis (SDS-PAGE) .... 54
Protein Quantification ....................................................................................... 54
Enzyme Assays ................................................................................................ 55
Feruloyl esterase screening assay ............................................................. 55
Determination of optimal assay conditions ................................................. 55
Determination of enzymes substrate preference ........................................ 56
Determination of biochemical parameters by saturation kinetics ............... 57
Effect of bile salt component and metal ions on enzyme activity ............... 58
LJ0536 mutants and VACVase ester screening assay .............................. 59
Detection of phenolic acids using high performance liquid chromatography (HPLC) ......................................................................... 60
Determination of native molecular weight using size exclusion chromatography ...................................................................................... 60
Analysis of protein secondary structure by circular dichroism .................... 61
X-Ray Crystallization of LJ0536 and S106A ..................................................... 61
PDB Accession Code of Proteins ..................................................................... 64
Structural Analysis ............................................................................................ 65
Sequence Analysis and Construction of Phylogenetic Trees ........................... 65
3 IDENTIFICATION OF FAES FROM GUT MICROBIOTA ....................................... 79
Background ............................................................................................................. 79
Result and Discussion ............................................................................................ 81
FAEs Producing Strain Isolation and Identification ........................................... 81
In Silico Selection of Targets for Cloning .......................................................... 82
Purification and Quick Evaluation of Purified Enzymes .................................... 83
Determination of Optimal pH and Temperature for Activity .............................. 84
Analysis of Enzymatic Substrate Profile ........................................................... 84
Biochemical Properties of LJ0536 and LJ1228 ................................................ 85
Effect of Bile Salt Components ......................................................................... 88
In Silico Analysis of FAE Genomic Context ...................................................... 89
Analysis of FAEs Primary Sequences .............................................................. 89
Summary ................................................................................................................ 91
4 X-RAY CRYSTALLIZATION AND SUBSTRATE BINDING MECHANISM OF LJ0536 .................................................................................................................. 105
Background ........................................................................................................... 105
Result and Discussion .......................................................................................... 108
Architecture of LJ0536 ................................................................................... 108
The S106 is the Catalytic Residue ................................................................. 109
Analysis of the Crystal Structures of S106A-Substrate Complexes Reveals Critical Residues for Substrate Binding and Catalysis ................................ 111
Site-Directed Mutagenesis of the Inserted α / β Domain Demonstrates a Role in Substrate Preference ...................................................................... 116
Comparisons of LJ0536 and Proteins with Similar Folding............................. 117
Summary .............................................................................................................. 120

7
5 A NEW FACTOR CONTRIBUTES TO THE CLASSIFICATION OF FAES ........... 142
Background ........................................................................................................... 142
Result and Discussion .......................................................................................... 142
Structural Differences of Bacterial and Fungal FAEs ..................................... 142
Classification of LJ0536 and LJ1228 .............................................................. 144
Structural Prediction of LJ0536 and LJ1228 Homologs .................................. 146
Summary .............................................................................................................. 148
6 SUMMARY AND CONCLUSIONS ........................................................................ 162
REFERENCE LIST...................................................................................................... 164
BIOGRAPHICAL SKETCH .......................................................................................... 177
8
LIST OF TABLES
Table page 1-1 Functional classification of FAEs based on substrate specificity and primary
sequence similarity. ............................................................................................ 38
1-2 Descriptor-based classification of FAE proposed by Udatha .............................. 39
2-1 Strains and plasmids used in Chapter 3 ............................................................. 69
2-2 Primers used in Chapter 3 .................................................................................. 70
2-3 Plasmids used in Chapter 4 ................................................................................ 72
2-4 Primers used in Chapter 4 .................................................................................. 73
2-5 Strains used in Chapter 5 ................................................................................... 76
2-6 Primers used in Chapter 5 .................................................................................. 77
3-1 Saturation kinetic parameters of LJ0536 and LJ1228 ......................................... 94
4-1 Statistics of X-ray diffraction and structure determination ................................. 122
4-2 Saturation kinetic parameters of LJ0536 variants ............................................. 123
5-1 Comparison of LJ0536 and AnFaeA ................................................................. 150
5-2 Structural prediction of fungal FAEs using SWISS-MODEL (automatic modeling) .......................................................................................................... 151
5-3 Structural prediction of fungal FAEs using SWISS-MODEL (manual modeling) ......................................................................................................................... 152
5-4 Structural prediction of putative FAEs in subfamily 1B using SWISS-MODEL (automatic modeling) ........................................................................................ 153
5-5 Structural prediction of putative FAEs in subfamily 1B using SWISS-MODEL (manual modeling) ............................................................................................ 154
5-6 Structural prediction of LJ0536, LJ1228, and homologs / paralogs using SWISS-MODEL (automatic modeling) .............................................................. 155
5-7 Structural prediction of LBA-1 and BFI-2 using SWISS-MODEL (manual modeling) .......................................................................................................... 156
5-8 Structural prediction of bacterial FAEs using SWISS-MODEL (automatic modeling) .......................................................................................................... 157

9
5-9 Structural prediction of bacterial FAEs using SWISS-MODEL (manual modeling) .......................................................................................................... 158

10
LIST OF FIGURES
Figure page 1-1 Classification of phytophenols ............................................................................ 40
1-2 Phenolic acid subgroups .................................................................................... 41
1-3 Esterification of phenolic compounds ................................................................. 42
1-4 Intestinal absorption of phytophenols and phenolic acids ................................... 43
1-5 Chemical structures of ester backbones ............................................................. 44
1-6 Natural phytophenols are frequently present in the human diet ......................... 45
1-7 Catalytic mechanism characteristic of the carboxylesterases ............................. 46
2-1 Expression vector, p15TV-L map ....................................................................... 78
3-1 Identification of FAE-producing strains ............................................................... 95
3-2 Identification of the colonies isolated from BB-DR rats. ...................................... 96
3-3 Purified enzymes on SDS-PAGE ........................................................................ 97
3-4 Optimal pH and temperature of LJ0536 .............................................................. 98
3-5 Optimal pH and temperature of LJ1228 .............................................................. 99
3-6 Enzymatic substrate profile of the enzymes LJ0536 and LJ1228 ..................... 100
3-7 Effect of bile salts on LJ0536 and LJ1228 enzyme activity ............................... 101
3-8 Genomic context of LJ0536 and LJ1228 in the reference strain L. johnsonii NCC 533 ........................................................................................................... 102
3-9 Multiple sequence alignment of LJ0536 and proteins with high sequence identity .............................................................................................................. 103
3-10 Tree representation of LJ0536 and LJ1228 relationships with the proteins that displayed the highest sequence identity. ................................................... 104
4-1 General secondary structure of α / β fold ......................................................... 124
4-2 Representation of the overall LJ0536 structure ................................................ 125
4-3 Determination of the native molecular weight of the enzyme by gel filtration assays. ............................................................................................................. 126

11
4-4 Representation of the single chain LJ0536 structure. ....................................... 127
4-5 Details of α / β inserted domain in the LJ0536 structure ................................... 128
4-6 Surface and ribbon representation of LJ0536 catalytic site .............................. 129
4-7 Enzyme activity in presence of specific inhibitors. ............................................ 130
4-8 Identification of the two GXSXG motifs in the overall LJ0536 structure ............ 131
4-9 SDS-PAGE. ...................................................................................................... 132
4-10 Comparative enzymatic activity of LJ0536 variants. ......................................... 133
4-11 Circular dichroism spectra of LJ0536 and mutant S68A ................................... 134
4-12 Surface representation of apo and co-crystallized structures of LJ0536 mutant S106A ................................................................................................... 135
4-13 Enzyme-substrate interactions within binding cavity of LJ0536 ........................ 136
4-14 Structural superimposition of the mutant S106A co-crystallized with ethyl ferulate or ferulic acid ....................................................................................... 137
4-15 Electron density map of co-crystallized substrates ........................................... 138
4-16 Schematic interpretation of the substrate interactions with LJ0536 binding cavity ................................................................................................................ 139
4-17 Structural comparison of LJ0536 and proteins with similar overall folding ........ 140
4-18 Structural comparison of LJ0536 with Est1E, and VACVase ............................ 141
5-1 Structural comparison of LJ0536 and AnFaeA ................................................. 159
5-2 Structure of FAE-XynZ ..................................................................................... 160
5-3 Structural comparison of LJ0536 and FAE-XynZ co-crystallized with their respective substrates ........................................................................................ 161

12
LIST OF ABBREVIATIONS
Amp ampicillin
Ampr ampicillin resistance
ATCC American type culture collection
BB-DP bio-breeding diabetes-prone
BB-DR bio-breeding diabetes-resistant
BES N,N-bis(2-hydroxyethyl)-2-aminoethanesulfonic acid
BLAST Basic Local Alignment Search Tool
bp base pair
BRENDA BRaunschweig ENzyme Database
C carbon
CHES 2-(n-cyclohexylamino)ethane Sulfonic Acid
cm centimeter
c.n.d. could not determine
DNA deoxyribonucleic acid
dNTPs deoxyribonucleotide triphosphates
DTT dithiothreitol
ε extinction coefficient
EC Enzyme Commission number
EF ethyl ferulate
FAE ferulic acid esterase
FAE-A type-A ferulic acid esterase
FAE-B type-B ferulic acid esterase
FAE-C type-C ferulic acid esterase
FAE-D type-D ferulic acid esterase

13
FAE-E type-E ferulic acid esterase
FPLC fast protein liquid chromatography
Fo-Fc Fourier refinement
g gravitational force
GRAS Generally Recognized As Safe
HEPES 4-(2-hydroxyethyl)-1-piperazineethanesulfonic acid
His histidine
HPLC high performance liquid chromatography
IPTG isopropyl β-D-1-thiogalactopyranoside
kb kilobase pair
Kcat catalytic rate constant
Kcat / Km catalytic efficiency
kDa kilodalton
Km Michaelis constant
L liter
LAB lactic acid bacteria
LB Lysogeny broth / Luria-Bertani
LIC ligation-independent cloning
M molarity
MCT monocarboxylic acid transporter
MES 2-(n-morpholino)ethanesulfonic acid
mAbs milliabsorbance
MCT monocarboxylic acid transporter
mg milligram
min minutes

14
mL milliliter
mM millimolar
mm millimeter
MR molecular replacement
MRS de Man Rogosa Sharpe
NaCl sodium chloride
NCBI National Center for Biotechnology Information
Ni-NTA nickel-nitriloacetic acid
nmol nanomole
NOD non-obese diabetic
oC degree celsius
OD600 optical density at 600nm
ORFs open reading frames
PCR polymerase chain reaction
PDB Protein Data Bank
PMSF phenylmethanesulphonylfluoride
PSI-BLAST Position-Specific Iterated Basic Local Alignment Search Tool
R residual factor
Rfree free residual factor
Rwork a residual factor
RNA ribonucleic acid
rpm revolutions per minute
s second
SDS-PAGE sodium dodecyl sulfate polyacrylamide gel electrophoresis
SEC size exclusion chromatography
15
sp. Species (singular)
spp. species (plural)
TEV tobacco etch virus
TID type 1 diabetes
μg microgram
μL microliter
μm micrometer
UV ultraviolet
Vmax maximum rate of reaction
v / v volume to volume
w / v weight to volume
w / w weight to weight

16
Abstract of Dissertation Presented to the Graduate School of the University of Florida in Partial Fulfillment of the Requirements for the Degree of Doctor of Philosophy
BIOCHEMICAL AND STRUCTURAL CHARACTERIZATION OF Lactobacillus johnsonii
FERULOYL ESTERASES
By
Kin-Kwan Lai
August 2011
Chair: Claudio F Gonzalez Major: Microbiology and Cell Science
Phytophenols are natural phenolic compounds with widespread distribution
throughout the plant kingdom. These phytophenols participate in the formation of
macromolecular structures in plant cell walls via ester linkages. Phenolic acids,
chemicals that possess beneficial properties to human health, are released during
hydrolysis of phytophenols. The hydrolysis is catalyzed by enzymes (ferulic acid
esterases, FAEs) of the gut microbiota. Before this work, no enzymes produced by
human gastrointestinal commensals displaying FAE activity were described. FAE
activity was observed from several Lactobacillus spp. isolated from stool samples
collected from bio-breeding diabetes-resistant rats. The isolated Lactobacillus johnsonii
N6.2 displayed the highest FAE activity among the isolated strains. Potential FAEs were
identified by in silico prediction, cloned, and purified from Escherichia coli as
recombinant proteins. By utilizing a variety of enzyme activity assays, two enzymes
(LJ0536 and LJ1228) showed high substrate preference for aromatic esters, including
chlorogenic acid and rosmarinic acid, which are commonly found in human diets. Site
directed mutagenesis and x-ray crystallization of LJ0536 identified critical amino acids
17
involved in ester hydrolysis. The catalytic triad is composed of serine, histidine, and
aspartic acid. A classical oxyanion hole, formed by phenylalanine and glutamine, also
contributes to substrate binding. The substrate binding mechanism consists of a specific
hydrophobic cavity in addition to an inserted domain located on top of the binding cavity.
The inserted domain protects the small hydrophobic region and forms hydrogen bond(s)
with the aromatic ring of the substrate to stabilize the binding interaction. Bioinformatic
and structural analyses indicate bacterial FAEs are well conserved within the
Lactobacillaceae family. The features of inserted domain distinguish the substrate
binding mechanism of different types of proteins. The current FAE classification scheme
is primarily based on enzyme activity and primary sequence identity of fungal FAEs.
The unique structural and functional features of the inserted domain could contribute to
refine the classification of FAEs. Taken together, this work describes the identification,
purification, characterization, and crystallization of FAEs from probiotic bacteria. This
study will provide insight for further exploration of FAEs in other species, and potentially
will enhance the path for future applications of FAEs.
18
CHAPTER 1 INTRODUCTION
Phytophenols
Phenolic compounds are naturally available chemicals that contain one or more
phenolic rings with or without substituents, such as hydroxyl or methoxy group(s). The
term phytophenol, or phytochemical, is also used due to their high abundance in plants
(Huang et al., 2007). Phytophenols are secondary metabolites of plants, which are
primarily used as defences against ultraviolet radiation and pathogens (Beckman,
2000). They are widely distributed and highly abundant in plant cell walls. Ferulic and p-
coumaric acids reinforce the cell wall structure by crosslinking the hemicellulose
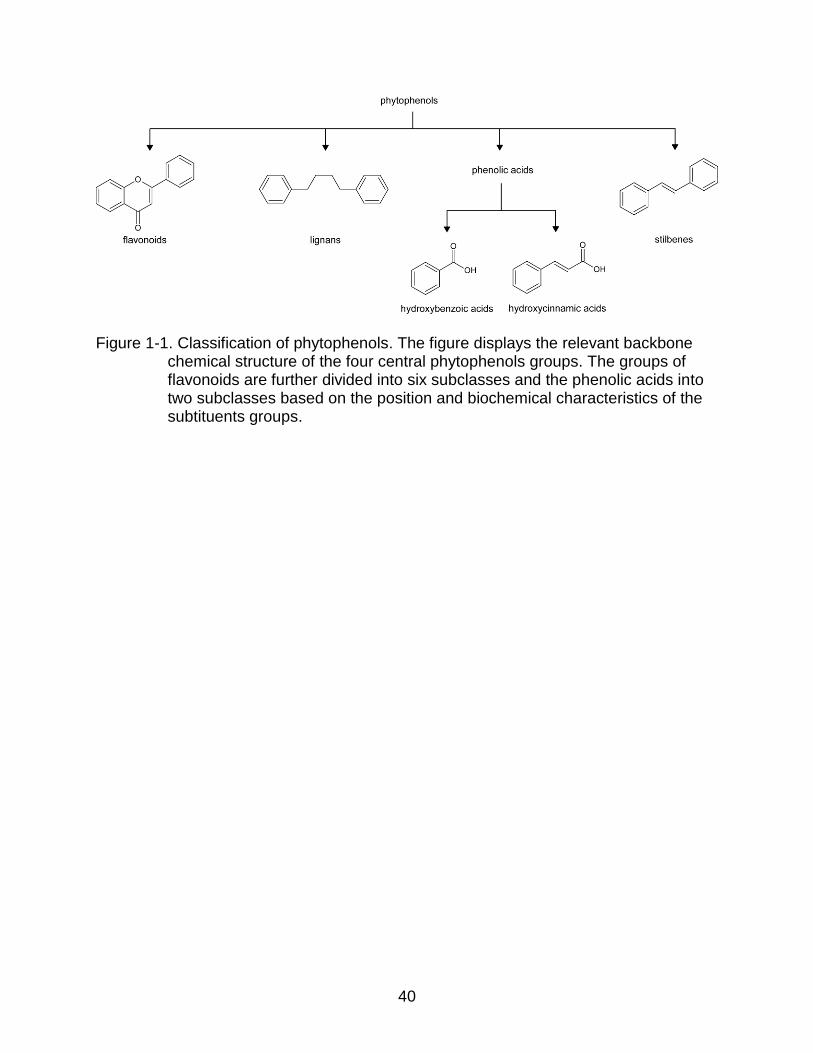
fraction. In general, phytophenols are divided into four major groups: flavonoids,
phenolic acids, stilbenes, and lignans (Spencer et al., 2008). The classification of
phytophenols is based on their characteristic chemical structures (Figure 1-1). All
chemicals classified as phytophenols have at least one phenolic ring in their structure.
The characteristic structure of flavonoids is a flavone, which contains two benzene rings
connected by three carbons to form an oxygenated heterocycle. The phenolic acids
contain a benzene ring attached to a carboxylic acid. The stilbenes have a backbone
structure of 1,2-diarylethene, with two benzene rings bonded to each end of a carbon-
carbon double bond. Lignans have a backbone structure of 1,4-dibenzybutane, with two
benzene rings bonded to each end of a four-carbon chain. These major groups can be
further divided into small subgroups depending on the position and number of hydroxyl
substituents or other derivatives present in the backbone structure. Among these four
major groups, the flavonoids are the largest group and contain six subgroups: flavonols,
flavanones, flavanols, flavones, anthocyanins, and isoflavones. Phenolic acids can be

19
further divided into two groups: hydroxycinnamic acids and hydroxybenzoic acids. The
hydroxycinnamic acids have a cinnamic acid as a backbone structure, while the
hydroxybenzoic acids have a backbone structure of benzoic acid. Even though
hydroxycinnamic acids and hydroxybenzoic acids have similar chemical structures,
hydroxycinnamic acids are more common in nature than hydroxybenzoic acids.
Phenolic acids with a single phenolic ring, such as caffeic, ferulic, and coumaric
acids, are the simplest derivatives of hydroxycinnamic acids (Crozier et al., 2009).
Caffeic acid has hydroxyl substituents at carbon 3 and carbon 4 (C3 and C4) of the
cinnamic acid backbone. Ferulic acid has a hydroxyl substituent at C4 and a methoxy
substituent at C3 of the cinnamic acid backbone. Coumaric acid has one hydroxyl
substituent at C4 of the cinnamic acid backbone. Salicylic acid, syingic acid, and gallic
acid are examples of hydroxybenzoic acid derivatives (Figure 1-2). Salicylic acid has a
hydroxyl substituent on C2 of the benzoic acid backbone. Syingic acid has methoxy
substituents on C3 and C5 and a hydroxyl substituent on C4 of the benzoic acid
backbone. Gallic acid has hydroxyl substituents on C3, C4, and C5 of the benzoic acid
backbone.
Depending on the type of storage or the location in the plants, phenolic acids can
be either soluble or insoluble. The phenolic acids are soluble when they are stored
within plant cell vacuoles. They are insoluble when they are acting as components of
the plant cell wall structure. However, in reality, phenolic acids exist in much more
complex forms.
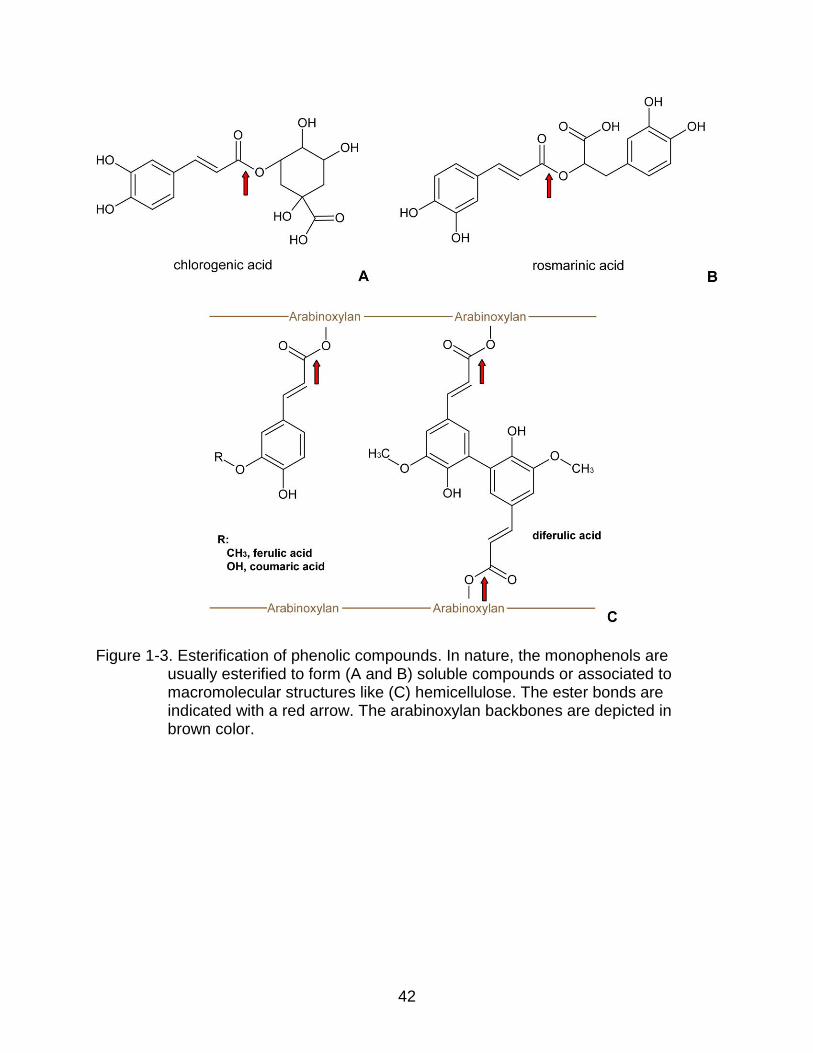
The carboxylic acid moiety is usually esterified (Figure 1-3A and B), which
generates a variety of phenolic compounds. Usually more than one phenolic moiety can

20
be found in these chemical structures. Consequently, phenolic compounds are also
called polyphenols. For example, chlorogenic acid (5-O-caffeoylquinic acid) is
composed of two phenolic acids; it is an ester of caffeic acid and quinic acid.
Chlorogenic acid is a soluble phenolic compound found in a variety of plants. For
instance, Catharanthus roseus produces terpenoid-indole alkaloids utilized for anti-
cancer drug synthesis (Ferreres et al., 2011). Rosmarinic acid is another soluble
phenolic compound, which is found in the extract of Labiatae herbs (Tada et al., 1996).
It is an ester of caffeic acid and 3,4-dihydroxyphenyl lactic acid. In contrast, ferulic acid
and coumaric acid are found in the cell walls of barley and malt. These acids are ester
linked to arabinoxylan, and are part of the insoluble fractions (Figure 1-3C) (Maillard &
Berset, 1995).
The hydrolysis of the ester bond releases the phenolic acids from macromolecular
structures and from the respective polyphenols. Although the chemical structures of
phenolic acids are similar, they have different biochemical properties. In the past
decade, the studies on phenolic acids increased dramatically due to its beneficial
properties demonstrated in vitro as well as in vivo (Srinivasan et al., 2007).
Health Beneficial Properties of Phenolic Acids
It is generally accepted that the beneficial properties shown by phenolic acids are
related to their high level of anti-oxidative and anti-inflammatory properties (Maurya &
Devasagayam, 2010; Sato et al., 2011). They have strong scavenging activity for free
radicals such as hydrogen peroxide, superoxide, hydroxyl radical, and nitrogen dioxide
(Srinivasan et al., 2007; Graf, 1992). In addition, it is accepted that phenolic acids are
able to stimulate insulin secretion to maintain normal blood glucose levels

21
(Adisakwattana et al., 2008; Huang et al., 2009), reduce carcinogenesis (Murakami et
al., 2002; Yi et al., 2005), and diminish cardiovascular disease (Chao et al., 2009).
It has been demonstrated that ferulic acid has neuroprotective effect in rats
(Cheng et al., 2008) and protects against liver injury in mice (Kim et al., 2011). Caffeic
acid shows inhibitory effects against cancer cell proliferation in human cell lines
(Rajendra Prasad et al., 2011). Besides these common derivatives of hydroxycinnamic
acids, the importance of other diverse phenolic acids and polyphenols such as
hydroxytyrosol, 3,4-dihydroxyphenyl lactic acid, and resveratrol were recently
discovered and studied (Yu et al., 2010). Hydroxytyrosol showed anti-atherogenic,
cardioprotective, anti-inflammatory, anti-platelet aggregation, anti-tumor, and anti-
microbial activities (Granados-Principal et al., 2010). 3,4-dihydroxyphenyl lactic acid has
been found to have protective effects against brain and liver injuries (Lam et al., 2003;
Xing et al., 2005). Resveratrol, a compound found in red wines, is one of the most
studied and commercially exploited phenolics by the nutraceutical industry. It has been
demonstrated that resveratrol is an excellent dietary anti-oxidant and can prevent
uncontrolled cell proliferation and cancer (Athar et al., 2009; Pervaiz & Holme, 2009).
Antiviral and antimicrobial properties of diverse phenolic acids are also well documented
(Puupponen-Pimiä et al., 2005).
In general, in vitro assays have been used to demonstrate the beneficial properties
of phenolic acids. A few works carried out with animal models indicate that a diet rich in
phytophenols could be beneficial for humans. However, the evidence is still indirect.
The assays using animal models described in the scientific literature utilized purified
phytophenols delivered directly into the blood stream (Kim et al., 2011). In order to

22
strongly support that the inclusion of dietary food components rich in phytophenols is
beneficial to humans, several aspects such as toxicity and absorbability of phytophenols
should be deeply investigated.
Common Phytophenols Present in Human Diets
Phytophenols are highly abundant in the plant kingdom and can be easily found in
dietary fiber. However, the distribution of phenolic acids is highly variable among
different species of plants. Wheat bran and rice bran oil contain gamma-oryzanol.
Gamma-oryzanol is a phytosteryl ferulate mixture. It is composed of 12 ferulate esters
(Akihisa et al., 2000), which can release ferulic acid upon hydrolysis. The total amount
of ferulic acid varies from 0.5%, 0.9%, and 5% dry weight in wheat bran, suger-beet
pulp, and corn kernel respectively (Ou & Kwok, 2004) The rice bran contains 0.19% to
0.42% dry weight of gamma-oryzanol (Lilitchan et al., 2008; Chen & Bergman, 2005).
Rosmarinic acid is an ester of caffeic acid and 3,4-dihydroxyphenyl lactic acid. It is
naturally present in high amounts in herbs such as rosemary and lemon balm, which are
frequently used in food preparations. The content of rosmarinic acid in herbs varies from
0.2% to 3% dry weight of herbs (Wang et al., 2004a). Chlorogenic acid is abundant in
coffee and green tea. It is an ester of caffeic acid and quinic acid. A cup of coffee
potentially contains 15 mg to 325 mg chlorogenic acid (Richelle et al., 2001). Oleuropein
is found in olive trees and in olive oil. It is an ester of elenoic acid and 3,4-
dihydroxyphenylethanol (hydroxytyrosol). Olive tree leaves typically contain 9% dry
weight of oleuropein (Omar, 2010). Salvianolic acid is found in Salvia miltiorrhiza which
is also known as danshen, a Chinese herbal medicine. Up to 82.52 mg of salvianolic
acid B can be found in one gram of danshen (Li et al., 2008). Hydrolysis of salvianolic
acid B forms 3,4-dihydroxyphenyl lactic acid and lithospermic acid.
23
Many studies have shown that the consumption of dietary fiber can lead to better
health (Sansbury et al., 2009; Slavin, 2008). The beneficial properties of dietary fibers
are directly linked with detoxification by stimulating intestinal peristalsis. The actual
scientific discussion, regarding to the importance of dietary fibers, is focused on the
importance of the phytophenols absorbed at the intestinal level. However, the
absorption and metabolism of phenolic acids by humans are not completely understood.
It is well known that the dietary phytophenols are poorly absorbed at the intestinal level.
In order to be absorbed, enzymatic hydrolysis of the ester bond is required to release
the bioactive phenolic acids from the phytophenols. The free carboxylic monophenols
are then specificly and efficiently assimilated by cells of the intestinal tract (Kroon et al.,
1997).
Limitation on Phenolic Acid Absorption
The knowledge of phenolic acids absorption by humans is limited. It is accepted
that two pathways are being utilized for cellular transport of phenolics (Konishi &
Kobayashi, 2005): a passive paracellular diffusion and an active monocarboxylic acid
transporter (Figure 1-4). Passive paracellular diffusion is a low efficiency system that
allows some phytophenols and phenolic acids to slowly pass through the intestinal
epithelial cells into the blood plasma for absorption. The active monocarboxylic acid
transporter allows small, simple chemicals with a monocarboxylic acid motif
(monophenolic acids such as ferulic acid and gallic acid) to pass through the layer with
high efficiency.
Monocarboxylic acid transporter does not have affinity towards complex
phytophenols or phenolic acid esters. Since the majority of monophenolic acids are
esterified to other molecules, an enzymatic step is required prior to absorption. Once

24
the ester linkage is hydrolyzed, monophenolic acids are released and absorbed in the
intestines with high efficiency by the monocarboxylic acid transporter. The enzymes
catalyzing the phenolic acid ester hydrolysis are called cinnamoyl or feruloyl esterases
(FAEs). To the best of today’s knowledge, humans do not produce enzymes that can
hydrolyze the ester linkages of polyphenols. However, the metabolites of phenolic acids
are detected in the blood stream immediately after the ingestion of phytophenols (Baba
et al., 2004). These results indicate that FAE activity is present in the intestines. It has
also been demonstrated that FAE activity is present in the lumen of the human gut as
well as in the fecal samples (Kroon et al., 1997; Gonthier et al., 2006).
The human colon harbors 1012 microorganisms per gram of feces (Hooper &
Gordon, 2001). It is not surprising that some of these microorganisms encode FAEs
(Andreasen et al., 2001). Several bacterial species such as Escherichia coli,
Bifidobacterium lactis, and Lactobacillus gasseri isolated from human intestine display
FAE activity (Couteau et al., 2001). It has also been found that lactic acid bacteria such
as L. fermentum, L. reuteri, L. leichmanni, and L. farciminis are able to produce FAEs
(Donaghy et al., 1998). However, the genes encoding these enzymes have not yet been
identified. Consequently, the presence of FAE activity in the intestines indicates that
phenolic acids can be released from the dietary fiber, and that FAE activity is produced
exclusively by some members of the gut microbiota.
Microbial Interaction with Food Components
Functional food is denoted as food that provides beneficial effects in addition to
dietary nutritional value. Bioactive food components, such as phenolic acids in
functional foods, are usually tightly bound to the non-digestible fraction. The activity of
microbial enzymes is required to release these bioactive components. The intestinal
25
tract is an active site not only for absorption and excretion but also for food modification
by microorganisms. It has been demonstrated by Kroon that ferulic acid is released from
fiber sources such as wheat bran and sugar beet pulp by bacterial FAE activity in the
human colon (Kroon et al., 1997). The bioavailability and function of phenolic acids
depend on the specific FAE activity present in the gut microbiota. Not all released
phenolics are intestinally absorbed. The non-absorbed portion can exert an action in
situ (i.e., anti-oxidative) or be subsequently converted into other metabolites by the gut
microbiota. Microbial metabolism and other activities from enzymes such as
dehydrogenases, reductases, and decarboxylases play a critical role in the phenolics
modifications (Landete et al., 2010; Rodríguez et al., 2010; Rodríguez et al., 2009). It
has been demonstrated that a change in the composition of gut microbiota affects
intestinal permeability, energy homeostasis, and the inflammatory response (Musso et
al., 2011). It is also clearly associated with obesity (Cani et al., 2009; Cani et al., 2008).
Thus, bioactive food components can alter the health of the host by regulating the
metabolism and composition of gut microbiota or by directly altering the host
metabolism and immune response (Musso et al., 2011).
An additional and very important function of bioactive phenolic acids and their
metabolites is related to the regulation of the gut microbiota composition. A number of
phytophenols can affect the growth and metabolic activity of several members of the gut
microbiota (Selma et al., 2009). Consequently, since the gut microbiota plays an
important role in shaping the host metabolic and immune network, the phenolics will
have an important impact on the health of the host.

26
The Increase in consumption of functional foods (i.e., fibers) usually leads to an
increase not only in the number of probiotic bacteria (bifidobacteria and lactobacilli) in
the intestine but also in the amount of phenolic acids in the blood (Costabile et al.,
2008). Altogether, functional foods, the gut microbiota, and human health are related to
each other. A change on any one of these components will introduce a significant
change in the other components. In order to take advantage of the phenolic contents of
dietary fiber, researchers are focused on developing efficient ways to improve the
bioavailability and assimilation of phenolic acids. The use of FAEs produced by the gut
microbiota is one of the potential ways to improve the bioavailability of phenolic acids in
human diet.
Esterases
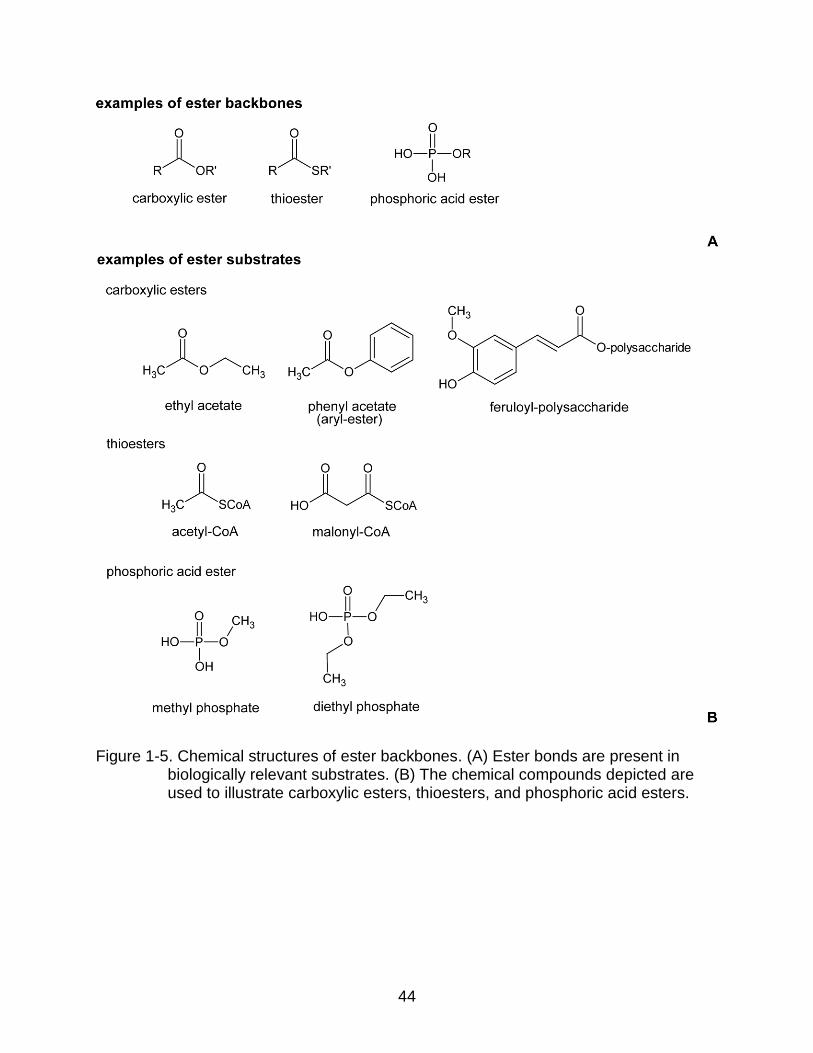
There are a large variety of esterases described in the literature. Esterases are
sub-divided into 31 subgroups on the basis of ester bond specificity (Figure 1-5). For
example, carboxylic ester hydrolases (EC 3.1.1.-) target carboxylic esters; thiolester
hydrolases (EC 3.1.2.-) target thiolester bonds.
Ferulic acid esterases (FAEs) are classified in the group of carboxylic ester
hydrolases (EC 3.1.1.-). This group is further divided into 84 specific types of esterases
based on the functional groups attached to the ester bond (Figure 1-5). Consequently,
acetylesterases (EC 3.1.1.6) hydrolyze acetyl esters. For example, they can hydrolyze
ethyl acetate into ethanol and acetate. Arylesterases (EC 3.1.1.2) hydrolyze esters that
contain a phenyl group attached to the oxygen atom of the ester bond. They can
hydrolyze, for example, phenyl acetate into phenol and acetate. Feruloyl esterases (EC.
3.1.1.73) hydrolyze esters that contain a phenolic acid derivative esterified to another
molecule. For example, they can hydrolyze feruloyl-polysaccharide to release ferulic
27
acid and polysaccharide. In the past decade, researchers have focused their attention
on FAEs because these enzymes release bioactive phenolic acids from prebiotics.
Ferulic Acid Esterases (FAEs)
FAEs (EC 3.1.1.73) are classified as a subclass of carboxylic acid esterases (EC
3.1.1.1). Alternative names such as cinnamoyl ester hydrolases, feruloyl esterases, and
hydroxycinnamoyl esterases are generally used in the literature to describe the same
group. They are also called hemicellulase accessory enzymes because they can act
synergistically with xylanases, cellulases, and pectinases to break down the
hemicellulose of plant cell walls. In the presence of water, FAEs hydrolyze phenolic
esters into respective alcohols and phenolic acids.
These enzymes have higher substrate preference when the carboxylic ester is in
the phenolic / aromatic form, such that an aromatic hydrocarbon is attached to the
carbon atom of the carbonyl group of the ester. The carbohydrate of the hemicellulose
is ester linked to phenolics and this aromatic ester linkage protects against
hemicellulose degradation by masking the potential substrates for cellulolytic and
hemicellulolytic enzymes (Akin, 2008). FAEs are important enzymes in the rumen
ecosystem due to their ability to increase the absorption of energy sources in ruminant
animals. In recent years, several FAEs from fungi were partially characterized, but little
is known about bacterial or plant FAEs.
A specific short amino acid sequence, glycine-X-serine-X-glycine, associated with
esterases can be easily identified on primary sequences using bioinformatics analysis.
Thus, a large number of proteins are annotated as hypothetical or putative esterases in
several databases. However, most of them remain biochemically uncharacterized.
Brenda database (http://www.brenda-enzymes.info/) described more than 140 enzymes

28
from 52 organisms with known amino acid sequences (Scheer et al., 2011). Only 8
structures of FAEs are described in the Protein Data Bank (PDB) (http://www.pdb.org/).
All the structures (apo-enzymes or co-crystallized with a substrate) deposited in PDB
belong to two enzymes purified from only two species, Aspergillus niger and Butyrivibrio
proteoclasticus.
In 2004, Wang and his co-worker (Wang et al., 2004b) claimed that a feruloyl
esterase was successfully purified and characterized from the intestinal bacterium L.
acidophilus. The molecular weight of the purified enzyme was determined as 36 kDa
using sodium dodecyl sulfate polyacrylamide gel electrophoresis (SDS-PAGE). The N-
terminal amino acid sequence of this enzyme was identified as
ARVEKPRKVILVGDGAVGST. However, the N-terminal amino acid sequence matches
100% with LA2_01145, a L-lactate dehydrogenase (35.1kDa) from Lactobacillus
amylovorus GRL 1112 and LBA_0271, a L-lactate dehydrogenase (35.0kDa) from L.
acidophilus NCFM. L-lactate dehydrogenases are enzymes that catalyze the conversion
of pyruvate to lactate. They do not possess esterase activity. Thus, there is no evidence
in the scientific literature regarding the purification and characterization of a FAE cloned
from lactobacilli.
General Characteristic of FAEs
FAEs are serine esterases that utilize serine as a catalytic residue for hydrolysis.
They have a classically conserved pentapeptide esterase motif with a consensus
sequence glycine-X-serine-X-glycine (GXSXG), with X represents any amino acids.
They belong to a structural group described as α / β fold hydrolases (Ollis et al., 1992).
The secondary structure of this group is composed of a minimum of eight β-strands in
the center core surrounded by α-helices. The term α / β barrel is also used to describe
29
the structure. The β-strands in the central core and α-helices are mostly parallel. The α-
helices and β-strands tend to alternate along the chain of the polypeptide.
The fungal FAEs do not display high sequence homology with bacterial FAEs.
Since only 2 FAEs structures were solved by crystallization studies, the substrate
binding mechanism of most FAEs is still not fully understood. However, the X-ray
structures of these two FAEs display important differences. These differences suggest
that the catalytic and the substrate binding mechanisms of bacterial and fungal
enzymes could be substantially different.
Reaction Mechanism of FAEs
FAEs can hydrolyze a wide range of substrate including both aliphatic and
aromatic esters. Enzymes that hydrolyze a broad range of substrates are generally
described as “promiscuous enzymes”. Some of the most optimal FAE substrates are
chlorogenic acid, rosmarinic acid, bran, oleuropein, and salvianolic acid. These
compounds are naturally present in a variety of dietary foods (Figure 1-6).
The active site of these enzymes is formed by a catalytic triad. The triad is formed
by serine, histidine, and aspartic acid residues, where serine is the nucleophilic residue.
Thus, the catalytic mechanism of FAEs is very similar to that of serine proteases,
lipases, and other esterases, which involves the formation of a covalent acylenzyme
intermediate (Ding et al., 1994).
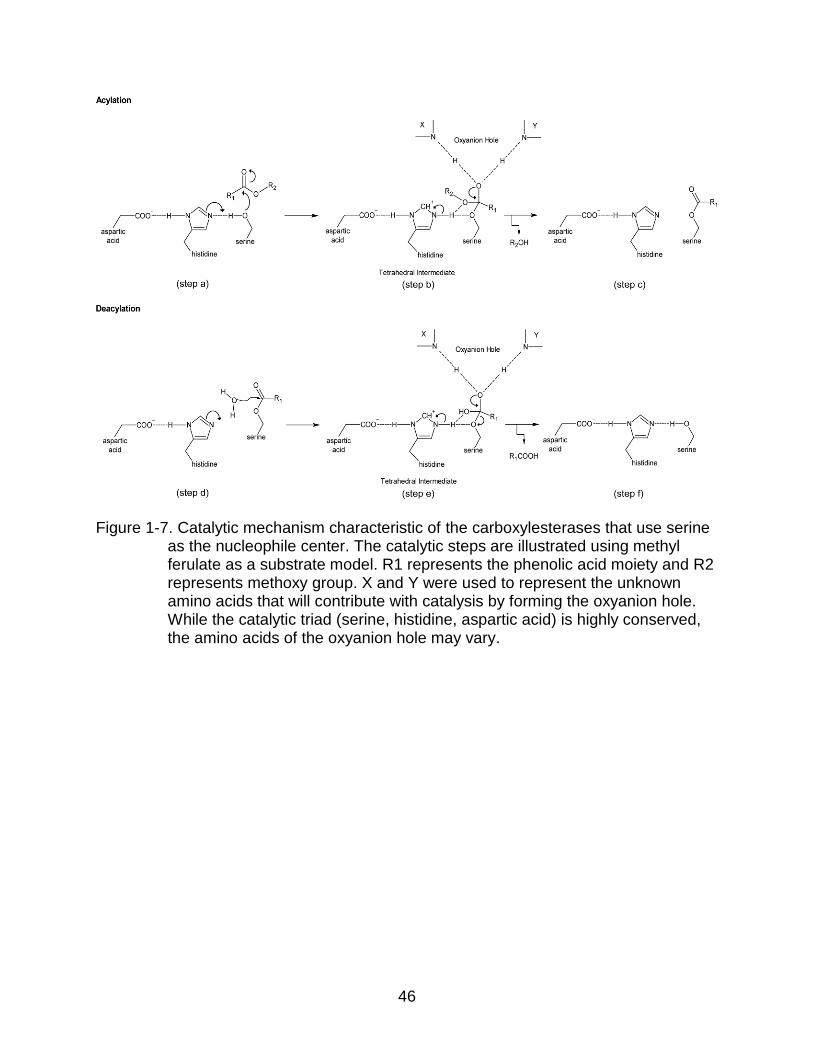
Two basic steps are involved during carboxylesterase catalysis: acylation and
deacylation (Figure 1-7). During acylation, the hydroxyl oxygen of the catalytic serine
carries out a nucleophilic attack on the carbonyl carbon of the ester substrate (step 1-
8a). After the attack, a general base (the histidine of the catalytic triad) deprotonates the
catalytic serine and the first tetrahedral intermediate is formed (step 1-8b). The
30
hydrogen bonding of the third member of the triad, aspartic acid, plays a critical role in
the stabilization of the protonated histidine. The oxyanion of the resulting tetrahedral
intermediate is positioned towards the oxyanion hole. The oxyanion hole is created by
hydrogen bonding between the substrate carbonyl oxygen anion and the backbone of
two nitrogen atoms from other residues of the catalytic pocket. The general base,
histidine, transfers the proton to the leaving group. The deprotonation of histidine leads
to the protonation of an ester oxygen to release the first product (for example: methanol
with methyl ferulate as substrate). As a consequence, the tetrahedral intermediate
collapses and the characteristic acylenzyme intermediate is formed. Thus, the residual
half of the substrate remains attached to the catalytic serine (step 1-8c).
The second step of the reaction, deacylation, takes place in the presence of water.
A molecule of water performs a nucleophilic attack on the carbonyl carbon of the
remaining substrate in the acylenzyme intermediate (step 1-8d). The general base
(histidine) immediately deprotonates a molecule of water, leading to the formation of a
second tetrahedral intermediate. The catalysis follows a similar pattern described for the
acylation. The second tetrahedral intermediate is stabilized by the formation of the
oxyanion hole (step 1-8e). The proton of the general base moves to the nucleophilic
serine. Consequently, the ester oxygen is protonated and the tetrahedral intermediate
collapses. The protonation of ester oxygen at the expense of histidine deprotonation
releases the final product (for example: ferulic acid with methyl ferulate as substrate)
and reconstitutes the native serine residue and the original state of the enzyme (step 1-
8f). The reaction mechanism is summarized in Figure 1-7.

31
Structural Binding Mechanism of FAEs
The PDB database displays only two FAE structures co-crystallized with ligands
(AnFaeA: type-A feruloyl esterase from A. niger; Est1E: feruloyl esterase from B.
proteoclasticus). Although all the enzymes present in the α / β fold group follow the
same structural pattern, they do not display a conserved substrate binding mechanism.
The analysis of the two models co-crystallized with substrates indicates that
AnFaeA displays the α / β hydrolase fold, which is similar to fungal lipases. The entry
into the binding cavity is restricted by a lid structure composed of 13 amino acid
residues similar to the lipolytic enzymes. Two different conformations are the
characteristics of lipolytic enzymes: the inactive, open conformation and the active,
closed conformation. In the open conformation, the binding cavity is open and in contact
with the solvent. The open conformation facilitates the binding of substrate. In the
closed conformation, a helical flap structure covers the binding cavity and restricts
access of the substrate to the cavity. A conformational change in the main protein
scaffold facilitates the movement of the helical flap to control the substrate binding
(Grochulski et al., 1994). The helical flap structure of the lipases has remarkable
similarity with the lid structure of the AnFaeA. The main difference with the lipases flap
structure is that the AnFaeA lid has a higher percentage of polar residues plus an N-
glycosylation site. These features suggests that the AnFaeA’s lid structure is rigid and
the enzyme is always in the open conformation (Hermoso et al., 2004). The structure of
AnFaeA is discussed in depth in Chapter 5.
In regards to Est1E, it also displays an α / β hydrolase fold with a loop insertion on
top of the catalytic groove. The loop insertion participates in the conformation of the
catalytic pocket and contributes to the substrate binding. The insertion is composed of
32
51 amino acids with four small β-sheets (two hairpins) and three α-helices. A flapping of
one amino acid (tryptophan) from the loop insertion is the only modification in the
configuration between the open and closed conformations. Several residues in the
inserted loop participate in the substrate binding by forming hydrogen bonds with the
phenolic moiety of the substrate (Goldstone et al., 2010). These characteristics suggest
that the lid structures / loop insertions in lipases, fungal FAEs, and bacterial FAEs are
important for substrate binding.
Classification of FAEs
A comprehensive classification scheme was proposed in 2004 (Crepin et al.,
2004). The classification system uses three main characteristics to group proteins into
four different types: 1) the substrate specificity of enzyme on four substrates (methyl
ferulate, methyl sinapate, methyl p-coumarate, methyl caffeate), 2) the ability to release
diferulic acid from plant cell walls, and 3) the primary amino acid sequence similarity.
The scheme divides the FAEs into subtypes A, B, C, and D.
Type-A FAEs (FAE-A) display activity on methyl p-coumarate but not methyl
caffeate. The enzymes in this group are able to release 5,5’-diferulic acid from plant cell
walls and the primary amino acid sequence shows similarity with lipases.
Type-B FAEs (FAE-B) display activity on methyl caffeate but not methyl p-
coumarate. They are not able to release 5,5’-diferulic acid from plant cell walls. The
primary amino acid sequence shows similarity to cinnamoyl esterases family 1 and
acetyl xylan esterases.
Type-C FAEs (FAE-C) display activity on methyl caffeate and methyl p-coumarate.
They are not able to release 5,5’-diferulic acid from plant cell walls and the primary
amino acid sequence shows similarity to chlorogenate esterases and tannases.

33
Type-D FAEs (FAE-D) display activity on methyl caffeate and methyl p-coumarate.
These enzymes are able to release 5,5’-diferulic acid from plant cell walls and the
primary amino acid sequence shows similarity to xylanases.
The full classification scheme (Crepin et al., 2004) is summarized in Table 1-1.
This classification scheme was built based on the data collected from fungal FAEs.
Consequently, this classification system may not be valid for classifying FAEs from all
kingdoms (primarily bacteria, and plantae). A second limitation of the system is related
to the number of substrates used for the classification. The esterases display
tremendous catalytic flexibility, being active with a large variety of substrates. The use
of only four substrates may not be enough to measure the catalytic potential of each
group. Even though FAEs display impressive catalytic flexibility and are able to
hydrolyze a broad range of substrates, they are very sensitive with any substitutions of
the aromatic ring (Vafiadi et al., 2006). Altering the substitutions of the aromatic rings on
meta and / or para position drastically affects the enzyme activity. These characteristics
were not used in the classification, perhaps because there is only fragmentary
knowledge regarding the mechanisms of substrate binding.
A second classification model was proposed in 2008 (Benoit et al., 2008). The new
classification scheme is based on the phylogenetic analysis of identified and putative
fungal FAEs. The Benoit scheme proposes the division of FAEs into seven subfamilies,
based on the phylogenetic relationships. The classification does not include biochemical
characteristics. A phylogenetic clustering usually does not correlate with enzymological
characteristics. Since the classification was done in silico using the amino acid
sequences, the scheme represents only the phylogenetic diversity of fungal FAEs.
34
A new classification scheme was also proposed in 2011. This system includes
FAEs from three important kingdoms: bacteria, fungi, and plantae (Udatha et al., 2011).
The main goal of this classification system is to cluster the FAEs that display similar
characteristics into the same group. The template sequences of FAEs were retrieved
from three different sources: NCBI database (http://www.ncbi.nlm.nih.gov/),
biochemically characterized FAEs, and BROAD Institute database
(http://www.broadinstitute.org/) / DOE Joint Genome Institute Database
(http://www.jgi.doe.gov/). The sequences were analyzed with a sequence-derived
descriptor software. Sequence-derived descriptor works with a mathematical algorithm
that can cluster proteins with similar function based on the distribution pattern of critical
amino acids. The amino acids are identified directly from the primary sequence
independently of the full sequence identity (Han et al., 2004). The authors claim that the
pattern of those residues is critical for organizing the catalytic pocket and for substrate
binding. Consequently, the proteins clustered in the same group should display similar
biochemical properties. The complete classification consists of 12 groups and 31
subgroups. The main characteristics of each group are summarized in Table 1-2.
Applications of FAEs
FAEs have a wide application including paper, biofuel, medical, food, and
cosmetic industries. FAEs are used in the pulp and paper industry (Record et al., 2003;
Sigoillot et al., 2005) to remove fine particles from pulp, which reduces the use of
chlorine based chemicals during the bleaching process. It is also important for biofuel
industry, especially as the demand for ethanol increase dramatically. Thus,
hemicellulosic by-products from fermentation become one of the target sources to
produce ethanol. By using FAEs, it is possible to increase the efficiency of

35
hemicellulosic degradation (Fazary & Ju, 2008). Bi-functional enzymes synthesized by
fusing a FAE and an endoxylanase are also used to improve the degradation of
agricultural by-products (Levasseur et al., 2005). An important agricultural by-product,
ferulic acid, is the precursor of vanillin, a flavoring food additive (Priefert et al., 2001). It
can be used as food preservatives because it can inhibit the growth of microorganisms
(Ou & Kwok, 2004). Due to its anti-oxidative property, ferulic acid is a common
ingredients in cosmetics which contributes to skin protection against the UV damage
(Srinivasan et al., 2007).
Another important aspect of FAEs is the stereoselective organic synthesis.
Carboxylesterases are known to catalyze the hydrolysis of ester substrates as well as
the reverse reaction, the acylation of alcohols. Transesterification of secondary alcohols
in low water condition generates synthetic substrates that have no structural similarity to
the natural substrates (Panda & Gowrishankar, 2005). It has been demonstrated that
FAEs from Humicola insolens are able to catalyze the transesterification of secondary
alcohols (Hatzakis et al., 2003; Hatzakis & Smonou, 2005). Pentylferulate ester, an
aromatic precursor used in cosmetics and food processing, is synthesized in high yield
using ferulic acid and acidified n-pentanol by A. niger FAEs (Giuliani et al., 2001). Sugar
phenolic esters have anti-microbial and anti-tumor activities (Fazary & Ju, 2008). A FAE
produced by Fusarium oxysporum is able to esterify several phenolic acids such as
hydroxyphenylacetic acid and cinnamic acid with 1-propanol working in a mixture of n-
hexane / 1-propanol / water condition (Topakas et al., 2003). The ability to perform
catalysis in organic systems with low water content indicates that FAEs could be
important for synthesizing phenolic chemicals with specific scaffolds. This is an
36
important enzyme characteristic required for the synthesis of prodrugs and chiral
compounds. A deep knowledge regarding the enzyme biochemistry, estereospecificity,
and the molecular mechanisms involved in substrate selection are critical to evaluate
the potential of the enzymes to be used in these kinds of applications.
Project Rationale and Design
The objectives of this study were to identify the coding sequences, elucidate the
biochemical properties, reveal the enzyme structure, and determine the substrate
binding mechanism of a bacterial FAE found in the intestinal tract. Lactobacillus
johnsonii, a bacterium isolated from animal models that display high FAE activity, was
selected as an enzyme donor to clone recombinant FAEs. L. johnsonii was selected
because it is also a human commensal that could be used as a probiotic. It is expected
that the FAE activity displayed by L. johnsonii will contribute to: 1) the dietary
importance of phenolic acids and 2) the importance of microbial gut esterases on the
improvement of carboxylic phenols absorption at the intestinal level.
Although several bacterial species isolated from mammal intestines display FAE
activity, the genes encoding FAEs were not identified before this work. A genomic
approach was used to identify the genes encoding hypothetical enzymes with potential
FAE activity. Once the FAE coding sequences were located, the genes were cloned,
expressed in E. coli and purified by nickel affinity chromatography as recombinant His6-
tagged proteins. The substrate preference of the selected enzymes was verified using
multiple assays with a large array of substrates.
The major challenge of the experimental design was the elucidation of the
substrate binding mechanism. To accomplish this challenge, the nucleophile of the
37
enzyme was mutated using site-directed mutagenesis. This strategy was used to
perform further co-crystallization assays with substrates of interest.
The majority of FAEs characterized and described in the publicly available
databases were purified from fungal species. The amount of data concerning the
biochemistry or even structural information of bacterial FAEs is limited. This work has
contributed to the knowledge of phytophenol esters catalysis by a bacterial FAE.

38
Table 1-1. Functional classification of FAEs based on substrate specificity and primary sequence similarity.
Type Hydrolyzable Substrates Ability to release diferulic acid from plant cell wall
Primary sequence similarity
A
methyl ferulate, methyl sinapate, methyl p-coumarate
yes
lipase
B methyl ferulate, methyl sinapate, methyl caffeate
no cinnamoyl esterase family 1, acetyl xylan esterase
C methyl ferulate, methyl sinapate, methyl p-coumarate, methyl caffeate
no chlorogenate esterase, tannase
D methyl ferulate, methyl sinapate, methyl p-coumarate, methyl caffeate
yes xylanase

39
Table 1-2. Descriptor-based classification of FAE proposed by Udatha (Udatha et al., 2011).
FAE family Sub-family Orientation and distance (number of amino acids) between catalytic residues
FEF1 1A D ...........54 – 81........... S ...........79 – 111........... H
1B S ..........51 – 183.......... D ...........29 – 178........... H FEF2 - S ...............53............... D ................71................ H FEF3 3A S .........192 – 269......... D ............36 – 50............ H
3B S ...............18............... D ..........265 – 270.......... H
3C H ...............50............... S ................79................ D
FEF4 4A S .........194 – 248......... D ............36 – 46............. H
4B S ...............18............... D ..........154 – 241........... H
4C S ...........64 – 69........... D ............30 – 182........... H
4D H ...............54............... D ................28................ S
or
H ...............27............... S ................211................ D FEF5 5A S .........236 – 255......... D .............37 – 39............. H
5B S ...........18 – 89........... D .............47 – 62............. H
5C H ...........71 – 81........... S ...........84 – 176............. D FEF6 6A S ..........81 – 247.......... D .............38 – 59............. H
6B H ............1 – 83............ S .............61 – 84............. H FEF7 7A S .........175 – 253......... D .............36 – 47............. H
7B S ...............18............... D ...........233 – 240........... H
7C S ...........81 – 83........... D .................56................ H FEF8 8A S .........144 – 358......... D ............32 – 41.............. H
8B S ...............18............... D ...........204 – 236........... H
8C H ...........51 – 87........... S .............18 – 57............. D
8D D ...........68 – 89........... S ............86 – 117............ H FEF9 9A S .........212 – 393......... D .............12 – 40............. H
9B D ...........16 – 74........... S ............88 – 155............ H
9C H ...........36 – 56........... S .............57 – 60............. D FEF10 10A S ..........55 – 248.......... D .............36 – 74............. H
10B D ...........69 – 82........... S .............86 – 96............. H
10C H ...........81 – 83........... S .............81 – 83............. D FEF11 11A S .........209 – 246......... D .............36 – 41............. H
11B S ...............18............... D ...........135 – 243........... H FEF12 12A H ................1................ S .............56 – 61............. D
12B S ..............211.............. D .............36 – 46............. H
S: serine. D: aspartic acid. H: histidine.
40
Figure 1-1. Classification of phytophenols. The figure displays the relevant backbone chemical structure of the four central phytophenols groups. The groups of flavonoids are further divided into six subclasses and the phenolic acids into two subclasses based on the position and biochemical characteristics of the subtituents groups.

41
Figure 1-2. Phenolic acid subgroups. The phenolic acid derivatives are classified into two subgroups: hydroxycinnamic and hydroxybenzoic acids. The figure displays the chemical structures of typical members of each group.
42
Figure 1-3. Esterification of phenolic compounds. In nature, the monophenols are usually esterified to form (A and B) soluble compounds or associated to macromolecular structures like (C) hemicellulose. The ester bonds are indicated with a red arrow. The arabinoxylan backbones are depicted in brown color.

43
Figure 1-4. Intestinal absorption of phytophenols and phenolic acids. The majority of the dietary phytophenols and phenolic acids are absorbed at the intestinal level. A small portion of phytophenols is absorbed through paracellular diffusion with low efficiency. The remaining phytophenols are subjected to hydrolysis by bacterial esterases to release the efficiently absorbable phenolic acids. A portion of those phenolic acids can be further modified by bacterial activity. The modified phenolic acids are actively transported by the intestinal cells through the monocarboxylic acid transporter (MCT) with high efficiency. The absorbed phenols circulate in the blood stream to the different parts of the body and are further modified by the host metabolism.
44
Figure 1-5. Chemical structures of ester backbones. (A) Ester bonds are present in biologically relevant substrates. (B) The chemical compounds depicted are used to illustrate carboxylic esters, thioesters, and phosphoric acid esters.

45
Figure 1-6. Natural phytophenols are frequently present in the human diet. The phytophenols displayed in the figure (red) are potential FAE substrates present in the human diet. The blue boxes highlight the bioactive products released after enzymatic hydrolysis.
46
Figure 1-7. Catalytic mechanism characteristic of the carboxylesterases that use serine as the nucleophile center. The catalytic steps are illustrated using methyl ferulate as a substrate model. R1 represents the phenolic acid moiety and R2 represents methoxy group. X and Y were used to represent the unknown amino acids that will contribute with catalysis by forming the oxyanion hole. While the catalytic triad (serine, histidine, aspartic acid) is highly conserved, the amino acids of the oxyanion hole may vary.

47
CHAPTER 2 MATERIALS AND METHODS
Chemicals, Media, and Strains
Chemicals
All analytical grade chemicals and desalted oligonucleotides (primers) were
purchased from Sigma-Aldrich (St. Louis, MO, USA). Ethyl ferulate was purchased from
Apin Chemicals Ltd. (Abingbon, OX, UK). Chemicals for buffer and culture medium,
reagents, and EZrunTM Protein Marker were purchased from Fisher Scientific (Atlanta,
GA, USA). Restriction enzymes, T4 DNA ligase, Finnymes’ PhusionTM high fidelity DNA
polymerase, Quick-Load® Taq 2X Master Mix DNA polymerases, Quick-Load® 100 bp
molecular weight standards, Quick-Load® 1 kb molecular weight standards,
deoxyribonucleotide triphosphates (dNTPs), were purchased from New England Biolabs
(lpswich, MA, USA). In-FusionTM Dry-Down Mix was purchased from Clontech
(Mountain View, CA, USA). DNeasy Blood & Tissue Kit, QIAGEN Plasmid Mini Kit,
QIAquick PCR Purification Kit, and nickel-nitriloacetic acid resin (Ni-NTA Superflow)
were purchased from QIAGEN (Valenia, CA, USA). Molecular biology assays were
done using ultra-pure water (Synergy® UV Millipore Water Purification System).
Growth Conditions of E. coli Strains
Bacterial strains used for cloning and protein expression are summarized in Table
2-1, 2-3, and 2-5. E. coli Library Efficiency® DH5αTM strain was purchased from
InvitrogenTM (San Diego, CA, USA). E. coli BL21-CodonPlus (DE3)-RIPL strain was
purchased from Stratagene Agilent Technologies (La Jolla, CA, USA). E. coli DH5α
strain was routinely used for plasmid purification. E. coli BL21 (DE3) strain was used for
protein over-expression and subsequent protein purification. Wild type E. coli strains

48
were grown in Lysogeny Broth (LB) medium at 37oC at 250 RPM. For purification of N-
terminally labeled His6-tagged proteins, E. coli strains carrying recombinant plasmid
were freshly inoculated from -80oC glycerol stocks into 25 mL LB medium. The medium
was supplemented with ampicillin 100 μg . mL-1 and the cells were grown for 16 hours at
37oC, 250 RPM. The cells were then sub-cultured (1% v / v) into 2 L of LB medium and
grown at 37oC, 250 RPM. When the optical density 600nm (OD600) of the culture
reached 0.6, isopropyl β-D-1-thiogalactopyranoside (IPTG) was added to the final
concentration of 1 mM to initiate over-expression of recombinant proteins. The induction
was carried out for 16 hours at 17oC, 250 RPM. The cells were harvested by
centrifugation and the cell mass was immediately used for protein purification or stored
at -80oC until purification.
Preparation of Competent E. coli Cells
The following procedures were used to prepare competent E. coli DH5α cells and
competent E. coli BL21 cells. A single colony of E. coli was isolated from E. coli DH5α
or E. coli BL21 streaked LB agar plate supplemented with 10 mM MgCl. The colony was
inoculated into 5 mL TyM broth (2% tryptone, 0.5% yeast extract, 0.58% NaCl, 0.2%
MgCl, w /v) and incubated for 2 hours at 37oC, 250 RPM. The cells were inoculated into
300 mL TyM broth and incubated at 37oC at 250 RPM until OD600 reached 0.5. The cell
mass was collected through centrifugation at 1600 x g for 12 min at 4oC. The cells were
resuspended in 120 mL of Tfb1 buffer (100 mM KCl, 50 mM MnCl2, 10 mM CaCl2, 30
mM potassium acetate, 15% glycerol v / v , pH 5.8). The resuspended cells were
incubated on ice for 90 min. The cell mass was collected again by centrifugation at 3000
1600 x g for 8 min at 4oC. The cells were resuspended in 12 mL of Tfb2 buffer (10 mM

49
MOPS, 10 mM KCl, 75 mM CaCl2, 15% glycerol v / v, pH 7) and stored at -80oC in small
aliquots (100 μL each) until further needed.
Isolation and Growth Condition of Lactobacillus strains
Lactobacilli were previously isolated by plating out aliquots of BB-DP and BB-DR
rats stool samples directly in selective de Man Rogosa Sharpe (MRS) agar plates by Dr.
Graciela Lorca, University of Florida. Cultures were grown at 37°C anaerobically in a
gas pack system (Rogosa et al., 1951). Individual colonies were picked and inoculated
into 6 mL MRS broth and grown at 37°C under anaerobic conditions without shaking.
The isolated strains were conserved in 96-well plates with 25% final glycerol
concentration and stored at -80°C.
DNA Procedures
Lactobacillus Strain identification
Total genomic DNA was extracted using DNeasy Blood & Tissue Kit. The selected
strains were identified by sequencing an internal 16S rDNA fragment from genomic
DNA with Applied Biosystems model 3130 genetic analyzer (DNA Sequencing Facilities,
Interdisciplinary Center for Biotechnology Research, University of Florida) using the
primers listed in Table 2-2. The result sequences were blasted against NCBI Database
(Benson et al., 2011) to identify the donor species.
In silico Selection of Potential FAE Encoding Genes
Genes encoding proteins with potential esterase activity were selected based on in
silico prediction using Comprehensive Microbial Resource (CMR) Database (Davidsen
et al., 2010). Five ORFs encoding putative/hypothetical proteins (locus tag: LJ0044,
LJ0114, LJ0536, LJ0618, LJ1228) that displayed the characteristic esterase motif
(Brenner, 1988; Cygler et al., 1993) were selected. The genomic sequence of L.
50
johnsonii NCC 533 (GI# 41584196) was used as a reference. The primers were
designed based on the genomic sequence of L. johnsonii NCC 533 and L. johnsonii
N6.2 chromosomal DNA was used as template for gene cloning. Three ORFs (lotus tag:
LREU1549, LREU1667, LREU1684) were selected from reference genomic sequence
of L. reuteri DSM 20016 (GI# 148530277). The primers were designed based on the
genomic sequence of L. reuteri DSM 20016 and L. reuteri TDI chromosomal DNA was
used as template for gene cloning.
Cloning of Potential FAEs
Plasmid p15TV-L (Figure 2-1) contains bla (ampicillin resistance) gene, which
serves as a selectable marker. It also contains sacB gene, which encodes
levansucrase. Levansucrase is an enzyme that hydrolyzes sucrose to produce levan.
The expression of SacB is toxic to E. coli. Thus, the growth of E. coli transformed with
p15TV-L plasmid is inhibited when the LB medium is supplemented with 5% sucrose (w
/ v) unless the SacB gene is removed. Ligation-independent cloning (LIC) sequences
are located on the flanking regions of sacB gene.
Primers with LIC sequence at 5’ end were used to PCR amplify genes of interest.
The cloning of PCR fragments into p15TV-L plasmid were done by DNA recombination
in the LIC sequence using In-FusionTM Dry-Down Mix (Lorca et al., 2007a). Each in-
fusion pellet was resuspended in 8.5 μL of p15TV-L plasmid (75 ng . μL-1). 0.5 μL of
PCR fragment (~ 1 mg . μL-1) was mixed with 2 μL of the resuspended pellet-plasmid to
initiate DNA recombination. The mixture was incubated at room temperature for 30 min
to generate a recombinant plasmid. During DNA recombination, the SacB gene was
replaced by the PCR fragment. Thus, LB agar plates supplemented with 5% sucrose (w
/ v) and 100 μg . mL-1 ampicillin were used for positive selection. IPTG was used to

51
induce the transcription of the cloned gene. The protein possessed His6-tagged at the
N-terminus following by a TEV protease cleavage site after translation.
The genes of interest were PCR amplified from genomic DNA obtained from the
isolated strains. The DNA amplification was done using Taq 2X master Mix DNA
Polymerases. The primers used are listed in Table 2-2 and 2-6. All PCRs were
performed using MyCyclerTM Personal Thermal Cycler (Bio-Rad Laboratories). The PCR
fragments were cloned into p15TV-L as described above. The recombinant plasmids
were transformed into E. coli DH5α. Heat shock transformation procedures were done
as follows: 50 μL competent cells were mixed with 2.5 μL recombinant plasmids. The
mixture was incubated on ice for 20 min, followed by 5 min in 37oC water bath, and 3
min on ice. 950 μL of LB medium was added to the mixture and incubated for an
additional 45 min in 37oC water bath. Cells were collected by centrifugation at 7500
RPM (JLA16.250 rotor, Beckman Coulter) for 3 min. 900 μL of supernatant was
discarded. The cells were resuspended in the remaining 100 μL supernatant. The cells
were plated on LB agar plate supplemented with 100 μg . mL-1 ampicillin and 5%
sucrose (w / v) for positive selection. Colony PCR was also used to screen for positive
colonies. Plasmids were extracted using QIAGEN Plasmid Mini Kit. Sequences of PCR
insert of all clones were confirmed by Applied Biosystems 3730 capillary sequencer
using T7 primers (DNA Lab, Arizona State University) on the extracted plasmids. The
plasmids with correct clones were further transformed into E. coli BL21 for protein over-
production.
Cloning of Human Valacylovir Hydrolase (VACVase)
The plasmid containing the gene of interest (pET17b-VACVase) was provided by
Dr. Gordon L. Amidon, University of Michigan (Lai et al., 2008). The gene of interest

52
was cloned into p15TV-L plasmid using the primers listed in Table 2-4 and confirmed by
DNA sequencing as described above.
Generating LJ0536 Protein Variants
The LJ0536 p15TV-L clone was used as a wild-type plasmid template for site
directed mutagenesis assay. The 39-nucleotide long complementary primers containing
the desired mutation were used to introduce individual mutations. The primers are listed
in Table 2-4. The amino acids selected for modification were replaced by alanine due to
its small, simple chemical structure (alanine scanning). The inert alanine methyl
functional group will not introduce interaction within the protein. The mutants were
constructed by PCR using Finnymes PhusionTM high fidelity DNA polymerase according
to manufacturer’s protocol. To generate a deletion mutant of the inserted α / β domain
(from V147 to A173 of LJ0536), primers LJ0536DEL147-173aa_SmaI-Fw and
LJ0536DEL147-173aa_SmaI-Rv were used for PCR amplification to amplify the LJ0536
p15TV-L plasmid. The resulting PCR fragment contained a segment of LJ0536 at the 5’
end (Q174 to F249) and a segment of LJ0536 at the 3’ end (M1 to G146) connected by
the sequence of p15TV-L plasmid. It was flanked with SmaI restriction sites on both
ends, allowing restriction digestion and ligation to complete the recombinant plasmid.
The PCR fragment was digested with SmaI restriction enzyme for 2 hours at 37oC.
Ligation was carried out using T4 DNA ligase at 16oC for 16 hours to ligate the SmaI
restriction site. The PCR amplified plasmids were then treated with 10 units of DpnI
restriction enzyme 2 times at 37oC for 1 hour each time to digest the methylated wild-
type plasmid template. The recombinant plasmids were transformed into E. coli DH5α.
The mutant sequences were confirmed by DNA sequencing (DNA Lab, Arizona State
University).
53
DNA Gel Electrophoresis
DNA was separated by gel electrophoresis using 1% (w / v) agarose gel in 1X TAE
electrophoresis buffer (40mM tris(hydroxymethyl)aminomethane (Tris) acetate pH 8.5, 2
mM ethylenediaminetetraacetic acid (EDTA)). Gels images were captured using
ImageQuant 400 imaging system (GE Healthcare) after staining with 0.5 μg . mL-1
ethidium bromide.
Protein Procedures
Protein Purification
The expression of His6-tagged proteins was carried out in E. coli BL21 using IPTG
(1 mM) to induce gene transcription on p15TV-L. The cells were collected by
centrifugation at 8000 RPM (JLA8.1000 rotor, Beckman Coulter) for 25 min. The
collected cell mass was resuspended in 25 mL binding buffer (5 mM imidazole, 500 mM
NaCl, 20 mM 4-(2-hydroxyethyl)-1-piperazineethanesulfonic acid (HEPES) pH 7.5) and
then disrupted by French press (20000 psi). The cell free extract was collected by
centrifugation at 4oC, 17500 RPM (JA25.50 rotor, Beckman Coulter) for 25 min. The
soluble His6-tagged proteins were purified by affinity chromatography as follows: all
solutions were passed through the Ni-NTA column by gravity flow. The Ni-NTA column
was first washed with 30 mL of ultra-pure water to wash out any unbound nickel ions. It
was then pre-equilibrated with 30 mL binding buffer. The cell free extract was applied to
Ni-NTA column. During this step, the His6-tagged proteins were bound to nickel ions
that were immobilized by NTA. The resin was washed with 30 mL of binding buffer to
wash out any unbound proteins. 200 mL of wash buffer (20 mM imidazole, 500 mM
NaCl, 20 mM HEPES pH 7.5), which contains a higher concentration of imidazole, was
used to remove unspecific proteins that were bound to the resin. Imidazole is a
54
competitive molecule that displaces the nickel ions bound to His6-tagged protein. The
His6-tagged proteins were eluted using 20 mL elution buffer (250 mM imidazole, 500
mM NaCl, 20 mM HEPES pH 7.5). The purified proteins were dialyzed at 4°C for 16
hours. The dialysis buffer was composed of 50 mM HEPES buffer pH 7.5, 500 mM
sodium chloride (NaCl), and 1 mM dithiothreitol (DTT). After dialysis, the samples were
flash frozen and preserved at -80°C in 200 μL aliquots until needed. The His6-tag was
removed by treatment with tobacco etch virus (TEV) protease (60 ug TEV protease per
1 mg of target protein) at 4oC for 16 hours. The sample was passed through a nickel
affinity chromatography column to eliminate the released His6-tag. Collected proteins
were dialyzed at 4oC against dialysis buffer for 16 hours. The purified proteins without
His6-tag were flash-frozen and preserved in small aliquots at -80oC until needed.
Sodium Dodecyl Sulfate-Polyacrylamide Gel Electrophoresis (SDS-PAGE)
Purified proteins were analyzed in SDS-PAGE (120 V, 65 - 70 min.) to verify
induction and to determine the purity of proteins after the affinity chromatography.
Proteins were mixed with SDS-PAGE loading dye (100 mM Tris-HCl pH 6.8, 2% (w / v)
SDS, 10% (v / v) glycerol, 10% (v / v) β-mercaptoethanol, 0.6 mg . mL-1 bromophenol
blue) and boiled at 95oC for 5 min prior loading to the gel. Electrophoresis was done in
buffer composed of 25 mM Tris buffer, 192 mM glycine, and 0.1% (w / v) SDS. Gels
were stained with Coomassie Blue (PhastGel Blue R-350) and images were captured
using HP Scanjet G3010 Scanner (Hewlett-Packard).
Protein Quantification
Protein concentration was quantified using Bradford reagent (Bradford, 1976).
The calibration of Bradford reagent was done using bovine serum albumin as a

55
standard. Absorbance at 595 nm (A595) was determined using UV-1700 PharmaSpec
UV-VIS Spectrophotometer (Shimadzu).
Enzyme Assays
Feruloyl esterase screening assay
The ability of Lactobacillus strains to produce FAEs was analyzed on MRS agar
plates supplemented with 0.1% (w / v) ethyl ferulate without glucose (Donaghy et al.,
1998). The presence of ethyl ferulate created a turbid / milky appearance of MRS agar
due to the semi-soluble ethyl ferulate at 0.1% (w / v) final concentration. Ferulate assay
(MRS-EF) plates were inoculated with cell obtained from individual overnight MRS
cultures. The plates were incubated at 37°C in a gas pack system for a maximum of 3
days. The formation of halo (clear area) around the colonies indicated the presence of
ferulate esterase activity. The strains with the highest activity (largest halos) were
selected for further analysis.
Determination of optimal assay conditions
Model carboxylesterase substrates (4-nitrophenyl butyrate) was used as enzyme
substrate. The optimal pH for catalysis of each purified enzyme was determined at 37oC
using a set of overlapping buffers: 2-(n-morpholino)ethanesulfonic acid (MES) pH 5.5 –
6.4, N,N-bis(2-hydroxyethyl)-2-aminoethanesulfonic acid (BES) pH 6.4 – 7.8, HEPES
pH 6.8 – 8.2, Tris-HCl pH 7.5 – 9.0, 2-(n-cyclohexylamino)ethane Sulfonic Acid (CHES)
pH 8.6 – 10. The buffers were used at 20 mM final concentration.
The optimal temperature of each purified enzyme was estimated by incubating the
reaction mixture at different temperatures (13 – 40oC) at the optimal pH of each
enzyme. The reaction mixture consisted of 20 mM buffer, 1 mM 4-nitrophenyl butyrate,
and 0.3 – 1.7 μg of enzyme per mL of reaction mixture. 4-nitrophenols were released

56
from 4-nitrophenyl butyrate during hydrolysis. Enzyme activity was continuously
monitored for 15 min at 412 nm using UV-1700 PharmaSpec UV-VIS
Spectrophotometer (Shimadzu) or Synergy™ HT Multi-Detection Microplate Reader
(Biotek). The increase in absorbance due to the increase concentration of free 4-
nitrophenols indicated enzyme activity. All assays and controls were performed in
triplicate.
Extinction coefficient of 4-nitrophenol (16300 M-1 . cm-1) was used to quantify the
release of 4-nitrophenol using the following equation:
ΔC = ΔAbs / ε l Equation (2-1)
ΔC is the change of concentration of chemical measured (mM . min-1). ΔAbs is the
change of absorbance (Abs . min-1). ε is the extinction coefficient of chemical measured
(M . cm-1). l is the path-length of light traveled through the sample (automatically
adjusted to 1 cm by reader).
Enzyme specific activities were calculated using the following equations:
SA = ΔC / [enzyme] Equation (2-2)
SA is the enzyme specific activity represented the amount of chemical released or
hydrolyzed per mg of protein per min (μmol . mg-1 . min-1). ΔC is the change of
concentration of chemical measured (mM . min-1). [enzyme] is the concentration of
enzyme in the reaction mixture (mg . mL-1).
Determination of enzymes substrate preference
The enzymatic substrate profiles were determined at 25oC using an ester library
composed of variety of ester substrates (Liu et al., 2001). The enzyme activity was
monitored with 4-nitrophenol (Janes et al., 1998) using the following protocol. The
purified enzymes were thawed from -80oC and re-dialyzed against 5 mM BES buffer pH
57
7.2. The reactions were carried out in 96 well plates; each enzymatic reaction contained
1 mM ester substrate, 0.44 mM 4-nitrophenol (proton acceptor), 4.39 mM BES pH 7.2,
7.1% (v / v) acetonitrile, and 30 - 35 µg per mL of enzyme in a total volume of 105 μL
reaction mixture. The 96 well plates were incubated at 25oC using Synergy™ HT Multi-
Detection Microplate Reader (Biotek). The reactions were continuously monitored for 30
min at 404 nm. The concentration of 4-nitrophenol was estimated using the extinction
coefficient (ε = 16,100 M-1 . cm-1) and Equation 2-1. Enzyme specific activity was
calculated using Equation 2-2. All assays and controls were performed in triplicate.
Results are shown as mean ± standard deviation.
Determination of biochemical parameters by saturation kinetics
As enzyme reactions are saturable, the biochemical parameters such as Km
(Michaelis constant: amount of substrate required to reach half of Vmax which associates
with substrate affinity. Low value of Km indicates high substrate affinity), Vmax (maximum
rate of reaction or maximum enzyme specific activity), Kcat (catalytic rate constant, s-1),
and Kcat / Km (catalytic efficiency, M-1 . s-1) could be determined by measuring the initial
rate of the reaction over a range of substrate concentration. Kcat is calculated with the
following equation:
Kcat = Vmax / [enz] Equation (2-3)
[enz] is the amount of enzyme in μmol . mg-1 estimated from the molecular weight of
enzyme (LJ0536: 27570 g . mol-1; LJ1228: 27454 g . mol-1).
The model substrates (α-naphthyl acetate, β-naphthyl acetate, α-naphthyl
propionate, β-naphthyl propionate, α- naphthyl butyrate, β-naphthyl butyrate, 4-
nitrophenyl acetate, 4-nitrophenyl butyrate, 4-nitrophenyl caprylate) were used to
determine the biochemical parameters of the purified enzymes (Gonzalez et al., 2006).

58
The enzymatic saturation assays were conducted at the optimal pH and temperature
determined for each purified enzyme. The enzyme activities of the wild type enzyme
LJ0536 and all the LJ0536 mutants were carried out in 20 mM HEPES buffer pH 7.8 at
25 °C. The assays with LJ1228 were performed in 20 mM MES buffer pH 6.7 at 30°C.
All reactions were continuously monitored for 15 min at 412 nm in 96-well plate using
Synergy™ HT Multi-Detection Microplate Reader (Biotek). The extinction coefficients of
α / β-naphthyl esters (3000 M-1 . cm-1) and 4-nitrophenol (16300 M-1 . cm-1) were used to
calculate the amount of substrate hydrolyzed with Equation 2-1. Enzyme specific
activities were calculated with Equation 2-2. The kinetic parameter Km and Vmax were
estimated by non-linear fitting using Origin 8 software (OriginLab). All kinetic parameters
were determined from the average of triplicated assays.
Enzyme activity assays towards aromatic esters (ethyl ferulate and chlorogenic
acid) were conducted by continuously monitoring the UV-absorbance of the reaction
mixture at 324 nm for 10 min. The reactions were carried out in a 96 well UV plate using
Synergy™ HT Multi-Detection Microplate Reader (Biotek). The typical reaction mixture
contained 20 mM buffer, 0.01 to 0.20 mM substrate, and 0.05 to 0.1 μg . mL-1 of purified
enzyme. The extinction coefficient of ethyl ferulate (ε = 15390 M-1 . cm-1) and
chlorogenic acid (ε = 26322 M-1 . cm-1) were determined experimentally and were used
to estimate the amount of substrate hydrolyzed. The kinetic parameters were
determined as described above from the average of triplicated assays.
Effect of bile salt component and metal ions on enzyme activity
The effect of bile salt components such as sodium glycocholate, taurocholic, and
deoxycholic acid were assayed in a range of concentration (0.1 to 10 mM) using the
model substrate 4-nitrophenyl butyrate. The effect of metal ions (FeCl2, FeCl3, CdCl2,

59
CaCl2, CoCl2, MnCl2, ZnCl2, CuCl2, MgCl2) were assayed in 1 mM. The assays were
conducted at the optimal pH and temperature determined for each purified enzyme. A
typical enzyme reaction mixture contained 20 mM buffer, 1 mM 4-nitrophenyl butyrate,
and 0.3 – 1.7 μg / mL enzyme. The reactions were continuously monitored for 10 min at
412 nm using Synergy™ HT Multi-Detection Microplate Reader (Biotek) and the
enzyme activities were calculated using Equation 2-1 and Equation 2-2. All assays and
controls were performed in triplicate.
LJ0536 mutants and VACVase ester screening assay
The enzymatic activities toward aliphatic (4-nitrophenyl butyrate) and aromatic
(ethyl ferulate, chlorogenic acid, and rosmarinic acid) substrates were measured
spectrophotometrically using a Synergy™ HT Multi-Detection Microplate Reader
(Biotek). The hydrolysis of aliphatic esters was monitored at 412 nm. The hydrolysis of
aromatic esters was monitored at 324 nm. A typical reaction mixture contained 20 mM
HEPES pH 7.80, 0.1 mM ester substrate, and 0.3 μg . mL-1 purified enzymes (ethyl
ferulate and chlorogenic acid) or 3 μg . mL-1 purified enzymes (4-nitrophenyl butyrate
and rosmarinic acid). Up to 30 μg . mL-1 of VACVase was used to detect enzyme
activity. The enzyme reactions of LJ0536 wild type and LJ0536 mutants were carried
out at 25oC. The enzyme reactions of VACVase were carried out at 37oC. The extinction
coefficients of 4-nitrophenyl butyrate (16300 M-1 . cm-1), ethyl ferulate (15390 M-1 . cm-1),
chlorogenic acid (26322 M-1 . cm-1), and rosmarinic acid (15670 M-1 . cm-1) were used to
estimate the amount of substrate hydrolyzed using Equation 2-1 and Equation 2-2. All
assays were performed in triplicate.

60
Detection of phenolic acids using high performance liquid chromatography (HPLC)
HPLC was used to identify and measure the compounds released by enzymatic
action from the complex substrates. A typical reaction mixture contained 20 mM HEPES
pH 7.80, 1 mM ester substrate, and 20 μg . mL-1 enzyme. All reaction mixtures were
incubated for 16 hours and filtered using 0.45 μm filter prior to HPLC analysis. HPLC
analyses were performed using the HPLC L-2000 series system (Hitachi) with
Symmetry® C18 5 μm 3.9 mm x 150 mm reversed-phase column protected with a
Symmetry® C18 5 μm guard column (Waters). Detection of products released by
enzyme activities using bran, ethyl ferulate, chlorogenic acid, and rosmarinic acid as
substrates were carried out at 324 nm using linear gradient elution with water / acetic
acid / 1-butanol (350:1:7, v / v / v) and methanol with a flow rate of 1 mL . min-1.
(Mastihuba et al., 2002).
To detect the hydrolysis of valacyclovir, the reaction mixture contained 50 mM
HEPES pH 7.80, 4 mM valacyclovir, and 10 μg . mL-1 enzyme. Detection of enzyme
activity was carried out at 254 nm using linear gradient elution with acetonitrile at a flow
rate of 1 mL . min-1. (Lai et al., 2008).
Determination of native molecular weight using size exclusion chromatography
The native molecular weight of the proteins studied was determined by gel
filtration size exclusion chromatography (SEC). The assays were performed in a LCC-
501 Plus FPLC System (Pharmacia Biotech) with column Superose 12 10 / 300 GL (GE
Healthcare). A linear regression fitting standard was constructed using Immunoglobulin
G (150 kDa), bovine serum albumin (66 kDa), ovalbumin (45 kDa), trypsinogen (24
kDa), α-lactalbumin (14.2 kDa), cytochrome C (12.3 kDa), and vitamin B12 (1.4 kDa) as

61
molecular weight standards. Mobile phase was composed of 10 mM HEPES buffer and
150 mM NaCl. Data was analyzed using FPLCdirectorTM (Pharmacia Biotech).
Analysis of protein secondary structure by circular dichroism
Protein secondary structure was estimated using AVIV Quick Start 215 Circular
Dichroism Spectrometer with 0.1 cm quartz cuvette (Hellma, Jamaica, NY). The protein
samples were thawed from -80oC and re-dialyzed against 2 mM HEPES buffer with 50
mM NaCl during 16 hours. The samples were adjusted to 0.2 mg . mL-1 in 0.5 mM
HEPES buffer with 10 mM NaCl after dialysis. The spectra was acquired at 1 nm
intervals and averaged with 10 scans. Multiple scans with buffer alone were used to
correct the background. The final spectra was expressed in molar ellipticity (ME) using
the following equation:
ME = θ / 10nCl Equation (2-4)
θ is the signal acquired, n is the number of residues, C is the molar concentration
of protein, and l is the path-length of the cuvette.
X-Ray Crystallization of LJ0536 and S106A
X-ray crystallization was carried out in collaboration with Banting and Best
Department of Medical Research, Centre for Structural Proteomics in Toronto
(University of Toronto). The crystal structures were provided by Banting and Best
Department of Medical Research. Structural Analyses were done in our laboratory. All
His6-tagged proteins were crystallized using the sitting drop method with Intelliplate 96-
well plates and a Mosquito Crystal liquid handling robot (TTP LabTech), mixing 0.5 μL
of protein at 15 mg . mL-1, and 0.5 μL of reservoir solution, over 100 μL reservoir
solution. The protein solutions were pre-treated with the proteases subtilisin and V8 for
the wild type and catalytic serine deficient (S106A) mutant of LJ0536, respectively. The

62
proteases stored at 1 mg . mL-1 stock solution were added to a final 1:10 v / v ratio
protease:protein). Successful crystallization required the presence of the different
proteases, a technique often used to increase the success of crystallization due to
removal of disordered / flexible regions that would disrupt crystal formation (Dong et al.,
2007).
Reservoir solutions were identified through an in-house custom crystallization
screen that was optimized based on success of common commercial sparse-matrix
crystallization screens (Kimber et al., 2003). The concentrations used in each case
were: apo LJ0536 enzyme: 0.1 M MES pH 6 and 20% (v / v) PEG10K; catalytic serine
deficient (S106A) mutant: 0.1 M sodium cacodylate pH 6.5, 0.2 M calcium acetate, 9%
(v / v) PEG 8K; S106A co-crystallized with ethyl ferulate Form I: 0.1 M Tris pH 8.5, 0.2
M ammonium sulphate, 25% (v / v) PEG 3350; S106A co-crystallized with ethyl ferulate
Form II: 0.1 M Tris pH 8.5, 0.2 M ammonium sulphate, 24% (v / v) PEG 3350; S106A
co-crystallized with chlorogenic acid: 0.1 M Tris pH 8.5, 0.2 M lithium sulphate, 30% (v /
v) PEG 4K; S106A co-crystallized with chlorogenic acid: 0.1 M Tris pH 8.5, 0.2 M lithium
sulphate, 30% (v / v) PEG 4K; S106A co-crystallized with ferulic acid: 0.1 M Tris pH 8.5,
0.2 M lithium sulfate, 30% (v / v) PEG 4K.
Ligands were co-crystallized at a final ligand concentration of 5 mM (25 mM for
ethyl ferulate Form II) in the sitting drop, by diluting a stock solution of 100 mM ligand
1:20 v / v with the protein/protease mix; 0.5 μL of this new solution was mixed with 0.5
μL of reservoir solution for crystallization.
All crystals were cryo-protected with reservoir solution supplemented with
paratone-N oil (Hope, 1988) prior to flash freezing in an Oxford Cryosystems

63
cryostream. Diffraction data at 100 K at the Cu-K wavelength were collected at the
Structural Genomics Consortium using a Rigaku FR-E Superbright rotating anode with a
Rigaku R-AXIS HTC detector. Diffraction data was reduced with HKL2000 (Otwinowski
& Minor, 1997).
The LJ0536 apo structure was solved by Molecular Replacement (MR) using
Phaser (McCoy et al., 2007), with a poly-alanine form of the structure of feruloyl
esterase (Est1E, PDB: 2WTM) from B. proteoclasticus (Goldstone et al., 2010) as a
search model. The successful MR solution was identified by map inspection using Coot
(Emsley & Cowtan, 2004) and by a decrease in Rfree after refinement using Refmac
(Murshudov et al., 1997). The structure was fully built by manual building and rounds of
refinement with Refmac, Phenix.refine (Adams et al., 2010) and Buster (Blanc et al.,
2004) at the final stages. Anisotropic B-factors were refined for protein and ligand atoms
for all structures. Non-crystallographic (NCS) restraints were not utilized for any
structure. All structures were refined using TLS parameterization (TLS groups were the
N-terminal residue to residue 179, and 180 to the C-terminal residue), as assigned by
the TLSMD server (Painter & Merritt, 2006). Additional TLS restraints resulted in lower
R and Rfree values. Water atoms were added by automatic methods using the
refinement programs used in each structure (Phenix.refine, Refmac / CCP4 / ARP /
wARP, or BUSTER, respectively). Ions were added after the automatic water building
by inspection of magnitude of residual Fo-Fc density and hydrogen bonding patterns.
The final atomic models include residues 1-245 of LJ0536, with six atoms from the
expression tag at the N-terminus of one chain of the asymmetric unit.
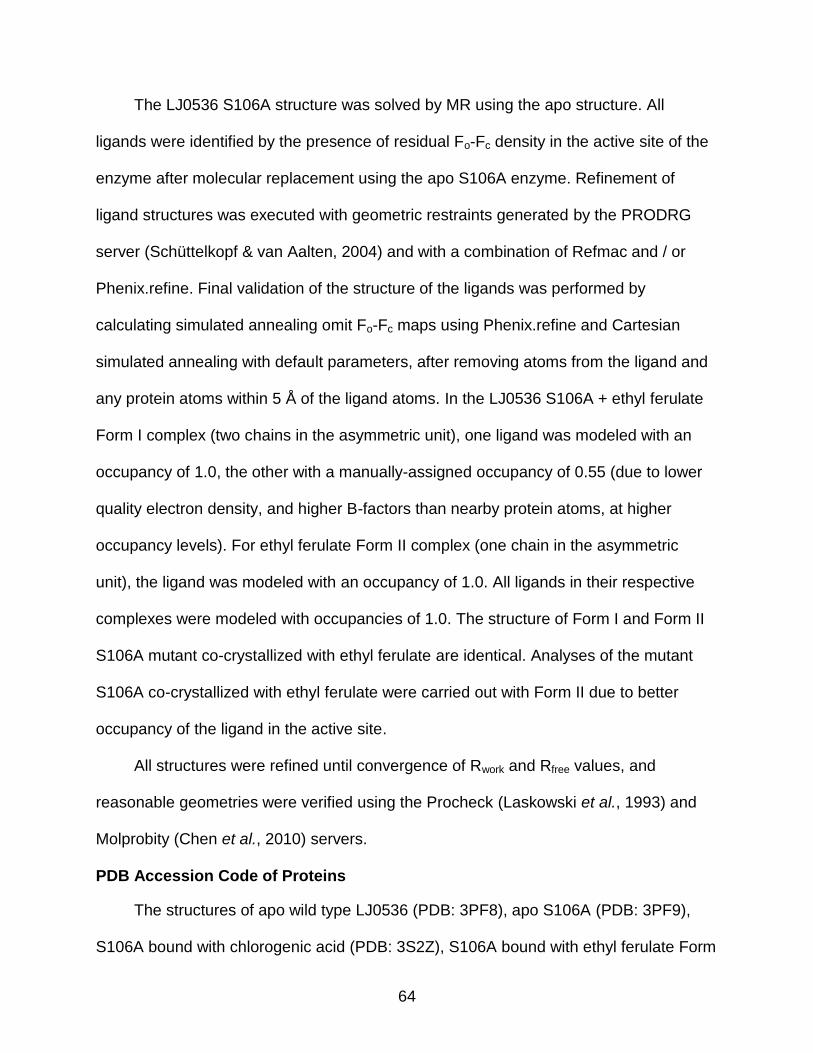
64
The LJ0536 S106A structure was solved by MR using the apo structure. All
ligands were identified by the presence of residual Fo-Fc density in the active site of the
enzyme after molecular replacement using the apo S106A enzyme. Refinement of
ligand structures was executed with geometric restraints generated by the PRODRG
server (Schüttelkopf & van Aalten, 2004) and with a combination of Refmac and / or
Phenix.refine. Final validation of the structure of the ligands was performed by
calculating simulated annealing omit Fo-Fc maps using Phenix.refine and Cartesian
simulated annealing with default parameters, after removing atoms from the ligand and
any protein atoms within 5 Å of the ligand atoms. In the LJ0536 S106A + ethyl ferulate
Form I complex (two chains in the asymmetric unit), one ligand was modeled with an
occupancy of 1.0, the other with a manually-assigned occupancy of 0.55 (due to lower
quality electron density, and higher B-factors than nearby protein atoms, at higher
occupancy levels). For ethyl ferulate Form II complex (one chain in the asymmetric
unit), the ligand was modeled with an occupancy of 1.0. All ligands in their respective
complexes were modeled with occupancies of 1.0. The structure of Form I and Form II
S106A mutant co-crystallized with ethyl ferulate are identical. Analyses of the mutant
S106A co-crystallized with ethyl ferulate were carried out with Form II due to better
occupancy of the ligand in the active site.
All structures were refined until convergence of Rwork and Rfree values, and
reasonable geometries were verified using the Procheck (Laskowski et al., 1993) and
Molprobity (Chen et al., 2010) servers.
PDB Accession Code of Proteins
The structures of apo wild type LJ0536 (PDB: 3PF8), apo S106A (PDB: 3PF9),
S106A bound with chlorogenic acid (PDB: 3S2Z), S106A bound with ethyl ferulate Form

65
I (PDB: 3PFB), S106A bound with ethyl ferulate Form II (PDB: 3QMI), and S106A
bound with ferulic acid (PDB: 3PFC) have been submitted to the PDB (Berman et al.,
2000). All other PDB files used in this study were achieved from PDB (Berman et al.,
2000).
Structural Analysis
All structural images were generated using PyMOL (DeLano, 2002). Structure
similarity searches were performed using the Dali database (Holm & Rosenström,
2010). Protein-protein interaction interfaces were identified and analyzed with the PDBe
PISA server (Krissinel & Henrick, 2007) with default settings; a residue is considered in
an interface if its change in accessible surface area between chain A and chain A
complex with chain B is non-zero.
Sequence Analysis and Construction of Phylogenetic Trees
All DNA and amino acid sequences were retrieved from NCBI Database (Benson
et al., 2011). LJ0536 protein homologs were identified by BLASTP search (Altschul et
al., 1997). Multiple sequence alignments were performed using CLUSTAL X2 (Larkin et
al., 2007). Phylogenetic analyses were conducted using neighbor-joining method and
visualized with TreeView (Page, 1996). Accession numbers, locus tag, and gene
identification numbers for the following figures are listed below.
Accession numbers for Figure 3-2 (phylogenetic tree of lactobacilli 16S rDNA
sequences and the isolated strain N6.2 from BB-DR rats stool sample) are as follows: L.
sakei 23K (LSA): NC_007576, locus tag LSAr01; N6.2: isolated FAE producing strain; L.
johnsonii NCC 533 (LJO): AE017198, locus tag LJR007; L. delbrueckii subsp.
bulgaricus ATCC BAA-365 (LDE): CP000412, locus tag LBUL_r0045; L. acidophilus
NCFM (LBA): NC_006814, locus tag LBA2001; L. helveticus DPC 4571 (LHE):
66
CP000517, locus tag lhv_3101; L. reuteri JCM1112 (LRE): NC_010609, loctus tag
LAR_16SrRNA01; L. fermentum IFO 3956 (LFE): NC_010610, locus tag
LAF_16SrRNA01; L. salivarius UCC118 (LSL): NC_007929, locus tag LSL_RNA001. L.
brevis ATCC 367 (LBR): CP000416, locus tag LVIS_r0082; L. plantarum WCFS1 (LPL):
NC_004567, locus tag lp_rRNA01.
Gene identification numbers (GI#) for Figure 3-9 (multiple sequence alignment of
LJ0536 and LJ1228 with their homologs and paralogs) are as follows: LJ0536: L.
johnsonii N6.2, cinnamoyl esterase, GI# 289594369; LJ1228: L. johnsonii N6.2,
cinnamoyl esterase, GI# 289594371; LREU1684: L. reuteri DSM 20016, alpha / beta
fold family hydrolase-like protein, GI# 148544890; LAF1318: L. fermentum IFO 3956,
hypothetical protein, GI# 184155794; LP2953: L. plantarum WCSF1, putative esterase,
GI# 28379396; LGAS1762: L. gasseri ATCC 33323, alpha / beta fold family hydrolase,
GI# 116630316; LHV1882: L. helveticus DPC 4571, alpha / beta fold family hydrolase,
GI# 161508065; PBR1030: Prevotella bryantii B14, hydrolase of alpha-beta family, GI#
299776930; HMPREF9071: Capnocytophaga sp. oral taxon 338 str. F0234, hydrolase
of alpha-beta family protein, GI# 325692879; BIF00780: Bifidobacterium animalis
subsp. lactis BB-12, cinnamoyl ester hydrolase, GI# 289178448; BACSA1693:
Bacteroides salanitronis DSM 18170, protein of unknown function DUF676 hydrolase
domain protein, GI# 324318365; MED21706696: Leeuwenhoekiella blandensis
MED217, hydrolase of alpha-beta family protein, GI# 85830613; HMPREF1977:
Capnocytophaga ochracea F0287, hydrolase of alpha-beta family protein, GI#
314946466; GEOTH1777: Geobacillus thermoglucosidasius C56-YS93, alpha / beta
hydrolase fold protein, GI# 335362064; SMBG3706: Clostridium acetobutylicum DSM

67
1731, alpha / beta fold family hydrolase, GI# 336291846; CUW2274: Turicibacter
sanguinis PC909, conserved hypothetical protein, GI# 292644698; TMATH1585:
Thermoanaerobacter mathranii subsp. mathranii str. A3, BAAT / Acyl-CoA thioester
hydrolase, GI# 296842777; EUBIFOR00351: Eubacterium biforme DSM 3989,
hypothetical protein EUBIFOR_00351, GI# 218217536.
Gene identification numbers (GI#) for Figure 3-10 (phylogenetic tree of LJ0536
with its homologs and other cinnamoyl esterases), Table 5-6 (Structural prediction of
LJ0536, LJ1228, and homologs / paralogs using SWISS-MODEL, automatic modeling)
and Table 5-7 (Structural prediction of LBA-1 and BFI-2 using SWISS-MODEL, manual
modeling) are as follows: L. johnsonii N6.2 cinnamoyl esterase LJ0536 (LJO-1), GI#
289594369. L. johnsonii N6.2 cinnamoyl esterase LJ1228 (LJO-2), GI# 289594371. L.
gasseri ATCC 33323 alpha/beta fold family hydrolase LGAS1762 (LGA), GI#
116630316. L. acidophilus NCFM alpha/beta superfamily hydrolase LBA1350 (LBA-1),
GI# 58337623. L. acidophilus NCFM, alpha/beta superfamily hydrolase LBA1842 (LBA-
2), GI# 58338090. L. helveticus DPC 4571 alpha / beta fold family hydrolase LHV1882
(LHV), GI#161508065. L. plantarum WCSF1 putative esterase LP2953 (LPL), GI#
28379396. L. fermentum IFO 3956 hypothetical protein LAF1318 (LAF), GI#
184155794. L. reuteri DSM 20016 alpha/beta fold family hydrolase-like protein
LREU1684 (LRE), GI# 148544890. Butyrivibrio fibrisolvens E14 cinnamoyl ester
hydrolase CinI (BFI-1), GI# 1622732. B. fibrisolvens E14 cinnamoyl ester hydrolase
CinII (BFI-2), GI# 1765979. Treponema denticola ATCC 35405 cinnamoyl ester
hydrolase TDE0358 (TDE), GI# 41815924. Eubacterium ventriosum ATCC 27560
hypothetical protein EUBVEN_01801 (EVE), GI# 154484090.
68
Gene identification numbers (GI#) for Table 5-2 (Structural prediction of fungal
FAEs using SWISS-MODEL, automatic modeling) and Table 5-3 (Structural prediction
of fungal FAEs using SWISS-MODEL, manual modeling) are as follow: Neurospora
crassa feruloyl esterase (NCR), GI# 9955721. Penicillium funiculosum feruloyl esterase
(PFU), GI# 25090320. Piromyces equi feruloyl esterase (PEQ), GI# 23821548.
Gene identification numbers for Table 5-4 (Structural prediction of putative FAEs in
subfamily 1B using SWISS-MODEL, automatic modeling) and Table 5-5 (Structural
prediction of putative FAEs in subfamily 1B using SWISS-MODEL, manual modeling)
are as follows: Leptospira biflexa serovar Patoc strain putative feruloyl esterase (LBI),
GI# 183222795. Paenibacillus sp. W-61 putative feruloyl esterase (PAE), GI#
133251525. Clostridium cellulovorans 743B putative esterase (CCE), GI# 242261429.
Geobacillus sp. Y412MC10 putative esterase (GEO), GI# 192811693. Spirosoma
linguale DSM 74 hypothetical protein SlinDRAFT_02770 (SLI), GI# 229867621.
Algoriphagus sp. PR1 Possible xylan degradation enzyme (ALG), GI# 126648512.
Gene identification numbers (GI#) for Table 5-8 (Structural prediction of bacterial
FAEs using SWISS-MODEL, automatic modeling) and Table 5-9 (Structural prediction
of bacterial FAEs using SWISS-MODEL manual modeling) are as follow: Treponema
denticola F0402 cinnamoyl ester hydrolase (TDE-2), GI# 325475449. Streptococcus
sanguinis VMC66 cinnamoyl ester hydrolase (SSA), GI# 322123198. Ruminococcus
albus 8 feruloyl esterase family protein (RAL), GI# 324108892. Cellulosilyticum
ruminicola feruloyl esterase III (CRU), GI# 326781741. Prevotella oris F0302 feruloyl
esterase (POR), GI# 281401992.
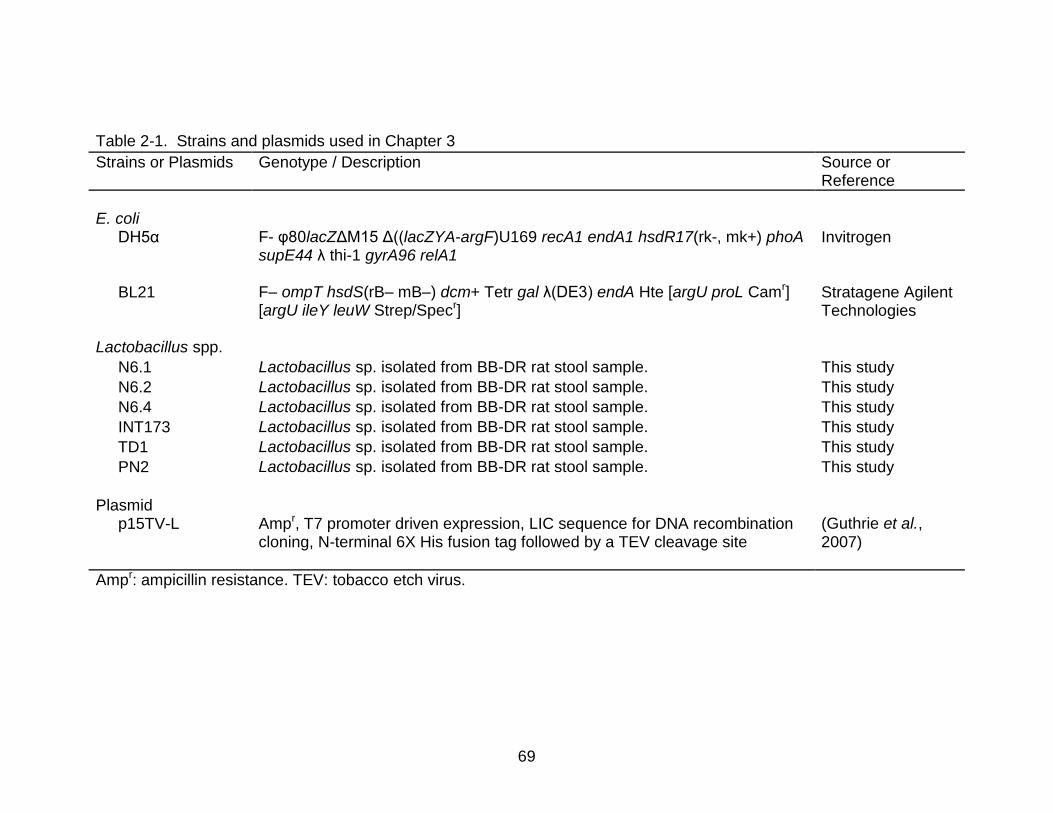
69
Table 2-1. Strains and plasmids used in Chapter 3
Strains or Plasmids Genotype / Description Source or Reference
E. coli
DH5α F- φ80lacZΔM15 Δ((lacZYA-argF)U169 recA1 endA1 hsdR17(rk-, mk+) phoA supE44 λ thi-1 gyrA96 relA1
Invitrogen
BL21 F– ompT hsdS(rB– mB–) dcm+ Tetr gal λ(DE3) endA Hte [argU proL Camr] [argU ileY leuW Strep/Specr]
Stratagene Agilent Technologies
Lactobacillus spp.
N6.1 Lactobacillus sp. isolated from BB-DR rat stool sample. This study
N6.2 Lactobacillus sp. isolated from BB-DR rat stool sample. This study
N6.4 Lactobacillus sp. isolated from BB-DR rat stool sample. This study
INT173 Lactobacillus sp. isolated from BB-DR rat stool sample. This study
TD1 Lactobacillus sp. isolated from BB-DR rat stool sample. This study
PN2 Lactobacillus sp. isolated from BB-DR rat stool sample. This study
Plasmid
p15TV-L Ampr, T7 promoter driven expression, LIC sequence for DNA recombination cloning, N-terminal 6X His fusion tag followed by a TEV cleavage site
(Guthrie et al., 2007)
Ampr: ampicillin resistance. TEV: tobacco etch virus.

70
Table 2-2. Primers used in Chapter 3
Primer Names
Primer Sequences Description
LJ_0044 Forward
5'-TTGTATTTCCAGGGCATGAAATTACTTCTTACCGGCG-3' Generate coding region of LJ0044 using template genomic DNA of isolated Lactobacillus strain LJ_0044
Reverse 5'-CAAGCTTCGTCATCATCAATTAGAAATTTGATTTAATTTTTGAACAATT-3'
LJ_0114 Forward
5'-TTGTATTTCCAGGGCATGAAAATAGATAATTTAACGTTAACAAATTTT-3'
Generate coding region of LJ0114 using template genomic DNA of isolated Lactobacillus strain LJ_0114
Reverse 5'-CAAGCTTCGTCATCACTAAACGTAAATTCTTCTATCTTTCAA-3'
LJ_0536 Forward
5'-TTGTATTTCCAGGGCATGGCAACAATTACACTTGAGC-3' Generate coding region of LJ0536 using template genomic DNA of isolated Lactobacillus strain LJ_0536
Reverse 5'-CAAGCTTCGTCATCATTAAAACGCATTATTATTCTGTAAAAAATC-3'
LJ_0618 Forward
5'-TTGTATTTCCAGGGCATGAAAAAAATTATTCTTTTTGGTGATTC-3' Generate coding region of LJ0618 using template genomic DNA of isolated Lactobacillus strain LJ_0618
Reverse 5'-CAAGCTTCGTCATCATTATGATATAGCAGCTGTTTCTTTC-3'
LJ_1228 Forward
5'-TTGTATTTCCAGGGCATGGAGACTACAATTAAACGTGAT-3' Generate coding region of LJ1228 using template genomic DNA of isolated Lactobacillus strain LJ_1228
Reverse 5'-CAAGCTTCGTCATCATTATTTTATTAAAAACTCACCAACTAATTTTAA-3'
LREU_1549 Forward
5'-TTGTATTTCCAGGGCATGGAAATTAAAAGTGTTAACTTAGATC-3' Generate coding region of LREU1549 using template genomic DNA of isolated Lactobacillus strain LREU_1549
Reverse 5'-CAAGCTTCGTCATCACTAAATTAAATTCAGTTCAGTTAACCA-3'
LIC sequences for DNA recombination are in bold.

71
Table 2-2. Continued
Primer Names
Primer Sequences Description
LREU_1667 Forward
5'-TTGTATTTCCAGGGCATGGTACCGGGGCATAAG-3' Generate coding region of LREU1667 using template genomic DNA of isolated Lactobacillus strain LREU_1667
Reverse 5'-CAAGCTTCGTCATCACTATTTAATATAGTGATCTAAAAATCTTG-3'
LREU_1684 Forward
5'-TTGTATTTCCAGGGCATGGAAATAACAATCAAACGAGATG-3' Generate coding region of LREU1684 using template genomic DNA of isolated Lactobacillus strain LREU_1684
Reverse 5'-CAAGCTTCGTCATCACTAATTTTTTAAAAAGTTAGCTACCAG-3'
T7 Forward 5'-TTAATACGACTCACTATAGGG-3' Confirm gene insertion in p15TV-L plasmid and sequencing
T7 Reverse 5'-GCTAGTTATTGCTCAGCGG-3'
Lacto-F 5'-TGGAAACAGRTGCTAATACCG-3' Universal primers of lactobacilli for strain identification which amplify 233 bp 16s rDNA fragment for sequencing
Lacto-R 5'-GTCCATTGTGGAAGATTCCC-3'
D88-F 5'-GAGAGTTTGATYMTGGCTCAG-3' Universal primers of lactobacilli for strain identification which amplify 1.5kb 16s rDNA fragment for sequencing
D94-R 5'-GAAGGAGGTGWTCCARCCGCA-3'
LIC sequences for DNA recombination are in bold.
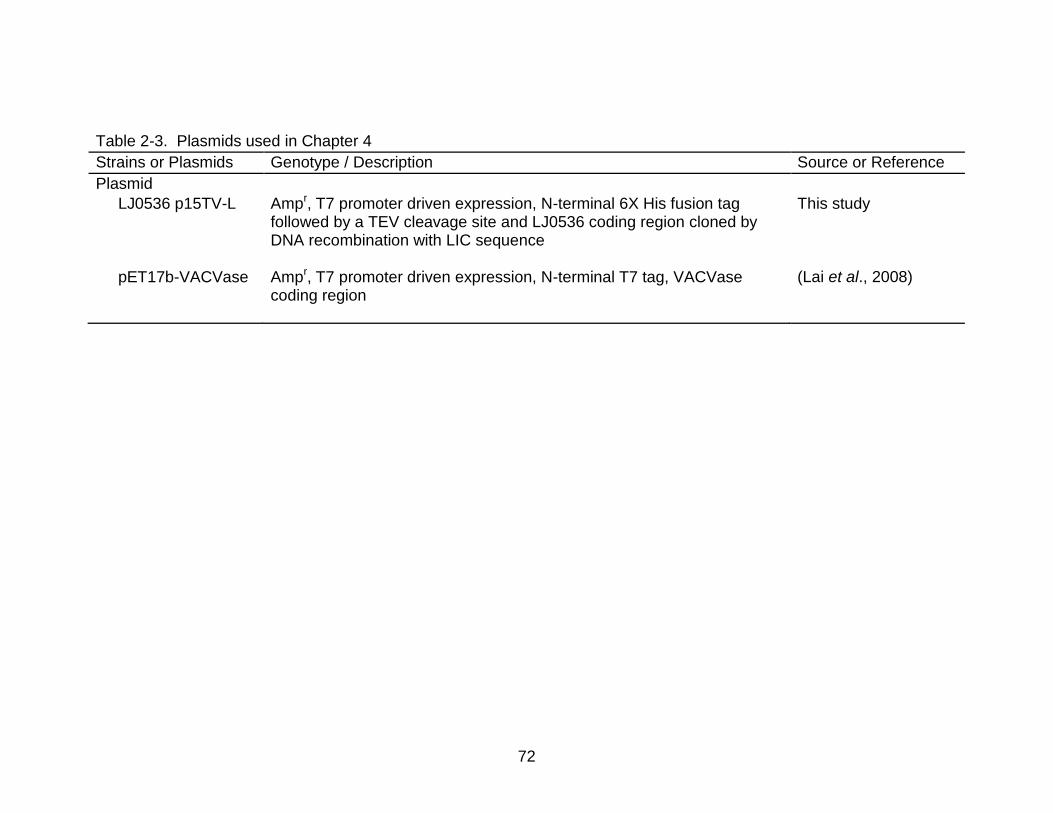
72
Table 2-3. Plasmids used in Chapter 4
Strains or Plasmids Genotype / Description Source or Reference
Plasmid
LJ0536 p15TV-L Ampr, T7 promoter driven expression, N-terminal 6X His fusion tag followed by a TEV cleavage site and LJ0536 coding region cloned by DNA recombination with LIC sequence
This study
pET17b-VACVase Ampr, T7 promoter driven expression, N-terminal T7 tag, VACVase coding region
(Lai et al., 2008)

73
Table 2-4. Primers used in Chapter 4
Primer Names Primer Sequences Description
LJ0536_H32A Forward
5'-GACATGGCAATCATTTTTGCTGGTTTTACCGCTAACCGT-3' Generate coding region of LJ0536 with histidine residue at position 32 mutated to alanine residue using LJ0536 p15TV-L plasmid as template
LJ0536_H32A Reverse
5'-ACGGTTAGCGGTAAAACCAGCAAAAATGATTGCCATGTC-3'
LJ0536_D61A Forward
5'-ATTGCTAGTGTTCGCTTTGCTTTTAATGGCCATGGTGAT-3' Generate coding region of LJ0536 with aspartic acid residue at position 61 mutated to alanine residue using LJ0536 p15TV-L plasmid as template
LJ0536_D61A Reverse
5'-ATCACCATGGCCATTAAAAGCAAAGCGAACACTAGCAAT-3'
LJ0536_S68A Forward
5'-TTTAATGGCCATGGTGATGCAGATGGTAAATTTGAAAAT-3' Generate coding region of LJ0536 with serine residue at position 68 mutated to alanine residue using LJ0536 p15TV-L plasmid as template
LJ0536_S68A Reverse
5'-ATTTTCAAATTTACCATCTGCATCACCATGGCCATTAAA-3'
LJ0536_D83A Forward
5'-GTTTTAAATGAAATTGAAGCTGCAAATGCCATTTTAAAT-3' Generate coding region of LJ0536 with aspartic acid residue at position 83 mutated to alanine residue using LJ0536 p15TV-L plasmid as template
LJ0536_D83A Reverse
5'-ATTTAAAATGGCATTTGCAGCTTCAATTTCATTTAAAAC-3'
LJ0536_S106A Forward
5'-ATTTATCTAGTCGGCCATGCTCAAGGTGGTGTCGTTGCT-3' Generate coding region of LJ0536 with serine residue at position 106 mutated to alanine residue using LJ0536 p15TV-L plasmid as template
LJ0536_S106A Reverse
5'-AGCAACGACACCACCTTGAGCATGGCCGACTAGATAAAT-3'
Mutation sites are in bold with italic.
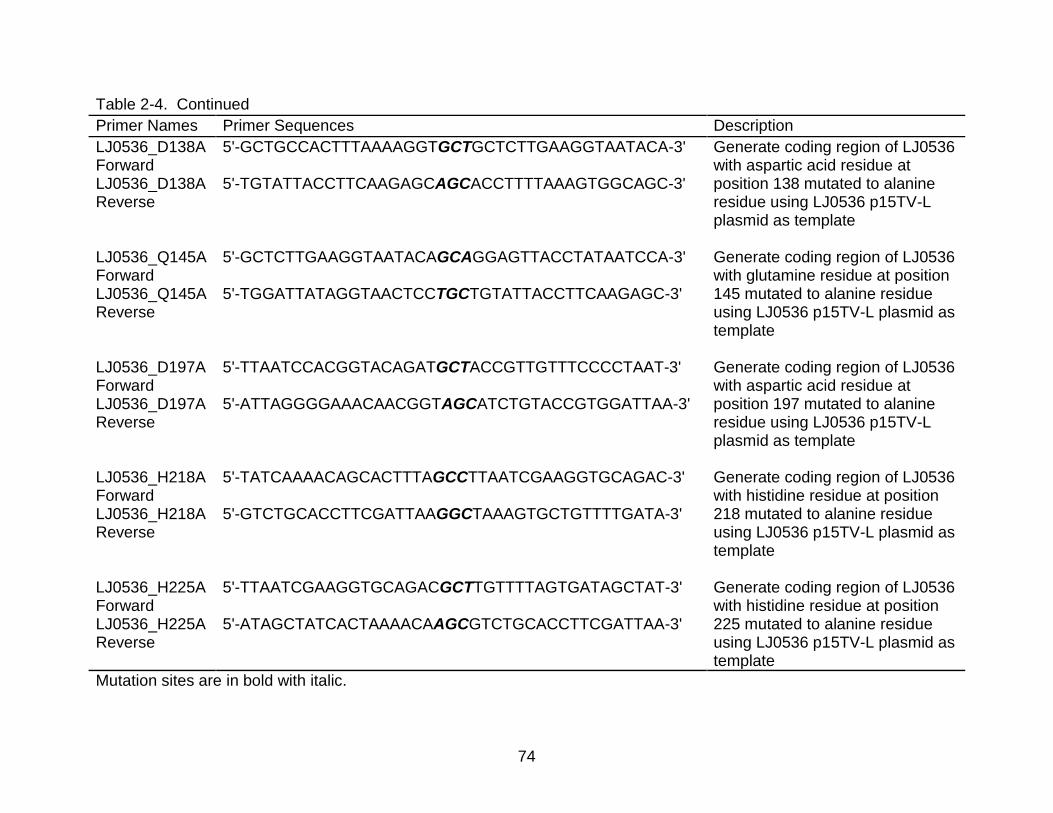
74
Table 2-4. Continued
Primer Names Primer Sequences Description
LJ0536_D138A Forward
5'-GCTGCCACTTTAAAAGGTGCTGCTCTTGAAGGTAATACA-3' Generate coding region of LJ0536 with aspartic acid residue at position 138 mutated to alanine residue using LJ0536 p15TV-L plasmid as template
LJ0536_D138A Reverse
5'-TGTATTACCTTCAAGAGCAGCACCTTTTAAAGTGGCAGC-3'
LJ0536_Q145A Forward
5'-GCTCTTGAAGGTAATACAGCAGGAGTTACCTATAATCCA-3' Generate coding region of LJ0536 with glutamine residue at position 145 mutated to alanine residue using LJ0536 p15TV-L plasmid as template
LJ0536_Q145A Reverse
5'-TGGATTATAGGTAACTCCTGCTGTATTACCTTCAAGAGC-3'
LJ0536_D197A Forward
5'-TTAATCCACGGTACAGATGCTACCGTTGTTTCCCCTAAT-3' Generate coding region of LJ0536 with aspartic acid residue at position 197 mutated to alanine residue using LJ0536 p15TV-L plasmid as template
LJ0536_D197A Reverse
5'-ATTAGGGGAAACAACGGTAGCATCTGTACCGTGGATTAA-3'
LJ0536_H218A Forward
5'-TATCAAAACAGCACTTTAGCCTTAATCGAAGGTGCAGAC-3' Generate coding region of LJ0536 with histidine residue at position 218 mutated to alanine residue using LJ0536 p15TV-L plasmid as template
LJ0536_H218A Reverse
5'-GTCTGCACCTTCGATTAAGGCTAAAGTGCTGTTTTGATA-3'
LJ0536_H225A Forward
5'-TTAATCGAAGGTGCAGACGCTTGTTTTAGTGATAGCTAT-3' Generate coding region of LJ0536 with histidine residue at position 225 mutated to alanine residue using LJ0536 p15TV-L plasmid as template
LJ0536_H225A Reverse
5'-ATAGCTATCACTAAAACAAGCGTCTGCACCTTCGATTAA-3'
Mutation sites are in bold with italic.

75
Table 2-4. Continued
Primer Names
Primer Sequences Description
LJ0536Δ147-173aa_SmaI Forward
5'-TCCCCCGGGAACAATTGCCTATTTATGAA-3' Generate coding region of LJ0536 with deletion of amino acid residue from position 147 to position 173 using LJ0536 p15TV-L plasmid as template
LJ0536Δ147-173aa_SmaI Reverse
5'-TCCCCCGGGTCCTTGTGATTACCTTCAA-3'
VACVase Forward
5'-TTGTATTTCCAGGGCATGTCGGTAACCTCTGCCAAAG-3' Generate coding region of VACVase using pET17b-VACVase plasmid as template VACVase
Reverse 5'-CAAGCTTCGTCATCATTATTGTAGGAAGTCTTCTGCTAACTTG-3'
Restriction sites are in italic.
LIC sequences for DNA recombination are in bold.

76
Table 2-5. Strains used in Chapter 5
Strains or Plasmids Genotype / Description Source or Reference
Lactobacillus spp.
L. gasseri Wild type L. gasseri ATCC 33323 (Lorca et al., 2007b)
L. acidophilus Wild type L. acidophilus ATCC 4356 (Lorca et al., 2007b)

77
Table 2-6. Primers used in Chapter 5
Primer Names
Primer Sequences Description
LGAS_1762 Forward
5'-TTGTATTTCCAGGGCATGAAGTTAAAGAAAAAGAAAGTAGG-3' Generate coding region of LGAS1762 using template genomic DNA of isolated L. gasseri
LGAS_1762 Reverse
5'-CAAGCTTCGTCATCATTAAAAAGTATTATTATCTTGTAAAAATTCTG-3'
LBA_1350 Forward
5'-TTGTATTTCCAGGGCATGTTGAAAAAAAGATTTTTATATATTTTTTTGG-3' Generate coding region of LBA1350 using template genomic DNA of isolated L. acidophilus
LBA_1350 Reverse
5'-CAAGCTTCGTCATCATCAATTATTTAAAAAATCATCGATTAATCCT-3'
LIC sequences for DNA recombination are in bold.

78
Figure 2-1. Expression vector, p15TV-L map. Image was captured from http://www.sgc.utoronto.ca/SGC-WebPages/Vector_PDF/p15TV-L.pdf and modified.

79
CHAPTER 3 IDENTIFICATION OF FAES FROM GUT MICROBIOTA
Background
The commensal microbiota residing in the different niches of the higher organism
bodys are critical for maintaining good health. However, the mechanisms by which
microorganisms interact with the host are still unclear and difficult to study. Important
technological advances such as rapid sequencing methods, bioinformatics, and
identification using 16S rDNA made possible to describe the variability and composition
of the small “ecosystems”. One of the most interesting applications of commensal
microbiota is the identification of species potentially responsible for specific host
diseases. One clear example is the noticeable changes in the composition of the gut
microbial ecosystem of diabetes patients compared to healthy individuals (Vaarala et
al., 2008). A recent study (Roesch et al., 2009) showed that Bio Breeding Diabetes
Prone (BB-DP) rats have differences in gut microbiota composition when compared to
the isogenic Bio Breeding Diabetes Resistant (BB-DR) animals. The results obtained
indicated that BB-DR rats have a predominant presence of probiotic bacteria such as L.
johnsonii, L. reuteri, and Bifidobacterium species when compared with the microbial
ecosystem in BB-DP rats.
The microbial ecosystem described before is not unique. In the past decade, a
study carried out in Japan found that oral administration of probiotic bacterium L. casei
prevents the onset of diabetes in NOD mice by altering the immune response and
inhibiting the disappearance of insulin-secreting β cells in Langerhans islets (Matsuzaki
et al., 1997b). Other studies showed that oral administration of several Lactobacillus
spp. can help reduce blood glucose levels by stimulating insulin secretion (Yamano et

80
al., 2006) via changes in the autonomic neurotransmission (Tanida et al., 2005).
However, the direct mechanisms behind how probiotic bacteria benefit the host are still
unclear.
A feeding study which involves feeding BB-DP rat with L. johnsonii has shown that
oral administration of the probiotic bacterium L. johnsonii mitigates the incidence of type
1 diabetes by decreasing the intestinal oxidative stress response (Valladares et al.,
2010). The decreased oxidative stress at the intestinal level could be a consequence of
multiple factors. The interaction of probiotics with the animal foods is probably one of
the first aspects to be analyzed in order to generate a rationale understanding of the
problem.
The rat chow is formulated with many ingredients containing 6% to 8% (w / w) of
fiber in the form of sugar beet pulp. The sugar beet pulp is an important source of ferulic
acid, a phytophenol with anti-oxidative and anti-inflammatory effects (Couteau &
Mathaly, 1998). It has been demonstrated that low dosage of cinnamic acids (especially
ferulic acid) has been related with the stimulation of insulin secretion (Balasubashini et
al., 2003; Adisakwattana et al., 2008), prevention of oxidative stress, lipid peroxidation
(Balasubashini et al., 2004; Srinivasan et al., 2007), and inhibition of diabetic
nephropathy progression (Fujita et al., 2008). The phytophenols and its derivatives are
tightly attached to plant cell wall materials by ester bonds which limits intestinal
assimilation and functioning of phytophenols. Specific enzymes with good FAE activity
are required to hydrolyze and release phenolic acids from the macromolecular
structures.
81
I hypothesized that the probiotic bacteria Lactobacillus johnsonii could produce the
necessary enzymes to release the antioxidative phenolics. The lactic acid bacteria
(lactobacilli) are well known probiotic bacteria used as food supplements and are
present in human intestine. It has been found that several lactobacilli, such as L.
fermentum, L. reuteri, L. leichmanni, and L. farciminis, possess FAE activity but the
genes encoding these enzymes were not identified (Donaghy et al., 1998).
In this chapter, I described the strain isolation and identification of several colonies
of Lactobacillus with the ability to hydrolyze ethyl ferulate (EF) in MRS-agar plates. The
best FAE producer, identified with the name of Lactobacillus johnsonii strain N6.2, was
isolated from BB-DR rats’ stool samples (Lai et al., 2009). Using a genomic approach, I
was able to identify and purify several enzymes with esterase activity. The best
enzymes with FAE activity were selected. This chapter summarizes the biochemical
characteristic of two FAEs purified to homogeneity from the probiotic strain L. johnsonii
N6.2.
Result and Discussion
FAEs Producing Strain Isolation and Identification
Colonies of Lactobacillus were previously isolated by Dr. Graciela Lorca,
University of Florida, directly from the stool samples obtained from the same BB-DR
and BB-DP rats analyzed by Roesch (Roesch et al., 2009). The isolated colonies were
individually transferred to MRS-EF agar plates, with no glucose. The glucose was
omitted to prevent a potential catalytic repression of the hydrolytic enzymes. The
screening plates were used to evaluate the ability of the isolated strains to produce FAE
activity. The strains that displayed evident FAE in MRS-EF agar generated a clear halo
around the colonies (Figure 3-1A). The colonies that displayed the best FAE activity

82
produced clear halo zones of 0.8 - 0.9 cm in diameter. More than 300 colonies were
analyzed using this method. Interestingly, 80 ± 5% (mean ± standard deviation) of the
Lactobacillus colonies isolated from BB-DR rats demonstrated excellent FAE activity.
Only 41 ± 7% of the Lactobacillus colonies isolated from BB-DP rats were able to
hydrolyze the embedded ethyl ferulate. Six colonies isolated from the BB-DR samples
showed the largest clear zones “halos” on MRS-EF screening plates. The colonies
N6.1, N6.2, N6.4, TDI, INT173, and PN2 were selected and preserved in glycerol at -
80°C to be further identified.
The 16S rDNA sequence amplified from the selected isolated colonies belongs to
three different Lactobacillus spp. The strain, with a colony identification number PN2,
showed 96% sequence identity with L. helveticus. The strain TDI and INT173 showed
99% sequence identity with L. reuteri. Strains N6.1, N6.2, and N6.4 showed 99% to
100% sequence identity with L. johnsonii (Figure 3-2). Among all of the isolated
Lactobacillus strains, L. johnsonii N6.2 and L. reuteri TDI displayed the highest FAE
activities (largest clear halo zones) and were selected as DNA donors to clone potential
FAE encoding genes.
In Silico Selection of Targets for Cloning
The precise identification of L. johnsonii and L. reuteri in the stool samples
allowed the use of comparative genomics to select FAE targets in silico. Five open
reading frames (ORFs) encoding proteins that displayed the characteristic motif
previously described for esterases were selected (Brenner, 1988; Cygler et al., 1993).
The target genes from L. johnsonii were selected from a group of 346 ORFs encoding
hypothetical (306 ORFs) or putative (40 ORFs) proteins as they are annotated in the
genome used as a reference, strain L. johnsonii NCC 533 (http://cmr.jcvi.org/tigr-
83
scripts/CMR/CmrHomePage.cgi). Based on the genome sequence of L. johnsonii NCC
533, primers were designed, and L. johnsonii N6.2 chromosomal DNA was used as a
template for gene cloning. To identify potential FAEs in L. reuteri, the genomic
sequence of the strain L. reuteri DSM 20016 was used to design the primers. Three L.
reuteri genes were selected for cloning.
Purification and Quick Evaluation of Purified Enzymes
All eight potential FAE encoding genes (LJ0044, LJ0114, LJ0536, LJ0618,
LJ1228, LREU1549, LREU1667, LREU1684) were cloned successfully into the
expression vector p15TV-L and expressed in E coli BL21 as recombinant proteins.
Seven out of eight potential FAEs (LJ0114, LJ0536, LJ0618, LJ1228, LREU1549,
LREU1667, LREU1684) were purified using nickel affinity chromatography. The purity of
the His6-tagged proteins was analyzed by SDS-PAGE and stained with Coomassie
Blue. The results are shown in Figure 3-3.
A rapid method to evaluate the FAE activity was used immediately after
purification. An aliquot of the purified proteins (3-5 µl equivalent to 0.1 µg total protein)
were dropped on the surface of the MRS-EF screening plate. Three out of seven
proteins (LJ0536, LJ1228, LREU1684) displayed FAE activity, as it was demonstrated
by the formation of halos in the MRS-EF screening plates (Figure 3-1B). It was
evidenced that LREU1684 displayed less enzyme activity than the enzymes identified
from L. johnsonii. The halos in Figure 3-1B look similar; however, 0.4 μg of LREU1684
protein were required to generate a clear zone of similar size to that produced by 0.1 μg
protein of LJ0536 or LJ1228. Thus, only LJ0536 and LJ1228 were selected to be further
analyzed.
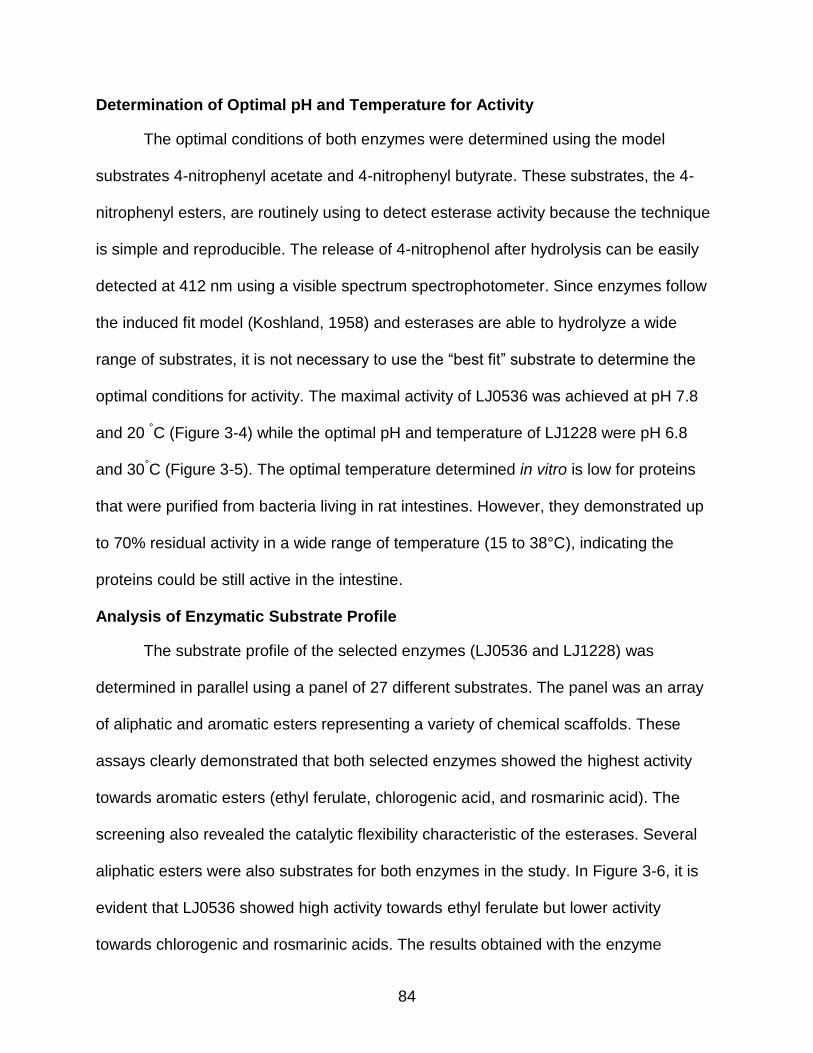
84
Determination of Optimal pH and Temperature for Activity
The optimal conditions of both enzymes were determined using the model
substrates 4-nitrophenyl acetate and 4-nitrophenyl butyrate. These substrates, the 4-
nitrophenyl esters, are routinely using to detect esterase activity because the technique
is simple and reproducible. The release of 4-nitrophenol after hydrolysis can be easily
detected at 412 nm using a visible spectrum spectrophotometer. Since enzymes follow
the induced fit model (Koshland, 1958) and esterases are able to hydrolyze a wide
range of substrates, it is not necessary to use the “best fit” substrate to determine the
optimal conditions for activity. The maximal activity of LJ0536 was achieved at pH 7.8
and 20 °C (Figure 3-4) while the optimal pH and temperature of LJ1228 were pH 6.8
and 30°C (Figure 3-5). The optimal temperature determined in vitro is low for proteins
that were purified from bacteria living in rat intestines. However, they demonstrated up
to 70% residual activity in a wide range of temperature (15 to 38°C), indicating the
proteins could be still active in the intestine.
Analysis of Enzymatic Substrate Profile
The substrate profile of the selected enzymes (LJ0536 and LJ1228) was
determined in parallel using a panel of 27 different substrates. The panel was an array
of aliphatic and aromatic esters representing a variety of chemical scaffolds. These
assays clearly demonstrated that both selected enzymes showed the highest activity
towards aromatic esters (ethyl ferulate, chlorogenic acid, and rosmarinic acid). The
screening also revealed the catalytic flexibility characteristic of the esterases. Several
aliphatic esters were also substrates for both enzymes in the study. In Figure 3-6, it is
evident that LJ0536 showed high activity towards ethyl ferulate but lower activity
towards chlorogenic and rosmarinic acids. The results obtained with the enzyme
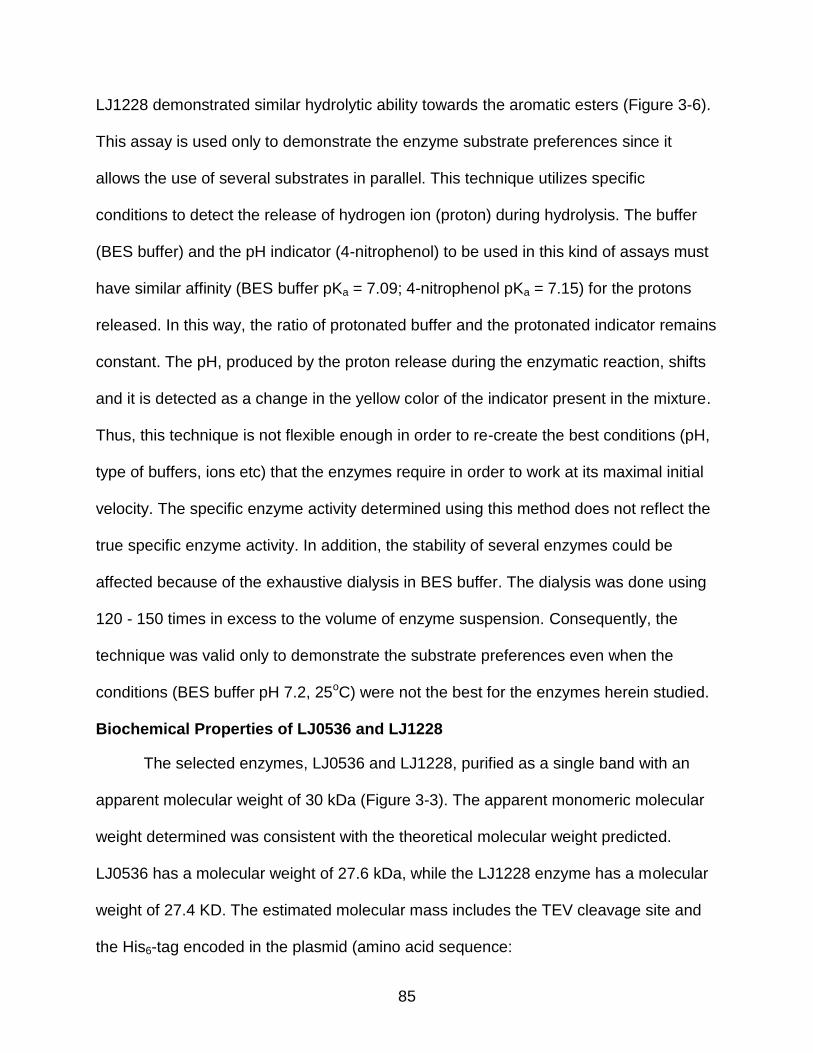
85
LJ1228 demonstrated similar hydrolytic ability towards the aromatic esters (Figure 3-6).
This assay is used only to demonstrate the enzyme substrate preferences since it
allows the use of several substrates in parallel. This technique utilizes specific
conditions to detect the release of hydrogen ion (proton) during hydrolysis. The buffer
(BES buffer) and the pH indicator (4-nitrophenol) to be used in this kind of assays must
have similar affinity (BES buffer pKa = 7.09; 4-nitrophenol pKa = 7.15) for the protons
released. In this way, the ratio of protonated buffer and the protonated indicator remains
constant. The pH, produced by the proton release during the enzymatic reaction, shifts
and it is detected as a change in the yellow color of the indicator present in the mixture.
Thus, this technique is not flexible enough in order to re-create the best conditions (pH,
type of buffers, ions etc) that the enzymes require in order to work at its maximal initial
velocity. The specific enzyme activity determined using this method does not reflect the
true specific enzyme activity. In addition, the stability of several enzymes could be
affected because of the exhaustive dialysis in BES buffer. The dialysis was done using
120 - 150 times in excess to the volume of enzyme suspension. Consequently, the
technique was valid only to demonstrate the substrate preferences even when the
conditions (BES buffer pH 7.2, 25oC) were not the best for the enzymes herein studied.
Biochemical Properties of LJ0536 and LJ1228
The selected enzymes, LJ0536 and LJ1228, purified as a single band with an
apparent molecular weight of 30 kDa (Figure 3-3). The apparent monomeric molecular
weight determined was consistent with the theoretical molecular weight predicted.
LJ0536 has a molecular weight of 27.6 kDa, while the LJ1228 enzyme has a molecular
weight of 27.4 KD. The estimated molecular mass includes the TEV cleavage site and
the His6-tag encoded in the plasmid (amino acid sequence:

86
MGSSHHHHHHSSGRENLYFQG, 2.4 kDa). The His6-tag was removed by TEV
treatment. The enzymes do not showed catalytic differences when tagged and un-
tagged proteins were evaluated in parallel. Consequently, the assays described in this
work were carried out with tagged protein.
When the activity of LJ0536 was evaluated in the presence of divalent cations or iron
chloride (Fe3+), only Cu2+ (1 mM) inhibited the activity by 90%. LJ1228 enzyme activity
was arrested with 1 mM of Zn2+, Fe3+, or Cu2+. The activity of LJ1228 was five times
more sensitive to Fe3+ than the FAE activity described from L.acidophilus (Wang et al.,
2004b). The addition of EDTA to the reaction mixtures did not affect the activity of these
enzymes. Both enzymes were fully inhibited by phenylmethanesulfonyl fluoride (PMSF)
and resistant to N-ethylmaleimide (NEM) and iodoacetate. These results confirm the
presence of serine as the nucleophilic residue in the active center, which is suggested
by the data from the bioinformatic analysis.
The enzymatic parameters obtained by steady state saturation kinetics using a
variety of ester substrates are summarized in Table 3-1. In the saturation assays all
enzymes followed a canonical Michaelis-Menten hyperbolic kinetic. The biochemical
parameters were estimated as described in the Material and Methods section (Chapter
2). As it was determined by the substrate screening method, the enzymes in this study
displayed activity on a wide range of ester substrates. Both enzymes showed the
highest substrate affinity towards aromatic esters when compared to aliphatic esters.
Ethyl ferulate and chlorogenic acids were the best substrate for both enzymes (LJ0536:
Km = 0.020 ± 0.01 mM; LJ1228: Km = 0.063 ± 0.03 mM). The affinity obtained with ethyl
ferulate was comparable with the affinity obtained with chlorogenic acid (LJ0536: Km
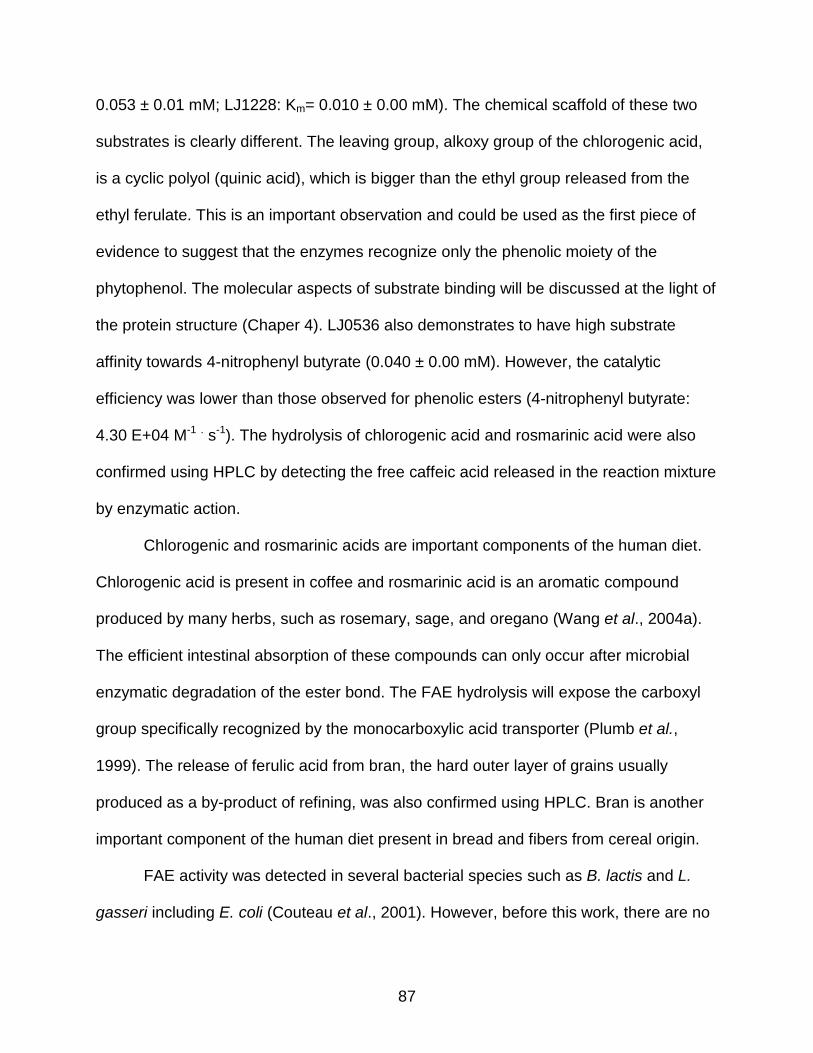
87
0.053 ± 0.01 mM; LJ1228: Km= 0.010 ± 0.00 mM). The chemical scaffold of these two
substrates is clearly different. The leaving group, alkoxy group of the chlorogenic acid,
is a cyclic polyol (quinic acid), which is bigger than the ethyl group released from the
ethyl ferulate. This is an important observation and could be used as the first piece of
evidence to suggest that the enzymes recognize only the phenolic moiety of the
phytophenol. The molecular aspects of substrate binding will be discussed at the light of
the protein structure (Chaper 4). LJ0536 also demonstrates to have high substrate
affinity towards 4-nitrophenyl butyrate (0.040 ± 0.00 mM). However, the catalytic
efficiency was lower than those observed for phenolic esters (4-nitrophenyl butyrate:
4.30 E+04 M-1 . s-1). The hydrolysis of chlorogenic acid and rosmarinic acid were also
confirmed using HPLC by detecting the free caffeic acid released in the reaction mixture
by enzymatic action.
Chlorogenic and rosmarinic acids are important components of the human diet.
Chlorogenic acid is present in coffee and rosmarinic acid is an aromatic compound
produced by many herbs, such as rosemary, sage, and oregano (Wang et al., 2004a).
The efficient intestinal absorption of these compounds can only occur after microbial
enzymatic degradation of the ester bond. The FAE hydrolysis will expose the carboxyl
group specifically recognized by the monocarboxylic acid transporter (Plumb et al.,
1999). The release of ferulic acid from bran, the hard outer layer of grains usually
produced as a by-product of refining, was also confirmed using HPLC. Bran is another
important component of the human diet present in bread and fibers from cereal origin.
FAE activity was detected in several bacterial species such as B. lactis and L.
gasseri including E. coli (Couteau et al., 2001). However, before this work, there are no

88
records of enzymes purified from bacteria residing in the intestinal tract with efficient
chlorogenic acid esterase activity.
The substrate affinity (Km) of both L. johnsonii enzymes towards chlorogenic acid
are comparable to the Km described in A. niger FAE (0.01 mM) (Asther et al., 2005).
The enzymes of fungal origin require different conditions to be catalytically efficient. For
example, the FAE purified from A. niger, one of the most studied, requires pH 6.0 and
55oC of temperature. As it was discussed in recent reviews, most FAEs have been
isolated from phytopathogenic fungi (Fazary & Ju, 2007; Topakas et al., 2007). Thus, an
important contribution of this work is related exclusively with the biochemistry of two
new bacterial enzymes that display FAE activity. Since lactobacilli are GRAS (Generally
Recognized As Safe) organisms, these two enzymes could have important industrial
applications and could be used in the modification of the texture and flavor of fermented
food.
Effect of Bile Salt Components
The catalytic ability of LJ0536 and LJ1228 in the presence of conjugated
(glycocholic acid and taurocholic acid) and unconjugated bile salts (deoxycholic acid)
were evaluated in vitro. These components were selected since they can potentially
inhibit the activity of hydrolytic enzymes (Schmidt et al., 1982). Conjugated bile acids
are more efficient at emulsifying fats because they are more ionized than unconjugated
bile acids. The enzyme activity assays in the presence of bile salts using 4-nitrophenyl
butyrate as substrate indicate that glycocholic acid is able to improve the activity of
LJ0536 (Figure 3-7A). The enzymatic activity of LJ0536 increased almost 40 + 10.2%
with respect to the control reaction when 0.1 mM of sodium glycocholate was present in
the mixture (salt of glycocholic acid). The enzyme activity increased 2.5 fold when the
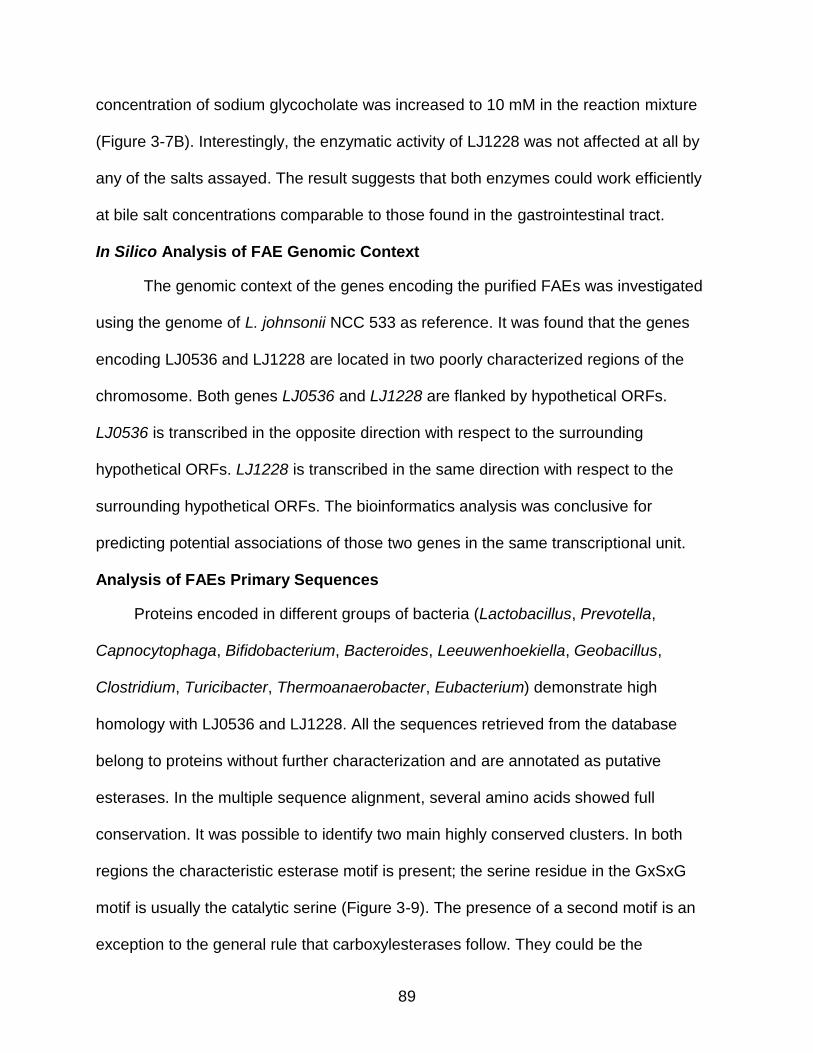
89
concentration of sodium glycocholate was increased to 10 mM in the reaction mixture
(Figure 3-7B). Interestingly, the enzymatic activity of LJ1228 was not affected at all by
any of the salts assayed. The result suggests that both enzymes could work efficiently
at bile salt concentrations comparable to those found in the gastrointestinal tract.
In Silico Analysis of FAE Genomic Context
The genomic context of the genes encoding the purified FAEs was investigated
using the genome of L. johnsonii NCC 533 as reference. It was found that the genes
encoding LJ0536 and LJ1228 are located in two poorly characterized regions of the
chromosome. Both genes LJ0536 and LJ1228 are flanked by hypothetical ORFs.
LJ0536 is transcribed in the opposite direction with respect to the surrounding
hypothetical ORFs. LJ1228 is transcribed in the same direction with respect to the
surrounding hypothetical ORFs. The bioinformatics analysis was conclusive for
predicting potential associations of those two genes in the same transcriptional unit.
Analysis of FAEs Primary Sequences
Proteins encoded in different groups of bacteria (Lactobacillus, Prevotella,
Capnocytophaga, Bifidobacterium, Bacteroides, Leeuwenhoekiella, Geobacillus,
Clostridium, Turicibacter, Thermoanaerobacter, Eubacterium) demonstrate high
homology with LJ0536 and LJ1228. All the sequences retrieved from the database
belong to proteins without further characterization and are annotated as putative
esterases. In the multiple sequence alignment, several amino acids showed full
conservation. It was possible to identify two main highly conserved clusters. In both
regions the characteristic esterase motif is present; the serine residue in the GxSxG
motif is usually the catalytic serine (Figure 3-9). The presence of a second motif is an
exception to the general rule that carboxylesterases follow. They could be the

90
consequence of protein fusions, internal duplications, or by chance. However, the
sequence analysis performed was not solid evidence proving duplication or potential
fusions with other proteins. It is also possible that some FAEs carry two active sites of
hydrolysis. Further studies using site-directed mutagenesis and x-ray crystallography
are required to confirm the existence of two esterase motifs with a catalytically
functional serine (Chapter 4). The catalytic triad (serine, histidine, and aspartic acid)
should be completed with full conserved in all sequences analyzed.
LJ0536 and LJ1228 share 42% amino acid sequence identity. The region of the
first motif, which is closer to the N-terminus, is not highly conserved when it is compared
to the region of the second motif. The second motif (GHSQGGVV) is thought to be the
catalytic motif due to the full cluster of 17 amino acids. It is highly conserved in all
homologs and paralogs. The conservation of amino acids suggests that the sequence
context is imperative for the catalytic properties of the enzyme.
A tree diagram of proteins was constructed with the closest sequences obtained
(Figure 3-10). The proteins grouped in cluster III are LJ0536 (LJO-1) homologous
proteins. They share between 71% (LHV) to 87% (LGA) amino acid sequence identity
with LJ0536 and present only in homofermentative LAB (L. gasseri, L. helveticus, and L.
acidophilus). LJ1228 (LJO-2) in cluster II has a lower amino acid sequence identity from
51% (LPL) to 74% (LRE) with its homologs encoded only in the chromosome of
heterofermentative strains. Cluster I is constructed by proteins that share only 18%
(BFI-1: CinI) to 33% (BFI-2: CinII) amino acid sequence identity of LJ0536 or 21% (BFI-
1: CinI) to 24% (BFI-2: CinII) amino acid sequence identity of LJ1228. The CinI and
CinII proteins were included because CinI and CinII from B. fibrisolvens are annotated
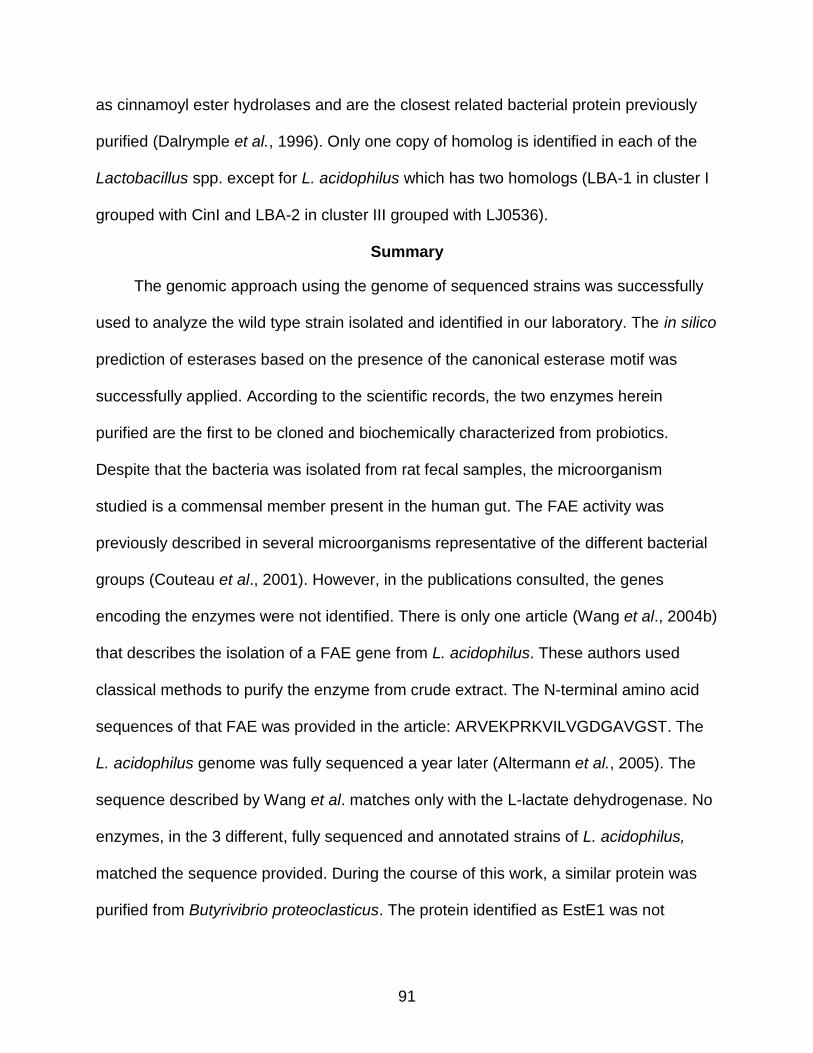
91
as cinnamoyl ester hydrolases and are the closest related bacterial protein previously
purified (Dalrymple et al., 1996). Only one copy of homolog is identified in each of the
Lactobacillus spp. except for L. acidophilus which has two homologs (LBA-1 in cluster I
grouped with CinI and LBA-2 in cluster III grouped with LJ0536).
Summary
The genomic approach using the genome of sequenced strains was successfully
used to analyze the wild type strain isolated and identified in our laboratory. The in silico
prediction of esterases based on the presence of the canonical esterase motif was
successfully applied. According to the scientific records, the two enzymes herein
purified are the first to be cloned and biochemically characterized from probiotics.
Despite that the bacteria was isolated from rat fecal samples, the microorganism
studied is a commensal member present in the human gut. The FAE activity was
previously described in several microorganisms representative of the different bacterial
groups (Couteau et al., 2001). However, in the publications consulted, the genes
encoding the enzymes were not identified. There is only one article (Wang et al., 2004b)
that describes the isolation of a FAE gene from L. acidophilus. These authors used
classical methods to purify the enzyme from crude extract. The N-terminal amino acid
sequences of that FAE was provided in the article: ARVEKPRKVILVGDGAVGST. The
L. acidophilus genome was fully sequenced a year later (Altermann et al., 2005). The
sequence described by Wang et al. matches only with the L-lactate dehydrogenase. No
enzymes, in the 3 different, fully sequenced and annotated strains of L. acidophilus,
matched the sequence provided. During the course of this work, a similar protein was
purified from Butyrivibrio proteoclasticus. The protein identified as EstE1 was not

92
extensively characterized. The work on EstE1 focused on the structure of the protein;
thus, it is included in the discussion of the chapter 4 of the present work.
The biological importance of LAB as probiotics is extensively documented and
discussed (Walter, 2008). The amelioriating effects of LAB against diabetes symptoms
were recently described. However, there is still no satisfactory explanation for this
observation (Matsuzaki et al., 1997a; Matsuzaki et al., 1997b; Matsuzaki et al., 1997c;
Yamano et al., 2006). The present work does not answer that question but joins
important elements to enrich the discussion in pursuing the understanding of the
bacterium-diabetic host relationship. Based on the microflora analysis of BB-DP and
BB-DR rats, LAB is one of the groups of bacteria that are naturally enriched in the gut of
a nondiabetic host (Roesch et al., 2009). It has been shown that an important amount of
the cinnamoyl esterase activity is provided by the enzymes produced by the gut
microflora (Plumb et al., 1999; Williamson et al., 2000) and that ferulic acid can
stimulate insulin secretion (Adisakwattana et al., 2008; Balasubashini et al., 2004; Fujita
et al., 2008; Balasubashini et al., 2003). These three important elements together
suggest that the ability of LAB to produce FAEs could play a role in releasing ferulic acid
from the diet in the digestive tract, prevent oxidative stress, and to overcome diabetes
symptoms of genetically predisposed diabetic hosts. A direct piece of evidence
regarding oxidative stress diminution by probiotics was recently published (Valladares et
al., 2010). The BB-DP rats fed with the L. johnsonii N6.2 strain demonstrated to have
less oxidative damage and lower rate of diabetes development. These findings, together
with the high feruloyl esterase activity described in this work, are in direct agreement
with the initial hypothesis that the probiotic bacteria Lactobacillus johnsonii could

93
produce the necessary enzymes to release the antioxidative phenolics. Further in vivo
evidence using knockout FAE mutants will be necessary to discuss this observation in
detail.
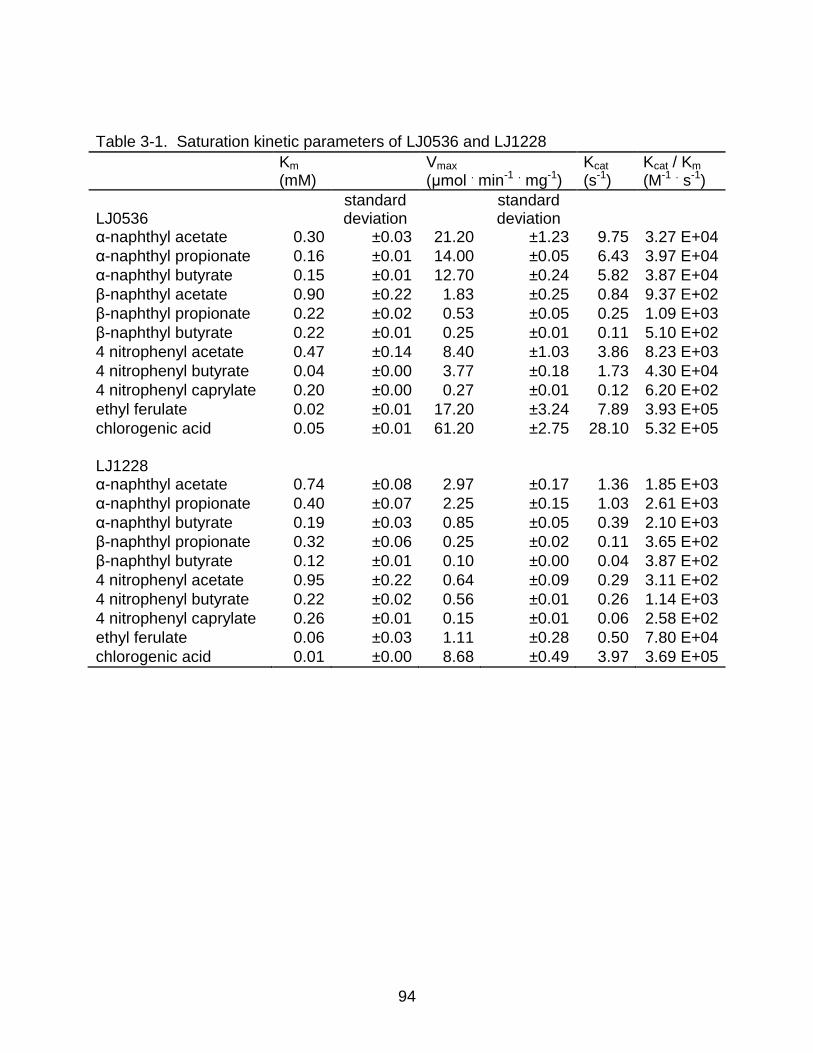
94
Table 3-1. Saturation kinetic parameters of LJ0536 and LJ1228
Km (mM)
Vmax (μmol . min-1 . mg-1)
Kcat (s-1)
Kcat / Km (M-1 . s-1)
LJ0536
standard deviation
standard deviation
α-naphthyl acetate 0.30 ±0.03 21.20 ±1.23 9.75 3.27 E+04
α-naphthyl propionate 0.16 ±0.01 14.00 ±0.05 6.43 3.97 E+04
α-naphthyl butyrate 0.15 ±0.01 12.70 ±0.24 5.82 3.87 E+04
β-naphthyl acetate 0.90 ±0.22 1.83 ±0.25 0.84 9.37 E+02
β-naphthyl propionate 0.22 ±0.02 0.53 ±0.05 0.25 1.09 E+03
β-naphthyl butyrate 0.22 ±0.01 0.25 ±0.01 0.11 5.10 E+02
4 nitrophenyl acetate 0.47 ±0.14 8.40 ±1.03 3.86 8.23 E+03
4 nitrophenyl butyrate 0.04 ±0.00 3.77 ±0.18 1.73 4.30 E+04
4 nitrophenyl caprylate 0.20 ±0.00 0.27 ±0.01 0.12 6.20 E+02
ethyl ferulate 0.02 ±0.01 17.20 ±3.24 7.89 3.93 E+05
chlorogenic acid 0.05 ±0.01 61.20 ±2.75 28.10 5.32 E+05
LJ1228
α-naphthyl acetate 0.74 ±0.08 2.97 ±0.17 1.36 1.85 E+03
α-naphthyl propionate 0.40 ±0.07 2.25 ±0.15 1.03 2.61 E+03
α-naphthyl butyrate 0.19 ±0.03 0.85 ±0.05 0.39 2.10 E+03
β-naphthyl propionate 0.32 ±0.06 0.25 ±0.02 0.11 3.65 E+02
β-naphthyl butyrate 0.12 ±0.01 0.10 ±0.00 0.04 3.87 E+02
4 nitrophenyl acetate 0.95 ±0.22 0.64 ±0.09 0.29 3.11 E+02
4 nitrophenyl butyrate 0.22 ±0.02 0.56 ±0.01 0.26 1.14 E+03
4 nitrophenyl caprylate 0.26 ±0.01 0.15 ±0.01 0.06 2.58 E+02
ethyl ferulate 0.06 ±0.03 1.11 ±0.28 0.50 7.80 E+04
chlorogenic acid 0.01 ±0.00 8.68 ±0.49 3.97 3.69 E+05
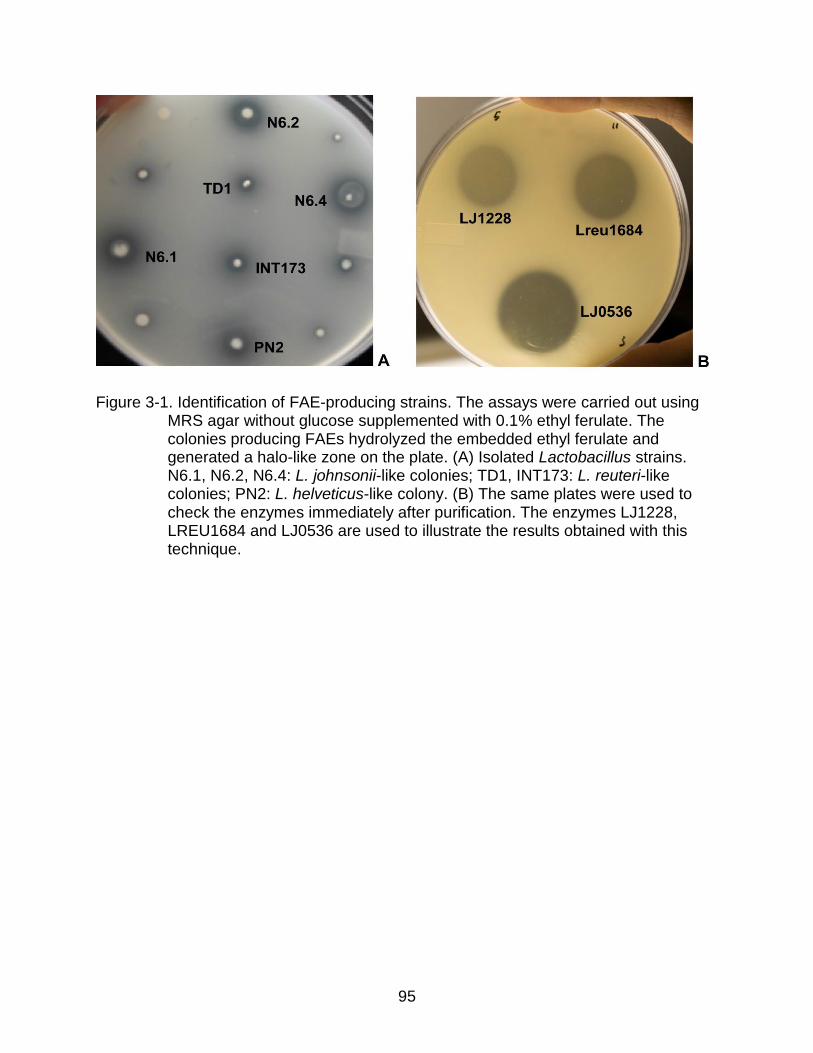
95
Figure 3-1. Identification of FAE-producing strains. The assays were carried out using MRS agar without glucose supplemented with 0.1% ethyl ferulate. The colonies producing FAEs hydrolyzed the embedded ethyl ferulate and generated a halo-like zone on the plate. (A) Isolated Lactobacillus strains. N6.1, N6.2, N6.4: L. johnsonii-like colonies; TD1, INT173: L. reuteri-like colonies; PN2: L. helveticus-like colony. (B) The same plates were used to check the enzymes immediately after purification. The enzymes LJ1228, LREU1684 and LJ0536 are used to illustrate the results obtained with this technique.

96
Figure 3-2. Identification of the colonies isolated from BB-DR rats. Phylogenetic relationships of lactobacilli 16S rDNA sequences and the isolated strain N6.2 from BB-DR rats stool sample. The analysis shows that the isolated N6.2 is one strain of L. johnsonii. The alignment of the sequences was done using ClustalX2 (neighbor-joining method) and the phylogenetic relationships were visualized with TreeView. LSA, L. sakei 23K (locus tag = LSAr01); N6.2: isolated strain; LJO, L. johnsonii NCC 533 (locus tag = LJR007); LDE, L. delbrueckii subsp. bulgaricus ATCC BAA-365 (locus tag = LBUL_r0045); LBA, L. acidophilus NCFM (locus tag = LBA2001); LHE, L. helveticus DPC 4571 (locus tag = lhv_3101); LRE, L. reuteri JCM1112 (locus tag = LAR_16SrRNA01); LFE: L. fermentum IFO 3956 (locus tag = LAF_16SrRNA01); LSL, L. salivarius UCC118 (locus tag = LSL_RNA001).LBR, L. brevis ATCC 367 (locus tag = LVIS_r0082); LPL, L. plantarum WCFS1 (locus tag = lp_rRNA01).
97
Figure 3-3. Purified enzymes on SDS-PAGE stained with Coomassie Blue. Enzymes were purified using nickel affinity chromatography. Lane 1: EZrun molecular weight marker (Fisher Scientific). Lane 2: LJ0114 (30.3 kDa). Lane 3: LJ0536 (27.6 kDa). Lane 4: LJ0618 (21.2 kDa). Lane 5: LJ1228 (27.5 kDa). Lane 6: LREU1549 (26.6 kDa). Lane 7: LREU1684 (27.5 kDa). Lane 8: LREU1647 (90.4 kDa).
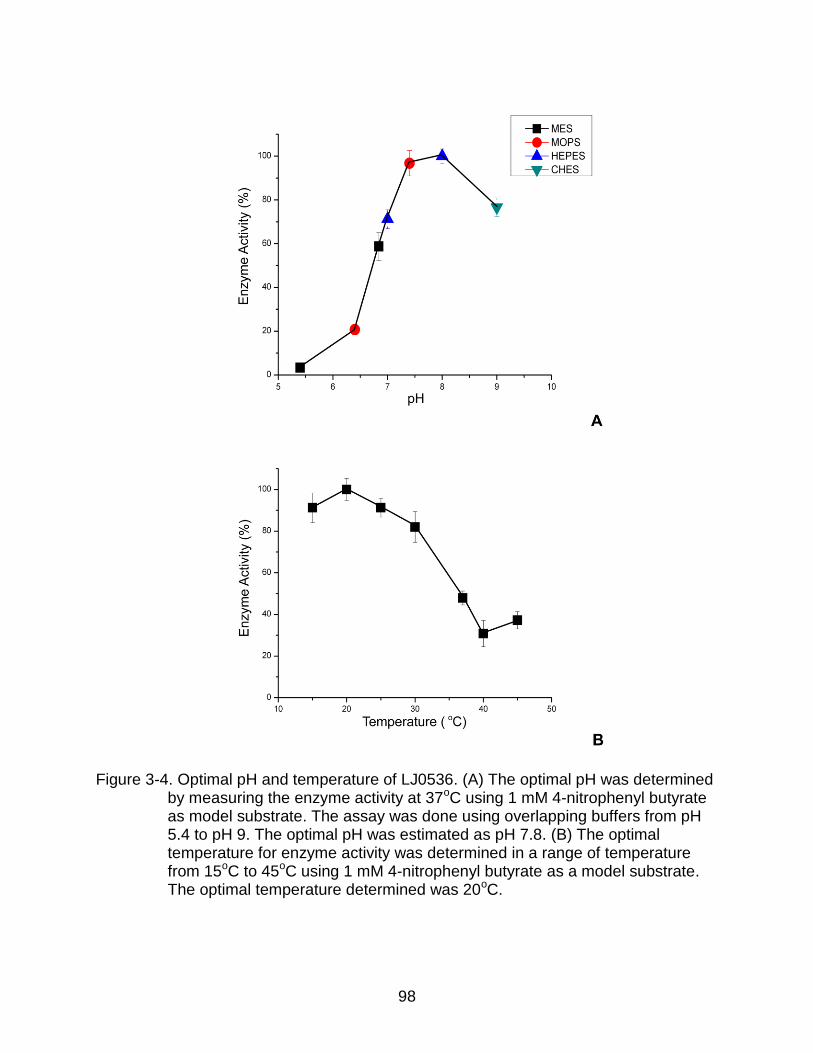
98
Figure 3-4. Optimal pH and temperature of LJ0536. (A) The optimal pH was determined by measuring the enzyme activity at 37oC using 1 mM 4-nitrophenyl butyrate as model substrate. The assay was done using overlapping buffers from pH 5.4 to pH 9. The optimal pH was estimated as pH 7.8. (B) The optimal temperature for enzyme activity was determined in a range of temperature from 15oC to 45oC using 1 mM 4-nitrophenyl butyrate as a model substrate. The optimal temperature determined was 20oC.
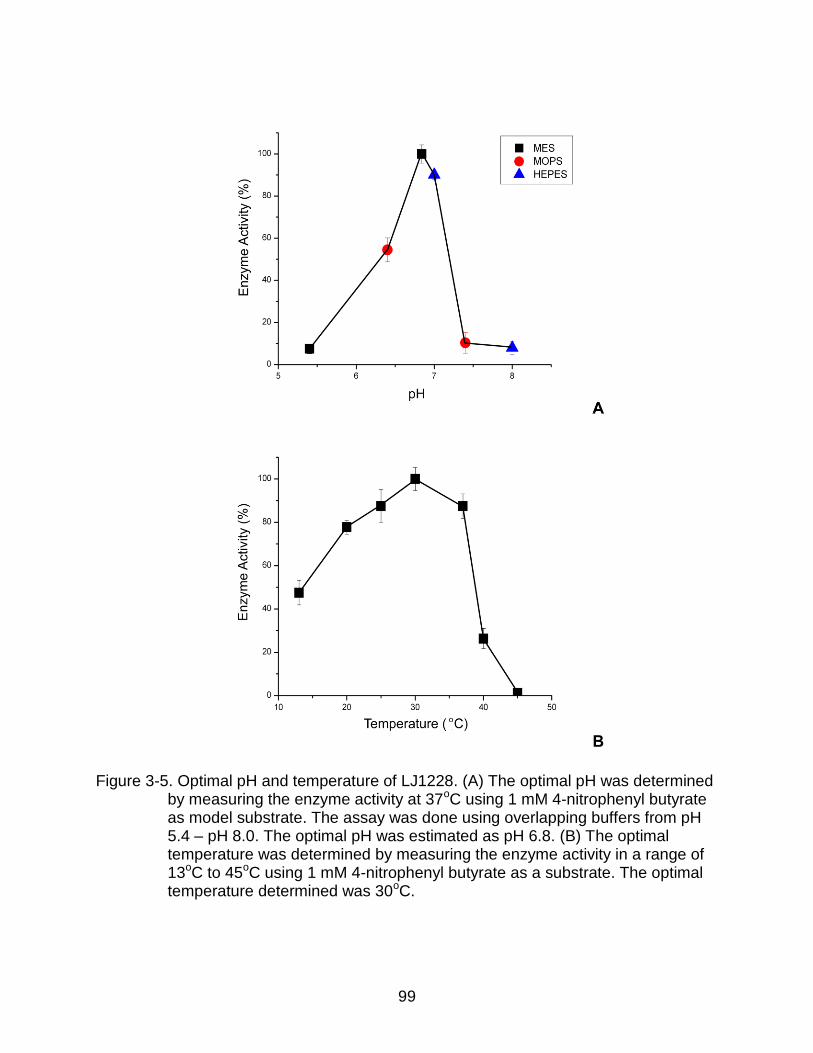
99
Figure 3-5. Optimal pH and temperature of LJ1228. (A) The optimal pH was determined by measuring the enzyme activity at 37oC using 1 mM 4-nitrophenyl butyrate as model substrate. The assay was done using overlapping buffers from pH 5.4 – pH 8.0. The optimal pH was estimated as pH 6.8. (B) The optimal temperature was determined by measuring the enzyme activity in a range of 13oC to 45oC using 1 mM 4-nitrophenyl butyrate as a substrate. The optimal temperature determined was 30oC.

100
Figure 3-6. Enzymatic substrate profile of the enzymes LJ0536 and LJ1228. The assays were carried out following the protocol described by Janes and co-workers using 4-nitrophenol as a proton trapper (Janes et al., 1998). The hydrogen ion generated during ester hydrolysis reduced the free 4-nitrophenol in solution, leading to a decrease in absorbance at 404 nm. The enzyme activity was estimated from the amount of hydrogen ion released. The reaction mixture was formulated with 4.39 mM BES buffer pH 7.2, 0.44 mM of 4-nitrophenol, 1 mM of substrate, and 30 to 35 μg . mL-1 of the purified enzymes.
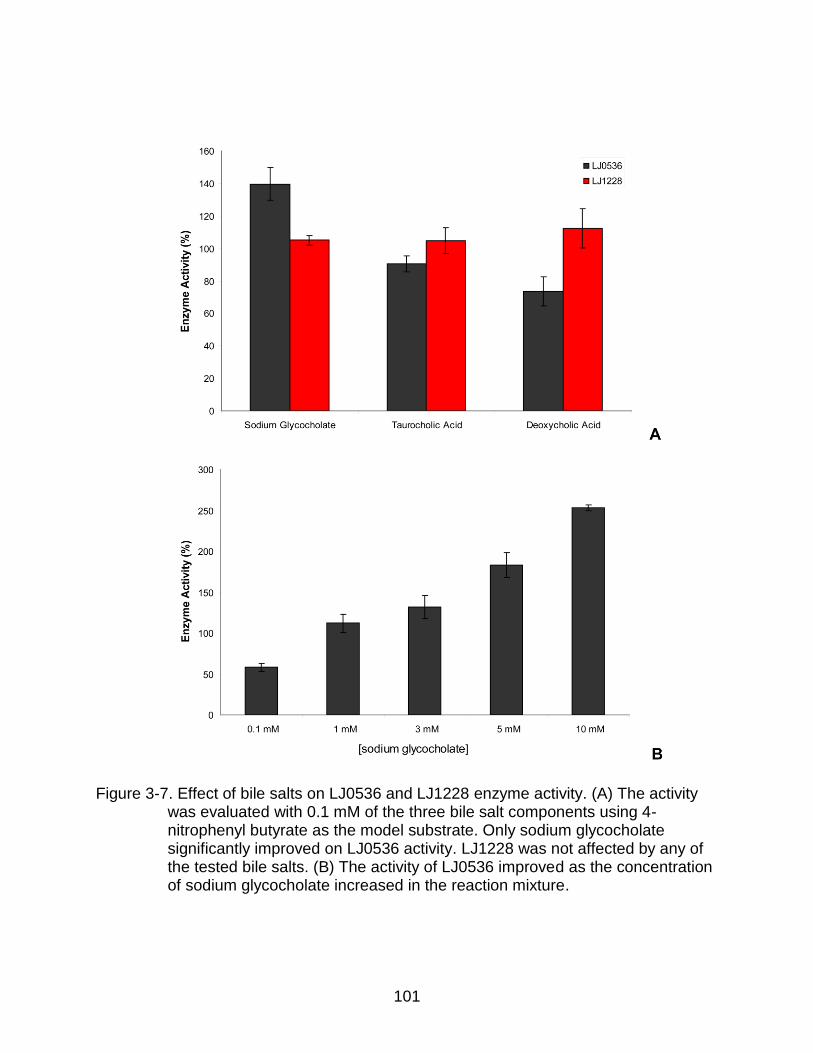
101
Figure 3-7. Effect of bile salts on LJ0536 and LJ1228 enzyme activity. (A) The activity was evaluated with 0.1 mM of the three bile salt components using 4-nitrophenyl butyrate as the model substrate. Only sodium glycocholate significantly improved on LJ0536 activity. LJ1228 was not affected by any of the tested bile salts. (B) The activity of LJ0536 improved as the concentration of sodium glycocholate increased in the reaction mixture.

102
Figure 3-8. Genomic context of (A) LJ0536 and (B) LJ1228 (colored red) in the reference strain L. johnsonii NCC 533. All the open reading frames in the neighborhood and the genes of interest are annotated as hypothetical proteins (colored Ivory).

103
Figure 3-9. Multiple sequence alignment of LJ0536 and proteins with high sequence identity. The protein sequences retrieved from the database are annotated as putative or hypothetical esterase / hydrolase. Gene identification numbers are listed in Chapter 2. The two classical serine esterase catalytic motifs (GxSxG) are clearly identified (boxed in rectangles). The cluster containing the first motif, which belongs to the positions Gly66-Ser68-Gly70 in LJ0536, is less conserved compared to the location of the second motif Gly104-Ser106-Gly108. The serine present in the second motif is thought to be the nucleophile residue during catalysis since the cluster is highly conserved. The potential catalytic triad residues (fully conserved serine, histidine, and aspartic acid) are indicated by red arrows. Amino acids are colored in different colors.
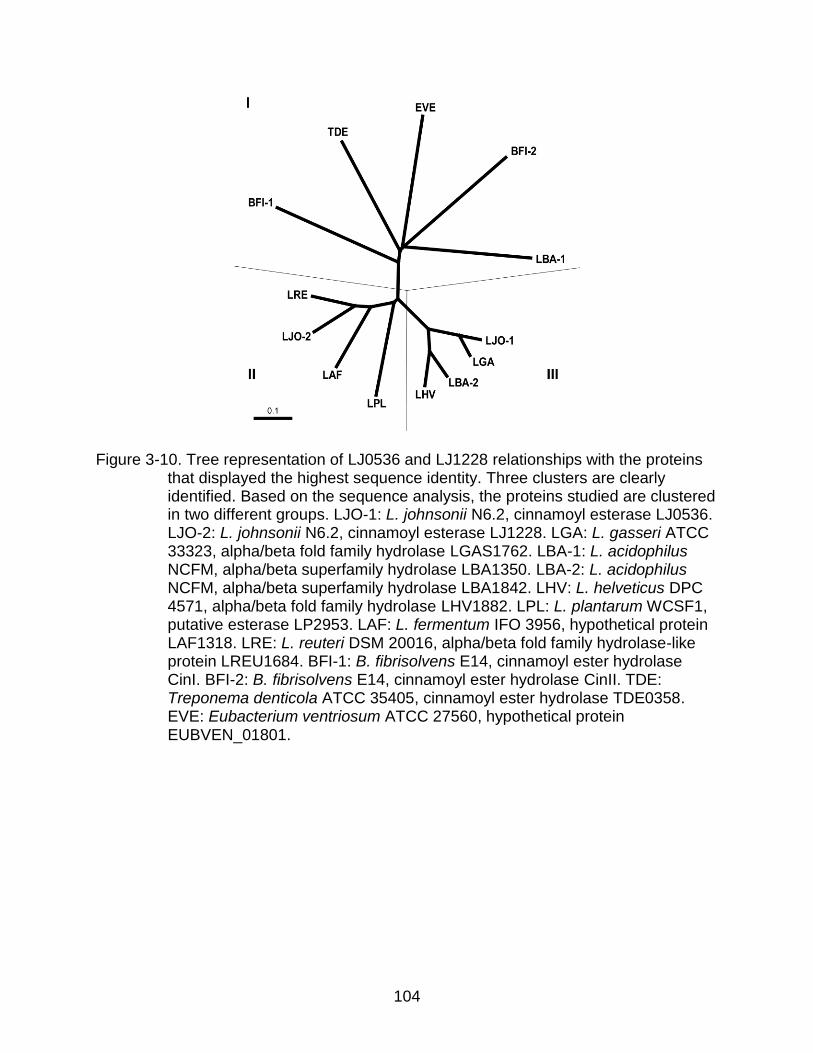
104
Figure 3-10. Tree representation of LJ0536 and LJ1228 relationships with the proteins that displayed the highest sequence identity. Three clusters are clearly identified. Based on the sequence analysis, the proteins studied are clustered in two different groups. LJO-1: L. johnsonii N6.2, cinnamoyl esterase LJ0536. LJO-2: L. johnsonii N6.2, cinnamoyl esterase LJ1228. LGA: L. gasseri ATCC 33323, alpha/beta fold family hydrolase LGAS1762. LBA-1: L. acidophilus NCFM, alpha/beta superfamily hydrolase LBA1350. LBA-2: L. acidophilus NCFM, alpha/beta superfamily hydrolase LBA1842. LHV: L. helveticus DPC 4571, alpha/beta fold family hydrolase LHV1882. LPL: L. plantarum WCSF1, putative esterase LP2953. LAF: L. fermentum IFO 3956, hypothetical protein LAF1318. LRE: L. reuteri DSM 20016, alpha/beta fold family hydrolase-like protein LREU1684. BFI-1: B. fibrisolvens E14, cinnamoyl ester hydrolase CinI. BFI-2: B. fibrisolvens E14, cinnamoyl ester hydrolase CinII. TDE: Treponema denticola ATCC 35405, cinnamoyl ester hydrolase TDE0358. EVE: Eubacterium ventriosum ATCC 27560, hypothetical protein EUBVEN_01801.

105
CHAPTER 4 X-RAY CRYSTALLIZATION AND SUBSTRATE BINDING MECHANISM OF LJ0536
Background
The enzymes that hydrolyze the ferulic and p-coumaric ester cross-linking bonds
present in hemicellulose are used industrially to improve the degradation of biomass
with vegetable origins. It is well known that the natural systems often serve as
inspirations for finding the necessary elements needed to improve “man made”
methods. The natural flora associated with decaying wood are composed primarily of
several species of fungi. Thus, several mass-produced commercial enzymes used in
plants biomass saccharification were obtained from different species of fungi. Due to
ease of obtaining such enzymes, it is not surprising that practically all FAEs that had
been biochemically and structurally studied are of fungal origin (Benoit et al., 2007;
Faulds et al., 2005; Hermoso et al., 2004).
The scientific literature describing the biochemistry and 3-dimensional structures
of bacterial FAEs is limited. It was mentioned previously (Chapter 3) that no proteins
isolated from bacteria of the human normal flora with FAE activity were biochemically
characterized before this work. Once LJ0536 and LJ1228 were identified as L. johnsonii
FAEs, the in silico predicted 3-dimensional structure partially matched with only one
protein of the PDB database (PDB: 2OCG). The best match was the human protein
valacyclovir hydrolase (VACVase), produced in the liver and involved in the activation of
the antiviral valacyclovir (Lai et al., 2008). During the course of this study, the first
structure of a bacterial FAE (Goldstone et al., 2010) was deposited in the PDB database
(PDB: 2WTM). This protein (Est1E) was purified from Butyrivibrio proteoclasticus
(Firmicutes, Clostridiales), a bacterium that thrives in the rumen of several herbivores.

106
The overall predicted structure of LJ0536 had a good correlation with the structure of
Est1E.
Esterases are classical members of one of the most versatile proteins structural
groups, the α / β superfamily, sub-family α / β fold hydrolases (Ollis et al., 1992). The α /
β fold provides a stable scaffold for the active site of a variety of enzymes, including
lipases, proteases, and haloalkane dehydrogenases. The canonical α / β fold
hydrolases mostly consist of several β-strands (normally 8), surrounded by α-helices
(Figure 4-1). The central β-sheet usually displays a left-handed superhelical twist. Thus,
in the overall structure, the first and last strands cross each other at an angle of 90°.
The catalytic center always consists of a triad composed of a nucleophile (serine,
cysteine, or aspartic acid), a fully conserved histidine, and an acidic residue (usually
aspartic acid). The nucleophile, usually serine in carboxylesterases, is always located in
a sharp turn exposed to the solvent, which is generally called the “nucleophilic elbow”.
This architecture ensures easy contact between the substrate and water molecules in
the solvent (Ollis et al., 1992; Nardini & Dijkstra, 1999; Holmquist, 2000).
The hydrolytic mechanism of serine esterases was described in detail in Chapter
1. The sequence of steps previously described is generally accepted for all enzymes
with a similar mechanism of hydrolysis. The acylenzyme intermediate was “captured” in
a crystallized protein (Mangel et al., 1990; Ding et al., 1994). The only elusive link in this
reaction is the tetrahedral intermediate (Dodson & Wlodawer, 1998). Thus, the
formation of the two tetrahedral intermediates steps is assumed to occur and probably
they will be never captured due to the instability of the complex (Hedstrom, 2002). Since

107
most of the secrets of catalysis have already been uncovered, the focus of this study is
on characterizing the mechanisms of substrate binding.
The identification of protein scaffolds that recognize the substrates to be
hydrolyzed is one of the most interesting aspects of modern enzymology. Catalytic
pockets can be predicted using 3-dimensional models. However, the information in the
protein structure database is still too fragmented to identify the intimate relationship
between the amino acids of the binding cavity and the substrate. Due to limited
knowledge of FAE structures, in silico approaches are used to predict potential
substrate orientations within the catalytic pockets of the enzymes. However, the
techniques used, generally called molecular docking, face serious problems when the
proteins to be studied can function with several substrates. The phenomenon, described
as “enzyme promiscuity”, is actually more frequent than the model of “one enzyme, one
substrate” traditionally associated with enzymatic catalysis. The catalytic flexibility of
carboxylesterases, enzymes that can use ester compounds with a variety of chemical
scaffolds (Pindel et al., 1997; Bornscheuer, 2002; Lai et al., 2009) makes this group of
enzymes excellent models of study. The catalytic flexibility is well represented by the
FAEs purified from L. johnsonii N6.2. Both LJ0536 and LJ1228 proteins were
demonstrated to be active on a large variety of ester substrates, from phenolic to
aliphatic esters, including substrates of high molecular weight like steryl esters (Lai et
al., 2009).
This chapter is dedicated to the structural studies carried out with the FAEs
purified from L. johnsonii N6.2. The overall structure of the apo-enzyme is described,
together with the analysis of the catalytic amino acids. As mentioned before, the main

108
focus of the study is directed towards describing the structures involved in the
conformation of the catalytic pocket. The structures of the crystallized protein and
protein co-crystallized with the substrates of interest are discussed along with the site-
directed mutagenesis studies. The unique features of LJ0536 were compared with the
characteristics of the closest structural homologous as identified by 3-dimensional
alignments.
Result and Discussion
Architecture of LJ0536
The structure of the apo-LJ0536 was determined by Banting and Best Department
of Medical Research, Centre for Structural Proteomics in Toronto (University of
Toronto). Structural Analyses were done in our laboratory. The apo-LJ0536 structure
has a resolution of 2.35 Å using Molecular Replacement (MR) with feruloyl esterase
Est1E from Butyrivibrio proteoclasticus (PDB: 2WTM) (Goldstone et al., 2010).
Crystallization and diffraction statistics are summarized in Table 4-1. LJ0536 was
crystallized as homodimer (Figure 4-2A and B), which is consistant with size exclusion
analysis (Figure 4-3) showing that the native molecule weight of LJ0536 is 46.0 ± 3.2
kDa (monomeric apparent molecular weight: 27.6 kDa). LJ0536 displays a classical α /
β hydrolase fold (Ollis et al., 1992). The overall structure of LJ0536 is composed of
twelve β-strands and nine α–helices (Figure 4-4A). It has a central β-sheet core which
contains one antiparallel (β2) and seven parallel (β1, β3, β4, β5, β6, β11, β12) β-strands.
The central β-sheet core shows a left-handed superhelical twist with an approximate
angle of 120o between β1 and β12 (Figure 4-4B). It is flanked by five α–helices of which
two α–helices (α1, α9) are externally located and three α–helices (α3, α4, α8) are
internally located towards the dimer interface (Figure 4-2A). The dimer interface is

109
formed by α4, α6, and β1. It comprises 34 and 37 residues of chain A and chain B
respectively, burying a total of 2373 Å2 between the two chains. Five hydrogen bonds
are formed within the interface (one from chain A R8 to chain B D9, one from chain A
G117 to chain B Q175, two from chain A R171 to chain B D121, and one from chain A
R171 to chain B L118). A sequence of 54 amino acids (P131 to Q184) forms an
inserted α / β domain between β6 and β11 (Figure 4-5). This domain is composed of two
short β-hairpins (β7 - β8 and β9 - β10), and three α–helices (α5, α6, α7). The two β-hairpins
project towards the entrance of the substrate binding cavity. The two protruding hairpins
from the inserted α / β domain decorate the entrance of this cleft and form the “roof” of
the catalytic compartment. The substrate binding cavity resembles an open canal-like
feature with the shape of a boomerang (Figure 4-6). The binding cavity is formed by two
clefts (Figure 4-6A). One is approximately 13 Å long and ends in a hydrophobic pocket
buried between the α5 and α6 of the inserted α / β domain. It is large enough to
accommodate the aromatic acyl group of the substrate. The other cleft is about 12 Å
long and can accommodate the alkoxyl group plus additional atoms from larger
substrates.
The S106 is the Catalytic Residue
An intriguing feature of LJ0536 is the presence of two GXSXG motifs, which are
conserved among LJ0536 orthologs. Previously, two conserved classical GXSXG motifs
(G66-X-S68-X-G70 and G104-X-S106-X-G108) were identified in the primary
sequences of LJ0536. These two clusters were fully conserved in all of the homologs
retrieved from the database with a Blast search. Typically, the carboxylesterases
display only one GXSXG motif. In order to confirm LJ0536 is using serine as catalytic
residue, the enzyme activity was evaluated in the presence of specific serine or cysteine

110
inhibitors. The enzymatic activity of LJ0536 was arrested by the serine protease
inhibitor phenylmethanesulphonylfluoride (PMSF), but it resisted the action of the
cysteine alkylating compounds N-ethylmaleimide (NEM) and iodoacetate (Figure 4-7).
These results confirmed the presence of a serine as the nucleophilic residue in the
active center, which was suggested by the bioinformatic analysis.
The crystal structure of LJ0536 showed that the catalytic triad is composed of
S106, H225, and D197 (Figure 4-6). The role of H225 is to deprotonate S106. Then
S106 can perform a nucleophilic attack on the carbon atom of the carbonyl group of the
substrate, while D197 stabilizes the protonated H225. The distance between S106 and
H225 is 3.03 Å, and the distance between H225 and D197 is 3.01 Å. The catalytic
serine residue (S106) is located at the center of the boomerang shape crevice which is
on the nucleophilic elbow formed between β5 and α4 (Figure 4-6B and D). S68 is located
18 Å away from S106 (Figure 4-8A). Two amino acids that are conserved within
homolog proteins, H32 and D61, are found in the sequence (Figure 3-9). Although S68
together with H32 and D61 seem able to form a catalytic triad, S68 is not located on the
nucleophilic elbow. Catalytic serine located on ucleophilic elbow is one of the conserved
features of the α / β fold subfamily. The nucleophilic elbow structure is one of the
requirements to consider the serine as a catalytically active residue. There is not a
binding cavity exposed to the solvent around S68. The apparent contact of the residue
(S68) with the solvent is not enough to support a role in hydrolysis (Figure 4-8B). The
highly conserved histidine of the triad, in this case H32, has a good orientation in space,
but it is not in a close proximity to S68 (9.48 Å apart from each other). Consequently, it
is unlikely that H32 can perform the deprotonation of S68. There is no other potential

111
candidate in the region to fulfill the critical deprotonation step during catalysis. Thus,
S68, H32, and D61 do not reunite the typical characteristics to be considered as a triad
of catalytic active residues.
In order to confirm experimentally that S68, H32, and D61 are not involved in the
forming of catalytic triad, enzymes with specific site-directed mutations were made. The
mutations were directed to the conserved serine, histidine, or aspartic acid residues as
identified with the multiple alignment of the lineal sequences of several proteins with
high identity (Figure 3-9). All mutants were purified successfully (Figure 4-9). It was
confirmed that the active catalytic triad is S106, H225, and D197 since the mutants
S106A and D197A do not displayed enzymatic activity (Table 4-2, Figure 4-10).
Interesting, the enzyme activity of S68A, H32A, and D61A was also hindered. A second
look to the structures indicates that the S68 form extensive hydrogen bonds with the
amino acids of the neighborhood (Figure 4-8C). I hypothesized that the conserved S68
was an important residue in order to maintain the proper folding of the enzyme. Circular
dichroism analysis of the S68A mutant confirmed a significant shift in the secondary
structure of the protein (Figure 4-11). The secondary structure analysis indicates that
the activity of S68A is affected by an overall change in the protein structure rather than
a change in the catalytic residues.
Analysis of the Crystal Structures of S106A-Substrate Complexes Reveals Critical Residues for Substrate Binding and Catalysis
The structure of the catalytic deficient mutant (S106A) and the S106A co-
crystallized with ferulic acid, ethyl ferulate, or chlorogenic acid (Figure 4-12) were
determined by Banting and Best Department of Medical Research, Centre for Structural
Proteomics in Toronto (University of Toronto). Structural Analyses were done in our

112
laboratory. The S106A ethyl ferulate complex crystallized in two forms (Form I and Form
II with a dimer and a single chain in the asymmetric units, respectively). The two ethyl
ferulate crystal forms are nearly identical in structure (root mean square deviation
(RMSD) values of 244 Cα atoms of both chains of Form I onto Form II are 0.25 and 0.3
Å respectively), and the dimer from Form II is essentially identical with the Form I dimer.
Analysis was focused on Form II due to better occupancy of the ligand in the active site.
Overall, no appreciable differences in the backbone structure between the apo wild type
(WT) enzyme and the S106A mutant (RMSD of 0.33 Å over all 244 C atoms) was
observed. The ligand binding did not induce major structural changes in the active site,
except for a rotamer change in Q145 and a slight rotation of the side chain of H225
(Figure 4-13), which presumed the active conformation of the catalytic triad.
The excellent diffraction of apo-S106A, S106A bound with ethyl ferulate, S106A
bound with ferulic acid, and S106A bound with caffeic acid (resolutions between 1.58 Å
– 1.75 Å) allowed us to compare the positions of different substrates and the
conformation of the active site residues (Figure 4-14). Q145 from the inserted α / β
domain adopted a different conformation, creating a bridge-like structure on top of the
catalytic site (Figure 4-12). The feature of Q145, along with the side chains of F34 and
V199, limits the size of the substrate that can enter the catalytic pocket to 7 Å in width.
In all three complexes, the substrates in the catalytic groove were oriented with the
aromatic acyl moiety of the carbonyl group bound in the deepest part of the pocket
(Figure 4-12). The opposite end of the ligands, on the far side of the ester moiety such
as the ethoxyl group of ethyl ferulate, rests on a more solvent-exposed area of the
groove and has no interactions with the protein. The electron density for the C2 atom of

113
ethyl ferulate has missing electron density in the structure (Figure 4-15A), which is
consistent with the C2 atom being part of the leaving group (ethyl group) after
hydrolysis. As well, no clear electron density was resolved for the quinic acid moiety of
chlorogenic acid (labeled as caffeic acid-bound) (Figure 4-15C and D), perhaps due to
residual enzymatic activity or a lack of productive interactions with the enzyme. The
substrate specificity only depends on the type of phenolic acid presents in the ester,
binding of the leaving group is not necessary, resulting in poor electron density map on
the leaving group. This hypothesis is supported by Faulds (Faulds et al., 2005) which
shown that crystallization of S133A AnFaeA mutant (catalytic deficient mutant of feruloyl
esterase from Aspergillus niger) with feruloylated trisaccharide substrate shows only the
ferulic acid moiety but not the carbohydrates moiety. A similar scenario is observed in
the crystal structure of catalytic serine deficient S172A FAE-XynZ mutant in complex
with feruloyl arabinoxylan (Schubot et al., 2001). Only the ferulic acid is visible in the
structure, even though the authors took extra precaution to avoid substrate hydrolysis
during crystallization. Both studies lead to the same conclusion that the lack of leaving
group in the structure is due to the lack of interaction between the enzyme and the
leaving group. The enzyme does have an area of the binding cleft that could
accommodate the quinic acid group (Figure 4-14B), or other groups of a similar size,
formed by the side chains of H32, A36, T40, L42, L43, H105 and C226. The binding
cavity is occupied by water molecules in each of the structures (Figure 4-13).
The LJ0536 catalytic deficient mutant S106A forms extensive hydrogen bonding
networks at both ends of the ligands. Thus, it forms a molecular ruler where the
distance between the aromatic ring and the site of hydrolysis is constrained by these
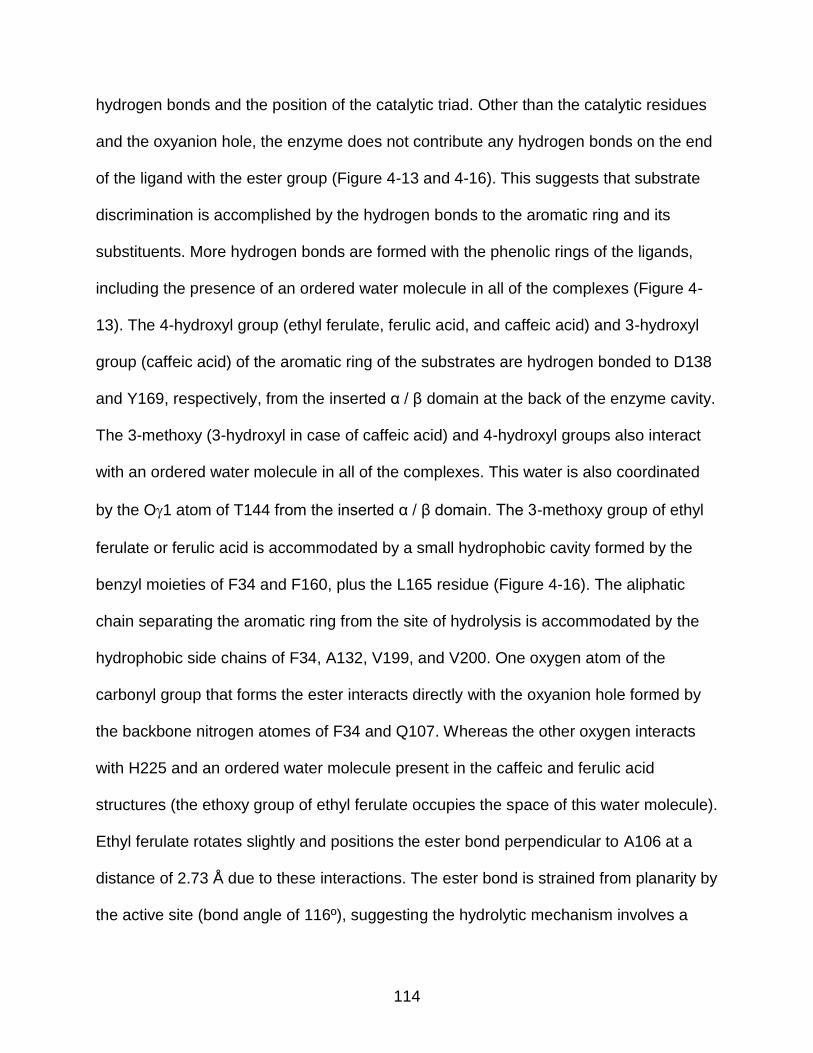
114
hydrogen bonds and the position of the catalytic triad. Other than the catalytic residues
and the oxyanion hole, the enzyme does not contribute any hydrogen bonds on the end
of the ligand with the ester group (Figure 4-13 and 4-16). This suggests that substrate
discrimination is accomplished by the hydrogen bonds to the aromatic ring and its
substituents. More hydrogen bonds are formed with the phenolic rings of the ligands,
including the presence of an ordered water molecule in all of the complexes (Figure 4-
13). The 4-hydroxyl group (ethyl ferulate, ferulic acid, and caffeic acid) and 3-hydroxyl
group (caffeic acid) of the aromatic ring of the substrates are hydrogen bonded to D138
and Y169, respectively, from the inserted α / β domain at the back of the enzyme cavity.
The 3-methoxy (3-hydroxyl in case of caffeic acid) and 4-hydroxyl groups also interact
with an ordered water molecule in all of the complexes. This water is also coordinated
by the O1 atom of T144 from the inserted α / β domain. The 3-methoxy group of ethyl
ferulate or ferulic acid is accommodated by a small hydrophobic cavity formed by the
benzyl moieties of F34 and F160, plus the L165 residue (Figure 4-16). The aliphatic
chain separating the aromatic ring from the site of hydrolysis is accommodated by the
hydrophobic side chains of F34, A132, V199, and V200. One oxygen atom of the
carbonyl group that forms the ester interacts directly with the oxyanion hole formed by
the backbone nitrogen atomes of F34 and Q107. Whereas the other oxygen interacts
with H225 and an ordered water molecule present in the caffeic and ferulic acid
structures (the ethoxy group of ethyl ferulate occupies the space of this water molecule).
Ethyl ferulate rotates slightly and positions the ester bond perpendicular to A106 at a
distance of 2.73 Å due to these interactions. The ester bond is strained from planarity by
the active site (bond angle of 116º), suggesting the hydrolytic mechanism involves a

115
typical tetrahedral enzyme-ester intermediate of esterases. The different configuration
of the ester bonds of the substrate ethyl ferulate and the product ferulic acid that is
parallel to the main axis of the groove further suggests the validity of the tetrahedral
enzyme-ester intermediate mechanism (Figure 4-13B and C, 4-14A).
A water molecule was observed, 3.3 Å from the non-carbonyl oxygen of the ester
bond of ethyl ferulate towards the solvent-exposed face of the pocket (Figure 4-13B and
4-14A). It is possible that this corresponds to the water molecule that is targeted for
deprotonation by H225 in order to hydrolyze the tetrahedral intermediate between the
ligand and S106. Thus, the enzyme is regenerated and the product is released. After
hydrolysis, the new hydroxyl group forms a polar interaction with the Nε2 of H225.
The caffeic acid moiety of chlorogenic acid adopts a similar position to and
interaction with the catalytic pocket as ferulic acid. However, caffeic acid has two
hydroxyl groups in the benzyl ring (positions 3 and 4), which interact with the side chain
of D138 and Y169 through hydrogen bonding (Figure 4-13D and 4-16D). These
differences between enzyme and substrate interaction explain the differences in the
turnover number previously reported (chlorogenic acid Kcat = 28.1 s-1; ethyl ferulate Kcat
= 7.9 s-1) (Lai et al., 2009).
The size of the binding pocket as revealed in the crystal structure helps explain the
results of a previous study showing that LJ0536 has lower substrate affinity (based on
Km) with 1 / 2-naphthyl acetate compared to 1 / 2-naphthyl propionate and butyrate (1-
Naphthyl-acetate: 0.298 + 0.03 mM. 1-Naphthyl propionate: 0.162 + 0.01 mM. 1-
Naphthyl butyrate: 0.150 + 0.01 mM. 2-Naphthyl acetate: 0.897 + 0.22 mM. 2-Naphthyl
propionate: 0.225 + 0.02 mM. 2-Naphthyl butyrate: 0.222 + 0.01 mM) (Lai et al., 2009).

116
It is possible that the size of acetate is not long enough to exploit the binding pocket for
interactions.
Site-Directed Mutagenesis of the Inserted α / β Domain Demonstrates a Role in Substrate Preference
The analysis of the catalytic site of LJ0536 indicated that the inserted α / β domain
from P131 to Q184 could be important for substrate binding. I hypothesized that the
inserted α / β domain is critical for holding the phenolic ring of the phenolic esters in the
correct position for catalysis, but it has a less important role when aliphatic esters are
used as the enzyme substrate. The hypothesis was assessed by introducing a dramatic
change to the enzyme by expressing a deletion mutant of the inserted α / β domain
(ΔCAP). ΔCAP showed low activity when 4-nitrophenyl butyrate was used as the model
substrate. In contrast, no activity was detected with any of the phenolic esters (ethyl
ferulate, chlorogenic acid, and rosmarinic acid), even when excessive amounts of
enzyme (50 µg . mL-1) were used in the reaction mixtures and the release of products
was analyzed using HPLC. A deeper analysis of site-directed mutants confirmed the
importance of the inserted α / β domain in phenolic ester catalysis (Table 2, Figure 4-
10). Among these mutants, D138A and Q145A had the highest impact on the enzymatic
activity. A direct comparison using four different substrates at a fixed concentration (0.1
mM) indicated that D138A and Q145A showed 73.1 + 2.8% and 87.6 + 0.3% of
percentage activity respectively on 4-nitrophenyl butyrate (Figure 4-10A). The activity of
these mutants dropped to less than 10% activity when caffeic acid esters (chlorogenic
acid and rosmarinic acid) were used as substrates (Figure 4-10C and D). Interestingly,
the mutant Q145A retained 21.7 + 2.8% of percentage activity when ethyl ferulate was
used as the substrate (Figure 4-10B). These results suggested that the residues D138

117
and Q145 play a role in interactions and/or restricting access to the binding pocket for
caffeic and feruloyl esters, but not for nitrophenyl-based esters. A possible explanation
could be that the orientation of the ester bond in 4-nitrophenyl butyrate is such that to
maintain proper orientation in the binding site for catalysis, the substrate would need to
be oriented with the 4-nitrophenol moiety bound in the other pocket of the boomerang-
shaped binding canal. This hypothesis would have to be tested by mutation, such as to
T40 or H105. Other random mutation (T148A, N150A, and D152A) were also created
(Figure 4-9B) to test the sensitive of the inserted α / β domain. Even though the enzyme
activity of T148A and N150A were severly impaired (Table 4-2, Figure 4-10), there are
no functional roles of these residues can be seen in crystal structural analysis. The only
explanation is that the mutation caused a change in the architecture of inserted α / β
domain which affected the binding cavity. D152A achieved even a higher enzyme
activity when compared to wild type LJ0536 (Table 4-2, Figure 4-10). It could be the
result of D152A caused a local realignment of the inserted α / β domain and improve the
binding affinity. These results together with the crystallographic data indicated that D138
and Q145 from the inserted α / β domain are important in recognizing the caffeic and
ferruloyl esters.
Comparisons of LJ0536 and Proteins with Similar Folding
A structural similarity search using the Dali Database (Holm & Rosenström, 2010)
identified many proteins with structural homology to LJ0536 with a range of primary
sequence identities between 17% and 32%. The top matches were Est1E from B.
proteoclasticus (PDB: 2WTM) (Goldstone et al., 2010), human mono-glyceride lipase
(PDB: 3JW8 and 3HJU) (Bertrand et al., 2010), bromoperoxidase A1 from
Streptomyces aureofaciens (PDB 1A8Q) (Hofmann et al., 1998), human valacyclovir

118
hydrolase VACVase (PDB: 2OCG) (Lai et al., 2008), and aryl esterase from
Pseudomonas fluorescens (PDB: 3HI4) (Yin et al., 2010).
Superposition of these structures showed that the enzymes are highly similar in
their architecture of general folding, but there is variation in the inserted domains
(Figure 4-17). Only Est1E shows a highly identical structure with LJ0536. However, the
inserted domains from the other structural homologs have different secondary
structures, even though the architecture of the central core of the enzymes is highly
identical. These inserted domains are formed by α-helices, which differ from the inserts
of LJ0536 and Est1E that are composed of both α-helices and β-sheets.
However, even with the same secondary structure, the specific features of the
inserted domain promote different substrate binding mechanism. The overall structural
features of L. johnsonii cinnamoyl esterase LJ0536 resemble those recently described
in Est1E, a predominant esterase encoded in the genome of Butyrivivrio proteoclasticus
(Goldstone et al., 2010). However, the specific structural differences in the architecture
of the catalytic pocket promote different substrate binding preferences. The differences
in the catalytic pocket scaffolds become evident when both protein structures are
superimposed. The protruding hairpins of LJ0536 at the entrance of the catalytic groove
are slightly shifted (2.30 Å and 1.85 Å) with respect to Est1E. The inserted α / β domain
of LJ0536 adopts a rigid structure as the same conformations are seen in the apo and
ligand-bound structures. In contrast, Est1E adopts a conformational change upon
substrate binding (Goldstone et al., 2010). The specific binding features of Est1E are
based on the rotation of W160 which is located on the second protruding hairpin of the
inserted α / β domain. This corresponds to the hairpin formed between β9 and β10 in

119
LJ0536. The protruding hairpins of Est1E shift when ligand is bound to the catalytic site.
W160 flips and creates a small hydrophobic cavity for binding of the substrate. The
dynamic flipping mechanism of W160 is not present in LJ0536. F160 of LJ0536
corresponds to W160 of Est1E. It adopts the same conformation in apo and each of the
ligand-bound complexes. Instead, LJ0536 forms a bridge-like structure created by Q145
in both apo and ligand bound structure to hold the substrate in the catalytic cavity. L44
of Est1E forms a hydrogen bond to the 4-hydroxyl group on the aromatic ring of ferulic
acid. L144 of Est1E corresponds to Q145 of LJ0536. Instead, hydrogen bonds are
formed between D138 and Y169 to the hydroxyl groups on the aromatic ring of ferulic
acid and caffeic acid in case of LJ0536.
Structural variation in the inserted α / β domain is reflected in substrate
preferences. Due to its its activity on feruloyl esters, Est1E is indeed a closely related
enzyme to LJ0536 (Goldstone et al., 2010). Thus the inserted domain of LJ0536 and
Est1E are highly identical (Figure 4-18A, B, D, and E). Using VACVase as another
example, the inserted domain is comprised of four -helices (Figure 4-18C and F). An
optimal superimposition of LJ0536 and VACVase was found when the inserted domains
were excluded, and only the central cores of the enzymes were compared. VACVase is
a biphenyl hydrolase-like protein which is produced in large amounts in the liver. It is
involved in prodrug activation and was originally identified from human breast
carcinoma. This enzyme was also detected in Caco-2 cells as well as in the intestinal
mucosa (Lai et al., 2008; Kim et al., 2003). Since VACVase shows a similar architecture
of the central core to LJ0536, it could potentially share similar enzyme activity and
contribute to phenolic ester hydrolysis in human intestine. Unlike most of the esterases,

120
VACVase demonstrated a high specificity for amino acid esters (Lai et al., 2008).
VACVase was purified (Figure 4-9C) and its enzyme activity was compared in parallel
with LJ0536 to assess their substrate preferences. VACVase was only active with
valacyclovir and L-amino acid benzyl esters; it was not active towards 4-nitrophenyl
esters, ethyl ferulate, chlorogenic acid, or rosmarinic acid. Despite the fact that LJ0536
has a large range of catalytic specificity, no activities were detected when valacyclovir
and L-amino acid benzyl esters were used as enzyme substrates. Although the overall
enzyme structures are similar, the substrate preferences of these enzymes are
completely different. These results further suggest the architecture of the inserted α / β
domain of esterases plays a critical role in substrate specificity.
Summary
The proteins LJ0536 and LJ1228 purified and biochemically characterized from
Chapter 3 were successfully crystallized. There were no significant structural
differences between LJ0536 and LJ1228. It is expected that both enzymes share
identical substrate binding mechanism as the critical amino acid residues discussed
herein for LJ0536 are also conserved in LJ1228. Thus, only LJ0536 was used for deep
analysis. All the structures generated in this work were deposited in the PDB database.
The α / β domain, inserted as an accessory of the canonical α / β fold structure, is
relevant to the shape of the catalytic pocket of the enzyme studied. LJ0536 showed
clear differences with the previously published enzyme EstE1. The inserted α / β
domain of EstE1 is flexible, and the hydrophobic catalytic pocket is “formed” once the
protein adopts the open conformation to bind the substrate. Instead, the LJ0536
inserted α / β domain is a rigid structure present both in the apo-enzyme and when it is
in complex with the substrate. Several enzymes involved in the catalysis of a variety of
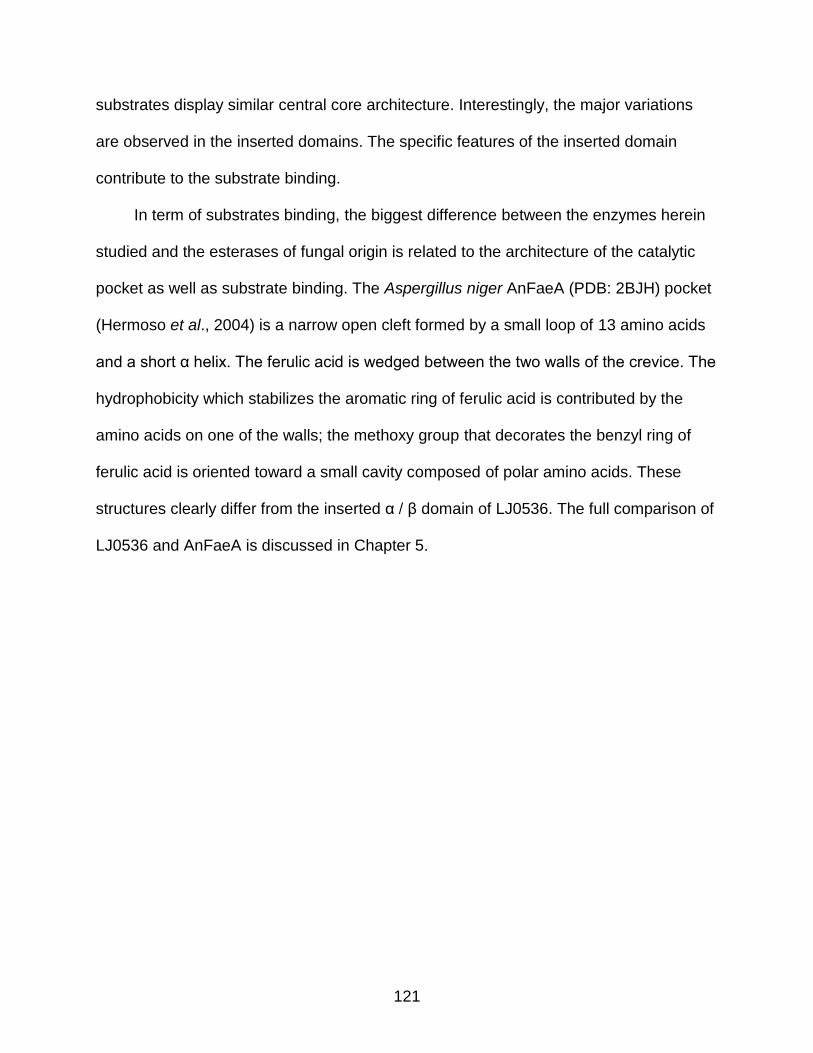
121
substrates display similar central core architecture. Interestingly, the major variations
are observed in the inserted domains. The specific features of the inserted domain
contribute to the substrate binding.
In term of substrates binding, the biggest difference between the enzymes herein
studied and the esterases of fungal origin is related to the architecture of the catalytic
pocket as well as substrate binding. The Aspergillus niger AnFaeA (PDB: 2BJH) pocket
(Hermoso et al., 2004) is a narrow open cleft formed by a small loop of 13 amino acids
and a short α helix. The ferulic acid is wedged between the two walls of the crevice. The
hydrophobicity which stabilizes the aromatic ring of ferulic acid is contributed by the
amino acids on one of the walls; the methoxy group that decorates the benzyl ring of
ferulic acid is oriented toward a small cavity composed of polar amino acids. These
structures clearly differ from the inserted α / β domain of LJ0536. The full comparison of
LJ0536 and AnFaeA is discussed in Chapter 5.
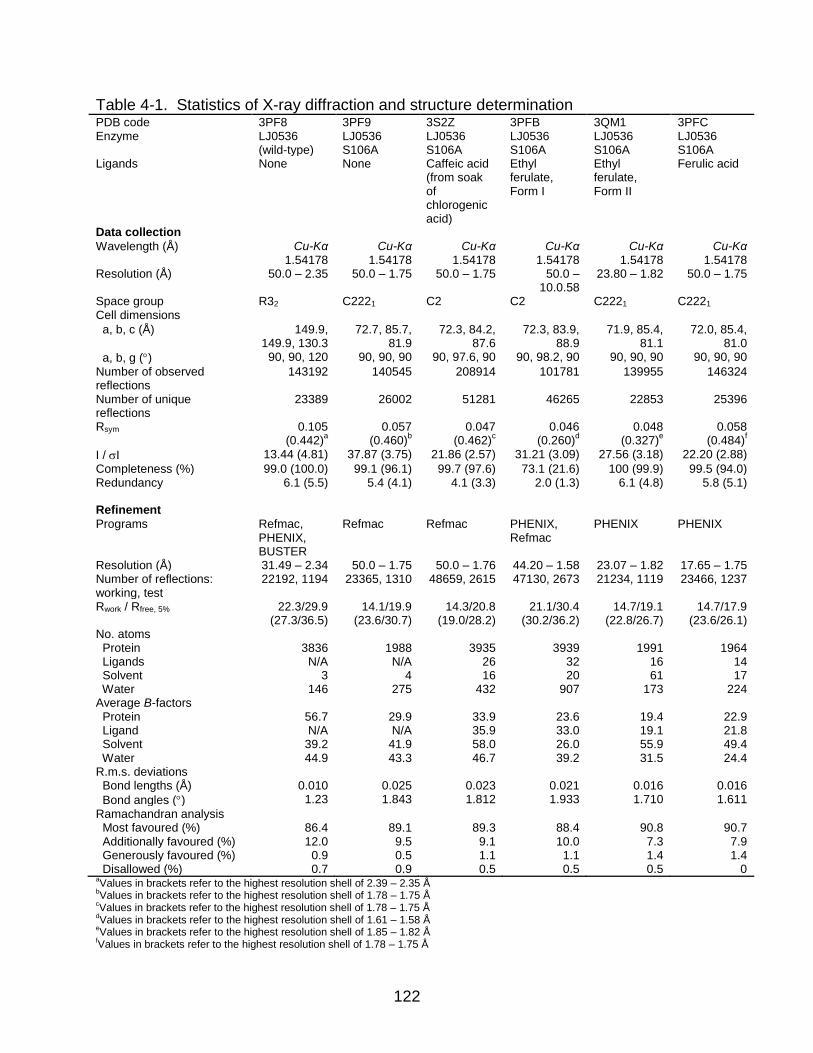
122
Table 4-1. Statistics of X-ray diffraction and structure determination PDB code 3PF8 3PF9 3S2Z 3PFB 3QM1 3PFC Enzyme LJ0536
(wild-type) LJ0536 S106A
LJ0536 S106A
LJ0536 S106A
LJ0536 S106A
LJ0536 S106A
Ligands None None Caffeic acid (from soak of chlorogenic acid)
Ethyl ferulate, Form I
Ethyl ferulate, Form II
Ferulic acid
Data collection Wavelength (Å) Cu-Kα
1.54178 Cu-Kα
1.54178 Cu-Kα
1.54178 Cu-Kα
1.54178 Cu-Kα
1.54178 Cu-Kα
1.54178 Resolution (Å) 50.0 – 2.35 50.0 – 1.75 50.0 – 1.75 50.0 –
10.0.58 23.80 – 1.82 50.0 – 1.75
Space group R32 C2221 C2 C2 C2221 C2221 Cell dimensions
a, b, c (Å) 149.9, 149.9, 130.3
72.7, 85.7, 81.9
72.3, 84.2, 87.6
72.3, 83.9, 88.9
71.9, 85.4, 81.1
72.0, 85.4, 81.0
a, b, g () 90, 90, 120 90, 90, 90 90, 97.6, 90 90, 98.2, 90 90, 90, 90 90, 90, 90
Number of observed reflections
143192 140545 208914 101781 139955 146324
Number of unique reflections
23389 26002 51281 46265 22853 25396
Rsym 0.105 (0.442)
a
0.057 (0.460)
b
0.047 (0.462)
c
0.046 (0.260)
d
0.048 (0.327)
e
0.058 (0.484)
f
I / I 13.44 (4.81) 37.87 (3.75) 21.86 (2.57) 31.21 (3.09) 27.56 (3.18) 22.20 (2.88)
Completeness (%) 99.0 (100.0) 99.1 (96.1) 99.7 (97.6) 73.1 (21.6) 100 (99.9) 99.5 (94.0) Redundancy 6.1 (5.5) 5.4 (4.1) 4.1 (3.3) 2.0 (1.3) 6.1 (4.8) 5.8 (5.1) Refinement Programs Refmac,
PHENIX, BUSTER
Refmac Refmac PHENIX, Refmac
PHENIX PHENIX
Resolution (Å) 31.49 – 2.34 50.0 – 1.75 50.0 – 1.76 44.20 – 1.58 23.07 – 1.82 17.65 – 1.75 Number of reflections: working, test
22192, 1194 23365, 1310 48659, 2615 47130, 2673 21234, 1119 23466, 1237
Rwork / Rfree, 5% 22.3/29.9 (27.3/36.5)
14.1/19.9 (23.6/30.7)
14.3/20.8 (19.0/28.2)
21.1/30.4 (30.2/36.2)
14.7/19.1 (22.8/26.7)
14.7/17.9 (23.6/26.1)
No. atoms Protein Ligands Solvent Water
3836
N/A 3
146
1988
N/A 4
275
3935
26 16
432
3939
32 20
907
1991
16 61
173
1964
14 17
224 Average B-factors Protein Ligand Solvent Water
56.7 N/A
39.2 44.9
29.9 N/A
41.9 43.3
33.9 35.9 58.0 46.7
23.6 33.0 26.0 39.2
19.4 19.1 55.9 31.5
22.9 21.8 49.4 24.4
R.m.s. deviations Bond lengths (Å)
Bond angles ()
0.010
1.23
0.025 1.843
0.023 1.812
0.021 1.933
0.016 1.710
0.016 1.611
Ramachandran analysis Most favoured (%) Additionally favoured (%) Generously favoured (%) Disallowed (%)
86.4 12.0
0.9 0.7
89.1
9.5 0.5 0.9
89.3
9.1 1.1 0.5
88.4 10.0
1.1 0.5
90.8
7.3 1.4 0.5
90.7
7.9 1.4
0 aValues in brackets refer to the highest resolution shell of 2.39 – 2.35 Å
bValues in brackets refer to the highest resolution shell of 1.78 – 1.75 Å
cValues in brackets refer to the highest resolution shell of 1.78 – 1.75 Å
dValues in brackets refer to the highest resolution shell of 1.61 – 1.58 Å
eValues in brackets refer to the highest resolution shell of 1.85 – 1.82 Å
fValues in brackets refer to the highest resolution shell of 1.78 – 1.75 Å

123
Table 4-2. Saturation kinetic parameters of LJ0536 variants
Mutants Vmax (μmol . mg-1 . min-1) Km (mM) kcat (s-1) Kcat / Km (M-1 . s-1)
H32A 0.09 ± 0.02 0.13 ± 0.08 0.04 3.18 E+02
D61A n.d. n.d. 0.00 n.d.
S68A 0.47 ± 0.04 0.08 ± 0.02 0.22 2.70 E+02
D83A n.d. n.d. n.d. n.d.
S106A n.d. n.d. n.d. n.d.
D121A 0.97 ± 0.06 0.20 ± 0.03 0.45 2.23 E+03
D138A 1.23 ± 0.08 0.22 ± 0.03 0.57 2.57 E+03
Q145A 2.05 ± 0.10 0.29 ± 0.04 0.94 3.25 E+03
T148A 2.15 ± 0.15 0.14 ± 0.02 0.99 7.06 E+03
N150A 0.62 ± 0.03 0.14 ± 0.01 0.28 2.03 E+03
D152A 4.27 ± 0.30 0.08 ± 0.01 1.96 2.45 E+04
D197A 0.00 ± 0.00 0.19 ± 0.06 0.00 0.00 E+00
H218A 3.64 ± 0.05 0.07 ± 0.06 1.67 2.39 E+04
H225A 0.65 ± 0.06 0.19 ± 0.04 0.30 1.57 E+03
ΔCAP 0.28 ± 0.03 0.65 ± 0.12 0.13 1.98 E+02
WT 3.34 ± 0.15 0.16 ± 0.02 1.53 9.59 E+03
n.d.: note detected.

124
Figure 4-1. General secondary structure of α / β fold. α-helices, β-strands, and catalytic triad location are represented by white barrel, gray arrows, and black dots, respectively. Solid lines represent random coils. Dashed lines indicate possible locations of inserted domains.1
1 Reprinted with permission from Nardini, M. & B. W. Dijkstra, (1999) [alpha]/[beta] Hydrolase fold enzymes: the family keeps growing. Curr Opin Struct Biol 9: 732-737.

125
Figure 4-2. Representation of the overall LJ0536 structure. (A) Ribbon diagram showing LJ0536 dimer. The residues connecting the monomers are shown in the interface of the two molecules. (B) Surface Illustration of the native protein. α-helices are colored red. β-sheets are colored yellow. Random coils are colored green.

126
Figure 4-3. Determination of the native molecular weight of the enzyme by gel filtration assays. The figure displays the molecular weight of the wild type protein LJ0536. The assay was carried out using a Superose 12 10 / 300 GL column in a Pharmacia FPLC System according to the protocol described in Materials and Methods. The native molecular weight determined was 46 ± 3.2 KDa.

127
Figure 4-4. Representation of the single chain LJ0536 structure. (A) Ribbon representation of LJ0536 monomer structure (stereo view). (B) Details of the left hand superhelical twist of the central β-sheet core. α-helices are colored red. β-sheets are colored yellow. Random coils are colored green.

128
Figure 4-5. Details of α / β inserted domain in the LJ0536 structure. (A) Surface representation and (B) ribbon representation of the LJ0536 (monomer). (C) Topology diagram of the monomer structure. The diagram was generated using PDBsum software (Laskowski, 2009). The box depicted with dotted lines indicates the inserted α / β domain. The inserted α / β domain is colored blue. α-helices are colored red. β-sheets are colored yellow. Random coils are colored green.

129
Figure 4-6. Surface and ribbon representation of LJ0536 catalytic site. (A) Surface representation of single chain LJ0536 with the binding cavity located in the middle. (B) Ribbon diagram of single chain LJ0536. The figure has the same magnification used in the panel A for direct comparison. (C) A close surface view of binding cavity of LJ0536. The boomerang-like shape of the binding cavity is indicated with dashed lines. (D) A close cartoon view of binding cavity of LJ0536. The figure has the same magnification used in the panel C for direct comparison. Catalytic triad is composed of S106, H225, and D197. Catalytic residues are colored orange. α-helices are colored red. β-sheets are colored yellow. Random coils are colored green.

130
Figure 4-7. Enzyme activity in presence of specific inhibitors. The activity of LJ0536 was inhibited with 1 mM PMSF. No effects were observed with 1 mM sodium iodoacetate or N-ethylmaleimide. The results confirmed that LJ0536 is a serine esterase. The assay was carried out using 4-nitrophenyl butyrate as enzyme substrate in buffer HEPES pH 7.8, 25oC.
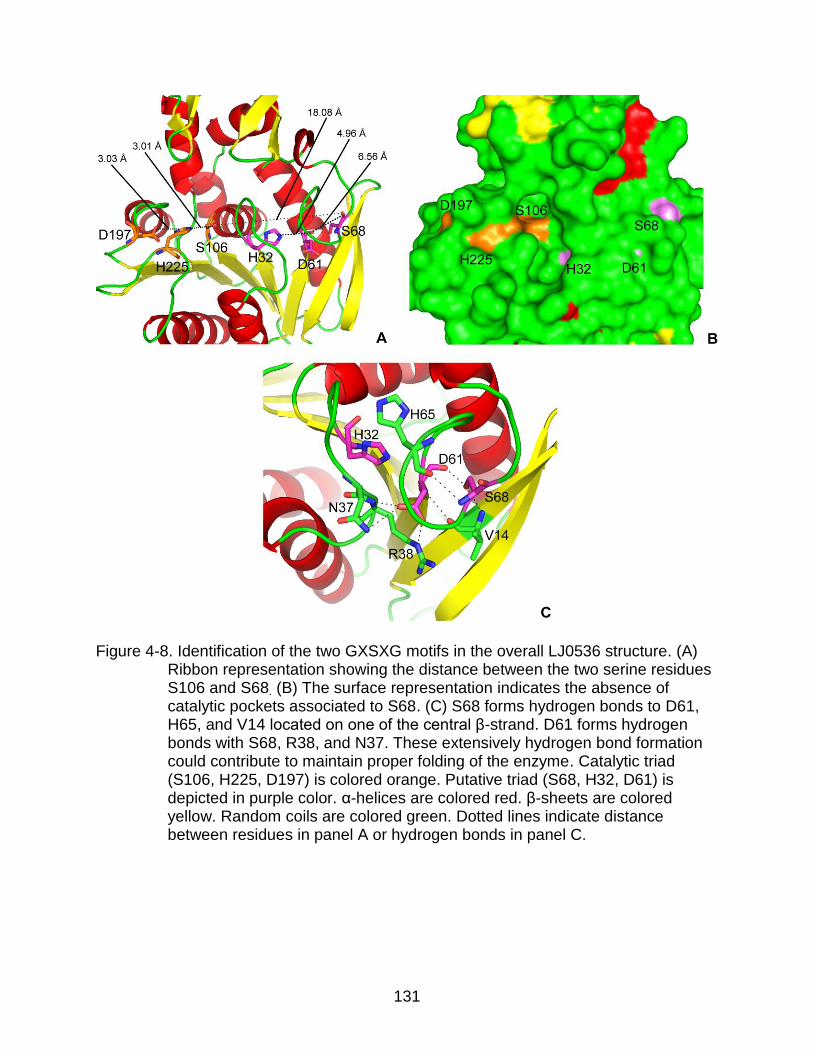
131
Figure 4-8. Identification of the two GXSXG motifs in the overall LJ0536 structure. (A) Ribbon representation showing the distance between the two serine residues S106 and S68. (B) The surface representation indicates the absence of catalytic pockets associated to S68. (C) S68 forms hydrogen bonds to D61, H65, and V14 located on one of the central β-strand. D61 forms hydrogen bonds with S68, R38, and N37. These extensively hydrogen bond formation could contribute to maintain proper folding of the enzyme. Catalytic triad (S106, H225, D197) is colored orange. Putative triad (S68, H32, D61) is depicted in purple color. α-helices are colored red. β-sheets are colored yellow. Random coils are colored green. Dotted lines indicate distance between residues in panel A or hydrogen bonds in panel C.

132
Figure 4-9. SDS-PAGE. The pictures show the purified LJ0536 wild type together with the LJ0536 mutants obtained from site-directed mutagenesis. (A) Lane 1: EZrun molecular weight marker. Lane 2: wild type LJ0536. Lane 3: H32A. Lane 4: D61A. Lane 5: S68A. Lane 6: D83A. Lane 7: S106A. Lane 8: D121A. (B) Lane 1: EZrun molecular weight marker. Lane 2: D138A. Lane 3: Q145A. Lane 4: T148A. Lane 5: N150A. Lane 6: D152A. Lane 7: D197A. Lane 8: H218A. Lane 9: H225A. C) Lane 1: EZrun molecular weight marker. Lane 2: mutant ΔCAP. The inserted α / β domain was deleted from 147 position to 173 position. Lane 3: purified human VACVase.
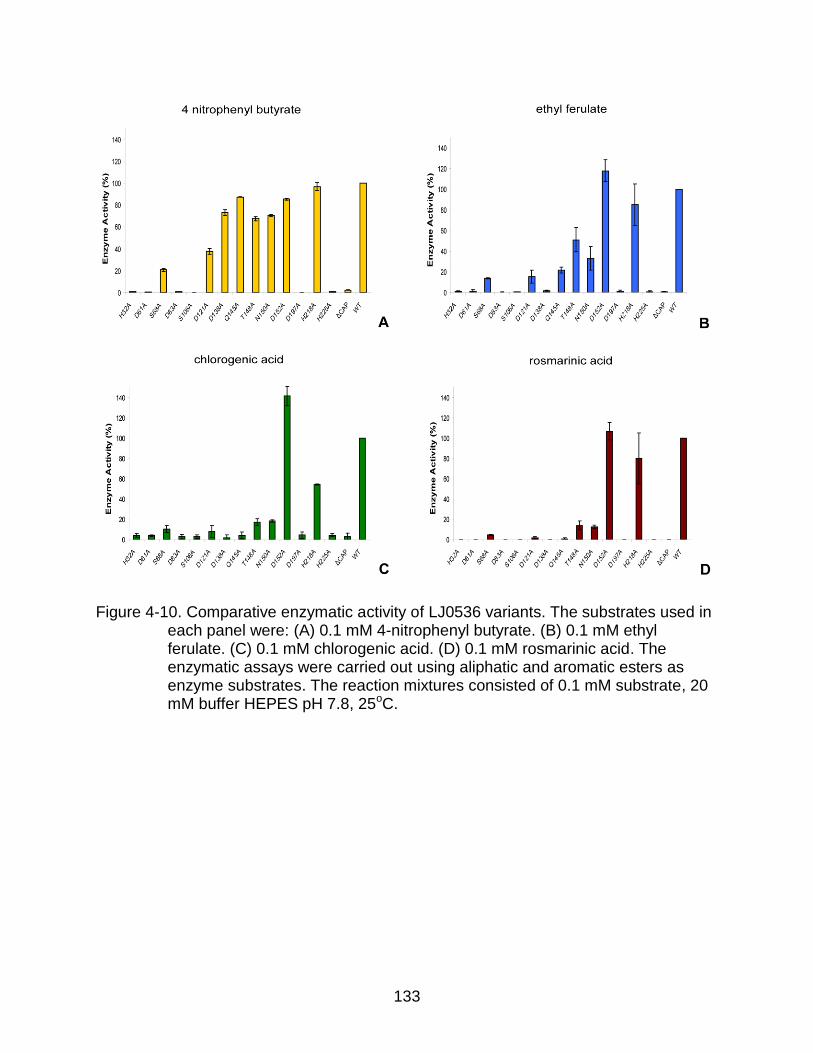
133
Figure 4-10. Comparative enzymatic activity of LJ0536 variants. The substrates used in each panel were: (A) 0.1 mM 4-nitrophenyl butyrate. (B) 0.1 mM ethyl ferulate. (C) 0.1 mM chlorogenic acid. (D) 0.1 mM rosmarinic acid. The enzymatic assays were carried out using aliphatic and aromatic esters as enzyme substrates. The reaction mixtures consisted of 0.1 mM substrate, 20 mM buffer HEPES pH 7.8, 25oC.

134
Figure 4-11. Circular dichroism spectra of LJ0536 and mutant S68A. The spectrum displayed by the enzyme changed when S68 was mutated to alanine. The assay supports the important role of S68 to maintain the structure of the central core of the protein. The mutation should have an important impact on the overall folding since the enzyme activity was severely impaired. Molar ellipticity was calculated using Equation 2-4.

135
Figure 4-12. Surface representation of apo and co-crystallized structures of LJ0536 mutant S106A. (A) Apo S106A. (B) Mutant S106A co-crystallized with ethyl ferulate. (C) Mutant S106A co-crystallized with ferulic acid. (D) Mutant S106A co-crystallized with chlorogenic acid. Only caffeic acid is shown in the structure since the quinic acid adopted several positions and was not possible to create the model. The random positions adopted by quinic acid indicated minimal or no interactions with the protein surface. α-helices are colored red. β-sheets are colored yellow. Random coils are colored green. Residues involve in aromatic ring binding are colored blue. A106 is colored orange. Ligands are displayed in stick representation.

136
Figure 4-13. Enzyme-substrate interactions within binding cavity of LJ0536. D138 and Y169 form hydrogen bonds with the hydroxyl group of aromatic ring of phytophenols used. These bonds hold the substrates in the correct orientation for catalysis. (A) Apo structure of S106A. (B) Mutant S106A co-crystallized with ethyl ferulate (EF). (C) Mutant S106A co-crystallized with ferulic acid (FA). (D) Mutant S106A co-crystallized with chlorogenic acid. Only caffeic acid (CA) is shown in the diagram. The color of each structure is uniformed in one color for easy interpretation. Red spheres represent water molecules. Dash lines represent polar interactions.

137
Figure 4-14. Structural superimposition of the mutant S106A co-crystallized with ethyl ferulate or ferulic acid. The mutant S106A co-crystallized with ethyl ferulate is colored yellow. The same protein co-crystallized with ferulic acid is colored blue. (A) The 4-hydroxyl group on the phenolic ring of ferulic acid and ethyl ferulate are hydrogen bonded with D138. These bondings hold the phenolic ring in the binding cavity. The additional polar interactions of 4-hydroxyl and 3-methoxy groups with water molecule further stabilize the binding of substrate. The residue Q145 coordinates a water molecule adjacent to the ester bond of substrate. This water molecule is a good candidate for activating S106 during hydrolysis. The oxyanion hole is formed by F34 and Q107. The structures are shown in stereo view to help the 3-dimensional visualization of the protein backbone. (B) Cutaway view of the mutant S106A surface representation. The image shows the phenolic ring, the binding cavity, and the leaving groove in details. Red spheres represent water molecules. Dash lines represent polar interactions.
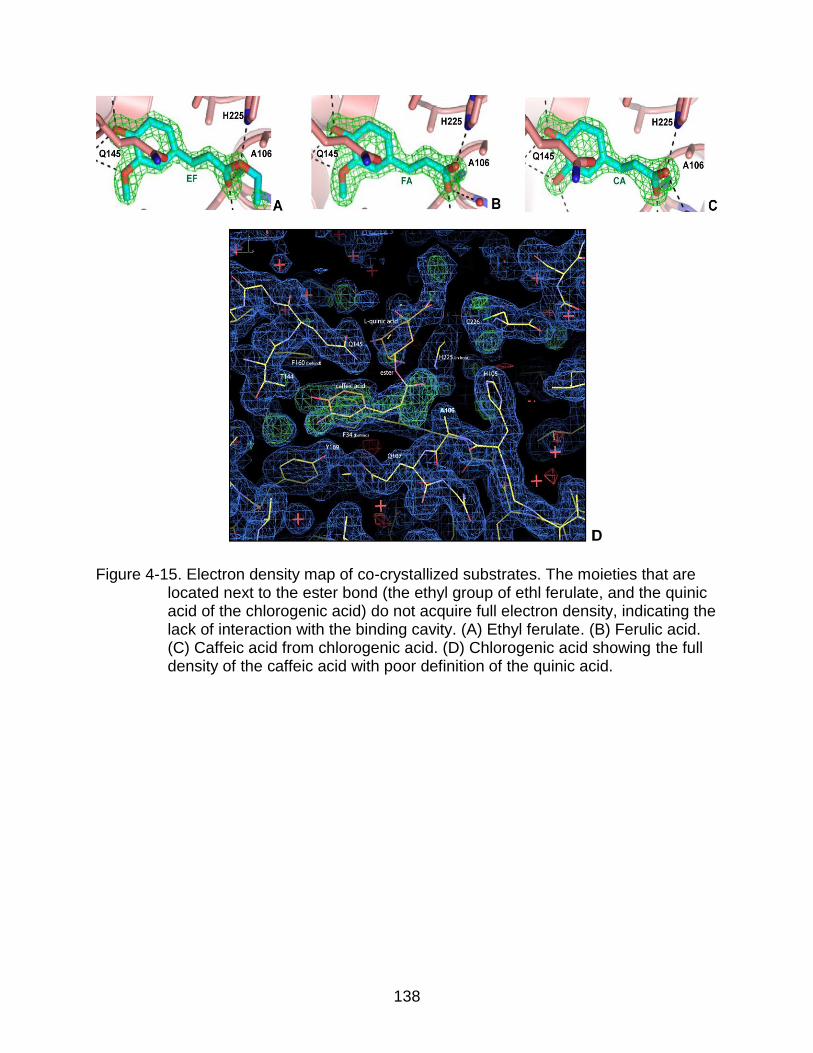
138
Figure 4-15. Electron density map of co-crystallized substrates. The moieties that are located next to the ester bond (the ethyl group of ethl ferulate, and the quinic acid of the chlorogenic acid) do not acquire full electron density, indicating the lack of interaction with the binding cavity. (A) Ethyl ferulate. (B) Ferulic acid. (C) Caffeic acid from chlorogenic acid. (D) Chlorogenic acid showing the full density of the caffeic acid with poor definition of the quinic acid.
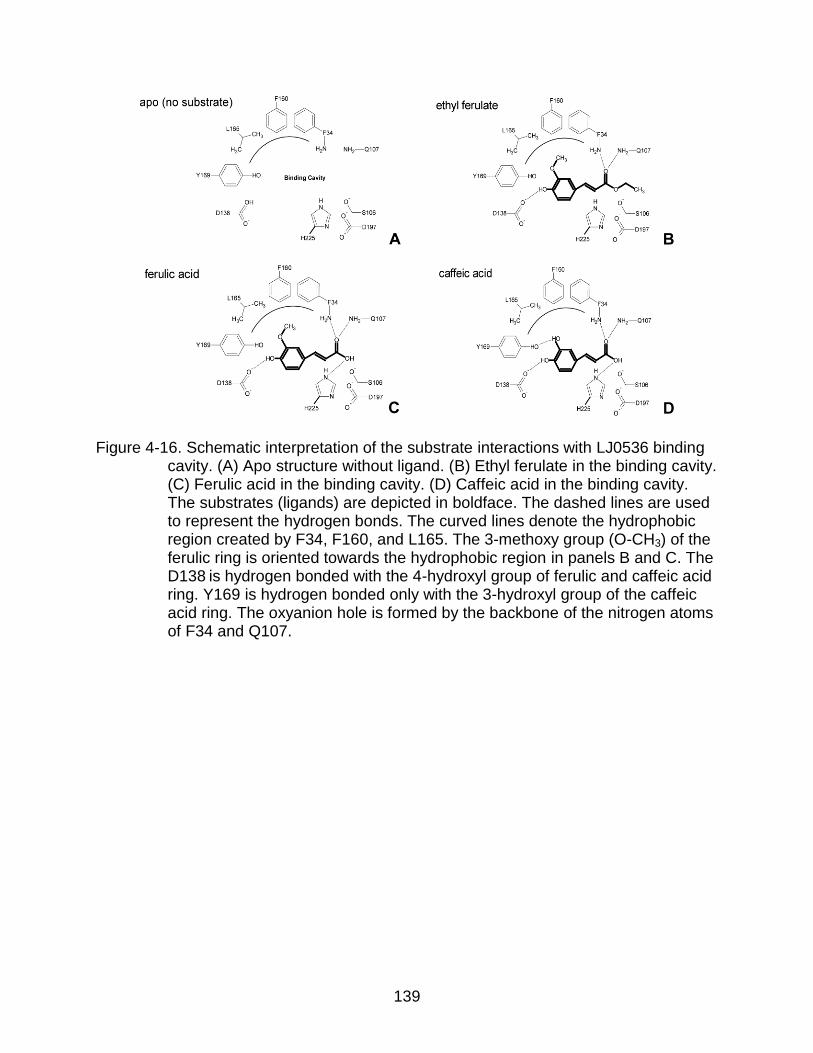
139
Figure 4-16. Schematic interpretation of the substrate interactions with LJ0536 binding cavity. (A) Apo structure without ligand. (B) Ethyl ferulate in the binding cavity. (C) Ferulic acid in the binding cavity. (D) Caffeic acid in the binding cavity. The substrates (ligands) are depicted in boldface. The dashed lines are used to represent the hydrogen bonds. The curved lines denote the hydrophobic region created by F34, F160, and L165. The 3-methoxy group (O-CH3) of the ferulic ring is oriented towards the hydrophobic region in panels B and C. The D138 is hydrogen bonded with the 4-hydroxyl group of ferulic and caffeic acid ring. Y169 is hydrogen bonded only with the 3-hydroxyl group of the caffeic acid ring. The oxyanion hole is formed by the backbone of the nitrogen atoms of F34 and Q107.

140
Figure 4-17. Structural comparison of LJ0536 and proteins with similar overall folding.
Several enzymes involved in the catalysis of a variety of substrates display similar central core architecture. Interestingly, the major variations are observed in the inserted domains. In the following figures, LJ0536 (colored green) is superimposed with several structures retrieved from the database. (A) Est1E, (2WTM); (B) VACVase, (2OCG); (C) bromoperoxidase A1, (1A8Q); (D) aryl esterase, (3HI4); (E) human mono-glyceride lipase, (3JW8). The individual inserted domains of each protein are depicted in deeper colors. The PDB code for each protein is indicated between parentheses.
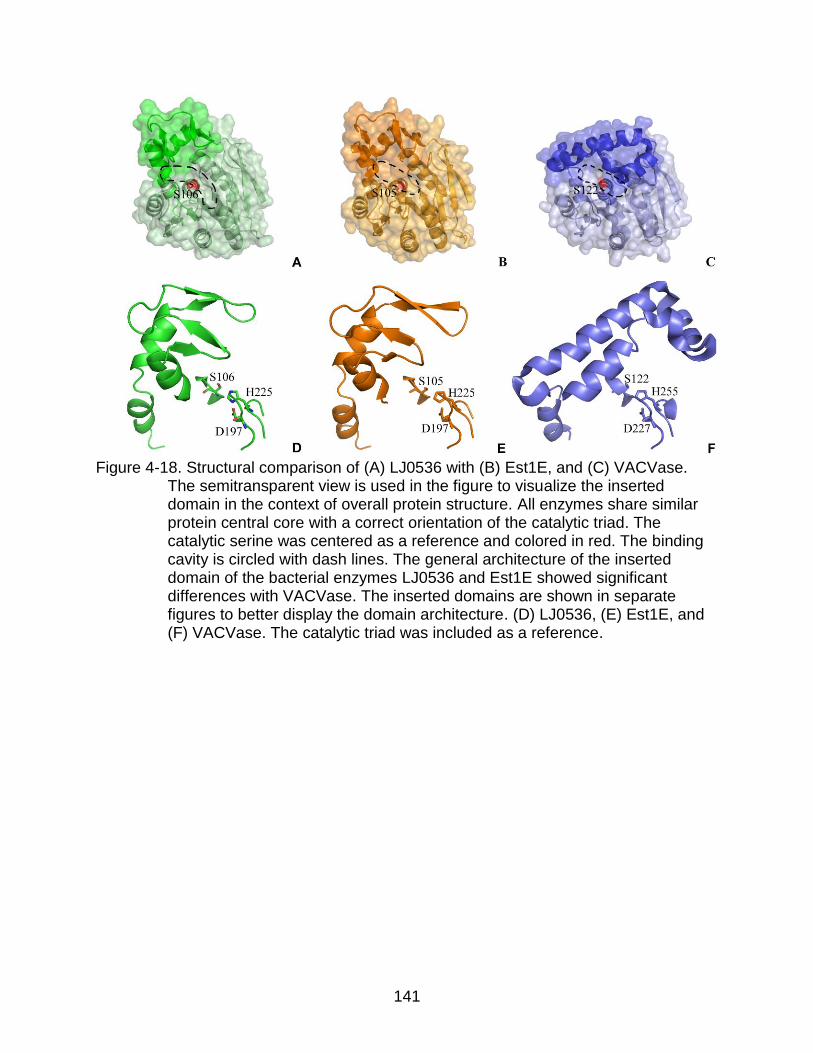
141
Figure 4-18. Structural comparison of (A) LJ0536 with (B) Est1E, and (C) VACVase.
The semitransparent view is used in the figure to visualize the inserted domain in the context of overall protein structure. All enzymes share similar protein central core with a correct orientation of the catalytic triad. The catalytic serine was centered as a reference and colored in red. The binding cavity is circled with dash lines. The general architecture of the inserted domain of the bacterial enzymes LJ0536 and Est1E showed significant differences with VACVase. The inserted domains are shown in separate figures to better display the domain architecture. (D) LJ0536, (E) Est1E, and (F) VACVase. The catalytic triad was included as a reference.
142
CHAPTER 5 A NEW FACTOR CONTRIBUTES TO THE CLASSIFICATION OF FAES
Background
A recent review proposes a novel descriptor-based computational scheme for
classification of FAEs (Udatha et al., 2011). The classification is based on a
combination of several features such as enzymatic activity, sequence similarity, location
of nucleophilic elbow, and the orientation of the catalytic triad. A weakness within the
scheme is the absence of critical information relevant to bacterial FAEs. The
classification scheme proposed relies largely on the characteristics of biochemically
characterized proteins from fungal origin.
The recently proposed classification scheme is composed of twelve families.
Neither LJ0536 or any of its homologs were included in any groups of the review
(Udatha et al., 2011). Consequently, the sequences of LJ0536, LJ1228, and Est1E were
analyzed by the sequence-derived descriptor. The results suggested that the important
structural features, such as the architecture of the catalytic pocket, should be used to
validate the classification system.
Result and Discussion
Structural Differences of Bacterial and Fungal FAEs
The structures of only two FAEs (AnFaeA of A. niger and Est1E of B.
proteoclasticus) are available in the public database Protein Data Bank (Berman et al.,
2000). The structure of LJ0536 was previously compared with bacterial FAE Est1E
(Goldstone et al., 2010) in Chapter 4. Both enzymes showed high structural similarity. In
order to investigate the conservation of the structures, bacterial FAEs and fungal FAEs
were also compared.

143
The architecture of the catalytic pocket and the substrate binding mechanism are
the major differences between LJ0536 and fungal FAE AnFaeA. The binding cavity of
AnFaeA (pdb: 2BJH) (Hermoso et al., 2004) is a narrow, open cleft formed by a small lid
domain composed of 23 amino acids (T68 to Q90). This lid domain contains a short α-
helix, a short β-strand, and random coils (Figure 5-1A and B). The structure of AnFaeA
lid domain is clearly different from the inserted α / β domain of LJ0536, which is
composed of 54 amino acids (P131 to Q184) (Figure 5-1C and D). The binding cavity of
AnFaeA is more hydrophobic than that of LJ0536. However, the stabilization of the
substrate is similar to that of LJ0536. In both cases, the ferulic acid is stabilized in the
binding cavity by hydrogen bonds. A hydrogen bond is formed between the hydroxyl
group of the ferulic ring and the Y80 located on the lid domain of AnFaeA. In contrast,
there is no amino acid residue similar to the Q145 of the enzyme LJ0536, which can
coordinate a molecule of water on top of the catalytic serine and create a bridge-like
structure on top of the binding cavity. The comparison of LJ0536 and AnFaeA is
summarized in Table 5-1.
To confirm that the folding of fungal FAEs is different from LJ0536, the structures
of other fungal FAEs were predicted. All predictions were done with SWISS MODEL
(Arnold et al., 2006). SWISS MODEL is a structure homology-modeling server, which
allows users to predict the structure of a protein with a simple input of the peptide
sequence. The modeling is generated based on existing protein structures. The quality
of the modeling is estimated by the E-value, QMEAN Z-Score, and QMEANscore4
(Benkert et al., 2011). The E-value is a parameter that describes the number of hits that
you expect to find a protein by chance when searching a database. The lower the E-

144
value, the more structurally significant the hit is. The Q-MEAN Z-Score measures the
absolute quality of a model. A strongly negative value indicates a model of low quality.
The QMEANscore4 represents the probability that the input protein matches the
predicted model. The value ranges between 0 and 1. The probability of matching is
higher as the value gets closer to 1. The structures of the three biochemically
characterized fungal FAEs used to design the classification scheme were predicted.
NCR, a FAE from Neurospora crassa, was predicted to be similar to
polyhydroxybutyrate depolymerase from Penicillium funiculosum (PDB: 2D81). PFU, a
FAE from Penicillium funiculosum, was predicted to be similar to cellobiohydrolase from
Trichoderma reesei (PDB: 1CBH). PEQ, a FAE from Piromyces equi, was predicted to
match with a component of P. equi cellulosome (PDB: 2J4M). The results are
summarized in Table 5-2.
The second round of prediction was done using LJ0536 as a template structure.
The results are summarized in Table 5-3. Besides the improvement of E-value, both
QMEAN Z-Score and QMEANscore4 had either no significant change or decreased
dramatically. The results suggested that the structure of fungal FAEs does not have
similarities with LJ0536.
Classification of LJ0536 and LJ1228
The Udatha classification scheme describes twelve FAE families. Since both
LJ0536 and LJ1228 were not previously classified using this scheme, the sequences of
LJ0536 and LJ1228 together with the recently crystallized B. proteoclasticus FAE Est1E
were submitted to the descriptor for analysis. All three proteins were clustered in the
subfamily 1B of Feruloyl Esterases Family 1 together with six hypothetical or putative
bacterial proteins listed in Table 5-4 (Udatha et al., 2011). The descriptor was able to
145
identify the catalytic triad residues precisely. In order to investigate whether the
substrate binding mechanism is conserved within the subfamily 1B, the structure of
each protein was predicted using SWISS-MODEL (Arnold et al., 2006). The results are
summarized in Table 5-4. Only LBI, a putative feruloyl esterase from Leptospira biflexa
serovar Patoc strain, was predicted to be similar to Est1E (PDB: 2WTM). The
hypothetical protein SLI was predicted to be similar to an esterase from Pseudomonas
fluorescens (PDB: 3IA2). The remaining four proteins were predicted to be similar to
FAE domain of cellulosomal xylanase Z (FAE-XynZ) from Clostridium thermocellum
(PDB: 1JJF). The prediction done using LJ0536 chain B as template did not improve the
quality of the models (Table 5-5). The quality of several models was even impaired.
These predictions indicated that these proteins are not similar to LJ0536.
The protein structures within subfamily 1B are represented by two templates:
LJ0536 and FAE-XynZ. The major differences between these two enzymes are the
features of the substrate binding mechanism. The substrate binding mechanism of
LJ0536 was described in Chapter 4. Specific amino acids of the inserted α / β domain
interact directly with the phenolic ring of substrates. The interaction orients the aromatic
acyl moiety of the substrate into the deepest part of the hydrophobic binding cavity. The
leaving moiety remains exposed to the solvent (Figure 5-1C and D). In contrast, the
FAE-XynZ displays a different substrate binding mechanism, although the overall
folding of the enzymes and orientation of catalytic triad are highly similar (Figure 5-2
and 5-3). The inserted α / β fold domain is not present in FAE-XynZ to facilitate the
binding of aromatic acyl moiety in the binding cavity. The structure suggested that the
phenolic ring of the substrate does not interact with the protein. Only the water

146
molecules interact with the hydroxy and methoxy groups of the aromatic ring. The
substrate is held in position by direct interactions with the catalytic residues (S172,
H260, D230) and the oxanion hole (I90, M173). The substrate enzyme interaction is
clearly demonstrated in the crystal structure of catalytic serine-deficient S172A FAE-
XynZ mutant in complex with feruloyl arabinoxylan (PDB: 1JT2). Due to the absence of
the inserted α / β domain in FAE-XynZ, the aromatic ring of ferulic acid is exposed to
the solvent area in the binding cavity. Consequently, the subfamily 1B could be divided
into two subgroups according to the presence or absence of the α / β fold inserted
domain.
Structural Prediction of LJ0536 and LJ1228 Homologs
I hypothesized that the inserted α / β domain is conserved among LJ0536 and
LJ1228 homologs and paralogs. To test this hypothesis, the structures of LJ0536 and
LJ1228 homologs and paralogs, previously identified in Chapter 3, were predicted using
the SWISS MODEL modeling tool (Arnold et al., 2006). The results found using an
automatic template search are summarized in Table 5-6. All predictions provided good
quality models except for the modeling of EVE, a hypothetical protein from Eubacterium
ventriosum ATCC 27560. EVE has an E-Value of 1.40E-28, a QMEANscore4 of 0.477,
and a QMEAN Z-Score of -4.276. BFI-1, a cinnamoyl ester hydrolase from Butyrivibrio
fibrisolvens E14, has the best quality of model with an E-Value of 1.61E-91, a
QMEANscore4 of 0.82, and a QMEAN Z-Score of 0.425. Among all 11 proteins, 9 were
predicted to have similar folding to Est1E (Goldstone et al., 2010). The predictions were
validated by including the sequences of LJ0536 and LJ1228 in the analysis.
The homologs, LBA-1 and BFI-2, do not have a similar Est1E folding. LBA-1 is
annotated as α / β superfamily hydrolase in L. acidophilus NCFM. It was predicted to be

147
similar to lipase in Burkholderia cepacia (PDB: 1YS1). BFI-2 is annotated as cinnamoyl
ester hydrolase in B. fibrisolvens E14. It was predicted to be similar to acetyl xylan
esterase in Bacillus pumilus (PDB: 3FVR).
In order to prove that the folding of LJ0536 is conserved in LBA-1 and BFI-2, a
second prediction was preformed using Est1E or LJ0536 as the template structure
(Table 5-7). When Est1E was used as the template, the E-value of LBA-1 improved
from 2.40E-08 to 2.70E-32. QMEAN Z-Score and QMEANscre4 decreased from -2.414
to -3.495 and from 0.556 to 0.527, respectively. When the prediction was done using
LJ0536 as a template, the E-value improved to 1.2E-32, the QMEAN Z-Score
decreased to -2.533, and the QMEANscre4 improved to 0.598. A similar scenario was
observed when the protein BFI-2 was analyzed (the parameters obtained are
summarized in Table 5-7). The results indicated that the folding of LJ0536 is conserved
in LBA-1 and BFI-2.
The homologs and paralogs of LJ0536 and LJ1228 herein analyzed display
similar structures. Thus, these proteins should be grouped together into the same
subfamily under FEF1.
Among the homolog proteins, LRE (LREU1684 from L. reuteri) was previously
cloned and purified in Chapter 3. Two other homologs, LBA-1 (LBA1350 from L.
acidophilus) and LGA (LGAS1762 from L. gasseri), were also cloned and purified.
These three enzymes showed FAE activity on MRS-EF screening plates, indicating that
the activity and the structures are, indeed, conserved.
A PSI-BLAST search was used to detect distant evolutionary relationships of
LJ0536. The sequences of five bacterial proteins annotated as cinnamoyl ester

148
hydrolase or feruloyl esterase were retrieved from the NCBI database. The protein
structures were predicted using the same software (Arnold et al., 2006). The results are
summarized in Table 5-8. Three out of five proteins were predicted to have similar
folding using Est1E as a template (PDB: 2WTM). RAL is annotated as feruloyl esterase
family protein from Ruminococcus albus 8 and predicted to be similar to B. cepacia
lipase (PDB: 1YS1). When LJ0536 was used as a template to predict RAL structure, the
E-value improved from 9.50E-13 to 2.40E-35, the QMEAN Z-Score increased from -
4.437 to -3.427, and the QMEANscore4 improved from 0.341 to 0.536.
POR is annoated as feruloyl esterase from Prevotella oris F0302. It was
predicted to be similar to a thiol–disulfide oxidoreductase, ResA, from Bacillus subtilis
(PDB: 3C71). When LJ0536 was used as a template structure to predict POR, the E-
value improved to from 1.8E-27 to 7.9E-38 (Table 5-9). However, The QMEAN Z-Score
and QMEANscre4 decreased from -0.995 to -2.688 and from 0.704 to 0.587,
respectively. Even though the values of QMEAN Z-Score and QMEANscore4 obtained
using LJ0536 as a template are lower than the values obtained from automatic template
search, the result sill indicated POR could have similar folding.
Altogether, the predicted folding of the putative bacterial FAEs identified using
PSI-BLAST displayed similar folding to LJ0536.
Summary
Structural comparison of LJ0536 and AnfaeA indicates that the substrate binding
mechanism of fungal enzymes is different from that of bacterial FAEs analyzed. The
overall structure of the binding cavity is different and can be used to recognize the origin
of the enzymes.

149
Even though both LJ0536 and FAE-XynZ are able to hydrolyze similar
substrates, FAE-XynZ does not have an inserted domain. These specific protein
structures are easily recognized and could be used to improve the current classification
scheme.
The results herein analyzed allow us to extract conclusions limited to the
subfamily 1B. There is not enough evidence in the database to expand the conclusion
to other families within the classification scheme. The analysis of more structures is
required to withdraw further conclusions.
Consequently, based on the mechanism of substrate binding and the architecture
of the binding cavity, bacterial feruloyl estereases such as LJ0536, LJ1228, Est1E and
their homologs should be clustered together as a new subfamily in the FEF1 group.

150
Table 5-1. Comparison of LJ0536 and AnFaeA
LJ0536 AnFaeA
Size
249 amino acids
281 amino acids
Binding Cavity
hydrophobic, less open to solvent Less hydrophobic, open to solvent
Catalytic Triad
S106, H225, D197 S133, H247, D194
Oxyanion Hole
F34, Q107 T68, L134
Binding Mechanism
D138: hydrogen bonds with hydroxyl group on aromatic ring. Q145: orients water molecule towards the binding cavity and creates a bridge-like structure to stabilize substrate binding
Y80: hydrogen bonds with hydroxyl group on aromatic ring
Lid / Inserted domain
54 amino acids, three α-helices and two hairpins
23 amino acids, one α-helix and one β-strand
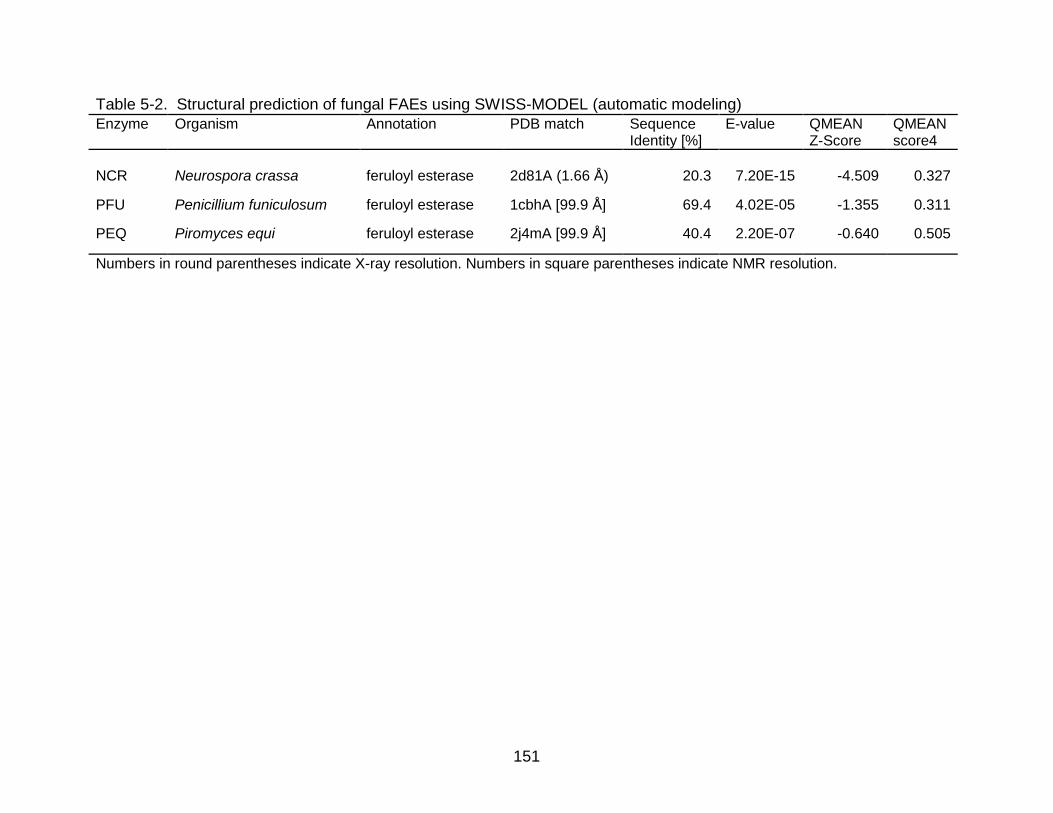
151
Table 5-2. Structural prediction of fungal FAEs using SWISS-MODEL (automatic modeling)
Enzyme Organism Annotation PDB match Sequence Identity [%]
E-value QMEAN Z-Score
QMEAN score4
NCR
Neurospora crassa
feruloyl esterase
2d81A (1.66 Å)
20.3
7.20E-15
-4.509
0.327
PFU Penicillium funiculosum feruloyl esterase 1cbhA [99.9 Å] 69.4 4.02E-05 -1.355 0.311
PEQ Piromyces equi feruloyl esterase 2j4mA [99.9 Å] 40.4 2.20E-07 -0.640 0.505
Numbers in round parentheses indicate X-ray resolution. Numbers in square parentheses indicate NMR resolution.

152
Table 5-3. Structural prediction of fungal FAEs using SWISS-MODEL (manual modeling)
Enzymes Sequence Identity [%] E-value QMEAN Z-Score QMEANscore4
NCR
9.1
5.00E-20
-5.765
0.371
PFU 10.3 2.80E-17 -6.620 0.299
PEQ 13.2 1.80E-12 -4.819 0.384
Template used: LJ0536 chain B

153
Table 5-4. Structural prediction of putative FAEs in subfamily 1B using SWISS-MODEL (automatic modeling)
Enzyme Organism Annotation PDB match Sequence Identity [%]
E-value QMEAN Z-Score
QMEAN score4
LBI
Leptospira biflexa serovar Patoc strain
putative feruloyl esterase
2wtmC (1.60 Å)
22.0
1.40E-18
-3.943
0.437
PAE Paenibacillus sp. W-61
putative feruloyl esterase 1jjfA (1.75 Å) 44.6 0.01E-01 -1.846 0.649
CCE Clostridium cellulovorans 743B
putative esterase 1jjfA (1.75 Å) 40.3 3.10E-43 -3.196 0.552
GEO Geobacillus sp. Y412MC10
putative esterase 1jjfA (1.75 Å) 44.1 1.40E-45 -2.213 0.622
SLI Spirosoma linguale DSM 74
hypothetical protein SlinDRAFT_02770
3ia2A (1.65 Å) 22.0 6.80E-09 -4.790 0.304
ALG Algoriphagus sp. PR1
Possible xylan degradation enzyme
1jjfA (1.75 Å) 49.0 0.01E-01 -1.502 0.674
Numbers in round parentheses indicate X-ray resolution.
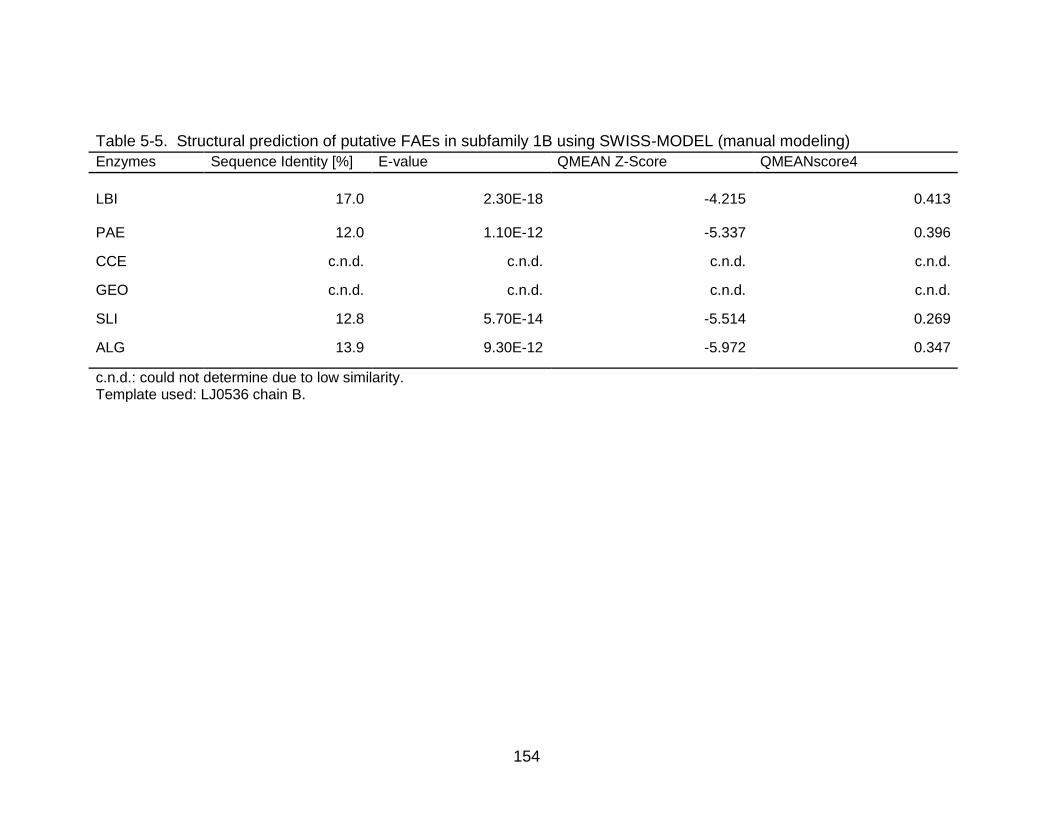
154
Table 5-5. Structural prediction of putative FAEs in subfamily 1B using SWISS-MODEL (manual modeling)
Enzymes Sequence Identity [%] E-value QMEAN Z-Score QMEANscore4
LBI
17.0
2.30E-18
-4.215
0.413
PAE 12.0 1.10E-12 -5.337 0.396
CCE c.n.d. c.n.d. c.n.d. c.n.d.
GEO c.n.d. c.n.d. c.n.d. c.n.d.
SLI 12.8 5.70E-14 -5.514 0.269
ALG 13.9 9.30E-12 -5.972 0.347
c.n.d.: could not determine due to low similarity. Template used: LJ0536 chain B.

155
Table 5-6. Structural prediction of LJ0536, LJ1228, and homologs / paralogs using SWISS-MODEL (automatic modeling)
Protein Organism Annotation PDB match Sequence Identity [%]
E-value QMEAN Z-Score
QMEAN score4
LJO-1 L. johnsonii N6.2 cinnamoyl esterase 2wtmC (1.60 Å) 30.9 6.00E-42 -1.223 0.696
LJO-2 L. johnsonii N6.2 cinnamoyl esterase 2wtmC (1.60 Å) 31.3 4.70E-43 -1.844 0.651
LRE L. reuteri DSM 20016 α / β fold family hydrolase-like protein
2wtmC (1.60 Å) 32.9 1.20E-43 -1.599 0.669
LBA-1 L. acidophilus NCFM α / β superfamily hydrolase 1ys1X (1.10 Å) 24.6 2.40E-08 -2.414 0.556
LBA-2 L. acidophilus NCFM α / β superfamily hydrolase 2wtmC (1.60 Å) 29.7 4.20E-41 -1.490 0.677
EVE Eubacterium ventriosum ATCC 27560
hypothetical protein 2wtmC (1.60 Å) 25.6 1.40E-28 -4.276 0.477
TDE Treponema denticola cinnamoyl ester hydrolase 2wtmC (1.60 Å) 24.4 8.50E-38 -1.362 0.686
BFI-1 Butyrivibrio fibrisolvens E14
cinnamoyl ester hydrolase 2wtnA (2.10 Å) 64.6 1.64E-91 0.425 0.820
BFI-2 Butyrivibrio fibrisolvens E14
cinnamoyl ester hydrolase 3fvrC (2.50 Å) 20.1 1.70E-32 -3.380 0.539
LPL L. plantarum WCSF1 putative esterase 2wtmC (1.60 Å) 29.7 3.60E-42 -0.949 0.717
LGA L. gasseri ATCC 33323
α / β fold family hydrolase 2wtmC (1.60 Å) 30.9 1.20E-40 -1.046 0.710
LHV L. helveticus DPC 4571
α / β fold family hydrolase 2wtmC (1.60 Å) 29.7 4.80E-42 -1.558 0.672
LAF L. fermentum IFO 3956
hypothetical protein 2wtmC (1.60 Å) 32.0 3.60E-42 -1.819 0.653
Numbers in round parentheses indicate X-ray resolution.

156
Table 5-7. Structural prediction of LBA-1 and BFI-2 using SWISS-MODEL (manual modeling)
Template used: 2wtmA Template used: LJ0536 Chain B
Protein Sequence Identity [%]
E-value QMEAN Z-Score
QMEAN score4
Sequence Identity [%]
E-value QMEAN Z-Score
QMEAN score4
LBA-1
23.1
2.70E-32
-3.495
0.527
25.9
1.20E-32
-2.533
0.598
BFI-2 27.6 3.10E-37 -2.151 0.627 24.6 2.70E-38 -1.959 0.643

157
Table 5-8. Structural prediction of bacterial FAEs using SWISS-MODEL (automatic modeling)
Enzyme Organism Annotation PDB match Sequence Identity [%]
E-value QMEAN Z-Score
QMEAN score4
TDE-2
Treponema denticola F0402
cinnamoyl ester hydrolase
2wtmC (1.60 Å)
24.8
1.50E-38
-1.992
0.639
SSA Streptococcus sanguinis VMC66
cinnamoyl ester hydrolase
2wtmC (1.60 Å) 25.7 2.50E-35 -1.935 0.644
RAL Ruminococcus albus 8
feruloyl esterase family protein
1ys1X (1.10 Å) 17.2 9.50E-13 -4.437 0.341
CRU Cellulosilyticum ruminicola
feruloyl esterase III 2wtmC (1.60 Å) 27.4 3.60E-34 -2.870 0.575
POR Prevotella oris F0302
feruloyl esterase 3c71A (1.90 Å) 29.7 1.80E-27 -0.995 0.704
Numbers in round parentheses indicate X-ray resolution.

158
Table 5-9. Structural prediction of bacterial FAEs using SWISS-MODEL (manual modeling)
Enzymes Sequence Identity [%] E-value QMEAN Z-Score QMEANscore4
RAL
24.0
2.4E-35
-3.427
0.536
POR
41.3 7.9E-38 -2.688 0.587
Template used: LJ0536 chain B

159
Figure 5-1. Structural comparison of LJ0536 and AnFaeA. (A) Surface and (B) ribbon representation of AnFaeA-S133A with ferulic acid in the binding cavity. (C) Surface and (D) ribbon representations of LJ0536-S106A with ferulic acid in the binding cavity. The insertion domains are colored yellow. The hydrophobic residues are colored orange. The amino acids of the catalytic triad are colored red. The ligands (ferulic acids) are depicted in green. The red spheres represent the water molecules observed in the crystal. The dashed lines represent the hydrogen bonds.

160
Figure 5-2. Structure of FAE-XynZ. (A) Surface representation, (B) ribbon representation, and (C) topology diagram. The catalytic triad S172, H260, and D230 are colored in red. The inserted domain is not present in FAE-XynZ.
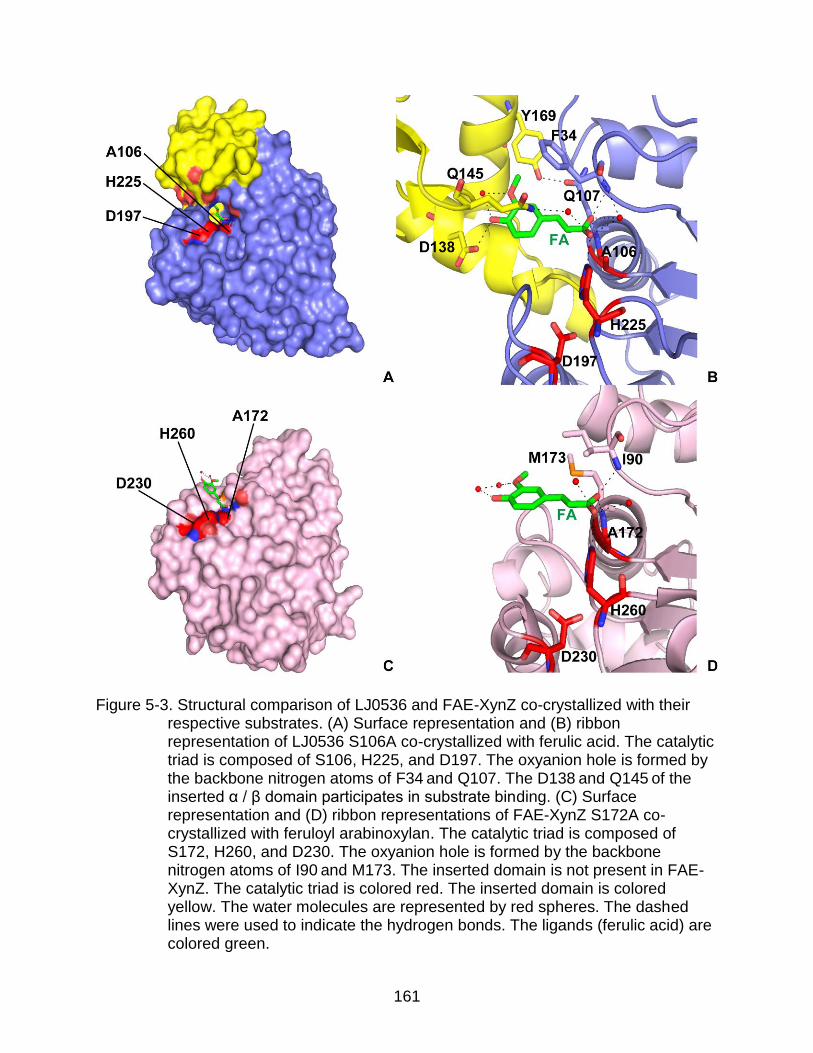
161
Figure 5-3. Structural comparison of LJ0536 and FAE-XynZ co-crystallized with their respective substrates. (A) Surface representation and (B) ribbon representation of LJ0536 S106A co-crystallized with ferulic acid. The catalytic triad is composed of S106, H225, and D197. The oxyanion hole is formed by the backbone nitrogen atoms of F34 and Q107. The D138 and Q145 of the inserted α / β domain participates in substrate binding. (C) Surface representation and (D) ribbon representations of FAE-XynZ S172A co-crystallized with feruloyl arabinoxylan. The catalytic triad is composed of S172, H260, and D230. The oxyanion hole is formed by the backbone nitrogen atoms of I90 and M173. The inserted domain is not present in FAE-XynZ. The catalytic triad is colored red. The inserted domain is colored yellow. The water molecules are represented by red spheres. The dashed lines were used to indicate the hydrogen bonds. The ligands (ferulic acid) are colored green.

162
CHAPTER 6 SUMMARY AND CONCLUSIONS
The overall goal of this work is to enhance the understanding of FAEs produced by
intestinal gut microbiota. FAE application is one of the major fields of study for
improving the bioavailability of phenolic acids in food components (phytophenols). The
released phenolic acids from phytophenols by FAE activity are subjected to intestinal
assimilation to provide beneficial functions to the host. To the best of today’s
knowledge, there is no study that describes the purification and characterization of
FAEs from the intestinal gut microbiota. The first part of this study has successfully
identified two FAEs, LJ0536 and LJ1228, from a commensal bacterium L. johnsonii
N6.2. Both enzymes showed high substrate preferences towards aromatic esters that
present in foods and the capability to tolerate harsh intestinal chemicals. Phylogenetic
analysis indicates LJ0536 and LJ1228 homologs are widely distributed in lactobacilli.
The findings disclose the potential utilization of probiotic bacterial FAEs to improve the
bioavailability of phenolic acids.
The second part of this study provides the first crystal structure of a FAE of L.
johnsonii. X-ray crystallization of LJ0536 identified specific features involved in ester
hydrolysis. LJ0536 shows a typical α / β fold structure which is common in serine
proteases. The catalytic triad is composed of S106, H225, and D197. Site directed
mutagenesis and co-crystallization of S106A with aromatic esters allow us to pinpoint
the binding mechanism of LJ0536. The substrate binding mechanism consists of a small
hydrophobic cavity in a boomerang shape and an inserted α / β domain located on top
of the binding cavity. An oxyanion hole is formed by the backbone nitrogen atoms of
F34 and Q107. It assists ester hydrolysis by stabilizing the enzyme-ester intermediate

163
and orientating the ester bond near the catalytic serine residue. The inserted α / β
domain is composed of 54 amino acids (P131 to Q184). Q145 of the inserted α / β
domain forms a bridge-like structure on top of the binding cavity to protect the small
hydrophobic region. It also assists in orientating a water molecule near the site of
hydrolysis. Residues D138 and Y169 of the inserted α / β domain form hydrogen bonds
with the hydroxyl groups of the aromatic ring of the substrate. The hydrogen bonding
stabilizes the substrate within the binding cavity. The difference in secondary structure
of inserted domains among homolog proteins determines substrate specificity. The
features of the inserted α / β domain contribute to substrate discrimination.
The last part of this study involved bioinformatics and structural comparisons of
LJ0536 with other biochemically characterized and putative FAEs of bacterial and
fungal species. The current FAE classification scheme is primarily based on the enzyme
activity and the primary sequence identity of fungal FAEs. For instance, the unique
features of protein structure showed in the LJ0536 crystal, the inserted domain, could
contribute as an extra element for the classification of FAEs in subfamily 1B. However,
the insufficiency of FAE structures in the current public PDB database limits the
feasiblility of applying the inserted domains as one of the features in the full
classification scheme. Further exploration of FAE structures is required to provide
insight on the use of inserted domains in the classification scheme.
164
REFERENCE LIST
Adams, P., P. Afonine, G. Bunkóczi, V. Chen, I. Davis, N. Echols, J. Headd, L. Hung, G. Kapral, R. Grosse-Kunstleve, A. McCoy, N. Moriarty, R. Oeffner, R. Read, D. Richardson, J. Richardson, T. Terwilliger & P. Zwart, (2010) PHENIX: a comprehensive Python-based system for macromolecular structure solution. Acta Crystallogr D Biol Crystallogr 66: 213-221.
Adisakwattana, S., P. Moonsan & S. Yibchok-Anun, (2008) Insulin-releasing properties of a series of cinnamic acid derivatives in vitro and in vivo. J Agric Food Chem 56: 7838-7844.
Akihisa, T., K. Yasukawa, M. Yamaura, M. Ukiya, Y. Kimura, N. Shimizu & K. Arai, (2000) Triterpene alcohol and sterol ferulates from rice bran and their anti-inflammatory effects. J Agric Food Chem 48: 2313-2319.
Akin, D. E., (2008) Plant cell wall aromatics: influence on degradation of biomass. Biofuel Bioprod Bior 2: 288-303.
Altermann, E., W. M. Russell, M. A. Azcarate-Peril, R. Barrangou, B. L. Buck, O. McAuliffe, N. Souther, A. Dobson, T. Duong, M. Callanan, S. Lick, A. Hamrick, R. Cano & T. R. Klaenhammer, (2005) Complete genome sequence of the probiotic lactic acid bacterium Lactobacillus acidophilus NCFM. Proc Natl Acad Sci U S A 102: 3906-3912.
Altschul, S. F., T. L. Madden, A. A. Schäffer, J. Zhang, Z. Zhang, W. Miller & D. J. Lipman, (1997) Gapped BLAST and PSI-BLAST: a new generation of protein database search programs. Nucleic Acids Res 25: 3389-3402.
Andreasen, M., P. Kroon, G. Williamson & M. Garcia-Conesa, (2001) Esterase activity able to hydrolyze dietary antioxidant hydroxycinnamates is distributed along the intestine of mammals. J Agric Food Chem 49: 5679-5684.
Arnold, K., L. Bordoli, J. Kopp & T. Schwede, (2006) The SWISS-MODEL workspace: a web-based environment for protein structure homology modelling. Bioinformatics 22: 195-201.
Asther, M., M. I. Estrada Alvarado, M. Haon, D. Navarro, M. Asther, L. Lesage-Meessen & E. Record, (2005) Purification and characterization of a chlorogenic acid hydrolase from Aspergillus niger catalysing the hydrolysis of chlorogenic acid. Journal of Biotechnology 115: 47-56.
Athar, M., J. H. Back, L. Kopelovich, D. R. Bickers & A. L. Kim, (2009) Multiple molecular targets of resveratrol: Anti-carcinogenic mechanisms. Arch Biochem Biophys 486: 95-102.

165
Baba, S., N. Osakabe, M. Natsume & J. Terao, (2004) Orally administered rosmarinic acid is present as the conjugated and/or methylated forms in plasma, and is degraded and metabolized to conjugated forms of caffeic acid, ferulic acid and m-coumaric acid. Life Sci 75: 165-178.
Balasubashini, M., R. Rukkumani & V. P. Menon, (2003) Protective effects of ferulic acid on hyperlipidemic diabetic rats. Acta Diabetol 40: 118-122.
Balasubashini, M., R. Rukkumani, P. Viswanathan & V. Menon, (2004) Ferulic acid alleviates lipid peroxidation in diabetic rats. Phytother Res 18: 310-314.
Beckman, C. H., (2000) Phenolic-storing cells: keys to programmed cell death and periderm formation in wilt disease resistance and in general defence responses in plants? Physiol Mol Plant Path 57: 101-110.
Benkert, P., M. Biasini & T. Schwede, (2011) Toward the estimation of the absolute quality of individual protein structure models. Bioinformatics 27: 343-350.
Benoit, I., M. Asther, Y. Bourne, D. Navarro, S. Canaan, L. Lesage-Meessen, M. Herweijer, P. Coutinho & E. Record, (2007) Gene overexpression and biochemical characterization of the biotechnologically relevant chlorogenic acid hydrolase from Aspergillus niger. Appl Environ Microbiol 73: 5624-5632.
Benoit, I., E. G. Danchin, R. J. Bleichrodt & R. P. de Vries, (2008) Biotechnological applications and potential of fungal feruloyl esterases based on prevalence, classification and biochemical diversity. Biotechnol Lett 30: 387-396.
Benson, D. A., I. Karsch-Mizrachi, D. J. Lipman, J. Ostell & E. W. Sayers, (2011) GenBank. Nucleic Acids Res 39: D32-D37.
Berman, H. M., J. Westbrook, Z. Feng, G. Gilliland, T. N. Bhat, H. Weissig, I. N. Shindyalov & P. E. Bourne (2000) The Protein Data Bank. In.: Nucleic Acids Res, pp. 235-242.
Bertrand, T., F. Augé, J. Houtmann, A. Rak, F. Vallée, V. Mikol, P. F. Berne, N. Michot, D. Cheuret, C. Hoornaert & M. Mathieu, (2010) Structural basis for human monoglyceride lipase inhibition. J Mol Biol 396: 663-673.
Blanc, E., P. Roversi, C. Vonrhein, C. Flensburg, S. Lea & G. Bricogne, (2004) Refinement of severely incomplete structures with maximum likelihood in BUSTER-TNT. Acta Crystallogr D Biol Crystallogr 60: 2210-2221.
Bornscheuer, U. T., (2002) Microbial carboxyl esterases: classification, properties and application in biocatalysis. FEMS Microbiol Rev 26: 73-81.
Bradford, M. M., (1976) A rapid and sensitive method for the quantitation of microgram quantities of protein utilizing the principle of protein-dye binding. Anal Biochem 72: 248-254.

166
Brenner, S., (1988) The molecular evolution of genes and proteins: a tale of two serines. Nature 334: 528-530.
Cani, P., R. Bibiloni, C. Knauf, A. Waget, A. Neyrinck, N. Delzenne & R. Burcelin, (2008) Changes in gut microbiota control metabolic endotoxemia-induced inflammation in high-fat diet-induced obesity and diabetes in mice. Diabetes 57: 1470-1481.
Cani, P., S. Possemiers, T. Van de Wiele, Y. Guiot, A. Everard, O. Rottier, L. Geurts, D. Naslain, A. Neyrinck, D. Lambert, G. Muccioli & N. Delzenne, (2009) Changes in gut microbiota control inflammation in obese mice through a mechanism involving GLP-2-driven improvement of gut permeability. Gut 58: 1091-1103.
Chao, P., C. Hsu & M. Yin, (2009) Anti-inflammatory and anti-coagulatory activities of caffeic acid and ellagic acid in cardiac tissue of diabetic mice. Nutr Metab (Lond) 6: 33.
Chen, M. H. & C. J. Bergman, (2005) A rapid procedure for analysing rice bran
tocopherol, tocotrienol and -oryzanol contents. J Food Comp Anal 18: 319-331.
Chen, V., W. r. Arendall, J. Headd, D. Keedy, R. Immormino, G. Kapral, L. Murray, J. Richardson & D. Richardson, (2010) MolProbity: all-atom structure validation for macromolecular crystallography. Acta Crystallogr D Biol Crystallogr 66: 12-21.
Cheng, C., S. Su, N. Tang, T. Ho, S. Chiang & C. Hsieh, (2008) Ferulic acid provides neuroprotection against oxidative stress-related apoptosis after cerebral ischemia/reperfusion injury by inhibiting ICAM-1 mRNA expression in rats. Brain Res 1209: 136-150.
Costabile, A., A. Klinder, F. Fava, A. Napolitano, V. Fogliano, C. Leonard, G. R. Gibson & K. M. Tuohy, (2008) Whole-grain wheat breakfast cereal has a prebiotic effect on the human gut microbiota: a double-blind, placebo-controlled, crossover study. Br J Nutr 99: 110-120.
Couteau, D. & P. Mathaly, (1998) Fixed-bed purification of ferulic acid from sugar-beet pulp using activated carbon: Optimization studies. Bioresource Technol 64: 17-25.
Couteau, D., A. McCartney, G. Gibson, G. Williamson & C. Faulds, (2001) Isolation and characterization of human colonic bacteria able to hydrolyse chlorogenic acid. J Appl Microbiol 90: 873-881.
Crepin, V. F., C. B. Faulds & I. F. Connerton, (2004) Functional classification of the microbial feruloyl esterases. Appl Microbiol Biotechnol 63: 647-652.
Crozier, A., I. Jaganath & M. Clifford, (2009) Dietary phenolics: chemistry, bioavailability and effects on health. Nat Prod Rep 26: 1001-1043.
167
Cygler, M., J. Schrag, J. Sussman, M. Harel, I. Silman, M. Gentry & B. Doctor, (1993) Relationship between sequence conservation and three-dimensional structure in a large family of esterases, lipases, and related proteins. Protein Sci 2: 366-382.
Dalrymple, B., Y. Swadling, D. Cybinski & G. Xue, (1996) Cloning of a gene encoding cinnamoyl ester hydrolase from the ruminal bacterium Butyrivibrio fibrisolvens E14 by a novel method. FEMS Microbiol Lett 143: 115-120.
Davidsen, T., E. Beck, A. Ganapathy, R. Montgomery, N. Zafar, Q. Yang, R. Madupu, P. Goetz, K. Galinsky, O. White & G. Sutton, (2010) The comprehensive microbial resource. Nucleic Acids Res 38: D340-345.
DeLano, W. L., (2002) The PyMOL Molecular Graphics System, version 1.00, Schrödinger, LLC.
Ding, X., B. F. Rasmussen, G. A. Petsko & D. Ringe, (1994) Direct structural observation of an acyl-enzyme intermediate in the hydrolysis of an ester substrate by elastase. Biochemistry 33: 9285-9293.
Dodson, G. & A. Wlodawer, (1998) Catalytic triads and their relatives. Trends Biochem Sci 23: 347-352.
Donaghy, J., P. F. Kelly & A. M. McKay, (1998) Detection of ferulic acid esterase production by Bacillus spp. and lactobacilli. Appl Microbiol Biotechnol 50: 257-260.
Dong, A., X. Xu, A. M. Edwards, C. Chang, M. Chruszcz, M. Cuff, M. Cymborowski, R. Di Leo, O. Egorova, E. Evdokimova, E. Filippova, J. Gu, J. Guthrie, A. Ignatchenko, A. Joachimiak, N. Klostermann, Y. Kim, Y. Korniyenko, W. Minor, Q. Que, A. Savchenko, T. Skarina, K. Tan, A. Yakunin, A. Yee, V. Yim, R. Zhang, H. Zheng, M. Akutsu, C. Arrowsmith, G. V. Avvakumov, A. Bochkarev, L. G. Dahlgren, S. Dhe-Paganon, S. Dimov, L. Dombrovski, P. Finerty, S. Flodin, A. Flores, S. Gräslund, M. Hammerström, M. D. Herman, B. S. Hong, R. Hui, I. Johansson, Y. Liu, M. Nilsson, L. Nedyalkova, P. Nordlund, T. Nyman, J. Min, H. Ouyang, H. W. Park, C. Qi, W. Rabeh, L. Shen, Y. Shen, D. Sukumard, W. Tempel, Y. Tong, L. Tresagues, M. Vedadi, J. R. Walker, J. Weigelt, M. Welin, H. Wu, T. Xiao, H. Zeng, H. Zhu, M. C. f. S. Genomics & S. G. Consortium, (2007) In situ proteolysis for protein crystallization and structure determination. Nat Methods 4: 1019-1021.
Emsley, P. & K. Cowtan, (2004) Coot: model-building tools for molecular graphics. Acta Crystallogr D Biol Crystallogr 60: 2126-2132.
Faulds, C., R. Molina, R. Gonzalez, F. Husband, N. Juge, J. Sanz-Aparicio & J. Hermoso, (2005) Probing the determinants of substrate specificity of a feruloyl esterase, AnFaeA, from Aspergillus niger. FEBS J 272: 4362-4371.

168
Fazary, A. & Y. Ju, (2007) Feruloyl esterases as biotechnological tools: current and future perspectives. Acta Biochim Biophys Sin (Shanghai) 39: 811-828.
Fazary, A. E. & Y.-H. Ju, (2008) The large-scale use of feruloyl esterases in industry. Biotechnol. Mol. Biol. Rev 3: 95-110.
Ferreres, F., R. Figueiredo, S. Bettencourt, I. Carqueijeiro, J. Oliveira, A. Gil-Izquierdo, D. M. Pereira, P. Valentão, P. B. Andrade, P. Duarte, A. R. Barceló & M. Sottomayor, (2011) Identification of phenolic compounds in isolated vacuoles of the medicinal plant Catharanthus roseus and their interaction with vacuolar class III peroxidase: an H2O2 affair? J Exp Bot 62: 2841-2854.
Fujita, A., H. Sasaki, A. Doi, K. Okamoto, S. Matsuno, H. Furuta, M. Nishi, T. Nakao, T. Tsuno, H. Taniguchi & K. Nanjo, (2008) Ferulic acid prevents pathological and functional abnormalities of the kidney in Otsuka Long-Evans Tokushima Fatty diabetic rats. Diabetes Res Clin Pract 79: 11-17.
Giuliani, S., C. Piana, L. Setti, A. Hochkoeppler, P. G. Pifferi, G. Williamson & C. B. Faulds, (2001) Synthesis of pentylferulate by a feruloyl esterase from Aspergillus niger using water-in-oil microemulsions. Biotechnol. Lett. 23: 325-330-330.
Goldstone, D., S. Villas-Bôas, M. Till, W. Kelly, G. Attwood & V. Arcus, (2010) Structural and functional characterization of a promiscuous feruloyl esterase (Est1E) from the rumen bacterium Butyrivibrio proteoclasticus. Proteins 78: 1457-1469.
Gonthier, M., C. Remesy, A. Scalbert, V. Cheynier, J. Souquet, K. Poutanen & A. Aura, (2006) Microbial metabolism of caffeic acid and its esters chlorogenic and caftaric acids by human faecal microbiota in vitro. Biomed Pharmacother 60: 536-540.
Gonzalez, C., M. Proudfoot, G. Brown, Y. Korniyenko, H. Mori, A. Savchenko & A. Yakunin, (2006) Molecular basis of formaldehyde detoxification. Characterization of two S-formylglutathione hydrolases from Escherichia coli, FrmB and YeiG. J Biol Chem 281: 14514-14522.
Graf, E., (1992) Antioxidant potential of ferulic acid. Free Radic Biol Med 13: 435-448.
Granados-Principal, S., J. L. Quiles, C. L. Ramirez-Tortosa, P. Sanchez-Rovira & M. C. Ramirez-Tortosa, (2010) Hydroxytyrosol: from laboratory investigations to future clinical trials. Nutr Rev 68: 191-206.
Grochulski, P., Y. Li, J. D. Schrag & M. Cygler, (1994) Two conformational states of Candida rugosa lipase. Protein Sci 3: 82-91.
Guthrie, J., P. Loppnau, I. Kozieradzki, A. Savchenko & C. Arrowsmith, (2007) Expression vectors for high-throughput in-fusion cloning. Unpublished.

169
Han, L. Y., C. Z. Cai, Z. L. Ji, Z. W. Cao, J. Cui & Y. Z. Chen, (2004) Predicting functional family of novel enzymes irrespective of sequence similarity: a statistical learning approach. Nucleic Acids Res 32: 6437-6444.
Hatzakis, N. S., D. Daphnomili & I. Smonou, (2003) Ferulic acid esterase from Humicola Insolens catalyzes enantioselective transesterification of secondary alcohols. J. Mol. Catal. B: Enzym. 21: 309-311.
Hatzakis, N. S. & I. Smonou, (2005) Asymmetric transesterification of secondary alcohols catalyzed by feruloyl esterase from Humicola insolens. Bioorg Chem 33: 325-337.
Hedstrom, L., (2002) Serine protease mechanism and specificity. Chem Rev 102: 4501-4524.
Hermoso, J., J. Sanz-Aparicio, R. Molina, N. Juge, R. González & C. Faulds, (2004) The crystal structure of feruloyl esterase A from Aspergillus niger suggests evolutive functional convergence in feruloyl esterase family. J Mol Biol 338: 495-506.
Hofmann, B., S. Tölzer, I. Pelletier, J. Altenbuchner, K. H. van Pée & H. J. Hecht, (1998) Structural investigation of the cofactor-free chloroperoxidases. J Mol Biol 279: 889-900.
Holm, L. & P. Rosenström, (2010) Dali server: conservation mapping in 3D. Nucleic Acids Res 38: W545-549.
Holmquist, M., (2000) Alpha/Beta-hydrolase fold enzymes: structures, functions and mechanisms. Curr Protein Pept Sci 1: 209-235.
Hooper, L. V. & J. I. Gordon, (2001) Commensal host-bacterial relationships in the gut. Science 292: 1115-1118.
Hope, H., (1988) Cryocrystallography of biological macromolecules: a generally applicable method. Acta Crystallogr B 44 ( Pt 1): 22-26.
Huang, D., S. Shen & J. Wu, (2009) Effects of caffeic acid and cinnamic acid on glucose uptake in insulin-resistant mouse hepatocytes. J Agric Food Chem 57: 7687-7692.
Huang, Z., B. Wang, D. H. Eaves, J. M. Shikany & R. D. Pace, (2007) Phenolic compound profile of selected vegetables frequently consumed by African Americans in the southeast United States. Food Chem 103: 1395-1402.
Janes, L., C. Löwendahl & R. Kazlauskas, (1998) Quantitative Screening of Hydrolase Libraries Using pH Indicators: Identifying Active and Enantioselective Hydrolases. Chem.–Eur. J. 4: 2324-2331.
170
Jensen, M. K., P. Koh-Banerjee, F. B. Hu, M. Franz, L. Sampson, M. Grønbaek & E. B. Rimm, (2004) Intakes of whole grains, bran, and germ and the risk of coronary heart disease in men. Am J Clin Nutr 80: 1492-1499.
Jew, S., S. AbuMweis & P. Jones, (2009) Evolution of the human diet: linking our ancestral diet to modern functional foods as a means of chronic disease prevention. J Med Food 12: 925-934.
Kim, H. Y., J. Park, K. H. Lee, D. U. Lee, J. H. Kwak, Y. S. Kim & S. M. Lee, (2011) Ferulic acid protects against carbon tetrachloride-induced liver injury in mice. Toxicology 282: 104-111.
Kim, I., X. Chu, S. Kim, C. Provoda, K. Lee & G. Amidon, (2003) Identification of a human valacyclovirase: biphenyl hydrolase-like protein as valacyclovir hydrolase. J Biol Chem 278: 25348-25356.
Kimber, M. S., F. Vallee, S. Houston, A. Necakov, T. Skarina, E. Evdokimova, S. Beasley, D. Christendat, A. Savchenko, C. H. Arrowsmith, M. Vedadi, M. Gerstein & A. M. Edwards, (2003) Data mining crystallization databases: knowledge-based approaches to optimize protein crystal screens. Proteins 51: 562-568.
Konishi, Y. & S. Kobayashi, (2005) Transepithelial transport of rosmarinic acid in intestinal Caco-2 cell monolayers. Biosci Biotechnol Biochem 69: 583-591.
Koshland, D. E., (1958) Application of a Theory of Enzyme Specificity to Protein Synthesis. Proc Natl Acad Sci U S A 44: 98-104.
Krissinel, E. & K. Henrick, (2007) Inference of macromolecular assemblies from crystalline state. J Mol Biol 372: 774-797.
Kroon, P. A., C. B. Faulds, P. Ryden, J. A. Robertson & G. Williamson, (1997) Release of Covalently Bound Ferulic Acid from Fiber in the Human Colon. J. Agric. Food Chem. 45: 661-667.
Lai, K., G. Lorca & C. Gonzalez, (2009) Biochemical properties of two cinnamoyl esterases purified from a Lactobacillus johnsonii strain isolated from stool samples of diabetes-resistant rats. Appl Environ Microbiol 75: 5018-5024.
Lai, L., Z. Xu, J. Zhou, K. Lee & G. Amidon, (2008) Molecular basis of prodrug activation by human valacyclovirase, an alpha-amino acid ester hydrolase. J Biol Chem 283: 9318-9327.
Lam, B. Y., A. C. Lo, X. Sun, H. W. Luo, S. K. Chung & N. J. Sucher, (2003) Neuroprotective effects of tanshinones in transient focal cerebral ischemia in mice. Phytomedicine 10: 286-291.

171
Landete, J., H. Rodríguez, J. Curiel, B. de las Rivas, J. Mancheño & R. Muñoz, (2010) Gene cloning, expression, and characterization of phenolic acid decarboxylase from Lactobacillus brevis RM84. J Ind Microbiol Biotechnol 37: 617-624.
Larkin, M. A., G. Blackshields, N. P. Brown, R. Chenna, P. A. McGettigan, H. McWilliam, F. Valentin, I. M. Wallace, A. Wilm, R. Lopez, J. D. Thompson, T. J. Gibson & D. G. Higgins, (2007) Clustal W and Clustal X version 2.0. Bioinformatics 23: 2947-2948.
Laskowski, R. A., (2009) PDBsum new things. Nucleic Acids Res 37: D355-359.
Laskowski, R. A., M. W. MacArthur, D. S. Moss & J. M. Thornton, (1993) PROCHECK: a program to check the stereochemical quality of protein structures. J Appl Crystallogr 26: 283-291.
Levasseur, A., D. Navarro, P. J. Punt, J. P. Belaïch, M. Asther & E. Record, (2005) Construction of engineered bifunctional enzymes and their overproduction in Aspergillus niger for improved enzymatic tools to degrade agricultural by-products. Appl Environ Microbiol 71: 8132-8140.
Li, M. H., J. M. Chen, Y. Peng, Q. Wu & P. G. Xiao, (2008) Investigation of Danshen and related medicinal plants in China. J Ethnopharmacol 120: 419-426.
Lilitchan, S., C. Tangprawat, K. Aryusuk, S. Krisnangkura, S. Chokmoh & K. Krisnangkura, (2008) Partial extraction method for the rapid analysis of total
lipids and -oryzanol contents in rice bran. Food Chem 106: 752-759.
Liu, A. M. F., N. A. Somers, R. J. Kazlauskas, T. S. Brush, F. Zocher, M. M. Enzelberger, U. T. Bornscheuer, G. P. Horsman, A. Mezzetti, C. Schmidt-Dannert & R. D. Schmid, (2001) Mapping the substrate selectivity of new hydrolases using colorimetric screening: lipases from Bacillus thermocatenulatus and Ophiostoma piliferum, esterases from Pseudomonas fluorescens and Streptomyces diastatochromogenes. Tetrahedron: Asymmetry 12: 545-556.
Lorca, G., A. Ezersky, V. Lunin, J. Walker, S. Altamentova, E. Evdokimova, M. Vedadi, A. Bochkarev & A. Savchenko, (2007a) Glyoxylate and pyruvate are antagonistic effectors of the Escherichia coli IclR transcriptional regulator. J Biol Chem 282: 16476-16491.
Lorca, G. L., R. D. Barabote, V. Zlotopolski, C. Tran, B. Winnen, R. N. Hvorup, A. J. Stonestrom, E. Nguyen, L. W. Huang, D. S. Kim & M. H. Saier, (2007b) Transport capabilities of eleven gram-positive bacteria: comparative genomic analyses. Biochim Biophys Acta 1768: 1342-1366.
Maillard, M.-N. & C. Berset, (1995) Evolution of Antioxidant Activity during Kilning: Role of Insoluble Bound Phenolic Acids of Barley and Malt. J Agric Food Chem 43: 1789-1793.
172
Mangel, W. F., P. T. Singer, D. M. Cyr, T. C. Umland, D. L. Toledo, R. M. Stroud, J. W. Pflugrath & R. M. Sweet, (1990) Structure of an acyl-enzyme intermediate during catalysis: (guanidinobenzoyl)trypsin. Biochemistry 29: 8351-8357.
Mastihuba, V., L. Kremnický, M. Mastihubová, J. Willett & G. Côté, (2002) A spectrophotometric assay for feruloyl esterases. Anal Biochem 309: 96-101.
Matsuzaki, T., Y. Nagata, S. Kado, K. Uchida, S. Hashimoto & T. Yokokura, (1997a) Effect of oral administration of Lactobacillus casei on alloxan-induced diabetes in mice. APMIS 105: 637-642.
Matsuzaki, T., Y. Nagata, S. Kado, K. Uchida, I. Kato, S. Hashimoto & T. Yokokura, (1997b) Prevention of onset in an insulin-dependent diabetes mellitus model, NOD mice, by oral feeding of Lactobacillus casei. APMIS 105: 643-649.
Matsuzaki, T., R. Yamazaki, S. Hashimoto & T. Yokokura, (1997c) Antidiabetic effects of an oral administration of Lactobacillus casei in a non-insulin-dependent diabetes mellitus (NIDDM) model using KK-Ay mice. Endocr J 44: 357-365.
Maurya, D. K. & T. P. Devasagayam, (2010) Antioxidant and prooxidant nature of hydroxycinnamic acid derivatives ferulic and caffeic acids. Food Chem Toxicol 48: 3369-3373.
McCoy, A., R. Grosse-Kunstleve, P. Adams, M. Winn, L. Storoni & R. Read, (2007) Phaser crystallographic software. J Appl Crystallogr 40: 658-674.
Murakami, A., Y. Nakamura, K. Koshimizu, D. Takahashi, K. Matsumoto, K. Hagihara, H. Taniguchi, E. Nomura, A. Hosoda, T. Tsuno, Y. Maruta, H. Kim, K. Kawabata & H. Ohigashi, (2002) FA15, a hydrophobic derivative of ferulic acid, suppresses inflammatory responses and skin tumor promotion: comparison with ferulic acid. Cancer Lett 180: 121-129.
Murshudov, G., A. Vagin & E. Dodson, (1997) Refinement of macromolecular structures by the maximum-likelihood method. Acta Crystallogr D Biol Crystallogr 53: 240-255.
Musso, G., R. Gambino & M. Cassader, (2011) Interactions between gut microbiota and host metabolism predisposing to obesity and diabetes. Annu Rev Med 62: 361-380.
Nardini, M. & B. W. Dijkstra, (1999) α/β Hydrolase fold enzymes: the family keeps growing. Curr Opin Struct Biol 9: 732-737.
Negri, E., S. Franceschi, M. Parpinel & C. La Vecchia, (1998) Fiber intake and risk of colorectal cancer. Cancer Epidemiol Biomarkers Prev 7: 667-671.

173
Ollis, D. L., E. Cheah, M. Cygler, B. Dijkstra, F. Frolow, S. M. Franken, M. Harel, S. J. Remington, I. Silman & J. Schrag, (1992) The alpha/beta hydrolase fold. Protein Eng 5: 197-211.
Omar, S. H., (2010) Oleuropein in Olive and its Pharmacological Effects. Sci Pharm 78: 133-154.
OriginLab, OriginLab, Northampton, MA.
Otwinowski, Z. & W. Minor, (1997) [20] Processing of X-ray diffraction data collected in oscillation mode. In: Methods Enzymol. Charles W. Carter, Jr. (ed). Academic Press, pp. 307-326.
Ou, S. & K.-C. Kwok, (2004) Ferulic acid: pharmaceutical functions, preparation and applications in foods. J Sci Food Agric 84: 1261-1269.
Page, R. D., (1996) TreeView: an application to display phylogenetic trees on personal computers. Comput Appl Biosci 12: 357-358.
Painter, J. & E. A. Merritt, (2006) Optimal description of a protein structure in terms of multiple groups undergoing TLS motion. Acta Crystallogr D Biol Crystallogr 62: 439-450.
Panda, T. & B. S. Gowrishankar, (2005) Production and applications of esterases. Appl Microbiol Biotechnol 67: 160-169.
Pervaiz, S. & A. L. Holme, (2009) Resveratrol: its biologic targets and functional activity. Antioxid Redox Signal 11: 2851-2897.
Pindel, E. V., N. Y. Kedishvili, T. L. Abraham, M. R. Brzezinski, J. Zhang, R. A. Dean & W. F. Bosron, (1997) Purification and cloning of a broad substrate specificity human liver carboxylesterase that catalyzes the hydrolysis of cocaine and heroin. J Biol Chem 272: 14769-14775.
Plumb, G. W., M. T. Garcia-Conesa, P. A. Kroon, M. Rhodes, S. Ridley & G. Williamson, (1999) Metabolism of chlorogenic acid by human plasma, liver, intestine and gut microflora. J. Sci. Food Agr. 79: 390-392.
Priefert, H., J. Rabenhorst & A. Steinbüchel, (2001) Biotechnological production of vanillin. Appl Microbiol Biotechnol 56: 296-314.
Puupponen-Pimiä, R., L. Nohynek, S. Hartmann-Schmidlin, M. Kähkönen, M. Heinonen, K. Määttä-Riihinen & K. Oksman-Caldentey, (2005) Berry phenolics selectively inhibit the growth of intestinal pathogens. J Appl Microbiol 98: 991-1000.
Rajendra Prasad, N., A. Karthikeyan, S. Karthikeyan & B. V. Reddy, (2011) Inhibitory effect of caffeic acid on cancer cell proliferation by oxidative mechanism in human HT-1080 fibrosarcoma cell line. Mol Cell Biochem 349: 11-19.

174
Record, E., M. Asther, C. Sigoillot, S. Pagès, P. J. Punt, M. Delattre, M. Haon, C. A. van den Hondel, J. C. Sigoillot & L. Lesage-Meessen, (2003) Overproduction of the Aspergillus niger feruloyl esterase for pulp bleaching application. Appl Microbiol Biotechnol 62: 349-355.
Richelle, M., I. Tavazzi & E. Offord, (2001) Comparison of the antioxidant activity of commonly consumed polyphenolic beverages (coffee, cocoa, and tea) prepared per cup serving. J Agric Food Chem 49: 3438-3442.
Rodríguez, H., I. Angulo, B. de Las Rivas, N. Campillo, J. Páez, R. Muñoz & J. Mancheño, (2010) p-Coumaric acid decarboxylase from Lactobacillus plantarum: structural insights into the active site and decarboxylation catalytic mechanism. Proteins 78: 1662-1676.
Rodríguez, H., J. Curiel, J. Landete, B. de las Rivas, F. López de Felipe, C. Gómez-Cordovés, J. Mancheño & R. Muñoz, (2009) Food phenolics and lactic acid bacteria. Int J Food Microbiol 132: 79-90.
Roesch, L., G. Lorca, G. Casella, A. Giongo, A. Naranjo, A. Pionzio, N. Li, V. Mai, C. Wasserfall, D. Schatz, M. Atkinson, J. Neu & E. Triplett, (2009) Culture-independent identification of gut bacteria correlated with the onset of diabetes in a rat model. ISME J 3: 536-548.
Rogosa, M., J. Mitchell & R. Wiseman, (1951) A selective medium for the isolation and enumeration of oral lactobacilli. J Dent Res 30: 682-689.
Sansbury, L. B., K. Wanke, P. S. Albert, L. Kahle, A. Schatzkin, E. Lanza & P. P. T. S. Group, (2009) The effect of strict adherence to a high-fiber, high-fruit and -vegetable, and low-fat eating pattern on adenoma recurrence. Am J Epidemiol 170: 576-584.
Sato, Y., S. Itagaki, T. Kurokawa, J. Ogura, M. Kobayashi, T. Hirano, M. Sugawara & K. Iseki, (2011) In vitro and in vivo antioxidant properties of chlorogenic acid and caffeic acid. Int J Pharm 403: 136-138.
Scheer, M., A. Grote, A. Chang, I. Schomburg, C. Munaretto, M. Rother, C. Söhngen, M. Stelzer, J. Thiele & D. Schomburg, (2011) BRENDA, the enzyme information system in 2011. Nucleic Acids Res 39: D670-676.
Schmidt, K., J. Schölmerich, H. Ritter & J. Schmitt, (1982) In vitro studies on the interaction between bile salts and key enzymes of the liver. Klin Wochenschr 60: 237-242.
Schubot, F. D., I. A. Kataeva, D. L. Blum, A. K. Shah, L. G. Ljungdahl, J. P. Rose & B. C. Wang, (2001) Structural basis for the substrate specificity of the feruloyl esterase domain of the cellulosomal xylanase Z from Clostridium thermocellum. Biochemistry 40: 12524-12532.

175
Schüttelkopf, A. & D. van Aalten, (2004) PRODRG: a tool for high-throughput crystallography of protein-ligand complexes. Acta Crystallogr D Biol Crystallogr 60: 1355-1363.
Selma, M., J. Espín & F. Tomás-Barberán, (2009) Interaction between phenolics and gut microbiota: role in human health. J Agric Food Chem 57: 6485-6501.
Sigoillot, C., S. Camarero, T. Vidal, E. Record, M. Asther, M. Pérez-Boada, M. J. Martínez, J. C. Sigoillot, J. F. Colom & A. T. Martínez, (2005) Comparison of different fungal enzymes for bleaching high-quality paper pulps. J Biotechnol 115: 333-343.
Slavin, J., (2008) Position of the American Dietetic Association: health implications of dietary fiber. J Am Diet Assoc 108: 1716-1731.
Spencer, J. P., M. M. Abd El Mohsen, A. M. Minihane & J. C. Mathers, (2008) Biomarkers of the intake of dietary polyphenols: strengths, limitations and application in nutrition research. Br J Nutr 99: 12-22.
Srinivasan, M., A. Sudheer & V. Menon, (2007) Ferulic Acid: therapeutic potential through its antioxidant property. J Clin Biochem Nutr 40: 92-100.
Tada, H., Y. Murakami, T. Omoto, K. Shimomura & K. Ishimaru, (1996) Rosmarinic acid and related phenolics in hairy root cultures of Ocimum basilicum. Phytochemistry 42: 431-434.
Tanida, M., T. Yamano, K. Maeda, N. Okumura, Y. Fukushima & K. Nagai, (2005) Effects of intraduodenal injection of Lactobacillus johnsonii La1 on renal sympathetic nerve activity and blood pressure in urethane-anesthetized rats. Neurosci Lett 389: 109-114.
Topakas, E., H. Stamatis, P. Biely, D. Kekos, B. J. Macris & P. Christakopoulos, (2003) Purification and characterization of a feruloyl esterase from Fusarium oxysporum catalyzing esterification of phenolic acids in ternary water-organic solvent mixtures. J Biotechnol 102: 33-44.
Topakas, E., C. Vafiadi & P. Christakopoulos, (2007) Microbial production, characterization and applications of feruloyl esterases. Process Biochemistry 42: 497-509.
Udatha, D. B., I. Kouskoumvekaki, L. Olsson & G. Panagiotou, (2011) The interplay of descriptor-based computational analysis with pharmacophore modeling builds the basis for a novel classification scheme for feruloyl esterases. Biotechnol Adv 29: 94-110.
Vaarala, O., M. Atkinson & J. Neu, (2008) The "perfect storm" for type 1 diabetes: the complex interplay between intestinal microbiota, gut permeability, and mucosal immunity. Diabetes 57: 2555-2562.
176
Vafiadi, C., E. Topakas, P. Christakopoulos & C. B. Faulds, (2006) The feruloyl esterase system of Talaromyces stipitatus: determining the hydrolytic and synthetic specificity of TsFaeC. J Biotechnol 125: 210-221.
Valladares, R., D. Sankar, N. Li, E. Williams, K. Lai, A. Abdelgeliel, C. Gonzalez, C. Wasserfall, J. Larkin, D. Schatz, M. Atkinson, E. Triplett, J. Neu & G. Lorca, (2010) Lactobacillus johnsonii N6.2 mitigates the development of type 1 diabetes in BB-DP rats. PLoS One 5: e10507.
Walter, J., (2008) Ecological role of lactobacilli in the gastrointestinal tract: implications for fundamental and biomedical research. Appl Environ Microbiol 74: 4985-4996.
Wang, H., G. J. Provan & K. Helliwell, (2004a) Determination of rosmarinic acid and caffeic acid in aromatic herbs by HPLC. Food Chem 87: 307-311.
Wang, X., X. Geng, Y. Egashira & H. Sanada, (2004b) Purification and characterization of a feruloyl esterase from the intestinal bacterium Lactobacillus acidophilus. Appl Environ Microbiol 70: 2367-2372.
Williamson, G., A. Day, G. Plumb & D. Couteau, (2000) Human metabolic pathways of dietary flavonoids and cinnamates. Biochem Soc Trans 28: 16-22.
Xing, H. C., L. J. Li, K. J. Xu, T. Shen, Y. B. Chen, Y. Chen, S. Z. Fu, J. F. Sheng, C. L. Chen, J. G. Wang, D. Yan, F. W. Dai & X. Y. Sha, (2005) Effects of Salvia miltiorrhiza on intestinal microflora in rats with ischemia/reperfusion liver injury. Hepatobiliary Pancreat Dis Int 4: 274-280.
Yamano, T., M. Tanida, A. Niijima, K. Maeda, N. Okumura, Y. Fukushima & K. Nagai, (2006) Effects of the probiotic strain Lactobacillus johnsonii strain La1 on autonomic nerves and blood glucose in rats. Life Sci 79: 1963-1967.
Yi, W., J. Fischer, G. Krewer & C. C. Akoh, (2005) Phenolic compounds from blueberries can inhibit colon cancer cell proliferation and induce apoptosis. J Agric Food Chem 53: 7320-7329.
Yin, d. L., P. Bernhardt, K. L. Morley, Y. Jiang, J. D. Cheeseman, V. Purpero, J. D. Schrag & R. J. Kazlauskas, (2010) Switching catalysis from hydrolysis to perhydrolysis in Pseudomonas fluorescens esterase. Biochemistry 49: 1931-1942.
Yu, H. P., T. L. Hwang, C. H. Yen & Y. T. Lau, (2010) Resveratrol prevents endothelial dysfunction and aortic superoxide production after trauma hemorrhage through estrogen receptor-dependent hemeoxygenase-1 pathway. Crit Care Med 38: 1147-1154.
177
BIOGRAPHICAL SKETCH
Kin-Kwan Lai was born in Hong Kong, 1982. He attended secondary school from
1993 to 1999 and moved to the United States in 2000. During his first few years in the
U.S., he held a part-time job for two years and eventually attended Broward Community
College from 2001 to 2004. He obtained his Associate of Arts Degree with the highest
honor. Kin-Kwan then transferred to the University of Florida in January 2005,
graduating cum laude with a Bachelors of Science in Microbiology in December 2006.
After gaining U.S. citizenship in 2006, Kin-Kwan continued with his interest in
microbiology by applying to the University of Florida graduate program in August of
2007 under the guidance of Dr. Claudio Gonzalez. As a graduate student, he has
attended symposiums such as the Florida Genetics Institute Research Symposium
(2008) and the American Society of Microbiology (ASM) Branch and General Meetings
(2009, 2010, and 2011). In 2010, Kin-Kwan received the ASM Beneficial Microbes
Travel Grant. In addition, he has served as a mentor for two undergraduates, Clara Vu
and Sara Molloy, and even assisted with the 2011 Undergraduate Microbiology
Research Symposium as the graduate student representative. His work presented in
this document generated two publications in peer-reviewed journals.
Kin-Kwan is currently pursuing a career in microbiology with the government or a
biotechnology company.