Embed Size (px)
Citation preview
1
Biochemomechanical Hormone Delivery Oscillator:
Theory and Experiments
Ronald A. SiegelDepts. Of Pharmaceutics and Biomedical
EngineeringUniversity of Minnesota
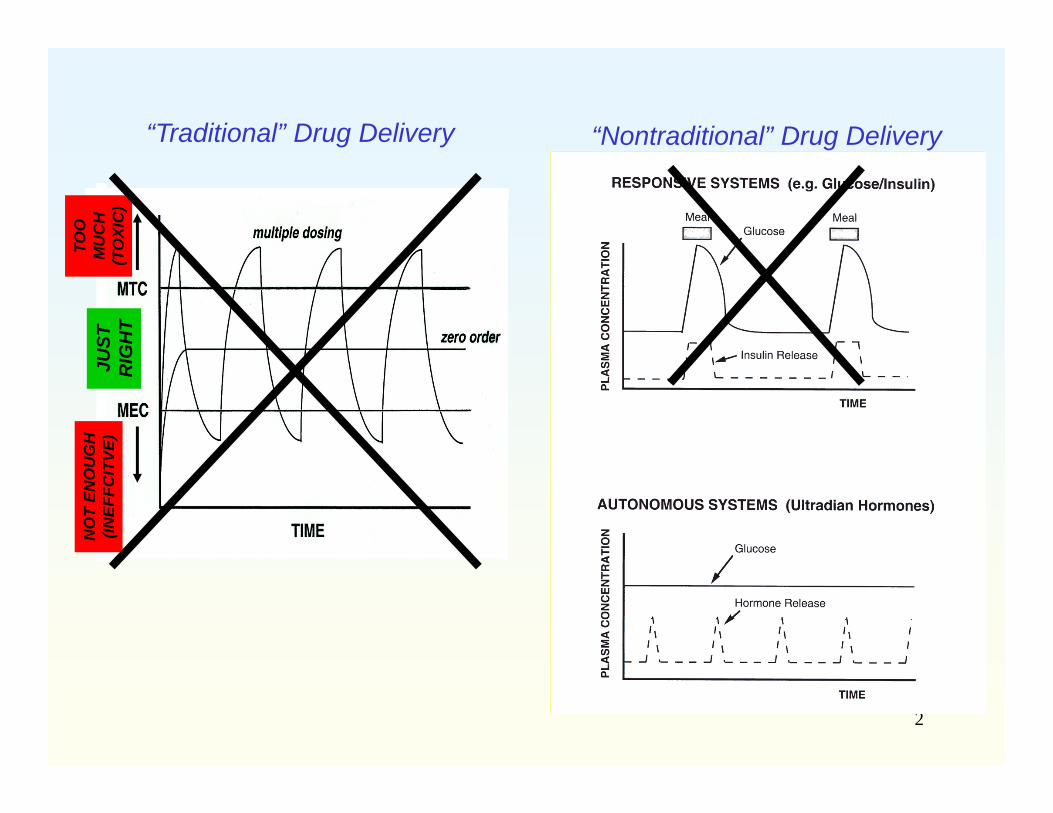
2
NO
T EN
OU
GH
(IN
EFFC
ITVE
)JU
ST
RIG
HT
TOO
M
UC
H
(TO
XIC
)“Traditional” Drug Delivery “Nontraditional” Drug Delivery
3
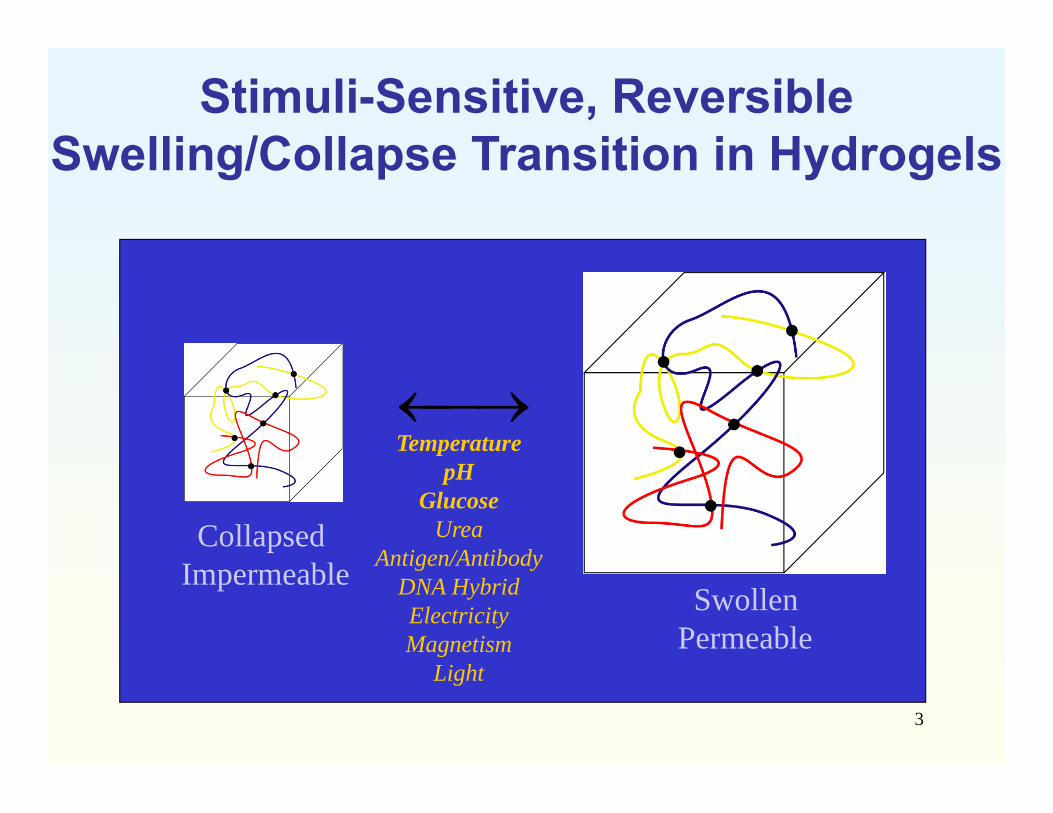
Stimuli-Sensitive, Reversible Swelling/Collapse Transition in Hydrogels
Temperature
pHGlucose
UreaAntigen/Antibody
DNA HybridElectricityMagnetism
Light
CollapsedImpermeable
SwollenPermeable

4
FREQUENCYHORMONE (pulses/day)__
Growth Hormone 9-16, 29Prolactin 4-9, 7-22Thyroid Stimulating Hormone 6-12, 13Adrenocorticotropic Hormone 15, 54
Gonadotropin Releasing Hormone (GnRH) 12-24Luteinizing Hormone (LH)Follicle Stimulating Hormone (FDH)
Estradiol 8-16, 8-19Progesterone 8-12, 6-16Testosterone1 3, 8-12
-Endorphin 13Melatonin 18-24, 12-20Vasopressin 12-18Renin 6, 8-12Parathyroid Hormone 24-139, 23Insulin 108-144, 120Pancreatic Polypeptide 96Somatostatin 72Glucagon 103, 144Aldosterone 6, 9-12Cortisol 15, 39
MANY HORMONES DISPLAY ULTRADIAN PULSATILITY
Source: G. Brabant et al., Trends in Endocrinology and Metabolism, 3, 183-190 (1992).
5
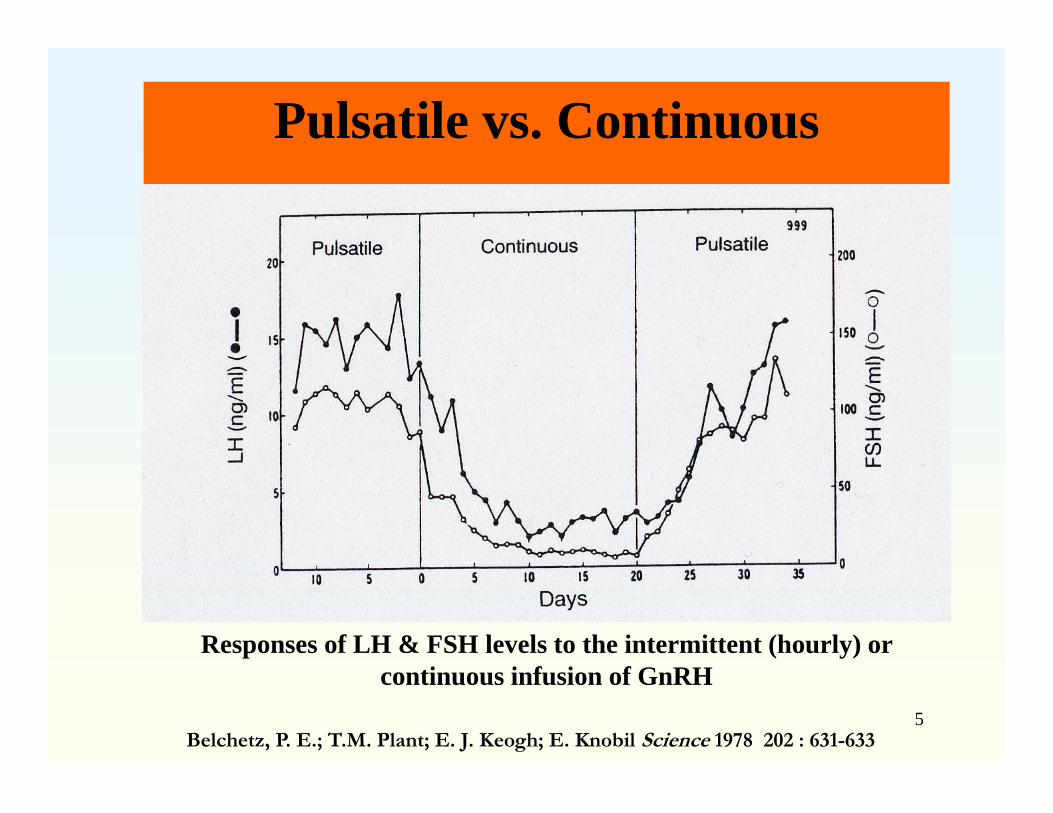
Pulsatile vs. Continuous
Responses of LH & FSH levels to the intermittent (hourly) or continuous infusion of GnRH
Belchetz, P. E.; T.M. Plant; E. J. Keogh; E. Knobil Science 1978 202 : 631-633

6
Hypogonadotropic HypogonadismLack of endogenous pulsatile Gonadotropin Releasing Hormone(GnRH) secretion
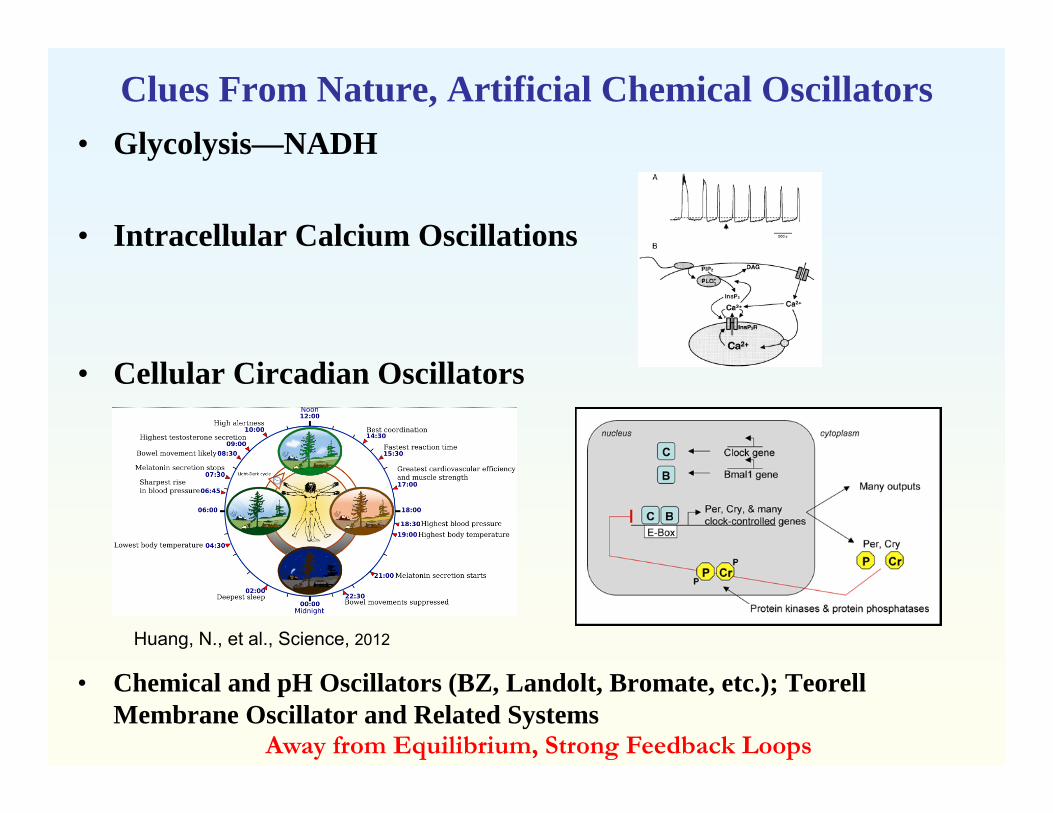
Clues From Nature, Artificial Chemical Oscillators• Glycolysis—NADH
• Intracellular Calcium Oscillations
• Cellular Circadian Oscillators
• Chemical and pH Oscillators (BZ, Landolt, Bromate, etc.); Teorell Membrane Oscillator and Related Systems
Away from Equilibrium, Strong Feedback Loops
Huang, N., et al., Science, 2012
8
Lessons from Chemical Oscillators: Design Heuristics
1. Away from equilibrium
2. Bistable element
3. Feedback element
Epstein, Orban, Boissonade, DeKepper
9
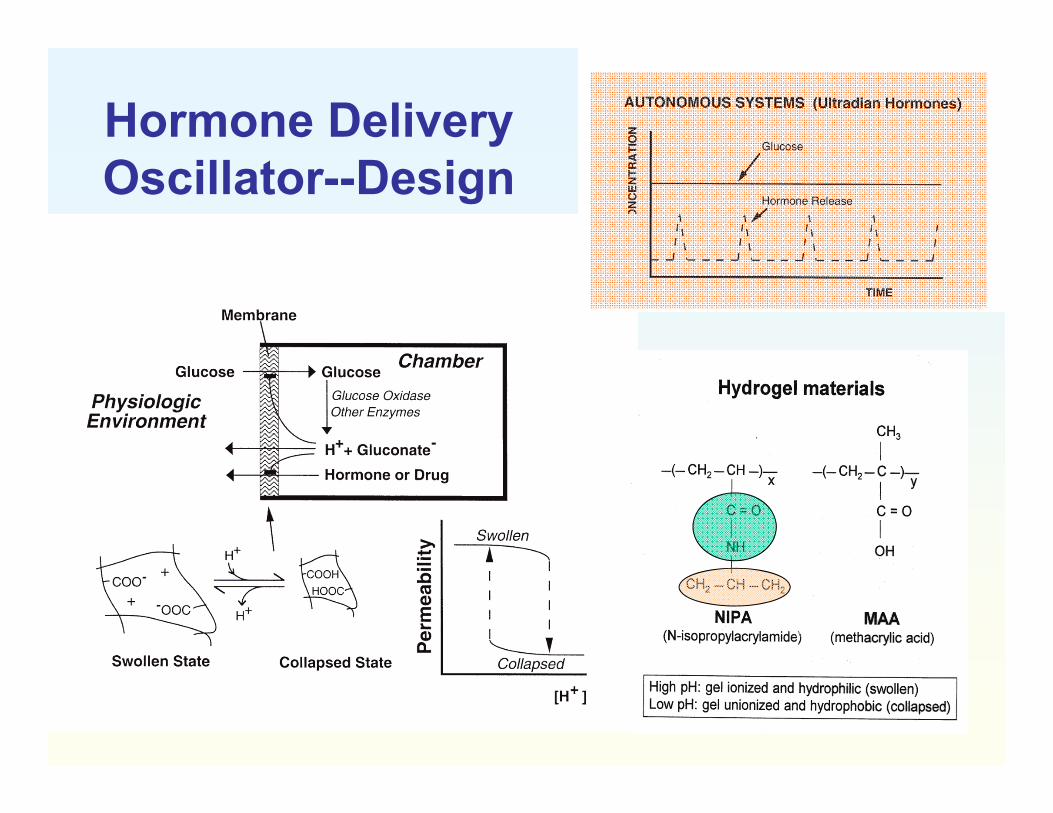
Hormone Delivery Oscillator--Design

10
Product Removal
Constant Source
Aw
ay fr
om E
quili
briu
m
Bistable
Feedback
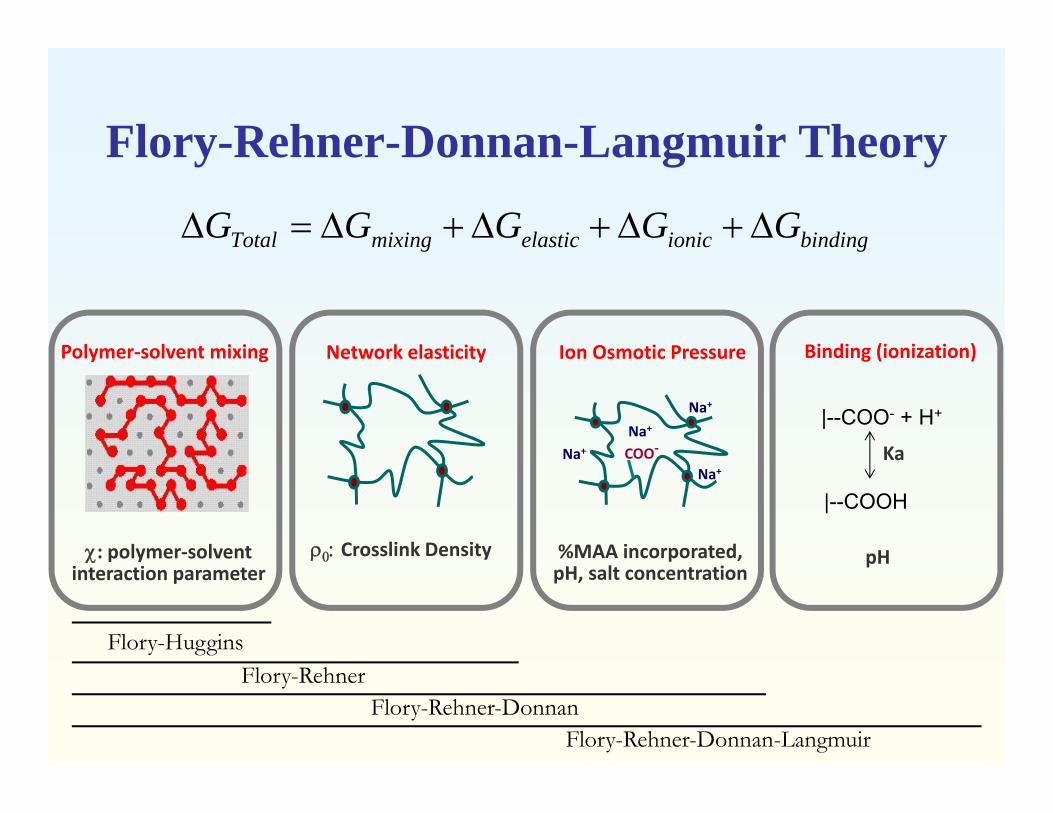
Flory-Rehner-Donnan-Langmuir Theory
bindingionicelasticmixingTotal GGGGG
Crosslink Density: polymer‐solvent interaction parameter
Polymer‐solvent mixing Network elasticity
COO‐Na+
Na+
Na+
Na+
Ion Osmotic Pressure
%MAA incorporated, pH, salt concentration
Binding (ionization)
pH
Flory-HugginsFlory-Rehner
Flory-Rehner-DonnanFlory-Rehner-Donnan-Langmuir
|--COO- + H+
|--COOH
Ka
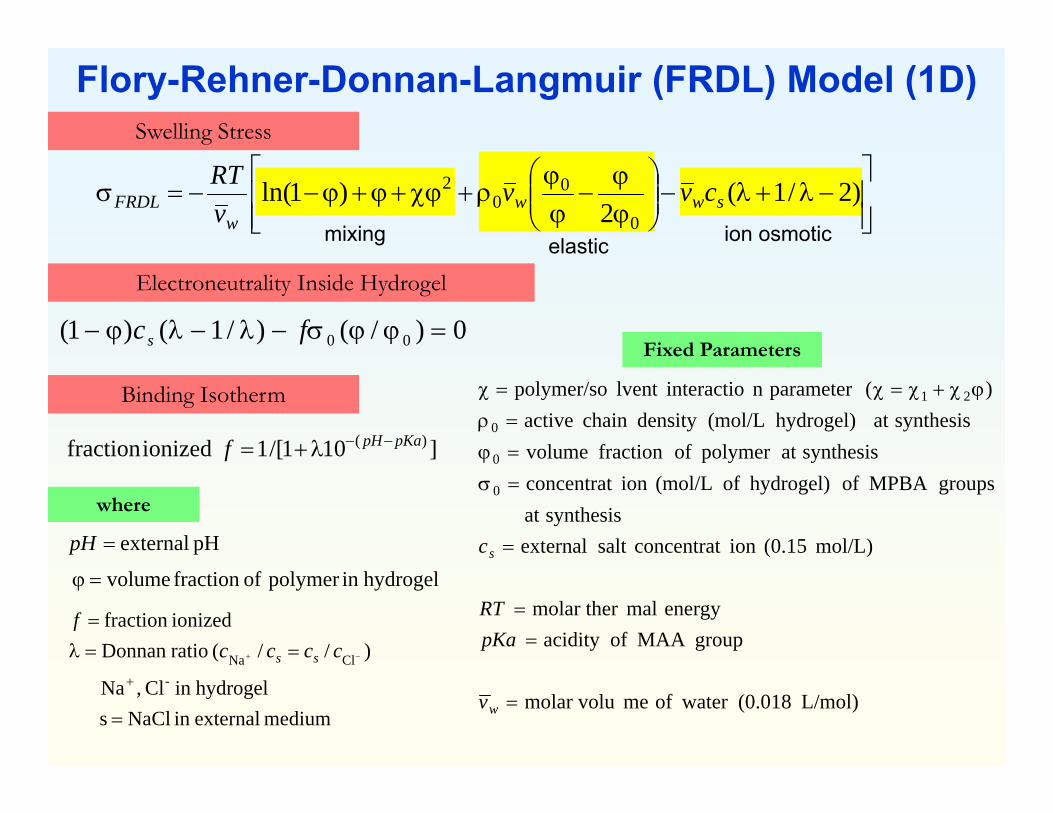
Flory-Rehner-Donnan-Langmuir (FRDL) Model (1D)
)2/1(2
)1ln(0
00
2sww
wFRDL cvv
vRT
0)/()/1()1( 00 fcs
]101/[1 ionizedfraction )( pKapHf
Swelling Stress
Electroneutrality Inside Hydrogel
Binding Isotherm
L/mol) (0.018 water of memolar volu
groupMAA ofacidity energy malmolar ther
mol/L) (0.15ion concentratsalt externalsynthesisat
groupsMPBA of hydrogel) of (mol/Lion concentratsynthesisat polymer offraction volume
synthesisat hydrogel) (mol/Ldensity chain active)(parameter n interactiolvent polymer/so
0
0
0
21
w
s
v
pKaRT
cpH externalpH
hydrogelin polymer offraction volume
medium externalin NaCl s hydrogelin Cl ,Na
)//( ratioDonnan ionizedfraction
-ClNa
ccccf
ss
Fixed Parameters
where
mixing elastic ion osmotic

pH
Swel
ling
pKa pH
Swel
ling
pKa
Depends on polymer hydrophobicity ) initial crosslink density 0initial concentration of ionizable (MAA) groups in hydrogel 0 external salt
concentration (Cs)
Monotonic or Bistable Equilibrium Behaviors
pHΔFpH
Swelling Ratio V/V0 = 0/
pHΔFpH
Common hydrogel with MAA
NIPA-MAA hydrogel
0FRDL
VF
Swelling Ratio V/V0 = 0/
14
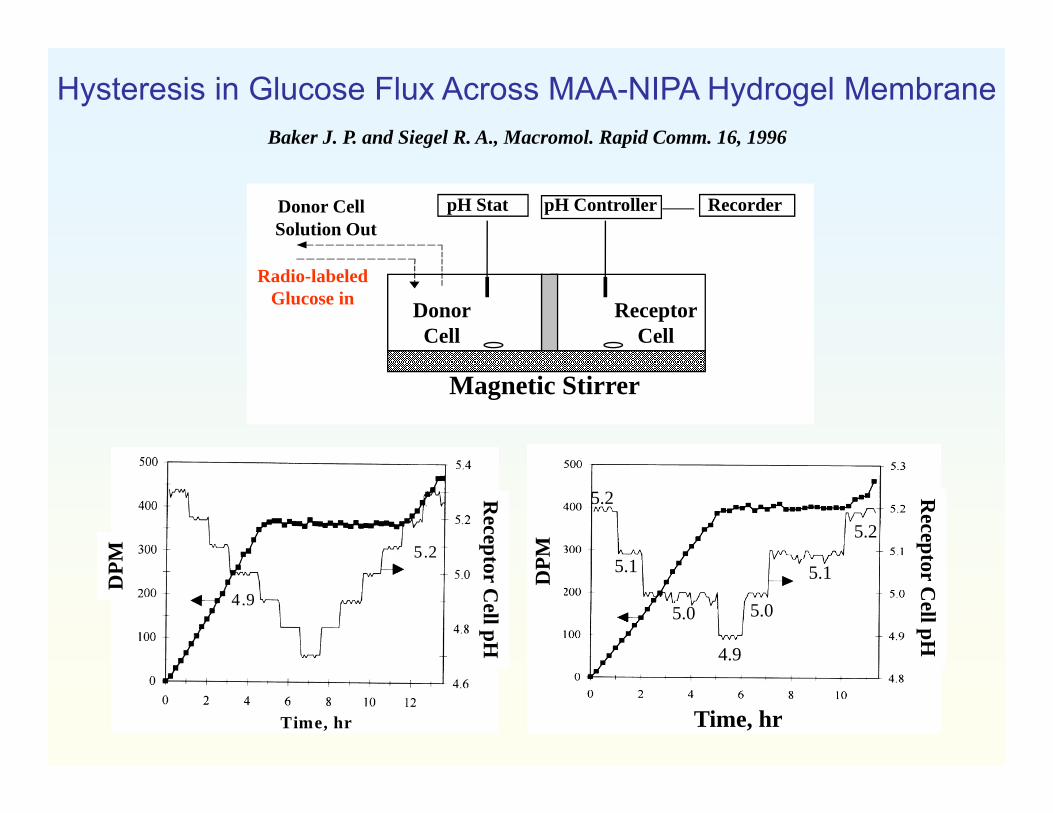
pH Stat pHMeter
Magnetic stirrer
DonorCell ReceptorCellGlucoseOxidase
GlucoseSolution In
Donor CellSolution OutRecorderpH Stat pH Controller
Magnetic Stirrer
DonorCell
ReceptorCell
Radio-labeledGlucose in
Donor CellSolution Out
Recorder
4.9
5.2
DPM
Time, hr
Receptor
pHR
eceptor Cell pH
DPM DPM
Time, hr
5.2
5.1
5.0
4.9
5.0
5.1
5.2 Receptor C
ell pHHysteresis in Glucose Flux Across MAA-NIPA Hydrogel Membrane
Baker J. P. and Siegel R. A., Macromol. Rapid Comm. 16, 1996

15
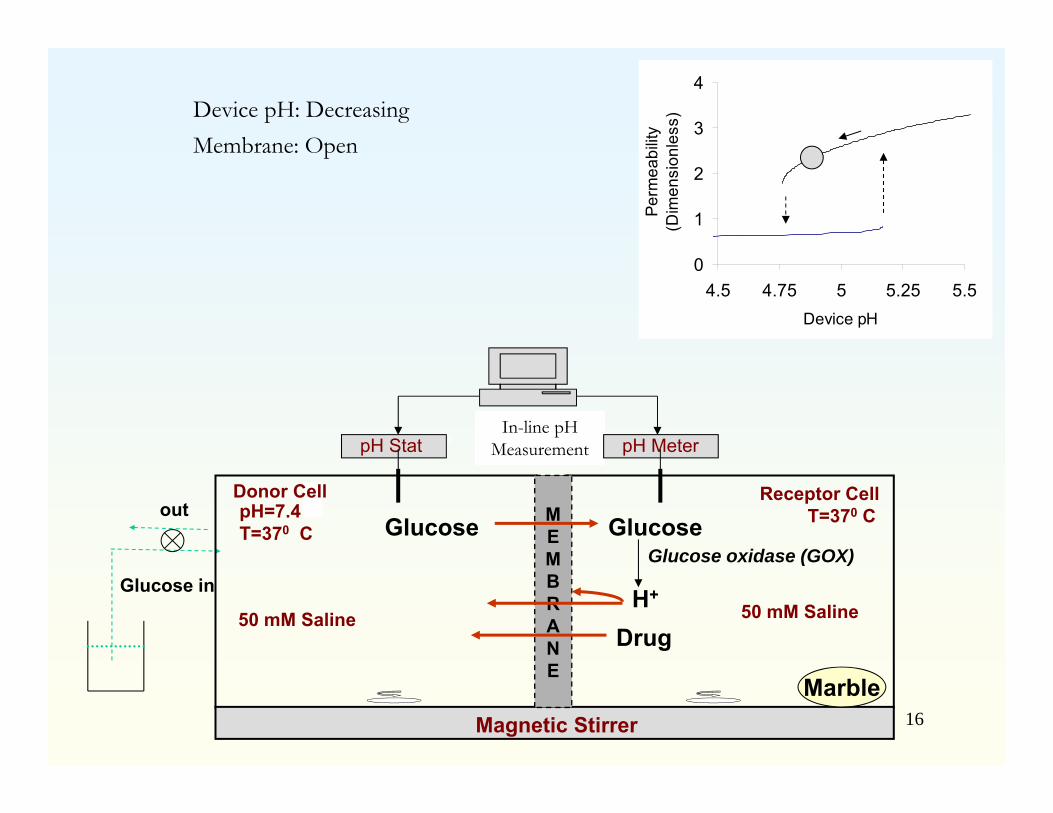
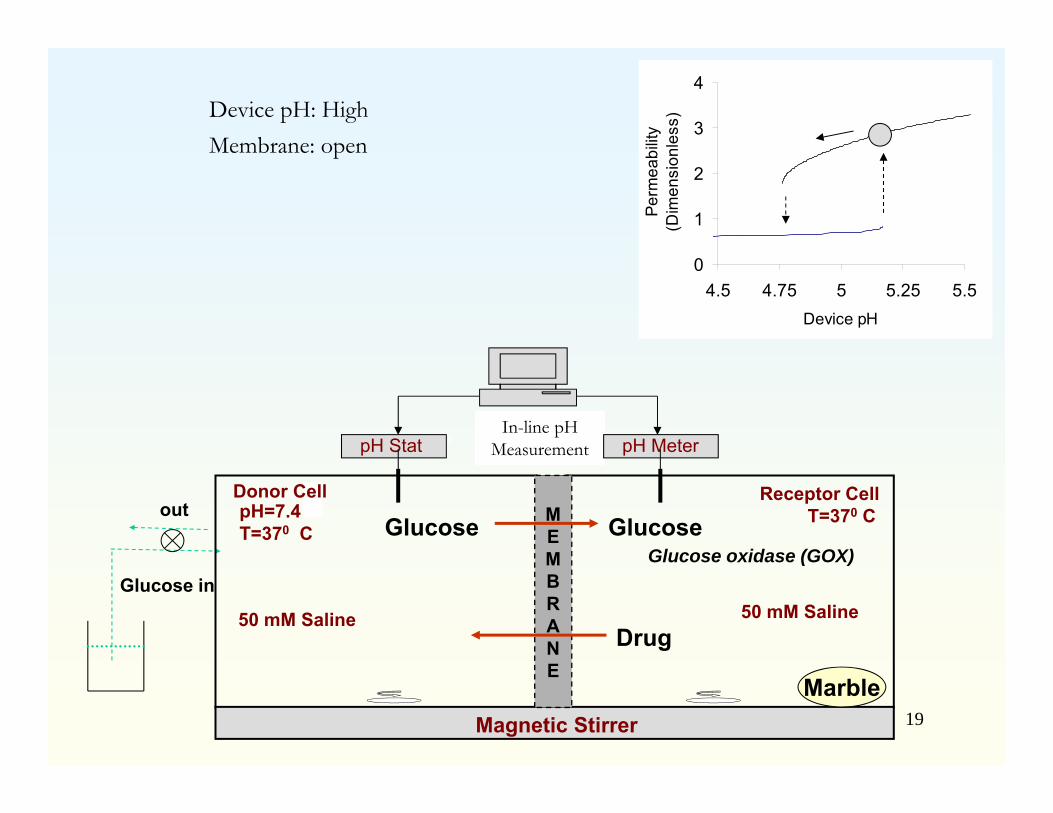
Device pH: HighMembrane: open
0
1
2
3
4
4.5 4.75 5 5.25 5.5Device pH
Perm
eabi
lity
(Dim
ensi
onle
ss)
out
Glucose in
In-line pH MeasurementpH Stat pH Meter
pH=7.4T=370 C
MEMBRANE
Magnetic Stirrer
Glucose GlucoseGlucose oxidase (GOX)
Drug
T=370 CDonor Cell Receptor Cell
50 mM Saline 50 mM Saline
Marble
16
Device pH: DecreasingMembrane: Open
0
1
2
3
4
4.5 4.75 5 5.25 5.5Device pH
Perm
eabi
lity
(Dim
ensi
onle
ss)
out
Glucose in
In-line pH MeasurementpH Stat pH Meter
pH=7.4T=370 C
MEMBRANE
Magnetic Stirrer
Glucose Glucose
H+
Glucose oxidase (GOX)
Drug
T=370 CDonor Cell Receptor Cell
50 mM Saline 50 mM Saline
Marble
17
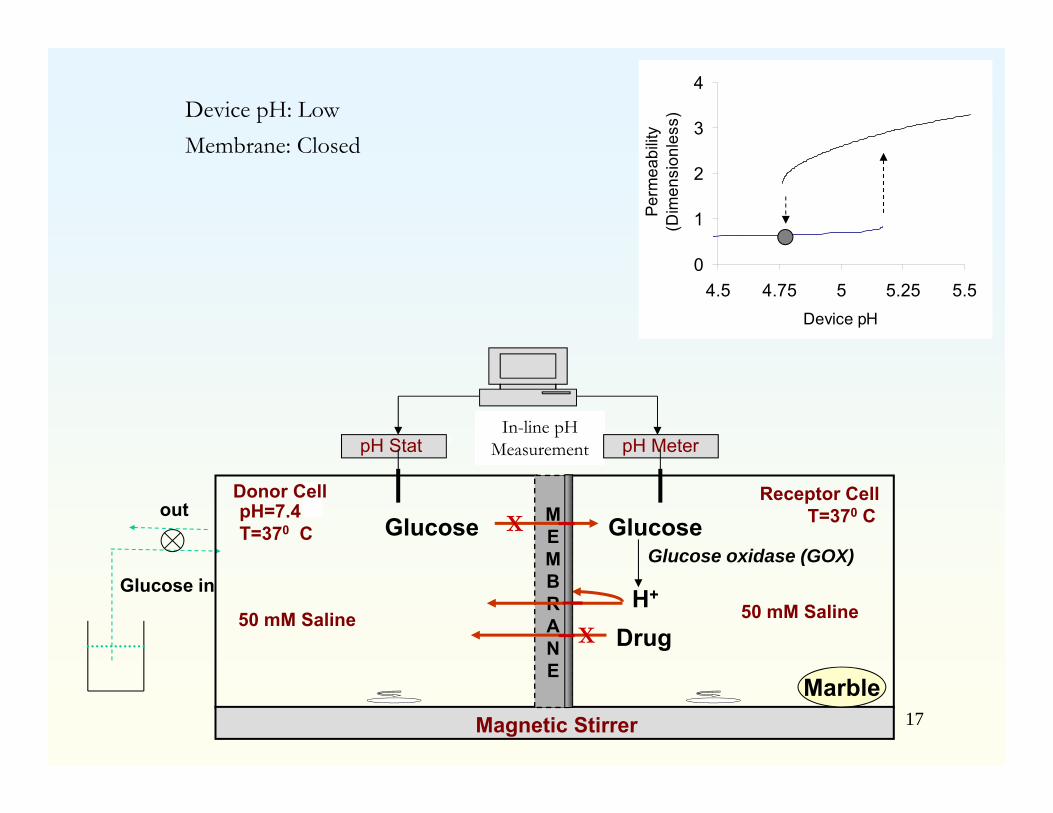
0
1
2
3
4
4.5 4.75 5 5.25 5.5Device pH
Perm
eabi
lity
(Dim
ensi
onle
ss)Device pH: Low
Membrane: Closed
out
Glucose in
In-line pH MeasurementpH Stat pH Meter
pH=7.4T=370 C
MEMBRANE
Magnetic Stirrer
Glucose Glucose
H+
Glucose oxidase (GOX)
Drug
T=370 CDonor Cell Receptor Cell
50 mM Saline 50 mM Saline
Marble
X
X

18
Device pH: IncreasingMembrane: Closed
0
1
2
3
4
4.5 4.75 5 5.25 5.5Device pH
Perm
eabi
lity
(Dim
ensi
onle
ss)
out
Glucose in
In-line pH MeasurementpH Stat pH Meter
pH=7.4T=370 C
MEMBRANE
Magnetic Stirrer
Glucose GlucoseGlucose oxidase (GOX)
Drug
T=370 CDonor Cell Receptor Cell
50 mM Saline 50 mM Saline
Marble
X
X
H+
19
Device pH: HighMembrane: open
0
1
2
3
4
4.5 4.75 5 5.25 5.5Device pH
Perm
eabi
lity
(Dim
ensi
onle
ss)
out
Glucose in
In-line pH MeasurementpH Stat pH Meter
pH=7.4T=370 C
MEMBRANE
Magnetic Stirrer
Glucose GlucoseGlucose oxidase (GOX)
Drug
T=370 CDonor Cell Receptor Cell
50 mM Saline 50 mM Saline
Marble
20
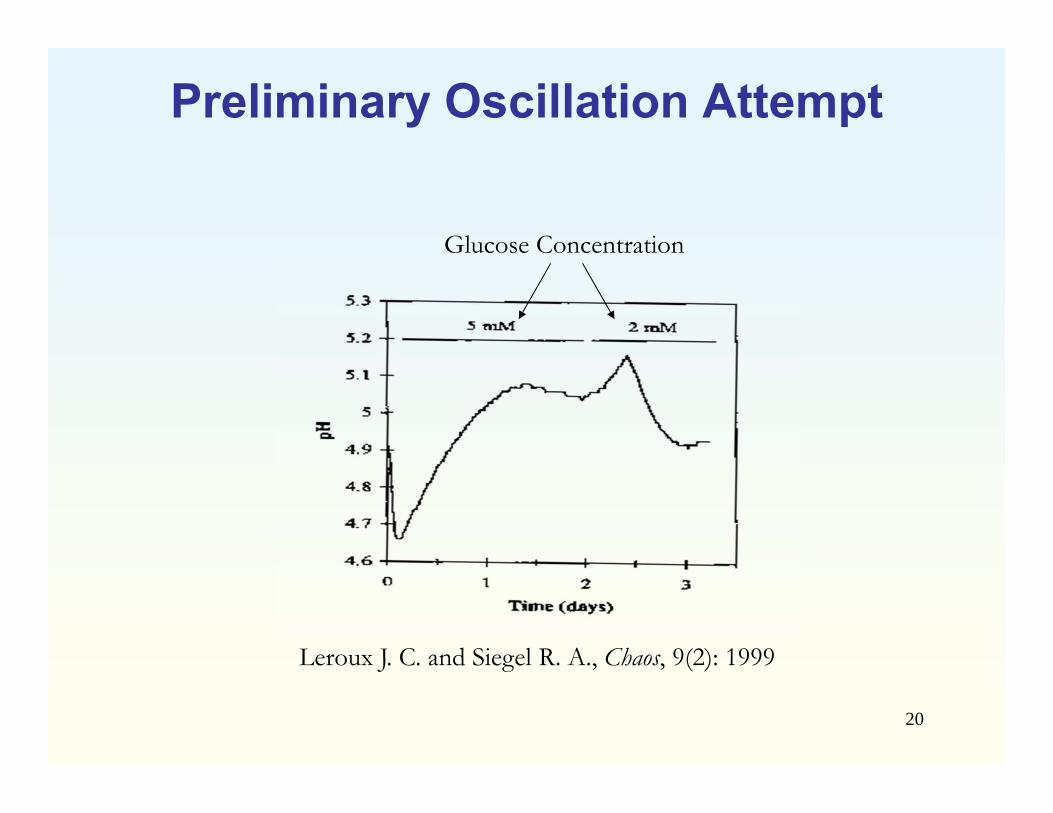
Preliminary Oscillation Attempt
Leroux J. C. and Siegel R. A., Chaos, 9(2): 1999
Glucose Concentration

21
Hypothesis Regarding Lack of Sustained Oscillations and How to Fix
Closed
Steady State
Open
pH
Perm
eabi
lity
Slow Dynamics
Closed
Fast Dynamics
22
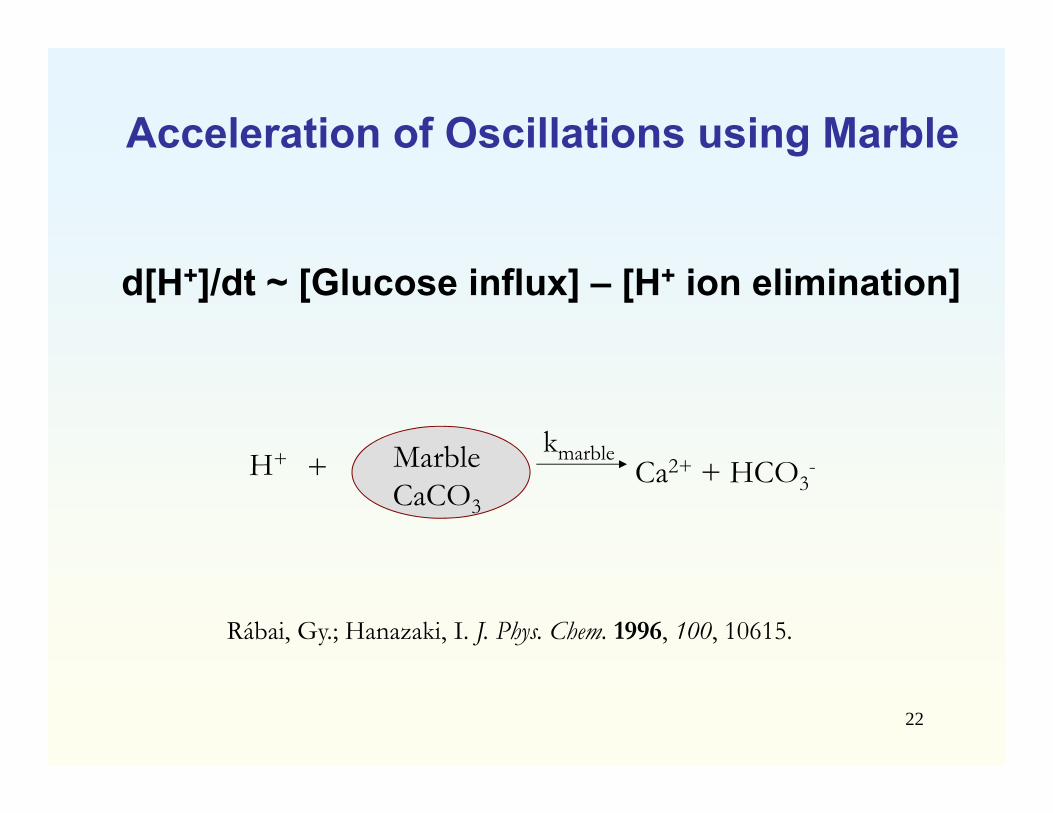
Acceleration of Oscillations using Marble
d[H+]/dt ~ [Glucose influx] – [H+ ion elimination]
MarbleCaCO3
H+ Ca2+ + HCO3-
kmarble+
Rábai, Gy.; Hanazaki, I. J. Phys. Chem. 1996, 100, 10615.
230 24 48 72 96 120 144 168
-1
0
1
2
3
4
5
6
7
Rate
of D
eliv
ery
(nm
ol/m
in)
Time (Hours)
1000 1100 1200 1300 1400 1500-1012345678
Rat
e of
Del
iver
y (n
mol
/min
)
Time (minutes)
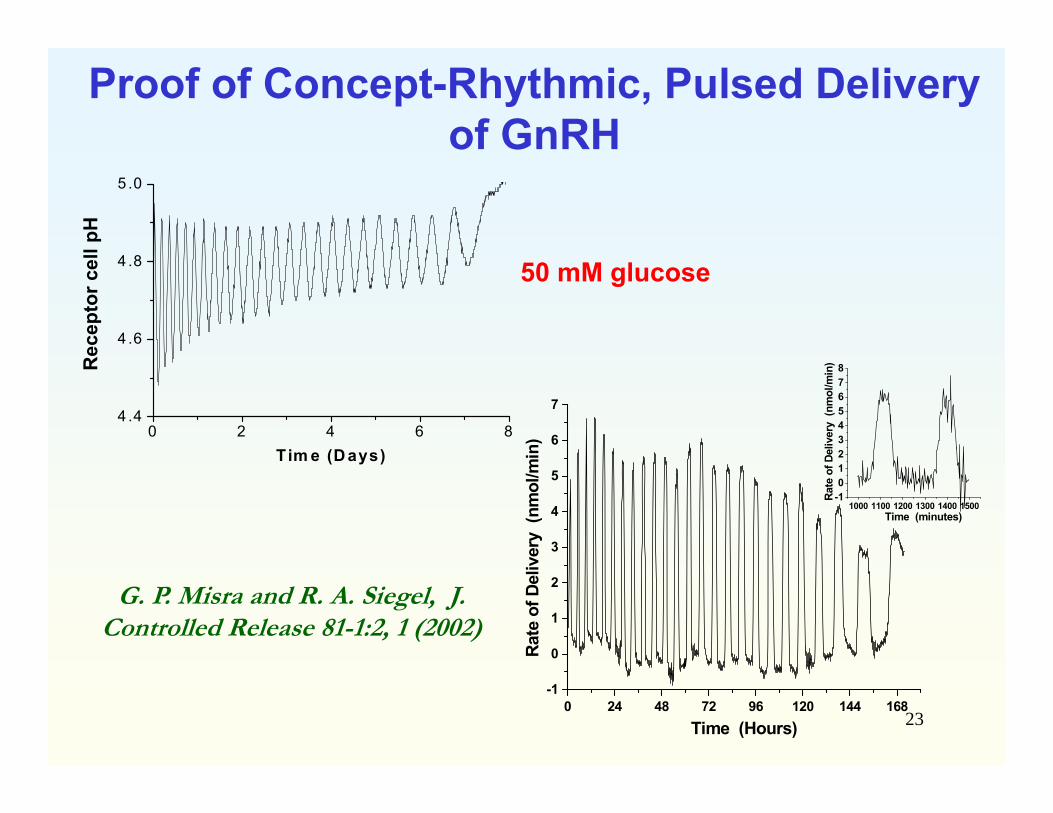
Proof of Concept-Rhythmic, Pulsed Delivery of GnRH
G. P. Misra and R. A. Siegel, J. Controlled Release 81-1:2, 1 (2002)
50 mM glucose
0 2 4 6 84 .4
4 .6
4 .8
5 .0
Rec
epto
r cel
l pH
T im e (D ays)
24
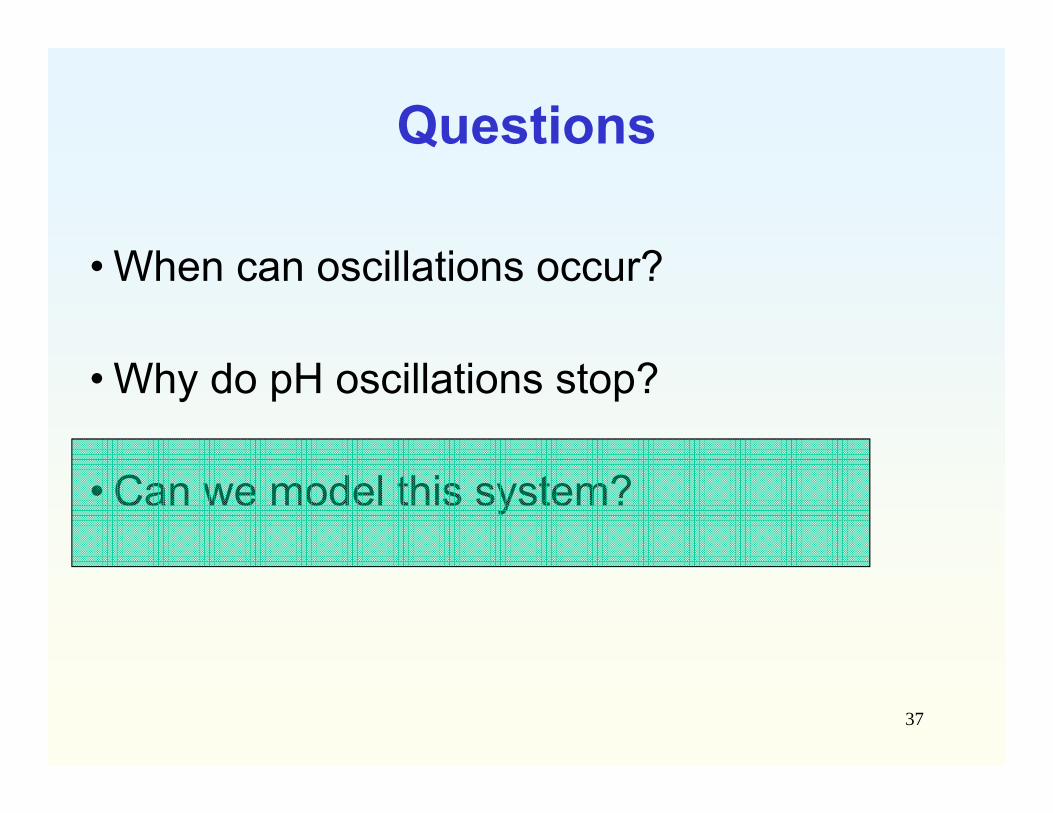
Questions
• When can oscillations occur?
• Why do pH oscillations stop?
• Can we model this system?
25
Parameters We Can Control
• Upstream glucose concentration• Membrane composition (MAA content)• Marble surface area (Heterogeneous reactivity)
• Enzyme concentration (Presently in excess)• Volume of reaction chamber (Fixed for now)
26
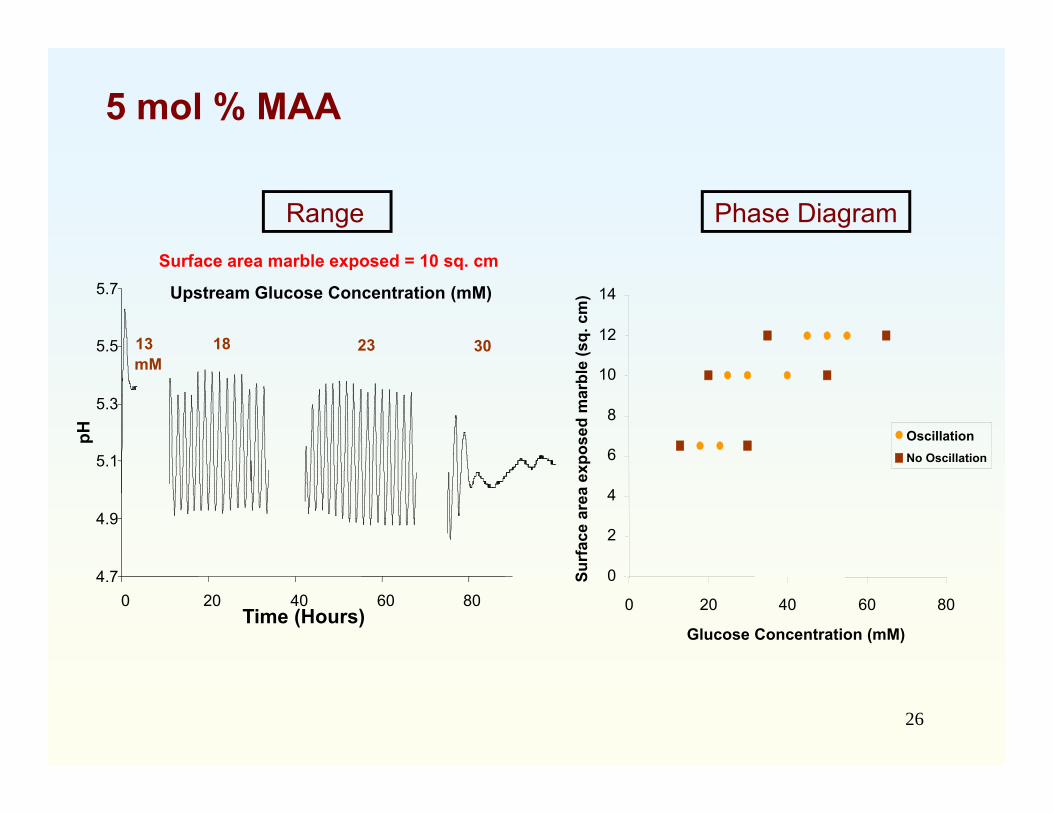
5 mol % MAA
0
2
4
6
8
10
12
14
0 20 40 60 80
Glucose Concentration (mM)
OscillationNo Oscillation
Surf
ace
area
exp
osed
mar
ble
(sq.
cm
)
Range Phase Diagram
4.7
4.9
5.1
5.3
5.5
5.7
0 20 40 60 80
pH
18 23 30 13 mM
Time (Hours)
Upstream Glucose Concentration (mM)
Surface area marble exposed = 10 sq. cm
27
4.2
4.4
4.6
4.8
5
5.2
5.4
5.6
0 20 40 60 80 100 120 140Time (Hours)
pH
33 40 55 70 103 110
0
2
4
6
8
10
12
14
0 50 100 150Glucose Concentration (mM)
Surf
ace
area
exp
osed
mar
ble
(sq.
cm
)
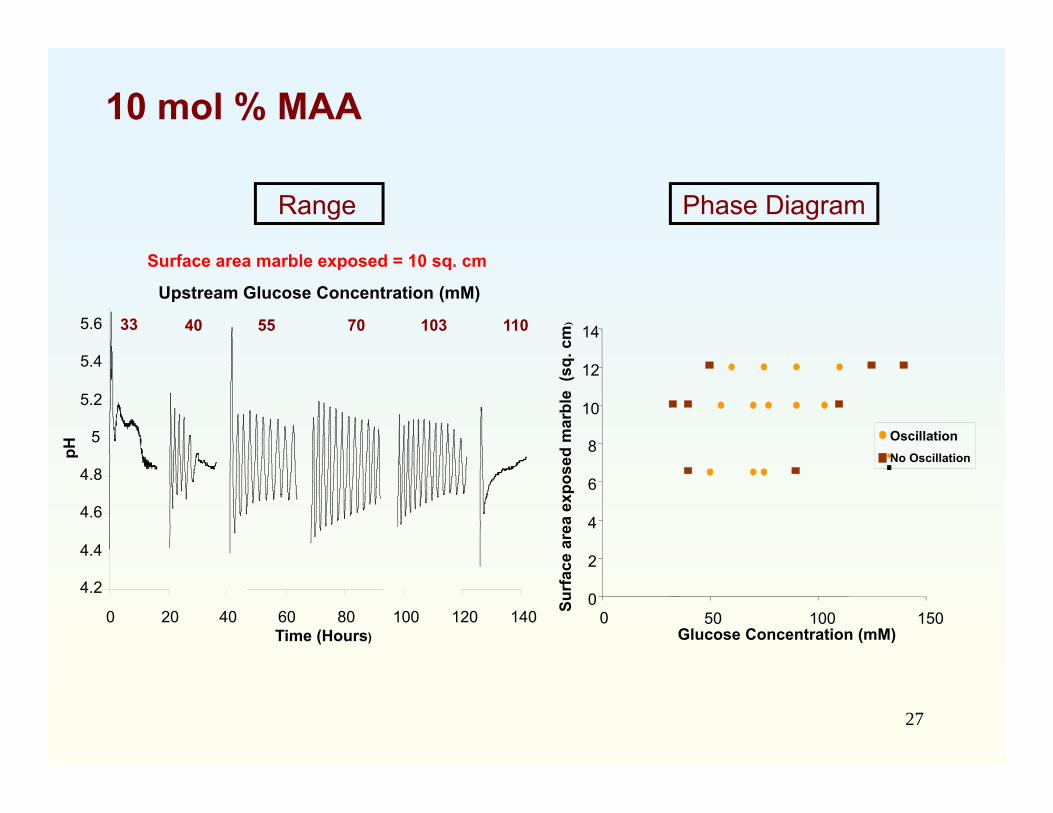
10 mol % MAA
Range Phase Diagram
OscillationNo Oscillation
Upstream Glucose Concentration (mM)
Surface area marble exposed = 10 sq. cm
28
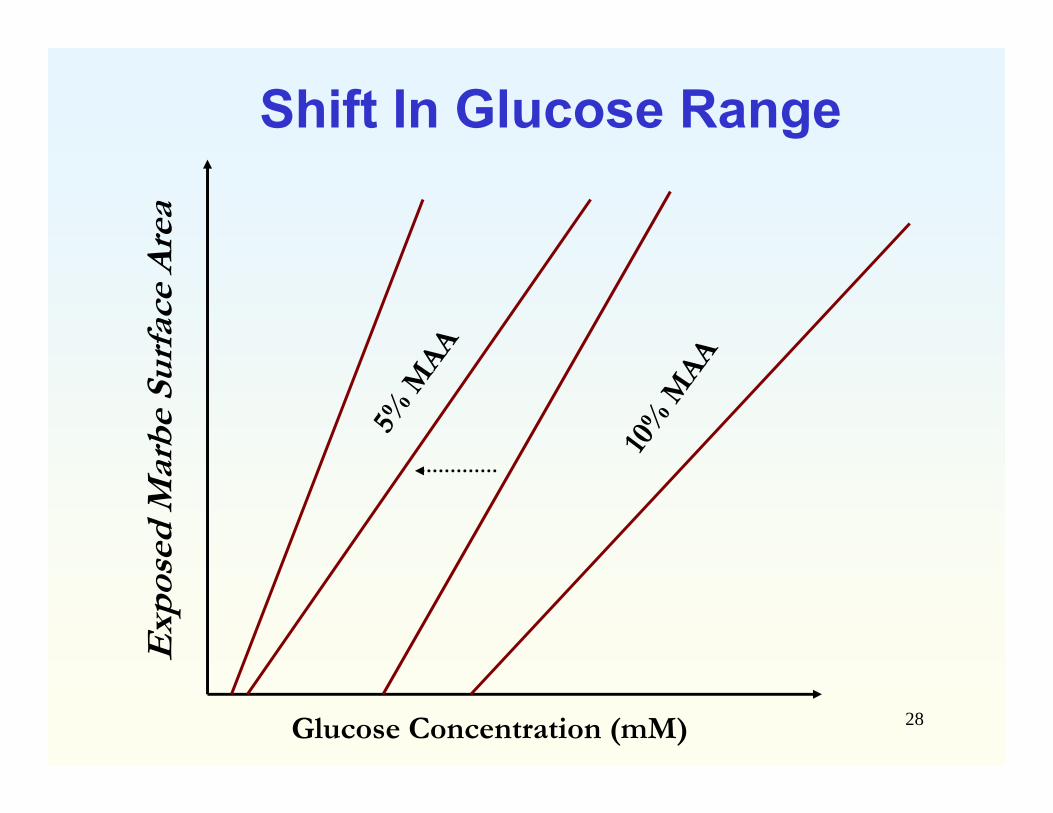
Shift In Glucose RangeE
xpos
ed M
arbe
Sur
face
Are
a
Glucose Concentration (mM)

29
Questions
• When can oscillations occur?
• Why do pH oscillations stop?
• Can we model this system?
30
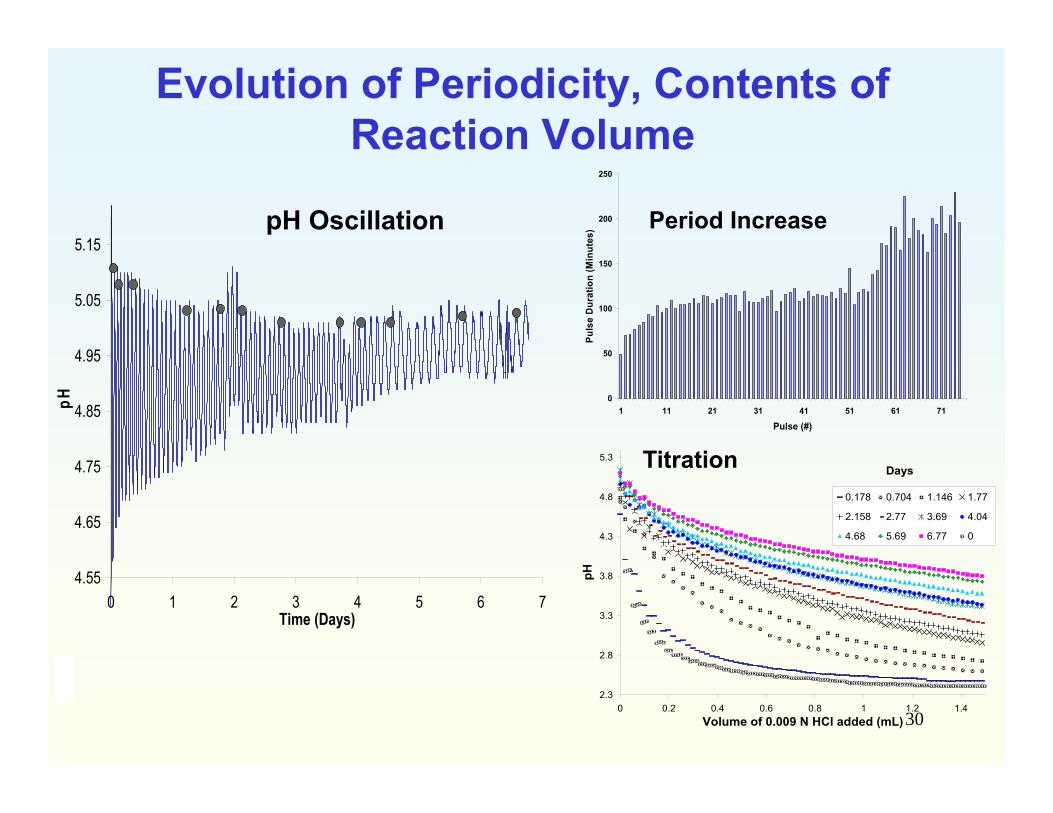
Evolution of Periodicity, Contents of Reaction Volume
4.55
4.65
4.75
4.85
4.95
5.05
5.15
0 1 2 3 4 5 6 7Time (Days)
pH 0
50
100
150
200
250
1 11 21 31 41 51 61 71
Pulse (#)
Puls
e D
urat
ion
(Min
utes
)
2.3
2.8
3.3
3.8
4.3
4.8
5.3
0 0.2 0.4 0.6 0.8 1 1.2 1.4Volume of 0.009 N HCl added (mL)
pH
0.178 0.704 1.146 1.77
2.158 2.77 3.69 4.04
4.68 5.69 6.77 0
Days
pH Oscillation Period Increase
Titration
31
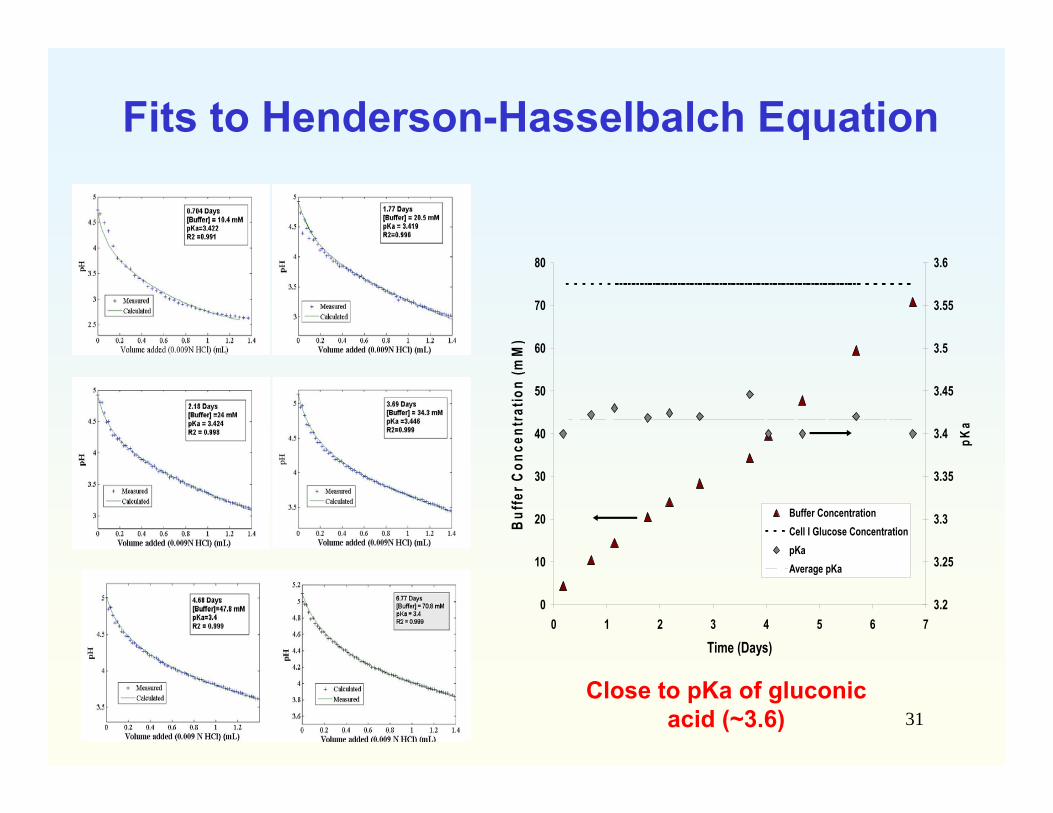
Fits to Henderson-Hasselbalch Equation
0
10
20
30
40
50
60
70
80
0 1 2 3 4 5 6 7
Time (Days)
Buf
fer C
once
ntra
tion
(mM
)
3.2
3.25
3.3
3.35
3.4
3.45
3.5
3.55
3.6
pKa
Buffer ConcentrationCell I Glucose ConcentrationpKaAverage pKa
Close to pKa of gluconic acid (~3.6)
32
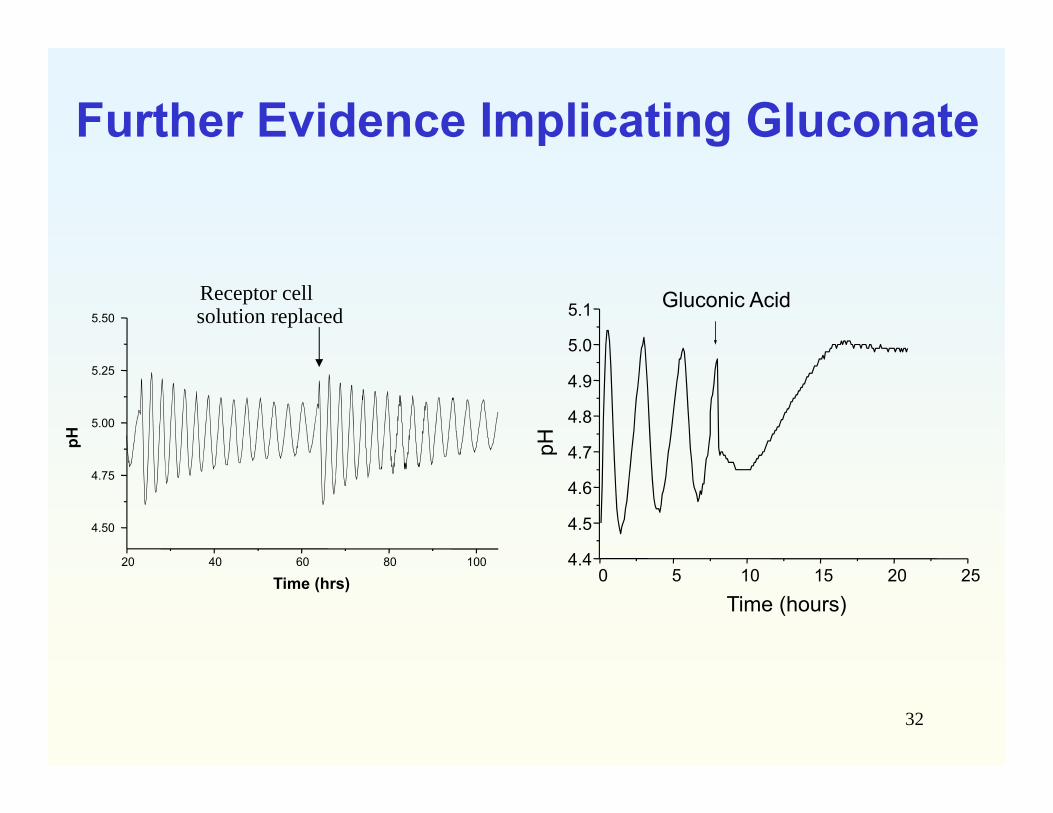
Further Evidence Implicating Gluconate
20 40 60 80 100
4.50
4.75
5.00
5.25
5.50
pH
Time (hrs)
Receptor cellsolution replaced
0 5 10 15 20 254.4
4.5
4.6
4.7
4.8
4.9
5.0
5.1 Gluconic Acid
pH
Time (hours)
33
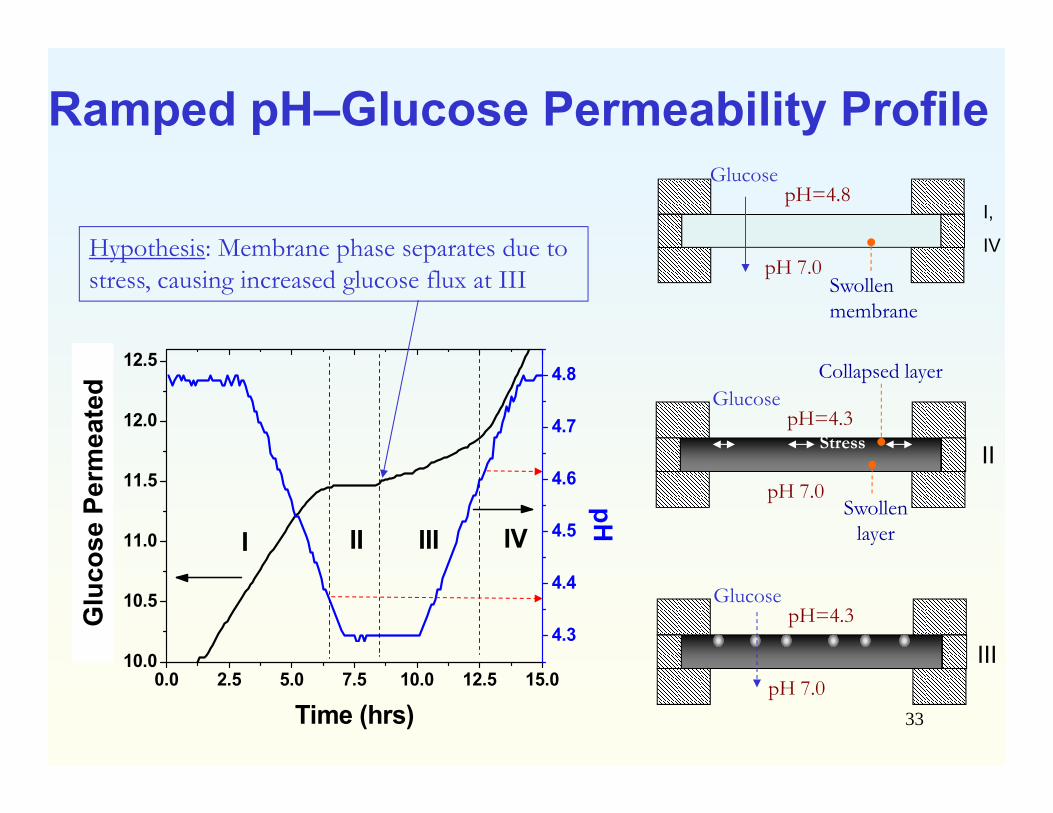
Ramped pH–Glucose Permeability Profile
0.0 2.5 5.0 7.5 10.0 12.5 15.010.0
10.5
11.0
11.5
12.0
12.5
IVIIIII
Time (hrs)
Vol 0
.1N
NaO
H
I
4.3
4.4
4.5
4.6
4.7
4.8
pH
Hypothesis: Membrane phase separates due to stress, causing increased glucose flux at III
Glu
cose
Per
mea
ted
pH=4.3Glucose
pH 7.0III
Swollen membrane
pH=4.8Glucose
pH 7.0
I,
IV
pH=4.3Glucose
pH 7.0Swollen
layer
Collapsed layer
IIStress
34
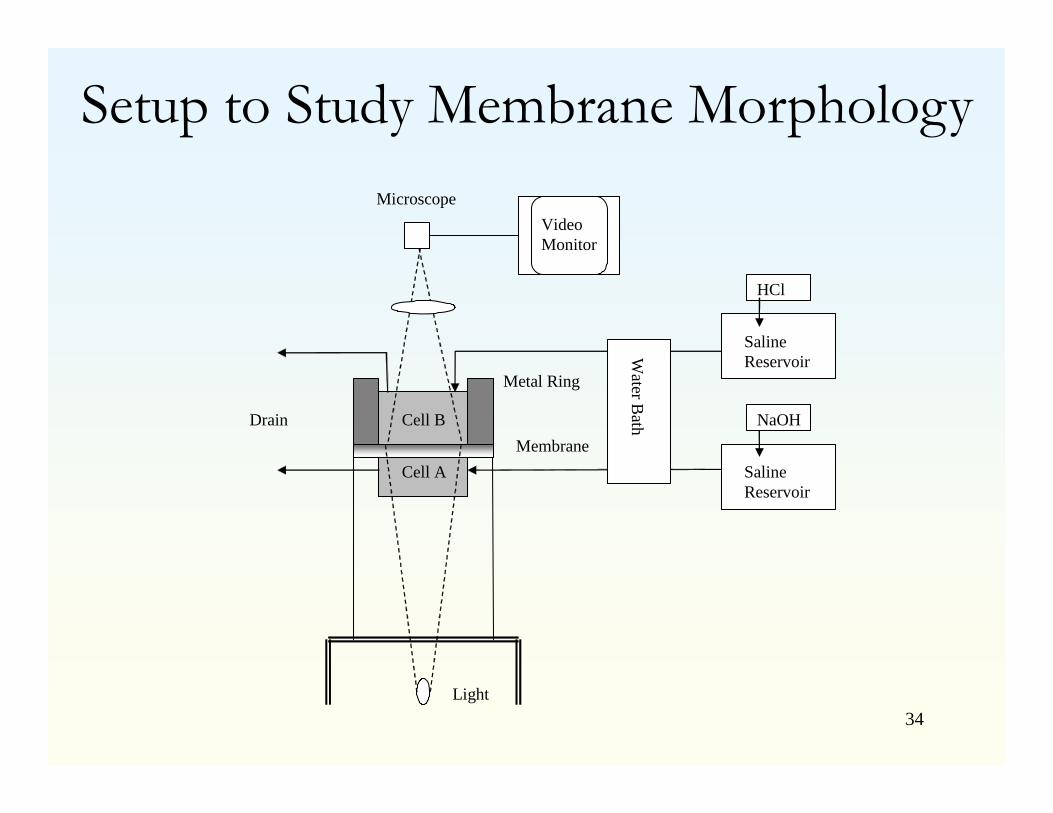
NaOH
HCl
Microscope Video Monitor
Cell B
Cell A
Water B
ath
Light
Drain
Metal Ring
Membrane
Saline Reservoir
Saline Reservoir
Setup to Study Membrane Morphology
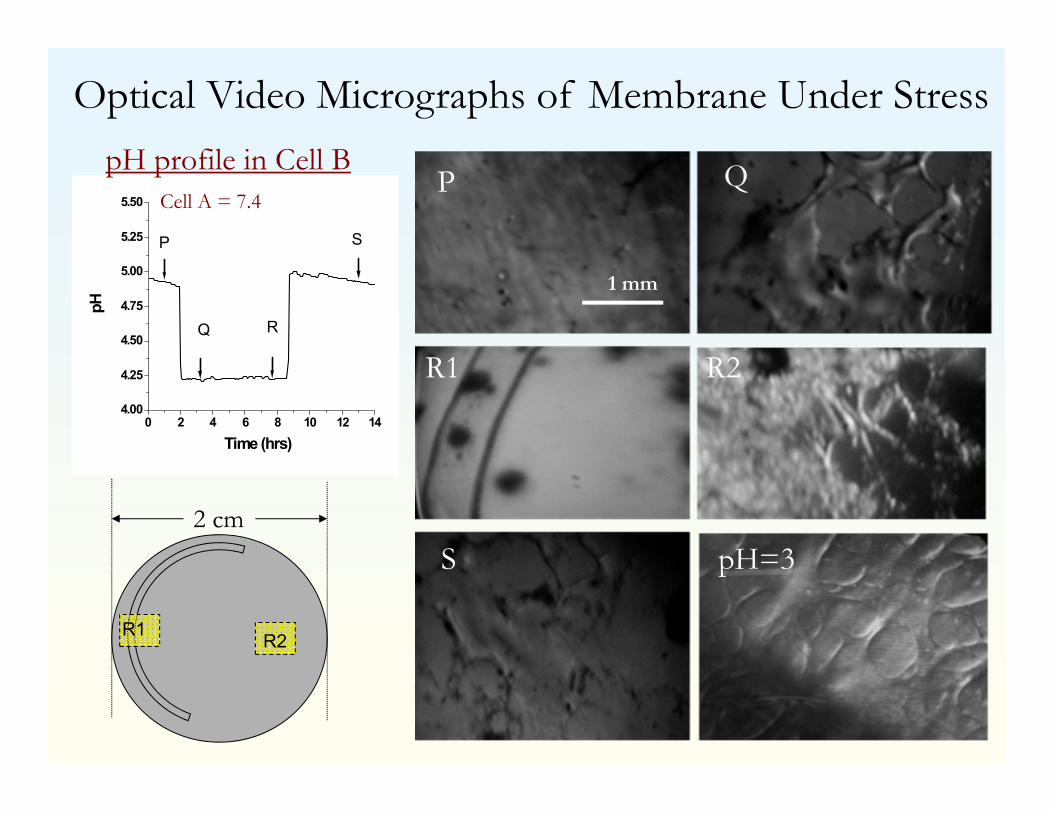
35
1 mm
P Q
R1 R2
S pH=3
Optical Video Micrographs of Membrane Under Stress
0 2 4 6 8 10 12 144.00
4.25
4.50
4.75
5.00
5.25
5.50
S
Q R
P
pH
Time (hrs)
pH profile in Cell BCell A = 7.4
2 cm
R1 R2
36
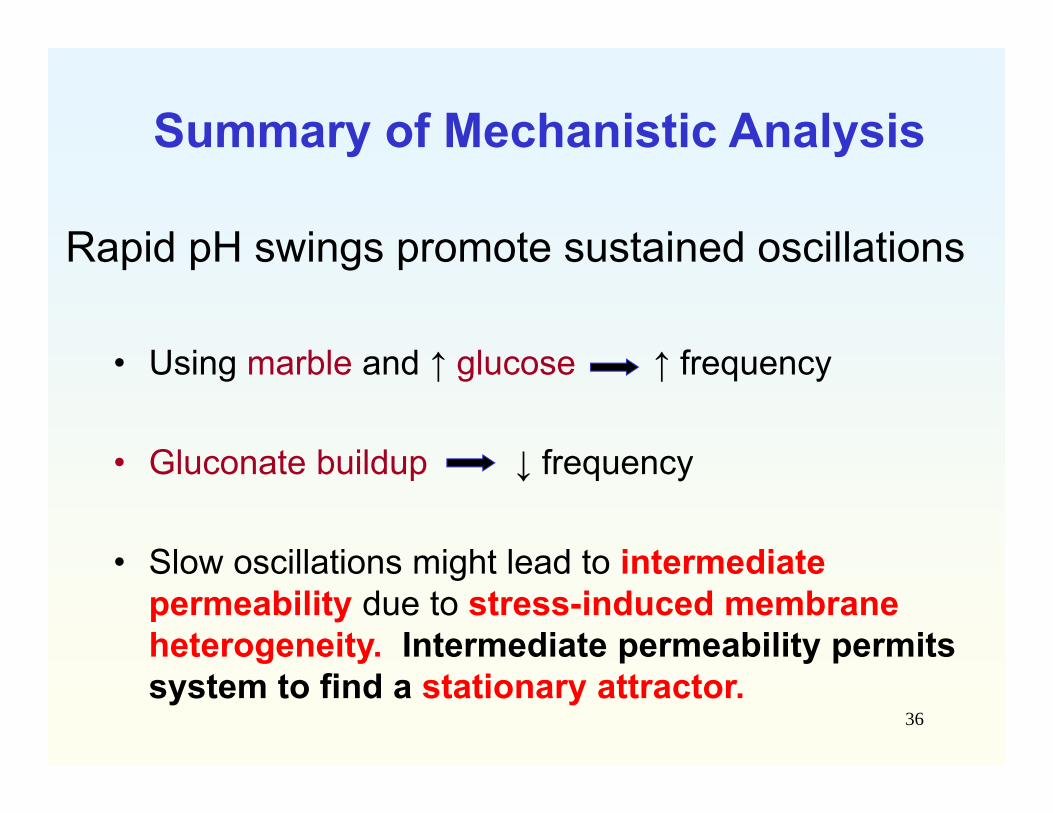
Rapid pH swings promote sustained oscillations
• Using marble and ↑ glucose ↑ frequency
• Gluconate buildup ↓ frequency
• Slow oscillations might lead to intermediate permeability due to stress-induced membrane heterogeneity. Intermediate permeability permits system to find a stationary attractor.
Summary of Mechanistic Analysis
37
Questions
• When can oscillations occur?
• Why do pH oscillations stop?
• Can we model this system?
38
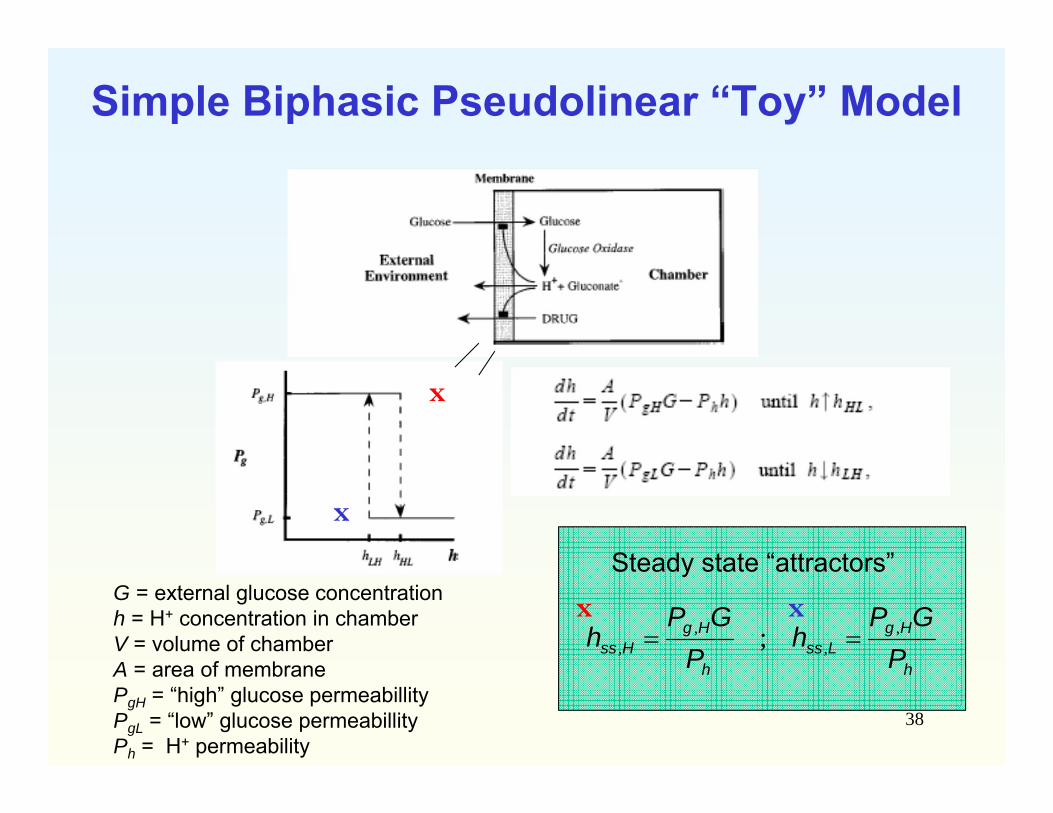
Simple Biphasic Pseudolinear “Toy” Model
Steady state “attractors”
h
HgLss
h
HgHss P
GPh
PGP
h ,,
,, ;
x
x
x
xG = external glucose concentrationh = H+ concentration in chamberV = volume of chamberA = area of membranePgH = “high” glucose permeabillityPgL = “low” glucose permeabillityPh = H+ permeability

39
Characteristics of Biophasic Pseudolinear “Toy” Model
Criterion for Oscillations
TH
TLPgL
PgH
HLLss
LHLss
hL
LHHss
HLHss
hH
hhhh
APVT
hhhh
APVT
,
,
,
,
ln
ln
Time Parameters
LHGL
hHL
GH
h hPPGh
PP
40
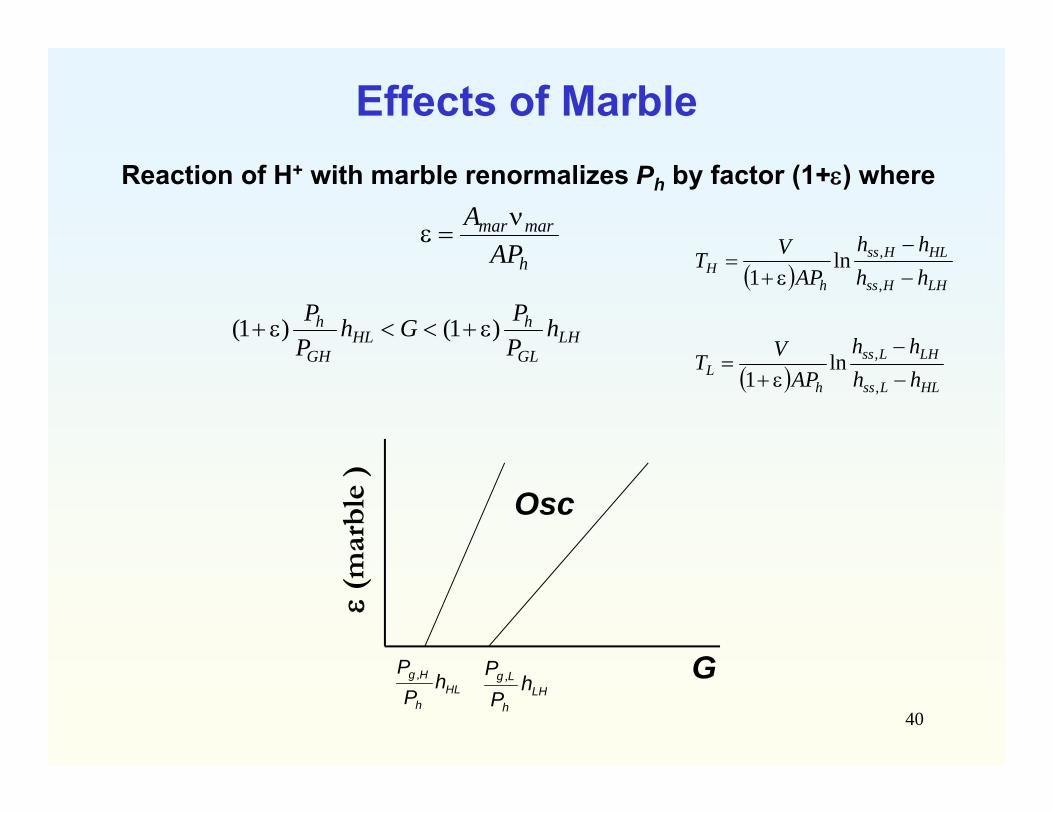
Effects of Marble
h
marmar
APA
Reaction of H+ with marble renormalizes Ph by factor (1+) where
LHh
Lg hPP , G
Osc
(m
arb
le )
HLh
Hg hP
P ,
LHGL
hHL
GH
h hPPGh
PP )1()1(
HLLss
LHLss
hL
LHHss
HLHss
hH
hhhh
APVT
hhhh
APVT
,
,
,
,
ln1
ln1
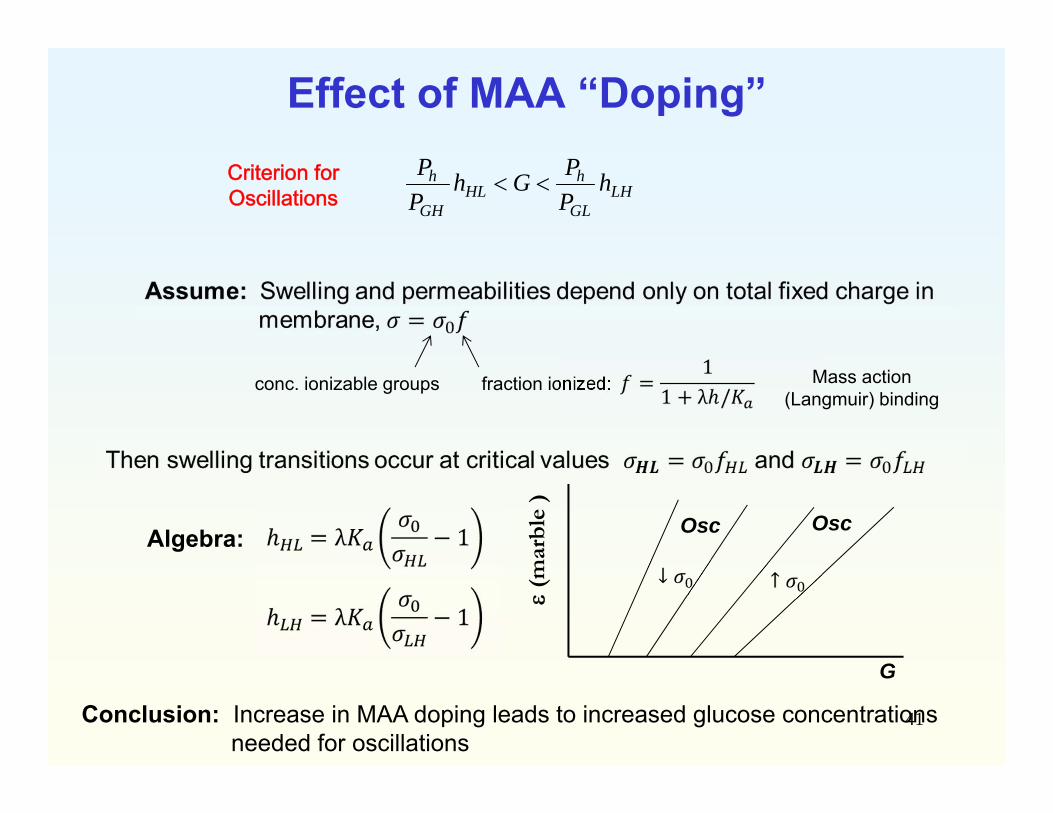
Effect of MAA “Doping”
41
LHGL
hHL
GH
h hPPGh
PP
Criterion for Oscillations
conc. ionizable groups fraction ionized: Mass action (Langmuir) binding
Algebra:
G
Osc
(mar
ble
)Osc
Conclusion: Increase in MAA doping leads to increased glucose concentrations needed for oscillations
42
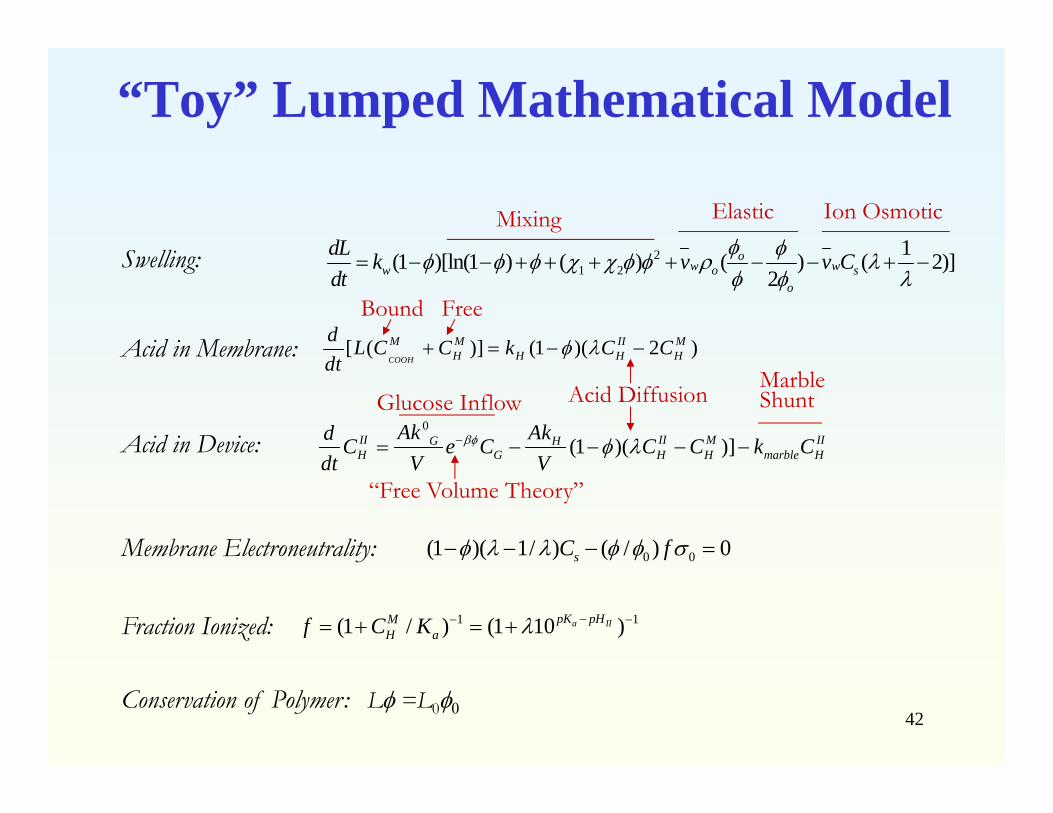
“Toy” Lumped Mathematical Model
21 2
1(1 )[ln(1 ) ( ) ( ) ( 2)]2
ow ww o s
o
dL k v v Cdt
Swelling:
Acid in Membrane: [ ( )] (1 )( 2 )COOH
M M II MH H H H
d L C C k C Cdt
Acid in Device:0
(1 )( )]II II M IIG HH G H H marble H
Ak Akd C e C C C k Cdt V V
0 0(1 )( 1/ ) ( / ) 0sC f Membrane Electroneutrality:
1 1(1 / ) (1 10 )a IIpK pHMH af C K Fraction Ionized:
Conservation of Polymer: L =L0
Mixing Elastic Ion Osmotic
Bound Free
Acid DiffusionGlucose Inflow
“Free Volume Theory”
Marble Shunt
43
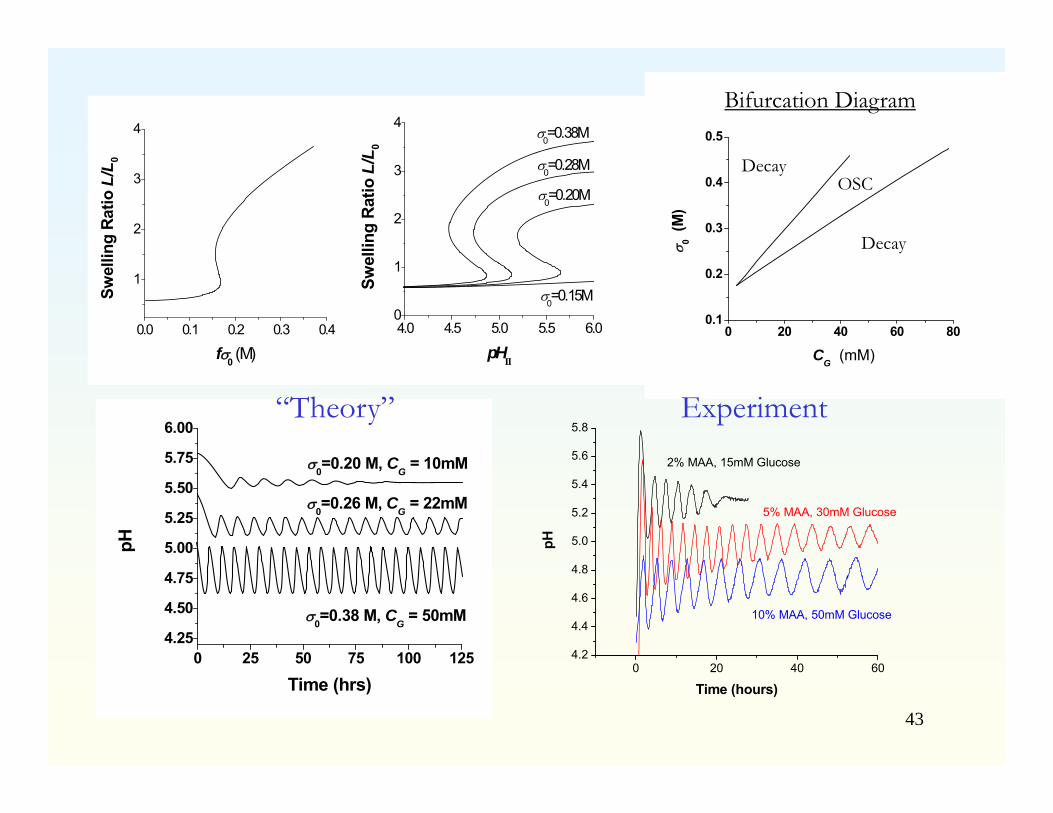
0.0 0.1 0.2 0.3 0.4
1
2
3
4Sw
ellin
g R
atio
L/L
0
f0 (M)4.0 4.5 5.0 5.5 6.00
1
2
3
4
0=0.28M
0=0.20M
0=0.15M
0=0.38M
Swel
ling
Rat
io L
/L0
pHII
0 20 40 60 800.1
0.2
0.3
0.4
0.5
U
S
S
0 (M
)
CG (mM)
OSC
DecayDecayDecay
Decay
Bifurcation Diagram
0 25 50 75 100 1254.25
4.50
4.75
5.00
5.25
5.50
5.75
6.00
0=0.20 M, CG = 10mM
0=0.26 M, CG = 22mM
0=0.38 M, CG = 50mM
pH
Time (hrs)0 20 40 60
4.2
4.4
4.6
4.8
5.0
5.2
5.4
5.6
5.8
2% MAA, 15mM Glucose
5% MAA, 30mM Glucose
10% MAA, 50mM Glucose
pH
Time (hours)
“Theory” Experiment
44
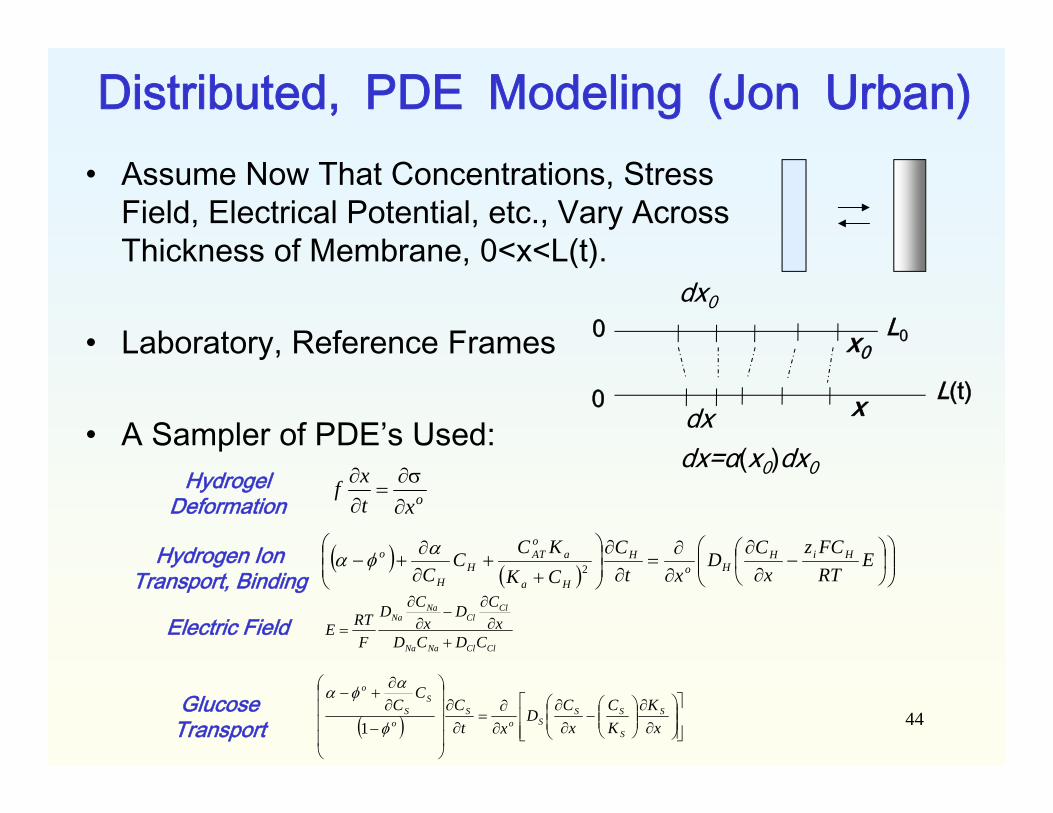
Distributed, PDE Modeling (Jon Urban)• Assume Now That Concentrations, Stress
Field, Electrical Potential, etc., Vary Across Thickness of Membrane, 0<x<L(t).
• Laboratory, Reference Frames
• A Sampler of PDE’s Used:x
x0
dx0
dx=α(x0)dx0
0
0
L0
L(t)
oxtxf
ERTFCz
xC
Dxt
CCKKC
CC
HiHHo
H
Ha
aoAT
HH
o2
ClClNaNa
ClCl
NaNa
CDCDx
CDx
CD
FRTE
xK
KC
xC
Dxt
CC
C S
S
SSSo
So
SS
o
1
Hydrogel Deformation
Hydrogen Ion Transport, Binding
Electric Field
Glucose Transport
dx

45
Some Predictions
00.5
11.5
22.5
33.5
4
0 200 400 600Membrane Coordinate (µm)
α
0 hrs
0.5 hrs1 hr
1.5 hrs
0.E+001.E-052.E-053.E-054.E-055.E-056.E-057.E-05
0 200 400 600Membrane Coordinate (µm)
CH (M
)
0.5 hrs
0 hrs
1 hr1.5 hrs
020406080
100120140160
0 200 400 600Membrane Coordinate (µm)
CA- (
mM
)
0.5 hrs
0 hrs
1 hr1.5 hrs
-1000-500
0500
1000150020002500300035004000
0 200 400 600
Membrane Coordinate (µm)
E (V
/m)
0.5 hrs
0 hrs
1 hr
1.5 hrs

46
Summary• Autonomous, rhythmic, pulsed delivery of GnRH, fueled by
constant level of glucose, has been achieved from hydrogel/enzyme oscillator based on NIPA/MAA membrane and glucose oxidase. Oscillations are due to membrane bistabilityand feedback from enzyme reaction.
• Marble required for sustained oscillations, due to speeding up of membrane transitions.
• Models presented: Simple Relay, ODE, 1-D PDE• Not covered: Oscillations persist for several days but slow down
due to accumulation of gluconic acid, a buffering species, in the chamber. Oscillations halt when oscillations become too slow.
• Halting of oscillations correlated with phase separation (nucleation/growth or spinodal decomposition) in membrane, leading to intermediate permeability to glucose and establishment of stable steady state.
47
Acknowledgments
• NIH, NSF, Amgen• Profs. Carme Calderer, Yoichiro Mori• Postdocs: John Baker, Jean-Christophe Leroux, Gauri Misra, Eric
Nuxoll, Bingtuan Li, Xiaoqin Zou, Lingxing Yao• Graduate Students: Anish Dhanarajan, Siddharthya Mujumdar,
Amardeep Bhalla