Embed Size (px)
Citation preview
BIODESULFURIZATION OF FLUE GASES USING SYNTHESIS GAS DELIVERED AS MICROBUBBLES
Punjai T. Selvarajl, Marshall D. Bredwell, Mark H. Little, and Eric N. Kaufman
Bioprocessing Research and Development Center Oak Ridge National Laboratory
Bldg. 4505, MS 6226 Oak Ridge, Tcnnessee 37831-6226
Keywords: Biodesulfurization, synthesis gas, microbubbles
Introduction Anaerobic treatment processes for biodegradation of hazardous materials have
increasingly been gaining attention in environmental applications. Microbial processes utilizing sulfate reducing bacteria (SRB), in particular, have found potential applications in variety of treatment processes such as flue gas desulfurization [1,2], gypsum reclamation [3], sulfur recovery from sulfitdsulfate wastewater from pulp and paper, chemical and mining industries [4], and degrading explosive materials [51. However, in all these applications, the source of electron donor is a major factor on the economics of the process. Previously, we have proposed a microbial process with sewage digest as an attractive low-cost feedstock for SRB cultures in the desulfurization of flue gases and sulfitdsulfate-laden industrial waste water [6] . In that process, a columnar reactor with mixed SRB cultures immobilized in BIO-SEPm polymeric porous beads with sewage digest as a carbon and energy source exhibited conversion rate of 16.5 mmol sulf i tehl (32 kg/d.m3) with 100% conversion to HzS. Though municipal sewage digest is a readily available low-cost carbon source, the real cost of the medium depends on the location of the sewage treatment plant and power plant and on the transportation involved in bringing the sewage back and forth from the sewage plant. Therefore, the current research has been focused on an alternative low-cost feedstock. Various groups have demonstrated that SRB could be suppo$d by carbon dioxide and/or carbon monoxide as the sole carbon source and hydrogen as the energy source [7-111. Du Preez et al. [8,10] operated a sulfate-reducing reactor with a mixed SRB population to demonstrate the feasibhty of using syn-gas as the feed source for SRB. Recently, van Houten et al. [9] reported the operation of a gas-lift sulfate-reducing reactor that was fed a CO-HZ mixture (up to 20% CO) and yielded a maximum sulfate conversion rate of 30 g SO:/d.L.
In our study, we have focused our research on utilizing gas mixture containing 36% Hz, 47% CO, 10% COZ, 5% CH, and balance Nz as a model coal synthesis gas as a low-cost feedstock. This composition is typical of an oxygen blown, coal fed gasifier. Coal synthesis gas will be readily available in power plants and the biological utilization of syn-gas as a carbon and energy source produces no organic end product that has to be processed prior to its disposal. Coal synthesis gas is, however, sparingly soluble in aqueous phase. Our process utilizing SRB with syn-gas feedstock may be. mass transfer limited and methods to enhance the mass transport have been investigated. A CSTR with cell recycle and a trickle bed reactor with cells immobilized in BIO-SEPm polymeric beads were operated with syn-gas feedstock to obtain maximum productivity for Sa reduction to H2S. The CSTR reactor was then fed with syn-gas as microbubbles in an effort to improve the mass transfer properties.
Materials and Methods Microbial Culture and Media
Mked SRB cultures were originally isolated from sewage solids obtained from the DAF unit of a municipal sewage treatment plant at Oak Ridge, TN. The cultures were grown in lactic acid media (LA) which consists of 3.6 g/L citric acid, 0.8 g/L CaCI,, 1.0 glL NH4C1, 0.5 g/L KzHPO~, 1.0 g/L yeast extract, 0.52 g/L FeCIz, 5.8 mUL of sodium lactate (60% syrup), 0.518 mUL butyric acid, and 0.05 g/L cysteine HCL. A minimal salts media (MS) was also used; 1.2 glL NazHP04, 1.8 g/L KH2P04, 0.7 g5 MgCl2, 0.2 glL NHdCl, 0.04 g/L FeCl,, 50 mUL mineral water, 0.2 muL Batch vitamin solution, and 15 mUL heavy metal solution (HMS). The Batch vitamin solution contains the following: 2.0 mg/L biotin, 2.0 mg/L folic acid, 10.0 mg/L pyridoxine hydrochloride, 5.0 m g 5 thiamine
755
hydrochloride, 5.0 mg/L riboflavin, 5.0 mgL nicotinic acid, 5.0 mg/L DL-calcium pantothenate, 0.1 mgL vitamin B-12,5.0 mgL p-amino benzoic acid, and 5.0 mg/L lipoic acid. The HMS solution contains the following: 1.5 @L EDTA, 0.1 g/L ZnS04.7Hzo and 6 mLn of a trace element solution (0.0507 g/L AlCl,, 0.139 gJL KI, 0.139 g/L KBr, 0.139 gJL LiC1, 3.060 g/L &BO,, 0.280 g/L ZnClz, 0.326 g/L CuClz.2Hz0, 0.513 g/L NiCl2.6Hz0, 0.513 gL CoClz.6Hz0, 0.139 g/L SnClp2Hz0, 0.163 g/L BaClz-2Hz0, 0.139 g/L NazMo04.2Hz0, 0.139 gL CuSe0~5H20, and 0.024 g/L NaVO3).
In serum bottles, the sulfate source was provided by the addition of up to 4.0 fi of Na2S04 or MgSOA. In the reactors, the sulfite source was provided hy a gas mixture containing 5% SO2, 5% C02, and balance N2. For growth on synthesis gas, a mixture of 47% CO, 36% Hz, 10% C02, 5% C b , and the balance NZ was used. For serum bottle studies, 100 mL of MS media was put into a -150 mL bottle and sealed with butyl rubber stopper. A nitrogen headspace was placed on top of the media and the bottles were sterilized by steam. When inoculated from an actively growing culture in a 2 L chemostat, synthesis gas was bubbled through the culture. The headspace was monitored for synthesis gas components and hydrogen sulfide and was replenished with fresh synthesis gas when needed. The bottles were usually shaken at 100 rpm at 30°C.
Syn-Gas Utilization by Mixed SRB Utilization of syn-gas by mixed SRB culture developed from municipal sewage
was investigated in a serum bottle containing minimal salt medium and So2 as terminal electron acceptor. The head space of the bottle was then fded with synthesis gas mixture containing 36% Hz, 47% CO, 10% COz, 5% C b , and balance Nz. The bottle was inoculated with mixed SRB culture and incubated at 30°C with shaking at 200 rpm. The syn-gas concentration was then regularly monitored using a Gas Chromatograph as described below.
Microbubble Generation and Characterization Microbubbles are small, surfactant coated bubbles of gas that are generated by
creating a gas-liquid interface in a high-shear zone. The bubbles are between 50 p n and 100 pm in diameter and the surfactant coating helps to prevent coalescence by electrostatic repulsion from the diffuse electric double layer around the bubble. In our work, the microbubble dispersions were generated using a spinning disk apparatus fust described by Sebba [12]. This microbubble generator (MBG) uses a high speed motor (Talboys #37830, Cole Parmer, Chicago, IL) that spins a 4 cm disk as speeds above 4ooo RPM in close proximity to baffles (within 3 nun) to generate a localized high-shear zone. The stainless steel disk and baffles are mounted in 4 L glass vessel with a ground glass lip to fit the headplate. A second headplate mounted above the fxst supports the motor and allows easy alignment. Stainless steel sealed bearings insure minimal wobble.
The bubble size measurements were performed on a Coulter LS 130 particle size analyzer (Coulter) using laser dlfCraction. The microbubble foam sample was loaded into both the constant volume module and hazardous fluids module for the instrument. The constant volume module could contain 15 mL of sample and had a magnetic stirrer in the bottom of the cell to maintain a well-mixed system. The hazardous fluids module used a recirculating pump. Dispersion was added to water in each module until 8% to 12% obscuration was obtained. Data was collected for ninety seconds in each case. Between runs the constant volume module was rinsed with double distilled water and the hazardous fluids modules had the recirculating liquid drained, refilled, and filtered.
CSTR and Trickle Bed Reactors A 2 L Virtis Omni-culture chemostat (Virtis Co., Gardiner, NY) with temperature
and agitation control was used as the primary reactor vesseL The vessel headplate was modified for acid/base additions and gas and liquid inlets and outlets. The pH was controlled at 6.8 with a Chemcadet controller with 6 NNaOH and 6 N H3P04. The reactor was maintained at a temperature of 30°C and agitated at 250 rpm for all experimental m. The reactor was operated in a continuous mode with a feed rate of fresh MS medium at 0.2 d m i n . To retain biomass in the reactor, a filtration system consisted of two Amicon Diano hollow fiber cartridges was attached to the reactor. All pumps used were Mastertlex peristaltic. A sparge of 50 mUmin of nitrogen was added to the reactor vessel to strip off the produced H2S from the reactor. The synthesis gas was fed directly at a rate
756
of 10 mUmin to the reactor during the control runs through a stainless steel sparger. The flow rate of SO2 gas fed separately into the reactor was monitored using gas flow meter. In the microbubble-fed system, the permeate from the fdters was returned to the MBG. the sp-gas microbubbles were generated by bubbling syn-gas into minimal salt medium containing Tween-20 (240 m a ) as surfactant. The microbubbles were then fed to the CSTR at a rate of 15 mU min. which was equivalent to 10 &min of synthesis gas as fed during the control run.
The trickle bed reactor consisted of fully jacketed glass column of internal dimensions 2.5 x 30 cm with a total volume of 180 mL and a working volume of 81 mL with BIO-SEPTM beads. BIO-SEPm beads, encapsulated activated carbon (5040%) in aromatic polyamide (Aramid) (20-50%) were obtained as the kind gift of Dr. Carl Camp from the DuPont Chemical Co. (Glasgow, DE). The reactor was operated at a temperature of 30°C. A 500 mL bottle with a specially made headplate was used for pH control, H2S stripping by nitrogen, gas outlet, and ports for continuous operation. The reactor had biomass loaded on to the BIO-SEP beads by operation in a packed bed mode on lactate media. The liquid inside of the reactor was completely recycled. When switched to a synthesis gas feed, the reactor was operated in a trickle bed mode with the liquid and both gas feeds entering at the top of the reactor. Gas samples were taken from a gas disengagement bottle. The reactor was operated in a continuous mode with a fresh minimal salt medium at a feed rate of 12 mUh. In trickle bed mode, the liquid flow rate across the bed was 600 mLh.
In all runs the reactor was monitored for sulfite. The off-gas from the reactor was also monitored for HIS and synthesis gas components. The off-gas flow rates were monitored with a wet test meter for two hour periods.
Analytical The sulfite in the reactor was anal@ spectrophotometrically by the reaction of
fuchsin and formaldehyde in sulfiuic acid [ 131. The sulfide in the reactor was precipitated using zinc acetate in a basic solution followed by resuspension and measurement using the formation of methylene blue [14].
Hydrogen sulfide in the off gas was anal+ using a gas chromatograph (Hewlett Packard HF' 5890 Series 11) equipped with a teflon column (30 in x 1/8 in) packed with Super Q (80/100 mesh) (Alltech, Waukeegen, WI). Temperatures of the column, injection port, and thermal conductivity detector were 70°C. 125°C. and 125°C respectively. The carrier gas was helium at 25 mllmin. The calibration was based on 1%. 5%, and 10% H2S in nitrogen standards. Synthesis gas components were measured using a gas chromatograph (Hewlett Packard HP 5890 Series 11) equipped with a HP PLOT molecular sieve 5 A capillary column (30 m x 0.32 m) with a 12 pm 6lm thickness. Temperatures on the column, injection port, and thermal conductivity detector were 55°C. 100°C, and 240°C respectively. Liquid samples were filtered through a 0.22 pn syringe fdter and analyzed by gas chromatography using a HP 5890 Series II with a HP WAT (crosslinked PEG) cap* column (30 m x 0.53 mm) with a 1.0 pm film thickness. The column temperature program was initially 70°C followed by ramping to 200°C at 25"Wmin with a 1.2 min hold then followed by ramping to 225°C at 25"Umin with a 3.0 min hold. The injection port temperature was 245°C while the flame ionization detector was 265°C.
Results and Discussion Syn-Gas Utilization by Mixed SRB
Initially, a decrease in CO concentration was observed with no change in H2 concentration. However, hydrogen sulfide was detected during this time in the head space of the serum bottle. This indicates that the CO was utilized by certain type of bacteria and produced HZ as shown in the equation below:
CO + H20 + Hz + COz
With limited SO2 reduction due to a possible CO inhibition at higher concentration, the Hz concentration declined only after the CO concentration was less than about 5% in the mixture. This suggests that the mixed culture developed from sewage solids would be
757
able to use CO as sole carbon and energy source and produce Hz. Kinetically, the CO utilization was much faster than HZ utilization by SRB cultures.
Serum bottle experiments with mixed SRB showed that we could switch between lactate and syn-gas for carbon and energy source that would help us to start the reactor operation moe quickly.
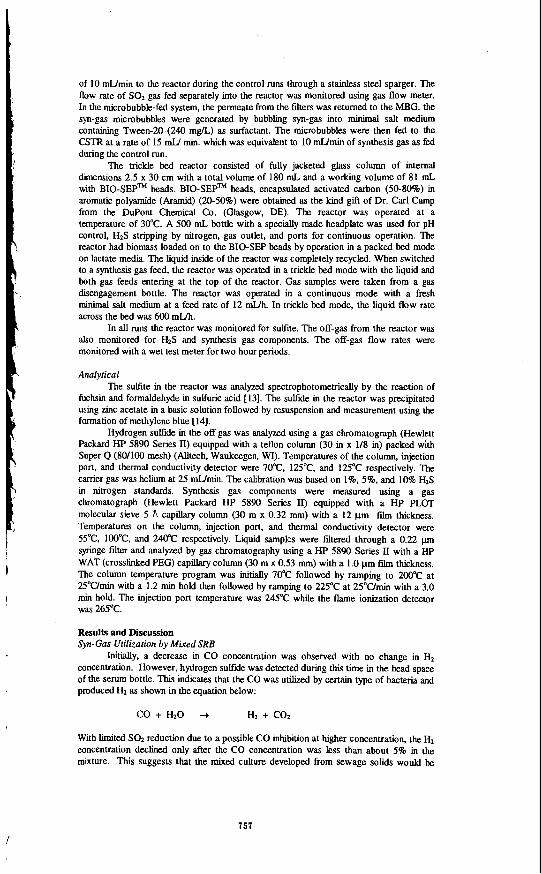
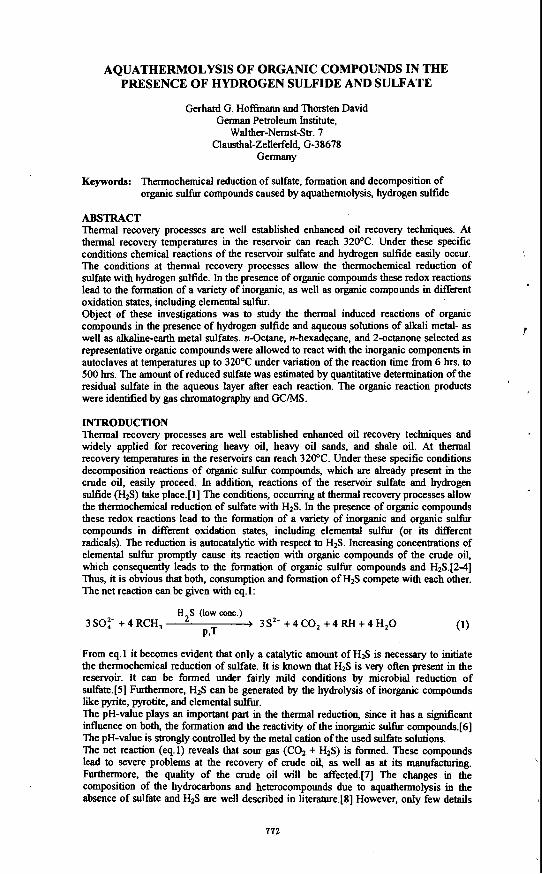
CSTR with syn-gas feed The CSTR in the control mode in which the syn-gas was fed directly into the
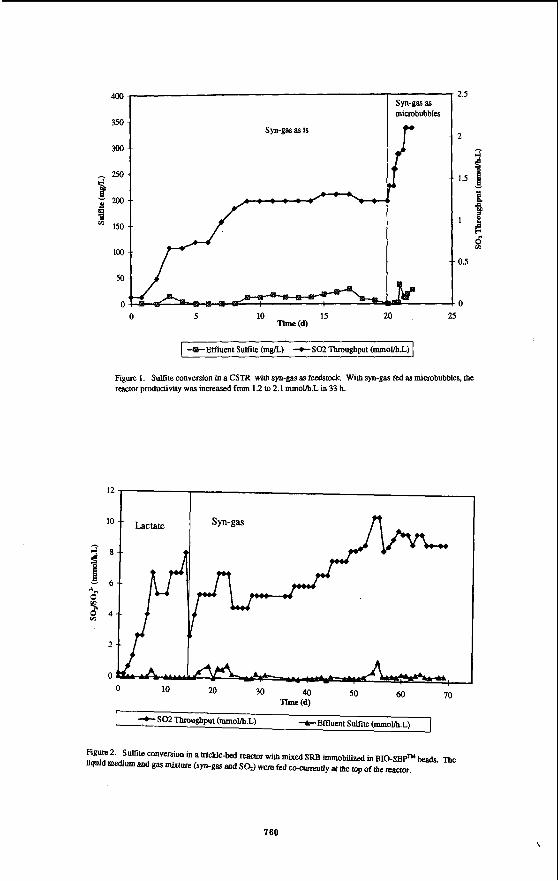
reactor was able to convert 1.2 mmol S0fi.L with no sulfite detected in the effluent (Fig. 1). The off-gas analysis through GC showed 100% conversion of Sa into H2S. With continuous Nz purging in the liquid medium, the sulfide concentration in the aqueous phase was measured to be less than 5 mgiL. When the SO2 feed was increased above 1.2 mmol/h.L, sulfite accumulation of greater than 25 mg/L was observed in the reactor medium. This indicated that the reactor reached the maximum productivity of 1.2 mmol S0Jh.L under the operating conditions. The synthesis gas content in the feed and the off- gas showed the stoichiometric conversion of 1.8 mol HZ and 2.3 mol CO per mol of Sa. The reactor was then operated at 1.2 mol/h*L, for 3 d and switched over to microbubble-fed system. With syn-gas fed as microbubbles, the SO2 feed rate was increased incrementally and the maximum productivity of 2.1 mm0llh-L was obtained with 100% conversion to HzS in 33 h. The biomass concentration in the reactor prior to the microbubble operation was 5 g/L. The increase of productivity from 1.2 to 2.1 mmol/h*L within the span of 33 h at the same biomass concentration of 5 g/L indicated that the mass transport of syn-gas was the limiting parameter in the above process.
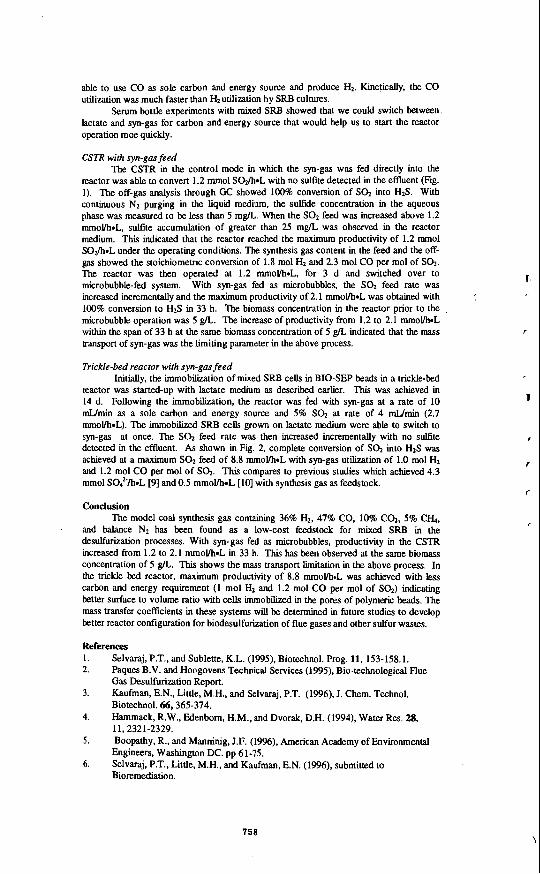
Trickle-bed reactor with syn-gas feed Initially, the immobilization of mixed SRB cells in BIO-SEP beads in a trickle-bed
reactor was started-up with lactate medium as described earlier. This was achieved in 14 d. Following the immobilization, the reactor was fed with syn-gas at a rate of 10 mUmin as a sole carbon and energy source and 5% Sa at rate of 4 d m i n (2.7 mmovh-L). The immobilized SRB ceUs grown on lactate medium were able to switch to syn-gas at once. The Sa feed rate was then increased incrementally with no suffite detected in the effluent. As shown in Fig. 2, complete conversion of Sa into H2S was achieved at a maximum SO2 feed of 8.8 mmovh-L with syn-gas utilization of 1.0 mol Hz and 1.2 mol CO per mol of Sa. This compares to previous studies which achieved 4.3 mmol SO:-/h*L [9] and 0.5 m m o l h l [lo] with synthesis gas as feedstock.
Conclusion The model coal synthesis gas containing 36% Hz, 47% CO, 10% C02, 5% CH.,,
and balance Nz has been found as a low-cost feedstock for mixed SRB in the desulfurization processes. With syn-gas fed as microbubbles, productivity in the CSTR increased from 1.2 to 2.1 mmol/h*L in 33 h. This has been observed at the same biomass concentration of 5 a. This shows the mass transport limitation in the above process. In the trickle bed reactor, maximum productivity of 8.8 mmol/h.L was achieved with less carbon and energy requirement (1 mol HZ and 1.2 mol CO per mol of Sa) indicating better surface to volume ratio with cells immobilized in the pores of polymeric beads. The mass transfer coefficients in these systems will be determined in future studies to develop better reactor configuration for biodesulfurization of flue gases and other sulfur wastes.
References 1. 2.
3.
4.
5.
6.
Selvaraj, P.T., and Sublette, K.L. (1995). Biotechnol. Prog. 11, 153-158.1. Paques B.V. and Hoogovens Technical Services (1995). Bio-technological Flue Gas Desulfurization Report. Kaufman, E.N., Little, M.H., and Selvaraj, P.T. (1996), J. Chem. Techno]. Biotechnol. 66,365-374. Hammack, R.W., Edenborn, H.M., andDvorak, D.H. (1994), Water Res. 28, 11,2321-2329. Boopathy, R., and Manninig, J.F. (1996), American Academy of Environmental Engineers, Washington DC. pp 61-75. Selvaraj, P.T., Little, M.H., and Kaufman, E.N. (1996). submitted to Bioremediation.
I
758
I.
8.
9.
10. 1 1 .
12. 13. 14.
van Houten, R.T., Pol, L.W.H., and Lettinga, G . (1994), Biotechnol. Bioeng. 44, 586-594. Du Preez, L.A., Odendaal, J.P., M a e , J.P., and Posonby, M. (1992), Environ. Techno]. 13,875-882. van Houten R.T., van der Spoel, H., van Aelst, A.C., Hulshoff Pol, L.W., and Lettinga, G. (1996), Biotechnol. Bioeng. 50, 136-144. Du Preez, and Maree, J.P., (1992), Water Sci. Tech. 30,275-285. Kaufman, E.N., Little, M.H., and Selvaraj, P.T. (1996). Appl. Biochem. Biotechnol. (in press). Sebba, F. (1985), Chemistry and Industry, 91-92. Steigman, A. (1950). Anal. Chem. 22,492-493. Tanner, R. S. (1989). J. Microbiological Methods.
759
Syn-gas as is
300
h 250
I
t m E
150
100
50
0
syn-gas as mimbubbles
i 2.5
2
3
1.5 f - !
9 D
OS
0
Figure 1. Sulfite conversion in a CSTR with syn-gas as feedswck. With syn-gas fed as mimbubbles, the reactor productivity was increaSed from 1.2 Io 2.1 mm0Vb.L in 33 b.
Figure 2. S a t e conversion in a trickle-bed reactor with mixed SRFI immobilized in BIO-SEPTM beads. m e liquid medium and gas mixture (syn-ga and S a ) were fed cc-currenUy at the top of the reactor.
760
MICROBIAL DESULFURIZATION O F DIBENZOTHIOPHENE AND ITS DERIVATIVES
Yoshikazu Izumi and Takashi Ohshiro Department of Biotechnology, Faculty of Engineering,
Tottori University, Tottori, 680 JAPAN
Keywords: desulfurization, dibenzothiophene, Rhodococcus
INTRODUCTION
The serious environmental problem of acid rain is at least partly caused by the combustion of sulfur compounds present in the fossil fuels, releasing sulfur dioxide into the atmosphere. Though inorganic sulfur can be reduced by physical or chemical means, none of them can be applied to removing organic sulfur from petroleum. Therefore, microbial processes that can do so have recently received much focus. Dibenzothiophene (DBT) and its derivatives have been widely used as model organic sulfur compounds in petroleum (1). Three pathways of DBT degradation have been reported. The first is the ring-destructive pathway, in which the sulfur of DBT remains (2-59, the second is the completely destructive pathway, in which DBT is mineralized to carbon dioxide, sulfite and water (6). and the third is the sulfur-specific pathway, in which only sulfur is removed from DBT (7-9) as illustrated in Fig. 1. Strains having the second or third pathways should be applied to the microbial desulfurization process. In other studies, we also isolated a DBT-degrading bacterium, Rhodococcus erythropolis D-1, which has the sulfur-specific pathway (IO) and observed an enzyme system catalyzing this conversion ( 1 1). Many research groups have since studied the desulfurization of DBT by the sulfur-specific pathway (12-14) . The genes involved in DBT degradation have been identified (15-17). However, there has so far been little report on the DBT desulfurization in the presence of hydrocarbon. Since petroleum should ideally be desulfurized, we isolated a strain with the capacity to desulfurize DBT in the presence of hydrocarbon. Here we describe the desulfurization of DBT by growing whole cells of Rhodococcus erythropolis H-2 in the presence of n-tetradecane (TD) and other hydrocarbons. We also describe the desulfurization of substituted DBTs which actually exist in petroleum by R. erythropolis H-2 in the presence of TD.
MATERIALS AND METHODS
Medium A-1 was the same as medium A described elsewhere (IO) except that glucose was omitted. Cells were cultivated at 3 0 T in test tubes containing 5 ml of medium or in 2-liter flasks containing 500 ml of medium with reciprocal shaking ( 300 rpm for test tubes and 100 rpm for flasks).
To isolate bacteria which could desulfurize DBT in petroleum, several soil samples from various areas in Japan were transferred to test tubes containing medium A-1 supplemented with 5.4 mM DBT as a sole source of sulfur and 0.5% TD. Single colony isolation was repeated on the same medium containing agar. Among the DBT-utilizing strains in the presence of TD, we selected strain H-2.
Strain H-2 was cultivated in medium A-I with 0.5 % glucose and 0.27 mM DBT in 2-liter flasks for 2 days. Cells were harvested at 4°C by centrifugation at 10,OOO x g for 15 min, washed once with 0.85 % NaCl and resuspended in the same solution. The suspension was lyophilized and kept at -20°C until use. The reaction mixture contained, in 1 ml, TD, DBT which was dissolved in TD, 0.1 M potassium phosphate buffer (pH 7.0) and lyophilized cells. The reaction proceeded in test tubes at 30°C with reciprocal shaking (300 rpm).
DBT and 2-HBP were determined by gas chromatography or high performance liquid chromatography as described (IO). TD was measured by gas chromatography under the same conditions. When the strain was cultivated in the medium with hydrocarbon, the cells floated on the surface of the medium. Therefore, growth could not be measured turbidimetrically. We centrifuged the culture broth at 15,000 x g for 45 min and the cell pellet was resuspended in 0.85% NaCl containing 5% polyoxyethylene lauryl alcohol ether (Brij 35). Cell growth was determined by measuring the optical density of this suspension. OD660 was proven to be proportional to the number of viable cells.
RESULTS AND DISCUSSION
Characterization of a DBT-utilizine bacterium in the presence of hvdrocarbon Among the isolates, a strain designated H-2 utilized DBT most rapidly in the presence of
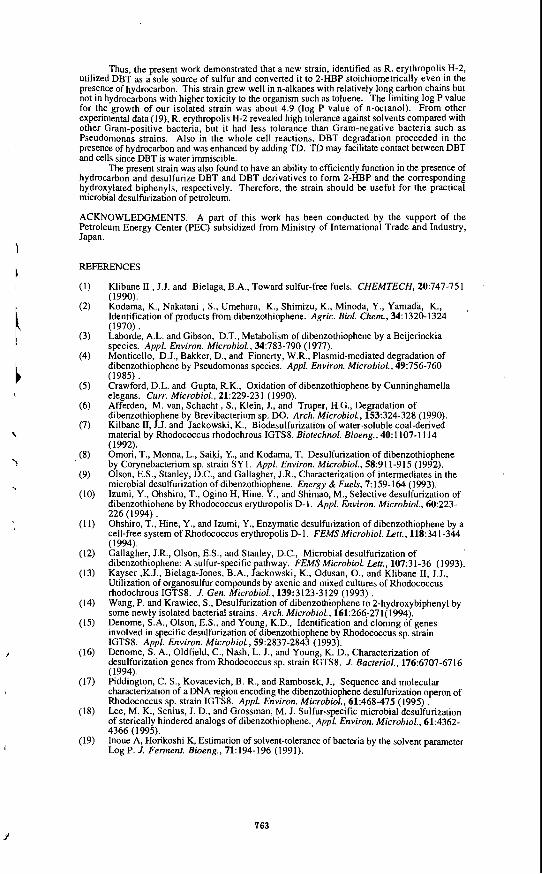
TD. The taxonomic propenies were examined at the National Collection of Industrial and Marine Bacteria Ltd. (Aberdeen. Scotland, United Kingdom). As a result, the strain was identified as Rhodococcus erythropolis. There are some differences between our previous strain D-l (IO) and the present strain H-2 grown on carbon source such maltose, L-tyrosine and D-mannose: In strain H-2, these were possibly positive. Since this strain assimilated TD as a carbon source in addition to DBT as a sulfur source, several hydrocarbons were investigated to determine whether or not they could support the growth of R. erythropolis H-2. As shown in Table I , this strain grew on n- alkanes with carbon chains longer than C8 with and without glucose, whereas it did not grow on n-hexane, styrene, p-xylene, cyclooctane and toluene even in the presence of glucose.
761
Growth of R. ervthrouolis H-2 in the medium containine DBT and TD The strain was cultivated in medium A-I with TD as a sole source of carbon and DBT as a
sole source of sulfur. The strain showed maximal growth (OD660=ca. 3.0) after 2 days of cultivation. DBT completely disappeared before this point. The metabolite 2-HBP was formed from DBT and it was almost equimolar to the amount of DBT degraded. The level of TD decreased slightly, and the pH decreased concomitantly with the increase of cell growth.
DBT degradation bv whole cell reactions To prepare whole cells for DBT degradation, R. erythropolis H-2 was cultivated in medium
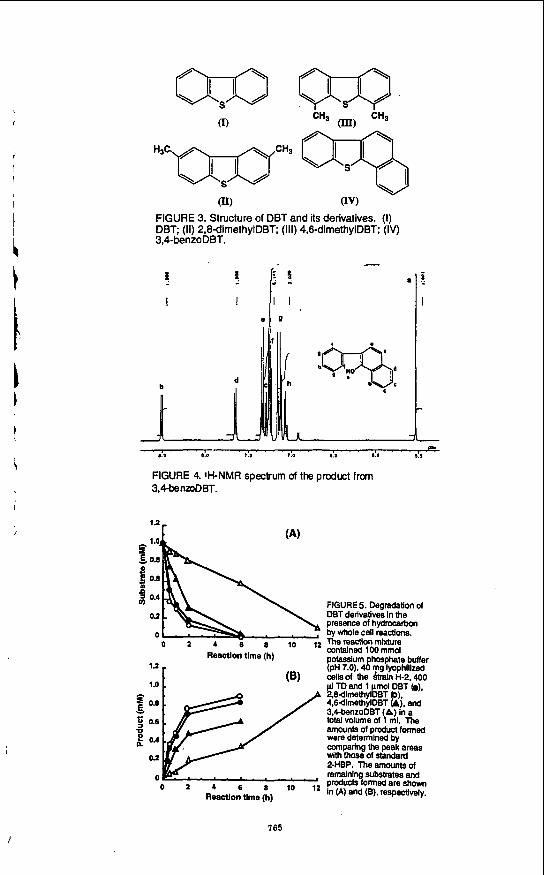
containing either 0.5% glucose or 0.5% TD as a carbon source. Cells were lyophilized after harvesting and used for each reaction by resting cells. When the whole cell reactions proceeded with 50% TD for 4 h, the DBT degradation rates by cells pregrown in glucose and TD were. 60 and 33%, respectively. Therefore, the following studies of whole cells reactions were performed using cells grown in glucose. DBT degradation was investigated using various amounts of lyophilized cells. The reaction proceeded most efficiently when the cells were added to the reaction mixture at a concentration of 80 mg/ml. However, DBT degradation was suppressed in the reaction mixture at elevated concentrations of the lyophilized cells. The limitation of oxygen may lower DBT degradation as found in R. erythropolis D-1 (IO) . DBT degradation in reaction mixtures containing various amounts of TD or DBT were examined. The reaction proceeded more efficiently with, than without TD . Even with as much as 70% TD, the degradation was enhanced compared with the situation without TD. The optimal concentration of TD was about 40%. TD at a concentration higher than 80% suppressed the degradation. In a reaction mixture supplemented with 40% TD and 80 mg/ml of the lyophilized cells, DBT up to 3 m M was completely degraded within 4 h. Figure 2 shows the time course of DBT degradation and 2-HBP accumulation. The amount of 2-HBP formed was almost stoichiometric to that of DBT degraded. It seemed that the level of TD was slightly decreased.
Degradation of DBT and its derivatives bv whole cell reactions R. erythropolis H-2 was cultured in medium AG with DBT or its derivatives (Fig. 3) as the
sole source of sulfur at 50 mg/l. The strain grew more or less on the four aromatic sulfur compounds tested: Growth (OD660) on DBT, 2,8-dimethyldibenzothiophene (2,8-dimethylDBT), 4,6-dimethyldibenzothiophene (4,6-dimethylDBT) and 3,4-benzodibenzothiophene (3,4- benzoDBT) in 4-day culture: 5.7,4.7, and 1.7, respectively. Though 3.4-benzoDBT was not a good sulfur source for this strain, the two dimethylDBTs as well as DBT also supported the growth of this strain.
The reaction using lyophilized cells cultured with DBT, proceeded with DBT derivatives at 1 mM in the presence of TD. New peaks appeared on all the elution HPLC profiles with concomitantly decreasing substrate peaks. When DBT, 3,4-benzoDBT, 2,8-dimethylDBT, and 4,6-dimethylDBT were the substrates, the retention times of the new peaks were 3.5,5.2,4.6, and 5.2 min, respectively. The new peak in the DBT reaction profile corresponded to 2-HBP. The products in the reaction mixture using 2,s-dimethylDBT and 4,6-dimethylDBT as substrates were analyzed by gas chromatograph-mass spectrometry. Mass ions at d z 198 corresponding to the molecular mass of monohydroxy dimethylbiphenyls were detected. With 3,4-benzoDBT, the mass ion of the product at m/z 220 was also obtained. These results indicated that the microbial desulfurization of these DBT derivatives and of DBT proceeded in a similar manner and gave the corresponding hydroxylated biphenyls as products. And it was interesting to know whether the hydroxy group of the 3.4-benzoDBT product was attached to the benzene, or the naphthalene ring. To identify their exact structures, the products from 3,4-benzoDBT, 2.8-dimethyl DBT and 4,6- dimethylDBT were purified from the reaction mixtures and analyzed by NMR.
In the case of 3.4-benzoDBT, signals were observed at d 5.54 (s, 1 H), 7.04-7.09 (m, 1 H), 7.13 (d, 2 H, J=7.5), 7.24-7.25 (m, 1 H), 7.26-7.27 (m, 2 H), 7.29-7.30 (m. 1 H), 7.33 (d, 1, H, J=8.2), 7.35-7.36 (m, I H), 7.65 (d, 1 H, J=8.0), and 8.51 (d, 1 H, J=8.2). Since the signals at 7.07.7.13 and 7.26 ppm were specific for one substituted benzene and those at 7.24 and 7.33 ppm were specific for 1,2,3,4-substituted benzene, this spectrum suggested that the hydroxy group is attached to the naphthalene ring. Therefore, we proposed that the structure of the product from 3,CbenzoDBT is a-hydroxy-b-phenylnaphthalene (Fig. 4).
The NMR signals in the case of 2,8-dimethylDBTand 4.6-dimethylDBT were assigned to Z-hydroxy-5,5'-dimethyIbiphenyl and 2-hydroxy-3,3'-dimethylbiphenyl, respectively.
The amounts of products formed by whole cells were tentatively calculated assuming that the peak areas per mole of each product on the HPLC were the same as that of 2-HBP. Each substrate was thus converted to the corresponding product. The initial rates of degradation and desulfurization of 2,8-dimethylDBT, 4,6-dimethylDBT and 3.4-benzoDBT were about 120, 60, 20% that of DBT. The 2,8- and 4.6-dimethylDBTs were completely degraded within 6 h. Arthrobacter sp. readily attacked the sterically hindered 4.6-diethylDBT (18). Generally, there seems to be no steric hindrance of such alkyl groups against these enzyme systems. The chemical desulfurization rate for alkyl-substituted DBTs is much slower than that for DBT and it has been thought that the desulfurization of alkyl-substituted DBTs would also be less easy than that of DBT. Thus, these results indicate the feasibility of the practical microbial desulfurization of petroleum.
Although 3,4-benzoDBT was degraded slowly, the amount of the substrate was reduced to 0.1 mM after 12 h (Fig. 5). As described above, NMR analysis indicated that the hydroxy group of the identified product was attached to the naphthalene ring. These results suggest that the enzyme system involved in the microbial DBT desulfurization could distinguish between two carbon-sulfur bonds of 3.4-benzoDBT. The steric hindrance caused by the naphthalene ring might lead to this specificity.
r
r,
762
i I
Thus, the present work demonstrated that a new strain, identified as R. erythropolis H-2, utilized DBT as a sole source of sulfur and converted it to 2-HBP stoichiometrically even in the presence of hydrocarbon. This strain grew well in n-alkanes with relatively long carbon chains but not in hydrocarbons with higher toxicity to the organism such as toluene. The limiting log P value for the growth of our isolated strain was about 4.9 (log P value of n-octanol). From other experimental data (19), R. erythropolis H-2 revealed high tolerance against solvents compared with other Gram-positive bacteria, but it had less tolerance than Gram-negative bacteria such as Pseudomonas strains. Also in the whole cell reactions, DBT degradation proceeded in the presence of hydrocarbon and was enhanced by adding TD. TD may facilitate contact between DBT and cells since DBT is water immiscible.
The present strain was also found to have an ability to efficiently function in the presence of hydrocarbon and desulfurize DBT and DBT derivatives to form 2-HBP and the corresponding hydroxylated biphenyls, respectively. Therefore, the strain should be useful for the practical microbial desulfurization of petroleum.
ACKNOWLEDGMENTS. A part of this work has been conducted by the support of the Petroleum Energy Center (PEC) subsidized from Ministry of International Trade and Industry, Japan.
REFERENCES
Klibane I1 , J.J. and Bielaga, B.A., Toward sulfur-free fuels. CHEMTECH, 20:747-751 (1990). Kodama, K., Nakatani , S., Umehara, K., Shimizu, K., Minoda, Y., Yamada, K., Identification of products from dibenzothiophene. Agric. Biol. Chem., 3 4 1320- 1324 (1970). Laborde, A.L. and Gibson, D.T., Metabolism of dibenzothiophene by a Beijerinckia species. Appl. Enuiron. Microbiol., 34:783-790 (1977). Monticello, D.J., Bakker, D., and Finnerty, W.R., Plasmid-mediated degradation of dibenzothiophene by Pseudomonas species. Appl. Enuiron. Microbiol., 49:756-760 (1985). Crawford, D.L. and Gupta, R.K., Oxidation of dibenzothiophene by Cunninghamella elegans. Curr. Microbiol., 21:229-231 (1990). Afferden, M. van, Schacht , S., Klein, J., and Truper, H.G., Degradation of dibenzothiophene by Brevibacterium sp. DO. Arch. Microbiol., 153:324-328 (1990). Kilbane II, J.J. and Jackowski, K., Biodesulfurization of water-soluble coal-derived material by Rhodococcus rhodochrous IGTSI. Biotechnol. Bioeng., 40: 1 107-1 1 14 (1992). Omori, T., Monna, L., Saiki, Y., and Kodama, T. Desulfurization of dibenzothiophene by Corynebacterium sp. strain SY 1 . Appl. Enuiron. Microbiol., 58:911-915 (1992). Olson, E.S., Stanley, D.C., and Gallagher, J.R., Characterization of intermediates in the microbial desulfurization of dibenzothiophene. Energy & Fuels, 7: 159- 164 (1993). Izumi, Y., Ohshiro, T., Ogino H, Hine, Y., and Shimao, M., Selective desulfurization of dibenzothiohene by Rhodococcus erythropolis D- I . Appl. Environ. Microbiol., 60:223- 226 (1994) . Ohshiro, T., Hine, Y., and Izumi, Y., Enzymatic desulfurization of dibenzothiophene by a cell-free system of Rhodococcus erythropolis D- 1, FEMS Microbiol. Left., 118:341-344 ( 1994). Gallagher, J.R., Olson, E.S., and Stanley, D.C., Microbial desulfurization of dibenzothiophene: A sulfur-specific pathway. FEMS Microbiol. Lett., 107:31-36 (1993). Kayser ,K.J., Bielaga-Jones, B.A., Jackowski, K., Odusan, 0.. and Klibane 11, J.J., Utilization of organosulfur compounds by axenic and mixed cultures of Rhodococcus rhodochrous IGTSS. J . Gen. Microbiol., 139:3123-3129 (1993) . Wang, P. and Krawiec, S., Desulfurization of dibenzothiophene to 2-hydroxybiphenyl by some newly isolated bacterial strains. Arch. Microbiol., 161:266-271( 1994). Denome, S.A., Olson, E.S., and Young, K.D., Identification and cloning of genes involved in specific desulfurization of dibenzothiophene by Rhodococcus sp. strain IGTSI. Appl. Environ. Microbiol., 59:2837-2843 (1993). Denome, S. A., Oldfield, C., Nash, L. J., and Young, K. D., Characterization of desulfurization genes from Rhodococcus sp. strain IGTSS. J . Bacteriol., 176:6707-6716 (1994). Piddington, C. S., Kovacevich, B. R., and Rambosek, J., Sequence and molecular characterization of a DNA region encoding the dibenzothiophene desulfurization operon of Rhodococcus sp. strain IGTSS. Appl. Enuiron. Microbiol., 61:468-475 (1995) . Lee, M. K., Senius, J. D., and Grossman, M. J. Sulfur-specific microbial desulfurization of sterically hindered analogs of dibenzothiophene., Appl. Environ. Microbiol., 61:4362- 4366 (1995). Inoue A, Horikoshi K, Estimation of solvent-tolerance of bacteria by the solvent parameter Log P. J. Ferment. Bioeng., 71:194-196 (1991).
,
763
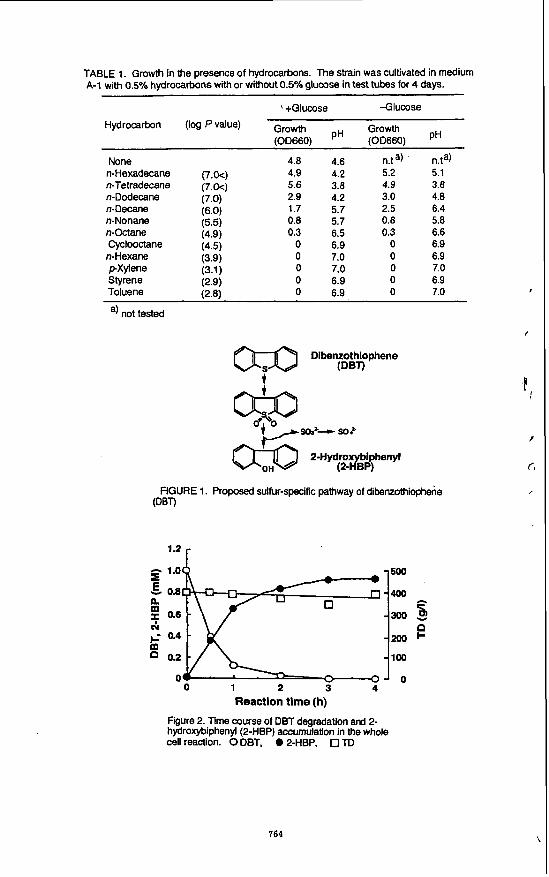
TABLE 1. Growth in the presence of hydrocarbons. The strain was cultivated in medium 14-1 with 0.5% hydrocarbons with or without 0.5% glucose in test tubes for 4 days.
b +Glucose -Glucose
Growth Hydrocarbon (log P value) Growth (OD660) pH (OD660) pH
None 4.8 4.6 n.ta) ' n.ta) n-Hexadecane ( 7 . ~ 4 4.9 4.2 5.2 5.1 n-Tetradecane (7.04 5.6 3.8 4.9 3.8
2.9 4.2 3.0 4.8 2.5 6.4
n-Dodecane (7.0) 1.7 5.7
0.8 5.8 n-Decane (6.0)
0.8 5.7 0.3 6.6
n-Nonane (5.5) n-Octane (4.9) 0.3 6.5
0 6.9 0 6.9 0 6.9
Cyclooctane (4.5) n-Hexane (3.9) 0 7.0
o 7.0 0 7.0 0 6.9
pXylene (3.1 1 0 6.9
0 7.0 Styrene (2.9) Toluene 12.8) 0 6.9
- -
-
a) not tested
500
400
-300 8 Y
0 -200 I-
100
- 0
FIGURE 1. Proposed sulfur-specific pathway of dibenzothiophene (DBT)
n
0 1 2 3 4 Reaction time (h)
Figure 2. Time course of DBT degradation and 2- hydroxybiphenyl(2-HBP) accumulation in the whole cell reaction. 0 DBT, 0 2-HBP. 0 TD
164
c
I
H3yJJ7cH3
\ - 0 0
FIGURE 3. Structure of DBT and its derivatives. (I) DBT; (11) 2,8dirnethylDBT; (111) 4,SdirnethylDBT; (Iv) 3P-benzoDBT.
e Q F ' I I
8!l a.0 7:s 7.0 8.3 ' . 8 h ' ' e FIGURE 4.1KNMR specrum of the product from 3,MenzoDBT.
0 2 4 e a 1 0 1 2 Reactlon time (h)
(e) 1 .o
FIGURE 5. Degradation of DBT derivatives in the presence of hydrocarbon by whole cell reactions. The reaction mixture contained 100 mmol
amount3 of product formed were determined by compadng the peak areas with those Of standard 2-HBP. Theamountsof remalnin substrates and pr0ducts7ormd are &own In (A) and (E). respectlveiy. Readon time (h)
I 765
ANALYSIS OF THE EXTENT OF SULFUR REMOVAL AND THE EFFECT ON REMAINING SULFUR
M. K. Lee, R. C. Prince, J. D. Senius, M. J. Grossman Exxon Research and Engineering Co., Annandale, NJ 08801
I. J. Pickering, G. N. George SSRL, Stanford, CA 94309
Keywords: Biodesulfurization, middle distillate, vacuum gas oil
INTRODUCTION
refining process. DBTs bearing alkyl substitutions adjacent to the sulfur atom (referred to as sterically hindered compounds), are the most resistant to HDS, and represent a significant bamer to reaching very low sulfur levels in fuels'. Bacteria have been isolated which utilize an oxidative pathway to selectively desulfurize a variety of organic sulfur compounds found in petroleum oils2. The molecular mechanisms of dibenzothiophene (DBT) desulfurization by this pathway have recently been described'. Previous experiments with Rhodococcus sp. ECRD-1 (ATCC 55309) using DBT have shown that it is converted to the hydroxylated sulfur-free end product 2-phenylphenol via an analogous pathway4. Corresponding conversions of the sterically hindered compounds 4,6-diethyl DBT, 4,ddimethyl DBT and 4-ethyl DBT were also demonstrated.
and examines the fate of sulfur remaining in the oil. A middle distillate oil (232 - 343°C) and a vacuum gas oil (VGO) (343 - 496'C), representing a diesel range oil and a heavy gas oil, were tested as sole sulfur sources in batch cultures. Sulfur removal was quantified using the ratio of Flame Ionization (FID) and Sulfur Chemiluminesce (SCD) detector response factors in Gas Chromatography analysis. Results demonstrated that up to 40% of sulfur in the middle distillate cut could be removed in two week batch cultures. Compounds across the entire boiling range of the oil were affected by the treatment. Less than half that removal is evident in the heavier VGO, suggesting limitations on the range of compounds susceptible to desulfurization by this system. Analysis of the chemical state of the sulfur remaining in the treated oils by sulfur K-edge X-ray absorption spectroscopy showed that in the case of the middle distillate oil over 50% of the remaining sulfur was in an oxidized form. A lesser amount of the remaining sulfur in the treated VGO was in an oxidized state, consistent with the degree of desulfurization. The presence of partially oxidized sulfur compounds in the treated oils indicates that these compounds were en route toward desulfurization. Overall, in the case of the middle distillate oil, more than two- thirds of the initial sulfur had been affected by the microbial treatment.
EXPERIMENTAL
Arthrobacter sp. D-1 (ATCC 55309), was isolated by enrichment culture from marine sediments based on its ability to selectively remove sulfur from the sterically hindered organic sulfur compound 4,6-DEDBTI using the organic sulfur compound as a sole sulfur source.
Media. Mineral Salts Sulfur-Free Medium (MSSF) containing 1% sodium acetate was prepared as previously described' and used for oil desulfurization experiments. Tungsten was added as 50 u g h 1 Na2W04 * 2H20 in VGO cultures. Sulfate control media contained 0.2 g MgS04 * 7H20 per liter.
tryptone, 5 g Difco yeast extract, 5 g NaCI, adjusted to pH 7.0 with 1.0 ml 1 M NaOH and autoclaved at 121OC, 15 psi.
represents a diesel range oil fraction. The OB oil used for experiments was artificially weathered under a stream of nitrogen to a constant weight to eliminate inconsistencies caused by evaporative loss of oil during culturing or extraction. Weathering resulted in a weight loss of less than 10% and no change in ppm sulfur content. Vacuum gas oil (VGO), a 650 - 9500F (343 - 496OC) distillate cut, represents a heavy oil fraction. The oil used was also artificially weathered under a stream of nitrogen to a constant weight to eliminate inconsistencies caused by
Hydrodesulfurization (HDS) is used to remove organic sulfur from petroleum oils in the
This study evaluates the ability of ECRD-1 to desulfurize feeds encountered in refineries
Bacterial Strain. Rhodococcus sp. ECRD-I (ATCC 55309), previously designated
Luria broth (LB) was used to grow cultures for use as and contained per liter: 10 g Difco
Oils. Oregon Basin (OB) crude oil, a 450 - 6500F (232 - 343OC) middle distillate cut,
766
1
t untreated oils was determined by X-ray fluorescence sulfur analysis (XRF) and GC/FID/SCD. The percent sulfur for the Oregon Basin cut sterile control was 2.07% determined by XRF and 1.96 % by GC/FID/SCD. The percent sulfur for the VGO cut sterile control was 2.93% determined by XRF and 2.26% by GC/FID/SCD.
Biodesulfurization Assays. Biodesulfurization were performed as growing cell assays. One ml, approximately 0.84 g, of artificially weathered and heat sterilized oil was treated in one liter of culture. Inocula were prepared from overnight cultures grown from single bacterial colonies in LB at room temperature (23OC) on a VWR Orbital shaker at 200 rpm. Cells were then pelleted in a Sorval centrifuge at 3000 x g in SS34 rotor at 4OC. The pellet was washed three times with one volume of 12 mM phosphate buffer (pH 7.0) previously chilled on ice for 30 min. Cell pellets were resuspended in 1/10 the original culture volume of chilled phosphate buffer and used immediately for inoculation. Flasks were inoculated with 2 ml of the cell suspension per L medium.
experiment also included a uninoculated negative control. VGO oils were incubated with shaking at 200 rpm for 5 and 7 days. The five day experiment included a positive control culture, inoculated and containing sulfate. The seven day experiment included a uninoculated negative control. Flasks were pH monitored at one to two day intervals and adjusted to pH 7.0 with IM phosphoric acid when the pH deviated by more than 1.0 pH unit. All assays were performed in duplicate.
1% v/v dodecane in methylene chloride solution was added as an extraction standard. Each flask was then extracted 3X with 100 ml methylene chloride . The methylene chloride extracts were filtered through anhydrous sodium sulfate or calcium sulfate if water was apparent (i.e., a turbid solution was observed). The samples were then reduced to approximately 5 ml volumes under nitrogen. Samples were subsequently filtered through a 0.22 pm hydrophobic filter to remove turbidity (attributed to water condensate) appearing after volume reduction. For every liter of culture extracted, a 0.5 ml aliquot of decane/methylene chloride (0.742 g/IOO ml) was added to the filtered extracts as an injection volume standard. The solutions were then concentrated to approximately 1 .O ml.
GC/FID/SCD Analysis. Gas Chromatography was performed on a Perkin-Elmer GC Autosystem (splitkplitless injector). Oregon Bash oil was chromatographed on a Supelco SPB- 1 column (3Gm x 0.32mm, 0.25um film thickness). The temperature zones for the GC were as follows: injector and detector temperature 300OC, initial oven temperature 40OC for 1 minute, followed by a 4OC /minute temperature ramp to 300OC for a final IO minute hold. VGO was chromatographed on a Supelco SPB-1 column (15 m x 0.32mm, 4um film thickness). The temperature zones for the GC were as follows: injector temperature 275012, detector temperature 325OC, initial oven temperature 50OC for 1 minute, followed by a 5% /minute temperature ramp to 300% for a final 20 minute hold. Tandem Perkin-Elmer FID (flame ionization detection) and Sievers Instruments, model 355 SCD (sulfur chemiluminescence detection) detectors were used to determine sulfur concentrations in oil samples based on response factors of model compounds. For oils and standard mixtures, 1 p1 of sample was injected in duplicate and results averaged.
Response factors for OB oil and VGO were estimated based on the averaged FID and SCD response factors for a number of model compounds. These compounds were chosen to represent some of the compounds found in the oils. The standards used for calibration of the FID detector were hexane, heptane, decane, dodecane, tetradecane, fluorene, carbazole, DBT sulfone, and 4,6 DEDBT. The sulfur compounds contained in this mixture were used to calibrate the SCD. Averaged response factors for sulfur (ngarea) and for carbon (mg/area) were calculated for the standard mixtures and the sulfidcarbon ratio calculated. This ratio was multiplied by the sulfur/carbon area of the oils to give ppm S . A common baseline was drawn by the computer encompassing all area associated with the oil so that unresolved area characterized by a hump in the baseline was included in subsequent calculations.
GC/FID area ratio of total carbon (minus standards) to dodecane extraction standard of control and treated samples.
Sulfur K-edge X-ray absorption-edge spectroscopy. Sulfur K-edge X-ray absorption- edge spectroscopy was used to determine the effect of biodesulfurization on the remaining sulfur content of treated oils. This technioue allows for the evaluation of the chemical state of sulfur
Duplicate cultures were incubated with shaking at 200 rpm for 4 days for OB oils. The
Before extraction, cultures were brought to a pH of 1.0 with 1N HCI. A 0.5 ml aliquot of
.
The percent carbon loss for treated oils was determined as the difference behveen the
i
i
I
1
C
767
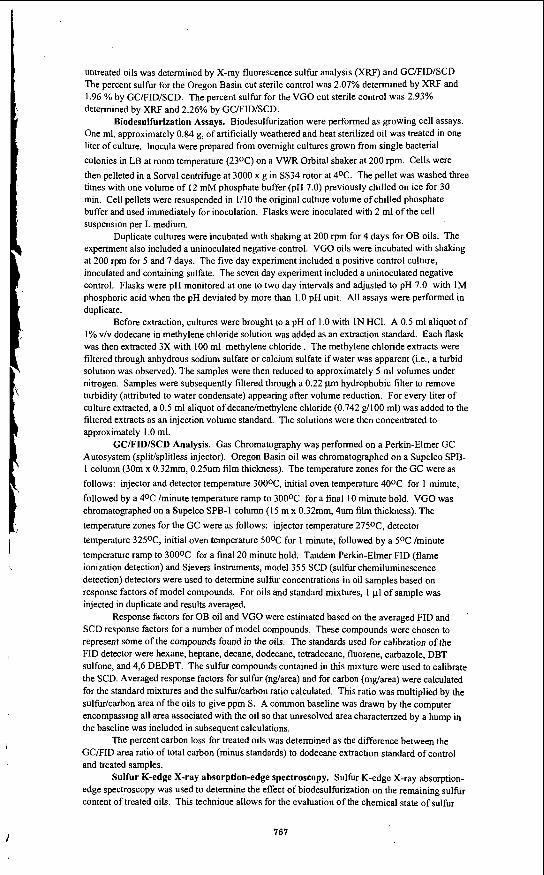
Stanford Synchrotron Radiation Laboratory. Reference compounds were run as powder films using electron yield detection, while oil samples were run as liquids using fluorescence detection2. Spectra of the oils were fitted to linear combinations of the spectra of reference compounds using least-squares non-linear optimization5. In general there is a trend toward higher absorbance energies in the order sulfidic, thiophenic, oxidized species (Fig. 1).
organic sulfur compounds as reference compounds to represent the majority of sulfur types expected in treated and untreated oils. Fig. I shows the sulfur K-edge X-ray absorption spectra of these compounds. Although the individual spectra are quite distinct, different fit results were obtained with good fits using different constraints on the fit calculations. Consequently, the fits obtained using this method are used as indicators of the likely distribution of S compounds and are not considered highly accurate for specific species.
RESULTS AND DISCUSSION
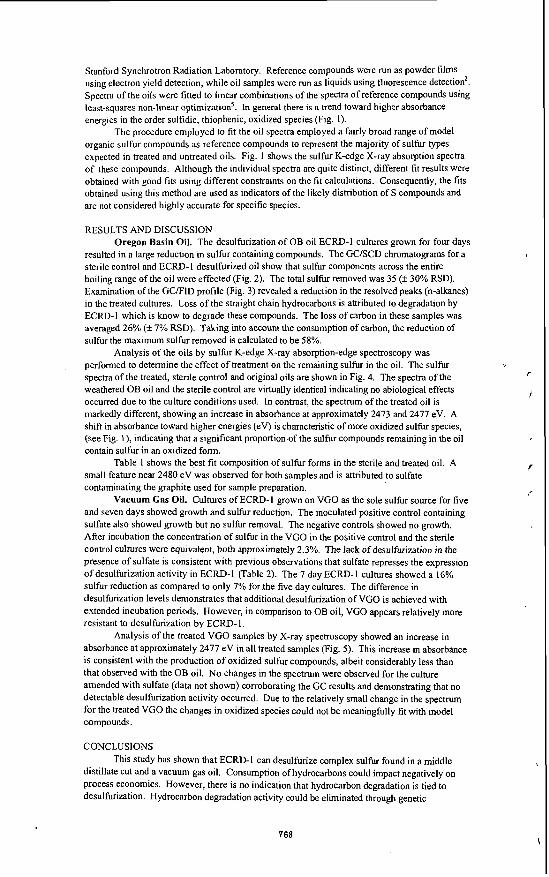
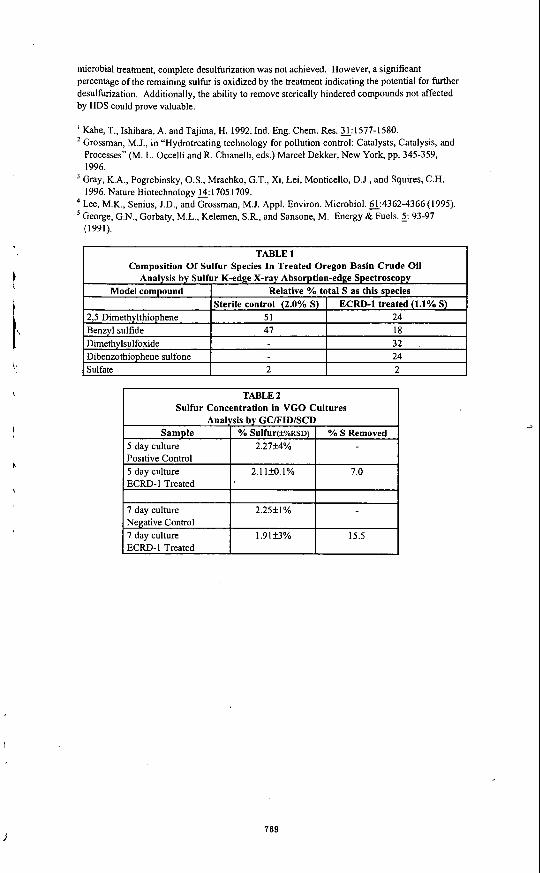
resulted in a large reduction in sulfur containing compounds. The GC/SCD chromatograms for a sterile control and ECRD-I desulfurized oil show that sulfur components across the entire boiling range of the oil were effected (Fig. 2). The total sulfur removed was 35 (k 30% RSD). Examination of the GCffID profile (Fig. 3) revealed a reduction in the resolved peaks (n-alkanes) in the treated cultures. Loss of the straight chain hydrocarbons is attributed to degradation by ECRD-1 which is know to degrade these compounds. The loss of carbon in these samples was averaged 26% (+- 7% RSD). Taking into account the consumption of carbon, the reduction of sulfur the maximum sulfur removed is calculated to be 58%.
Analysis of the oils by sulfur K-edge X-ray absorption-edge spectroscopy was performed to determine the effect of treatment on the remaining sulfur in the oil. The sulfur spectra of the treated, sterile control and original oils are shown in Fig. 4. The spectra of the weathered OB oil and the sterile control are virtually identical indicating no abiological effects occurred due to the culture conditions used. In contrast, the spectrum of the treated oil is markedly different, showing an increase in absorbance at approximately 2473 and 2477 eV. A shift in absorbance toward higher energies (eV) is characteristic of more oxidized sulfur species, (see Fig. I), indicating that a significant proportion of the sulfur compounds remaining in the oil contain sulfur in an oxidized form.
small feature near 2480 eV was observed for both samples and is attributed to sulfate contaminating the graphite used for sample preparation.
Vacuum Gas Oil. Cultures of ECRD-I grown on VGO as the sole sulfur source for five and seven days showed growth and sulfur reduction. The inoculated positive control containing sulfate also showed growth but no sulfur removal. The negative controls showed no growth. After incubation the concentration of sulfur in the VGO in the positive control and the sterile control cultures were equivalent, both approximately 2.3%. The lack of desulhization in the presence of sulfate is consistent with previous observations that sulfate represses the expression of desulfurization activity in ECRD-I (Table 2). The 7 day ECRD-1 cultures showed a 16% sulfur reduction as compared to only 7% forthe five day cultures. The difference in desulfurization levels demonstrates that additional desulfurization of VGO is achieved with extended incubation periods. However, in comparison to OB oil, VGO appears relatively more resistant to desulfurization by ECRD-I.
absorbance at approximately 2477 eV in all treated samples (Fig. 5). This increase in absorbance is consistent with the production of oxidized sulfur compounds, albeit considerably less than that observed with the OB oil. No changes in the spectrum were observed for the culhre amended with sulfate (data not shown) corroborating the GC results and demonstrating that no detectable desulfurization activity occurred. Due to the relatively small change in the spectrum for the treated VGO the changes in oxidized species could not be meaningfully fit with model compounds.
CONCLUSIONS
distillate cut and a vacuum gas oil. Consumption of hydrocarbons could impact negatively on process economics. However, there is no indication that hydrocarbon degradation is tied to desulfurization. Hydrocarbon degradation activity could be eliminated through genetic
The procedure employed to fit the oil spectra employed a fairly broad range of model
Oregon Basin Oil. The desulfurization of OB oil ECRD-1 cultures grown for four days
,
Table 1 shows the best fit composition of sulfur forms in the sterile and treated oil. A
Analysis of the treated VGO samples by X-ray spectroscopy showed an increase in
This study has shown that ECRD-I can desulfurize complex sulfur found in a middle
. Model compound
2,5 Dimethylthiophene Benzyl sulfide Dimethylsulfoxide Dibenzothiophene sulfone
t Relative % total S as this species Sterile control (2.0% S) ECRD-I treated (1.1% S)
51 24 47 18
32 24
TABLE 2 Sulfur Concentration in VGO Cultures
I
769
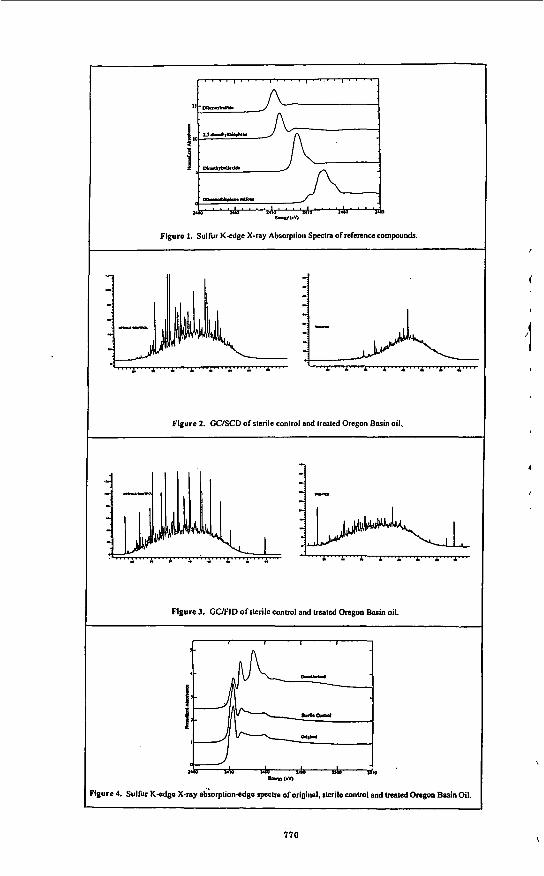
Figure 1. Sulfur K-edge X-ray Absorption Spectra of reference compounds.
Figure 2. GCISCD of slerile conlrol and treated Oregon Basin oil.
Figure 3. GUFID of slerile control and treated Oregon Basin oil.
lgure 4. Sulfur K-edgc X-ray ad;orplion-cdgc spectra of original. rlcrilc control and lrraled Oregon Basin Oil.
I I
770

Figure 5. Sulfur K-edge X-ray Absorption spcclra of Vacuum Gns Oil slerilc conlml. posilive conlrol, and five aiid scvcn day ECRD-I lrcallncnt
AQUATHERMOLYSIS OF ORGANIC COMPOUNDS IN THE PRESENCE OF HYDROGEN SULFIDE AND SULFATE
Gerhard G. Hoff~nann and Thorsten David German Petroleum Institute,
Clausthal-Zellerfeld, (3-38678 Germany
Walther-NmSt-Str. 7
Keywords: Thermochemical reduction of sulfate, formation and decomposition of organic sulfur compounds caused by aquathermolysis, hydrogen sulfide
ABSTRACT Thermal recovery processes are well established enhanced oil recovery techniques. At thermal recovery temperatures in the reservoir can reach 320OC. Under these specific conditions chemical reactions of the reservoir sulfate and hydrogen sulfide easily occur. The conditions at thermal recovery processes allow the thermochemical reduction of sulfate with hydrogen sulfide. In the presence of organic compounds these redox reactions lead to the formation of a variety of inorganic, as well as organic compounds in different oxidation states, including elemental sulfur. Object of these investigations was to study the thermal induced reactions of organic compounds in the presence of hydrogen sulfide and aqueous solutions of alkali metal- as well as alkaline-earth metal sulfates. n-Octane, n-hexadecane, and 2-octanone selected as representative organic compounds were allowed to react with the inorganic components in autoclaves at temperatures up to 32OOC under variation of the reaction time from 6 hrs. to 500 hrs. The amount of reduced sulfate was estimated by quantitative determination of the residual sulfate in the aqueous layer after each reaction. The organic reaction products were identified by gas chromatography and G U M S .
INTRODUCTION Thermal recovery processes are well established enhanced oil recovery techniques and widely applied for recovering heavy oil, heavy oil sands, and shale oil. At thermal recovery temperatures in the reservoirs can reach 320°C. Under these specific conditions decomposition reactions of organic sulfur compounds, which are already present in the crude oil, easily proceed. In addition, reactions of the reservoir sulfate and hydrogen sulfide (H2S) take place.[l] The conditions, occuning at thermal recovery processes allow the thermochemical reduction of sulfate with H2S. In the presence of organic compounds these redox reactions lead to the formation of a variety of inorganic and organic sulfur compounds in different oxidation states, including elemental sulfur (or its different radicals). The reduction is autocatalytic with respect to H2S. Increasing concentrations of elemental sulfur promptly cause its reaction with organic compounds of the crude oil, which consequently leads to the formation of organic sulfur compounds and HzS.[2-4] Thus, it is obvious that both, consumption and formation of H2S compete with each other. The net reaction can be given with eq. 1 :
1
,
H S (low conc.) 3 SO:- + 4 RCH, ' k 3 S z - + 4 C 0 , + 4 R H + 4 H 2 0 (1) P,T
From eq. 1 it becomes evident that only a catalytic amount of H2S is necessary to initiate the thermochemical reduction of sulfate. It is known that H2S is very often present in the reservoir. It can be formed under fairly mild conditions by microbial reduction of sulfate.[5] Furthermore, H2S can be generated by the hydrolysis of inorganic compounds like pyrite, pyotite, and elemental sulfur. The pH-value plays an important part in the thermal reduction, since it has a significant influence on both, the formation and the reactivity of the inorganic sulfur compounds.[6] The pH-value is strongly controlled by the metal cation of the used sulfate solutions. The net reaction (eq.1) reveals that sour gas (COz + H2S) is formed. These compounds lead to severe problems at the recovery of crude oil, as well as at its manufacturing. Furthermore, the quality of the crude oil will be af€ected.[7] The changes in the composition of the hydrocarbons and heterocompounds due to aquathermolysis in the absence of sulfate and H2S are well described in literature.[S] However, only few details
concerning the very complex thermochemical reduction of sulfate in the presence of H S and hydrocarbons are availabIe.[l,4,9] On the other hand, sulfate as an oxidizing agent for the synthesis of aromatic carboxylic acids, such as phthalic acids, has been earlier investigated.[lO] Moreover, formation of H2S fiom the reduction of gypsum has been subject of investigations.[ 1 I] Scope of our research is to better understand the above mentioned reactions and their influences on each other with respect to the different reaction products, which are formed, depending on the reaction time, the reaction temperature, and the employed educts. The reactions were carried out in the presence of aqueous solutions of metal sulfates; moreover, in every reaction only one defined aliphatic hydrocarbon was used sewing as a model compound; this was necessary to understand the complex reactions taking place.
EXPERIMENTAL. The experiments were conducted using glass cylinders, which were installed in stainless steel autoclaves. In the case of the reactions with model compounds an aqueous solution of 20 mmol of the corresponding sulfate was used, whereas in the case of crude oil a solution containing 60 mmol of sulfate was employed. Autoclaves of 90 mI and 190 mI content, respectively, were used. Reactions with CaS04 were carried out in the presence of NaH2P04 (employed in the same molar ratio as CaS04). The starting pressure at ambient temperature was the steel cylinder pressure of H2S. The reactions were performed at temperatures between 200°C and 320"C, respectively (Tab.l). After given time intervals the autoclave was cooled to room temperature (RT). The organic layer was separated fiom the aqueous layer. The decrease of sulfate was determined by quantitative titration, according to the method of SCHONINGER.[l2] The pH-value of the aqueous phase was determined after the reaction at RT with a pH-meter equipped with a glass electrode. The organic layer was investigated by gas chromatography (GC) and the coupling of gas chromatography with mass spectrometry (GCMS). GC was performed using a Hewlett Packard Model 5890 Series Il instrument, equipped with a Hewlett Packard Flame Ionization Detector (FID) and a Hewlett Packard Flame Photometric Detector (FPD). The organic layer was analyzed by GCMS using a Hewlett Packard 5890 A Series II GC coupled with a Hewlett Packard 5970 B Series MS Detector, using the same GC program as for the separation. Mass spectra were obtained by electron ionization at 70 eV. The injector system of the GCMS was a temperature programmable Injector System fiom Gerstel. The analytical conditions are given in Tab.2. Reactions in the presence of crude oil were worked up in the same manner. However, the recovered crude oil was extracted by liquid sulfur dioxide in order to enrich organic sulfur compounds.[l3] The enriched crude oil fiactions were investigated by GC (FID, FPD).
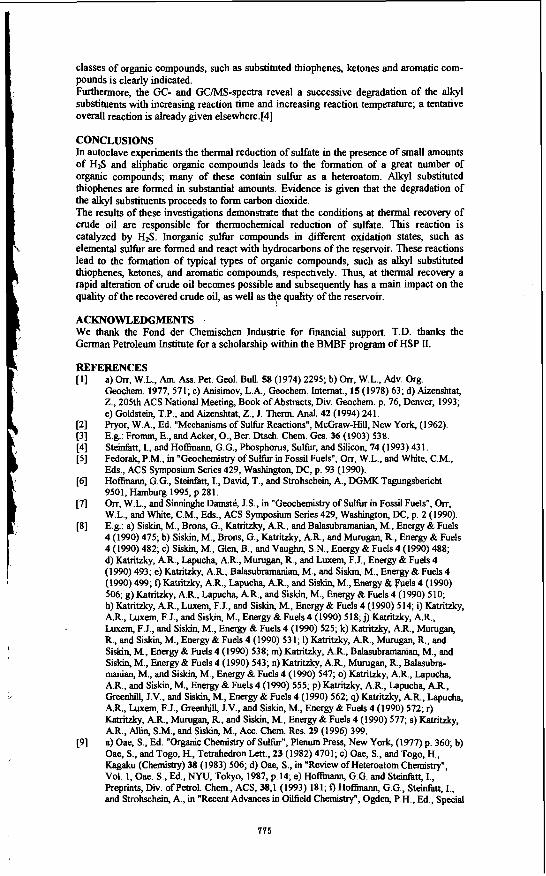
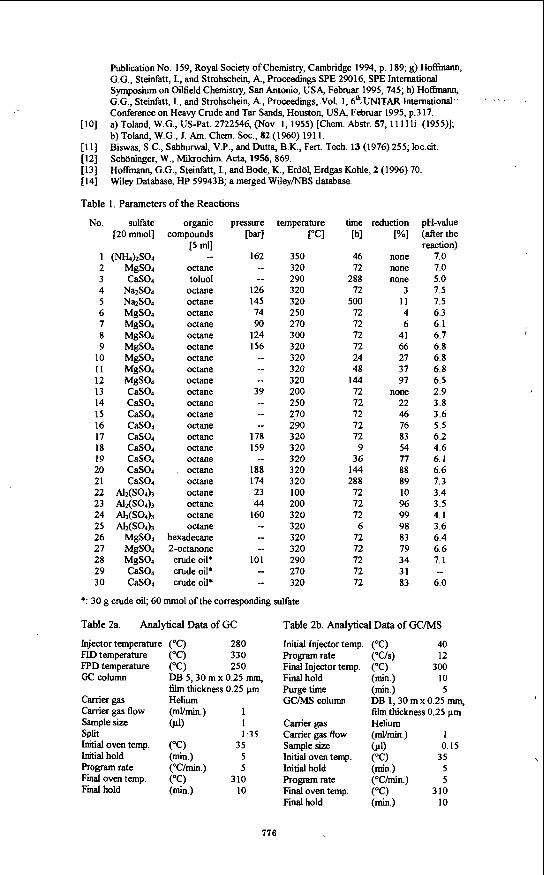
RESULTS AND DISCUSSION In Tab. 1 the parameters of the performed reactions are summarized. To rule out artifacts and to make sure that sulfate dpes not react with the autoclave material, aqueous solutions of the investigated compounds were treated at elevated temperatures under helium or nitrogen pressure in stainless steel autoclaves without H2S (Tab. 1: 1-3). It could be proved that neither reduction of sulfate nor reaction of the organic compound takes place. Sulfate was recovered quantitatively, the organic compound unchanged. In Fig.1 the amount of reduced sulfate of the reaction of different metal sulfates in the presence of n-octane (Fig.1; according to Tab.1: 4, 6-9, 13-17, and 23, 24) is plotted vs. the temperature. In these experiments the reaction time was 72 hrs. It easily can be seen that the reduction rate is strongly controlled by both, reaction temperature and metal cation of the employed sulfate. To attain the same rate of reduction reactions of MgS04 require higher temperatures than those of c&o&k+H2Po4. Generally, it can be seen fiom Fig. 1 that the rate of reduction strongly increases at temperatures higher than 250'12. The strong influence of the employed cation becomes evident by comparing the reactions of Na2S04 to those of Ah(SO&. In the case of sodium sulfate reduction is not as pronounced; after a reaction time of 500 hrs. only about 10Y0 of Na2S04 are reduced at 3 2 0 T (Tab. 1: 4, 5). In contrast, the reduction in the presence of aluminum ions already starts at 100°C and is almost quantitative at 2OOOC (Tab. 1: 22-24). In Fig.2 the amount of reduced sulfate of the reactions in the presence of n-octane is plotted vs. the reaction time (Fig.2; according to Tab.]: 4, 9-12, 17-21, 24, 25). In this case, the reaction temperature was 320°C. It can be seen fiom the plots of MgS04 and c&o4/Na&Po4 that the rate of reduction increases with increasing reaction time. It is reaching 97% within 144 hrs. for MgSQ; whereas for CaS04/NaH2P04 only 88% of the
773
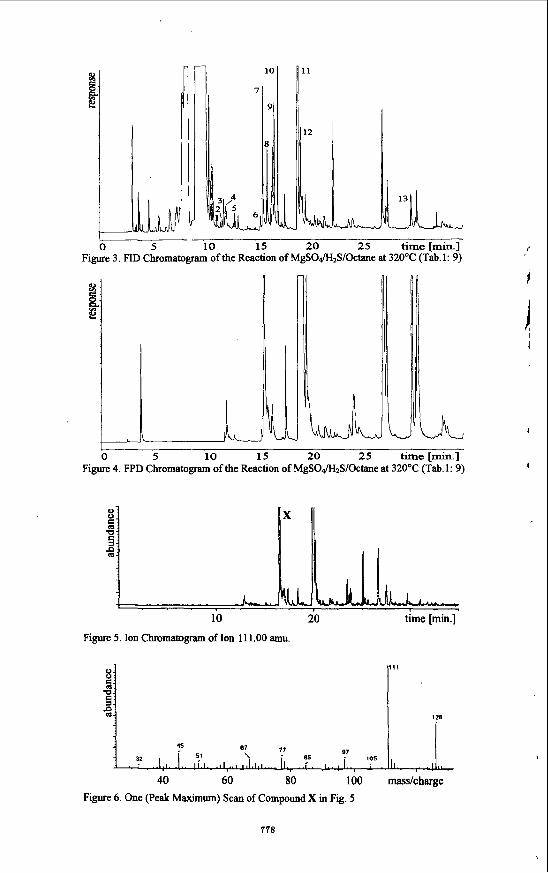
sulfate is reduced within the same reaction time. This indicates that the reaction is con- trolled by the cation, too; this feature becomes very evident for the reactions of Alz(S04)3 and Na2S04. In the presence of aluminum cations the reduction of sulfate proceeds very fast (see for example Tab. 1 : 25), whereas the reactivity is very low in the presence of sodium cations (Tab.1: 4,5). An explanation can be given with the pH-value. By comparison of the experiments 9, 26, and 27 (Tab. 1) it becomes evident that the rate of reduction of sulfate does not only depend on the reaction time and the reaction temperature; it is also influenced by the organic compound which is involved in the reaction. In the presence of n-octane 66% of the employed is reduced; whereas in the presence of n-hexadecane or 2-octanone the rate of reduction increases significantly to approximately 80%. Experiments 28 to 30 (Tab.l) confirm that in the presence of crude oil the rate of reduction of sulfate lies in a similar order of magnitude. Investigations of the organic layer reveal that preferably organic sulfur compounds are formed. A sirong influence of the employed metal salt on the distribution of the different newly formed organic compounds could be shown. Moreover, the reaction conditions, e.g. reaction temperature, as well as time are of main importance. In Figures 3 to 6 an example of the identification steps of the organic compounds is given. Fig.3 shows the FID chromatogram of the organic layer of reaction 9 (Tab. 1); in Fig.4 the corresponding FPD chromatogram is shown. The two chromatograms reveal that a lot of organic compounds are newly formed. In addition, the FPD chromatogram indicates that many organic sulfur compounds are generated. Most of these compounds can be assigned to mono-, as well as dialkylated thiophenes by GCMS. Moreover, a compound containing two sulfur atoms is observed; 2,2'-bithiophene could be made plausible. The ion chromatogram of the ion mass 11 1 is shown in Fig.5. It can be seen that a great number of different compounds is formed, the fiagmentation of which leads to ion mass 1 11. Mass 11 1 is e.g. specific for dialkylated thiophenes containing at least one methylgroup as ring substituent. By comparing the single mass spectm of the total ion current to literature data a specification of 2,5- and 2-akylsubstituted thiophenes becomes possible. Fig.6 shows one specific example for a typical mass spectrum; it could be shown that 2-ethyl-5- methyltbiophene corresponds to this particular spectrum. The tentative overall reaction is shown in Scheme 1. It can be assumed that at the reduction of sulfate sulfur radicals are generated; these radicals subsequently react with n- alkanes as shown in Scheme la and lb, respectively:
Scheme 1
A series of insertion reactions of sulfur into carbon hydrogen bonds of the alkane, followed by a condensation reaction in the 2,5-position, as well as in the 1,4-position of the alkane lead to ring closure. Thus, 2,5-substituted and 2-substituted tetrahydro- thiophene derivatives are formed. Under elimination of H2S cyclisation may proceed as @own in Scheme la or lb. The thus formed tetrahydrothiophene derivatives react in a cascade of sulfur insertion, as well as H2S elimination steps to form the corresponding thiophenes. In addition, other than sulfur containing compounds are formed, too. Some of these could be identified by GCMS as ketones, e.g. 2-, 3-, and 4-octanone and aromatic compounds, like benzene and ethylbenzene. Some of the reaction products of experiments 9, 26, and 27 (Tab.l) are identified following published sources [14] and are summarized in Tab.3. The formation of typical
classes of organic compounds, such as substituted thiophenes, ketones and aromatic com- pounds is clearly indicated. Furthermore, the GC- and GCMS-spectra reveal a successive degrahtion of the alkyl substituents with increasing reaction time and increasing reaction temperature; a tentative overall reaction is already given elsewhere.[4]
CONCLUSIONS In autoclave experiments the thermal reduction of sulfate in the presence of small amounts of H2S and aliphatic organic compounds leads to the formation of a great number of organic compounds; many of these contain sulfur as a heteroatom. Alkyl substituted thiophenes are formed in substantial amounts. Evidence is given that the degradation of the alkyl substituents proceeds to form carbon dioxide. The results of these investigations demonstrate that the conditions at thermal recovery of crude oil are responsible for thermochemical reduction of sulfate. This reaction is catalyzed by H2S. Inorganic sulfur compounds in different oxidation states, such as elemental sulfur are formed and react with hydrocarbons of the reservoir. These reactions lead to the formation of typical types of organic compounds, such as alkyl substituted thiophenes, ketones, and aromatic compounds, respectively. Thus, at thermal recovery a rapid alteration of crude oil becomes possible and subsequently has a main impact on the quality of the recovered crude oil, as well as f4e quality of the reservoir.
We thank the Fond der Chemischen Industrie for financial support. T.D. thanks the German Petroleum Institute for a scholarship within the BMBF program of HSP II.
REFERENCES [I]
ACKNOWLEDGMENTS .
a) On; W.L., Am. Ass. Pet. Geol. Bull. 58 (1974) 2295; b) Orr, W.L., Adv. Org. Geochem. 1977,571; c) Anisimov, L.A., Geochem. Internat., 15 (1978) 63; d) Aizenshtat, Z., 205th ACS National Meeting, Book of Abstracts, Div. Geochem. p. 76, Denver, 1993; e) Goldstein, T.P., and Aizenshtat, Z., J. Therm. Anal. 42 (1994) 241. Pryor, W.A., M. "Mechanisms of Sulfur Reactions", McGraw-Hill, New York, (1962). E.g.: Fromm, E., and Acker, O., Ber. Dtsch. Chem. Ges. 36 (1903) 538. Steinfatt, I., and Hoffmann, G.G., Phosphorus, Sulfur, and Silicon, 74 (1993) 431. Fedor& P.M., in "Geochemistry of Sulfur in Fossil Fuels", Orr, W.L., and White, C.M., Eds., ACS Symposium Series 429, Washington, DC, p. 93 (1990). HoffmarvL G.G.. Steinfatt. I.. David. T.. and Strohschein A,. DGMK Tarmnasbericht
[2] [3] [4] [5]
161 . - , , , , - I
9501, Hkburgl995, p 281.' Orr, W.L., and Sinninghe Damste, J.S., in "Geochemistry of Sulfur in Fossil Fuels", Orr, 171 _ - W.L., andWhite, C.M, Eds., ACS Symposium Series 429, Washington, DC, p. 2 (1990). E g : a) Siskin, M., Brons, G., Katritzky, A.R, and Balasubramanian, M., Energy & Fuels 4 (1990) 475; b) Siskin, M., Brons, G., Katritzky, A.R., and Murugan, R., Energy & Fuels 4 (1990) 482; c) Siskin, M., Glen, B., and Vaughn, S.N., Energy & Fuels 4 (1990) 488; d) Katritzky, A.R., Lapucha, A.R., Murugan, R., and Luxem, F.J., Energy & Fuels 4 (1990) 493; e) Katntzky, A.R., Balasubramanian, M., and Siskin, M., Energy & Fuels 4 (1990) 499, f ) Katntzky, A.R., Lapucha, A.R., and Siskin, M., Energy &Fuels 4 (1990) 506; g) Katritzky, A.R., Lapucha, A.R., and Siskin, M., Energy & Fuels 4 (1990) 510; h) Katritzky, A.R., Luxem, F.J., and Siskin, M., Energy & Fuels 4 (1990) 514; i) Katritzky, A.R, Luxem, F. J., and Siskin, M., Energy & Fuels 4 (1 990) 5 18; j) Katritzky, A.R., Luxem, F.J., and Siskin, M., Energy & Fuels 4 (1990) 525; k) Katritzky, A.R., Murugan, R., and Siskin, M., Energy & Fuels 4 (1990) 531; I) Katritzky, AR., Murugan, R., and Siskin, M., Energy & Fuels 4 (1990) 538; m) Katritzky, A.R., Balasubramanian, M., and Siskin, M., Energy & Fuels 4 (1990) 543; n) Katritzky, A.R., Murugan, R., Balasubra- manian, M., and Siskin, M., Energy & Fuels 4 (1990) 547; 0) Katritzky, A.R., Lapucha, A.R., and Siskin, M., Energy & Fuels 4 (1990) 555; p) Katritzky, A.R., Lapucha, A.R., Greenhill, J.V., and Siskin, M., Energy & Fuels 4 (1990) 562; q) Katritzky, A.R, Lapucha, A.R., Luxem, F.J., Greenhill, J.V., and Siskin, M., Energy & Fuels 4 (1990) 572; r) Katritzky, A.R, Murugan, R., and Siskin, M., Energy & Fuels 4 (1990) 577; s) Katritzky, A.R., AUin, S.M., and Siskin, M., Acc. Chem. Res. 29 (1996) 399. a) Oae, S., Ed. "Organic Chemistry of Sulfur", Plenum Press, New York, (1977) p. 360; b) Oae, S., and Togo, H., Tetrahedron Lett., 23 (1982) 4701; c) Oae, S., and Togo, H., Kagaku (Chemistry) 38 (1983) 506; d) Oae, S., in "Review of Heteroatom Chemistry", Vol. 1, Ow. S., Ed., NYU, Tokyo, 1987, p. 14; e) Hoffmann, G.G. and Steinfatt, I., Preprints, Div. ofpetrol. Chem., ACS, 38,1 (1993) 181; f)Hoflina~, G.G., Steidatt, I., and Strohschein, A,, in "Recent Advances in Oilfield Chemistry", Ogden, P.H., Ed,, Special
[8]
[9]
775
Publication No. 159, Royal Society of Chemistry, Cambridge 1994, p. 189; g) Hoffmann, G.G., Steinfatt, I., and Strohschein, A., Proceedings SPE 29016, SPE International Symposium on Oilfield Chemistry, San Antonio, USA, Februar 1995,745; h) Hoffinann, G.G., Steinfatt, I., and Strohschein, A., Proceedings, Vol. 1, 6F.IJNITAR International’’ Conference on Heavy Crude and Tar Sands, Houston, USA, Februar 1995, p.3 17. a) Toland, W.G., US-Pat. 2722546, (Nov. 1, 1955) [Chem. Abstr. 57 , l l l l l i (1955)]; b) Toland, W.G., J. Am. Chem. SOC., 82 (1960) 191 1. Biswas, S.C., Sabhurwal, V.P., and Dutta, B.K., Fed. Tech. 13 (1976)255; 1oc.cit. Schoninger, W., Mikrochim. Acta, 1956,869. HoEinann, G.G., Steinfatt, I., and Bode, K., Erdol, Erdgas Kohle, 2 (1996) 70. Wdey Database, HP 59943B; a merged Wdey/NBS database.
’ ’ ’
[IO]
[ l l ] [I21 [13] [14]
Table 1. Parameters of the Reactions
No. sulfate organic pressure temperature [20 mmol] compounds [bar] [“CI
162 350 [5 4
1 (NH4kso4 __ 2 MgS04 octane -- 320 3 Cas04 toluol -- 290 4 NazS04 octane 126 320 5 NazS04 octane 145 320 6 MgSO4 octane 74 250 7 MgSO4 octane 90 270 8 MgSO4 octane 124 300 9 MgSO4 octane 156 320
10 MgSO4 octane -- 320 I 1 MgSO4 octane -- 320 12 MgSO, octane -- 320 13 Cas04 octane 39 200 14 Cas04 octane -- 250 15 Cas04 octane -- 270
17 Cas04 octane 178 320 18 Cas04 octane 159 320 19 CaS04 octane -- 320 20 CaS04 octane 188 320 21 Cas04 octane 174 320 22 Al~(S04), octane 23 100
24 Alz(SO4)p octane 160 320
16 Cas04 octane -- 290
23 &(s04h octane 44 200
25 Al2(S04)3 octane -- 320 26 MgSO4 hexadecane -- 320 27 MgSO4 2-octanone -- 320
29 Cas04 crudeoil* -- 270 30 Cas04 crudeoil* -- 320
28 MgSO4 crudeoil* 101 290
*: 30 g crude oil; 60 mmol ofthe corresponding sulfate
time [hl
46 72
288 72
500 72 72 72 72 24 48
144 72 72 72 12 12 9
36 144 288 72 72 72 6
72 72 72 72 72
reduction [%I none none none
3 11 4 6
41 66 27 37 97
none 22 46 76 83 54 77 88 89 10 96 99 98 83 79 34 31 83
pH-value (after the reaction)
7.0 7.0 5.0 7.5 7.5 6.3 6.1 6.7 6.8 6.8 6.8 6.5 2.9 3.8 3.6 5.5 6.2 4.6 6. I 6.6 7.3 3.4 3.5 4.1 3.6 6.4 6.6 7.1
6.0 _ _
Table 2a.
Injector temperature (“C) 280 FID temperature (“C) 330 FPD temperature (“C) 250 Gc column
carrier gas Helium carrier gas flow (mvmin.) 1 Sample size (PI) 1 Split 1:35 Initial oven temp. (“C) 35 Initial hold (h.1 5 Program rate (“C/min.) 5
Final hold ( h . 1 10
Analytical Data of GC
DB 5,30 mx 0.25 mm, film thickness 0.25 pm
Final oven temp. (“C) 310
Table 2b. Analytical Data of GC/MS
Initial Injector temp. (“C) 40 Program rate (“Us) 12 Final Injector temp. (“C) 300 Final hold (min.) 10 Purge time (h.) 5 GCMS column
Carrier gas Helium
Sample size (PI) 0.15
DB 1,30 m x 0.25 mm, film thickness 0.25 pm
Carrier gas flow (dmin . ) 1
Initial oven temp. (“C) 35 Initial hold (min.) 5 Program rate (“C/min.) 5
Final hold ( h . 1 10 Fmal oven temp. (“C) 310
776
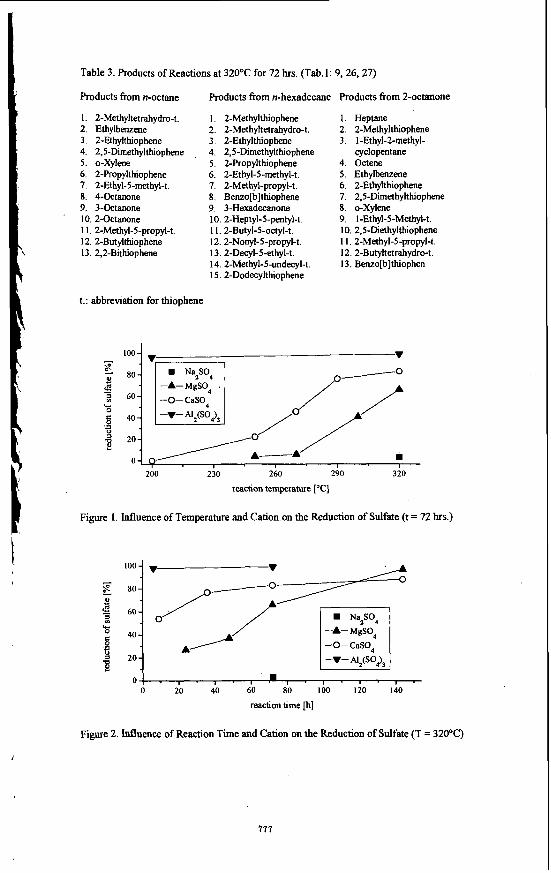
Table 3. Products of Reactions at 32OOC for 72 hrs. (Tab. 1: 9,26,27)
Products from n-octane Products from n-hexadecane Products &om 2-octanone
1. 2-Methyltetrahydro-t. 2. Ethylbenzene 3. 2-Ethylthiophene 4. 2,s-Dimethylthiophene 5 . 0-Xylene 6. 2-Propylthiophene 7. 2-Ethyl-5-methyl-t. 8. 4-Octanone 9. 3-Octanone 10. 2-Octanone 11. 2-Methyl-5-propyl-t. 12.2-Butylthiophene 13. 2,ZBithiophene
1. 2-Methylthiophene 2. 2-Methyltetrahydro-t. 3. 2-Ethylthiophene 4. 2,s-Dimethylthiophene 5 . 2-Propylthiophene 6. 2-Ethyl-5-methyl-t.
8. Benzo[b]thiophene 9. 3-Hexadecanone 10.2-Heptyl-5-pentyl-t.
12. 2-Nonyl-5-propyl-t.
14. 2-Methyl-5-undecyl-t. 15.2-Dodecylthiophene
7. 2-Methyl-~0pyl-t.
11. 2-Butyl-5-owl-t.
13. 2-De~yl-5-ethyl-t.
1. Heptane 2. 2-Methylthiophene 3. 1-Ethyl-2-methyl-
cyclopentane 4. Octene 5 . Ethylbenzene 6. 2-Ethylthiophene 7. 2,s-Dimethylthiophene 8. o-Xylene
10. 2,s-Diethylthiophene 11. 2-Methyl-5-propyl-t. 12. 2-Butyltetrahydro-t. 13. Benzo[b]thiophen
9. 1-Ethyl-5-Methyl4
t.: abbreviation for thiophene
Figure 1. Influence of Temperature and Cation.on the Reduction of Sulfate (t = 72 hrs.)
100- . 60
40
20
0 -A- MgS04 -0- CaSO, A
O l . , . I . I . = , . , . , . , . 0 20 40 60 EO 100 120 140
reaction time [h]
Figure 2. Influence of Reaction Time and Cation on the Reduction of Sulfate (T = 32OOC)
777
1
0
B
%
5 10 15 20 25 time[min.] f Figure 3. FID Chromatogram of the Reaction of MgSO&S/Octane at 320°C (Tab.1: 9)
111
I f B
07 77 45
32 ?’ 105 I . I.., .. : . I I I,
5 10 15 20 25 time [min.] Figure 4. FPD Chromatogram of the Reaction of MgS0&12S/Octane at 320°C (Tab.1: 9)
Figure 5. Ion Chromatogram of Ion 111.00 amu.
40 60 80 100 masdcharge Figure 6. One (Peak Maximum) Scan of Compound X in Fig. 5
778
?
f ',
HYDROGEN FROM BIOMASS VIA FAST PYROLYSIS AND CATALYTIC STEAM REFORMING
D. Wang, S. Czemik, D. Montan&', M. Mann, and E. Chome6 National Renewable Energy Laboratory (NREL)
Golden, CO 80401-3303
'
Keywords: Hydrogen production, biomass, catalytic steam reforming
ABSTRACT Fast pyrolysis transforms biomass into "bio-oil", with yields as high as 75-80 wt.% of the anhydrous biomass. This bio-oil is a mixture of aldehydes, alcohols, acids, oligomers from the constitutive carbohydrates and lignin, and some water from the dehydration reactions. Tests performed using a microreactor interfaced with a molecular beam mass spectrometer and a bench- scale, ked bed reactor have demonstrated near stoichiometric hydrogen yields from steam reforming of the biwoil aqueous fraction obtained after precipitation and separation of the lignin- derived oxyaromatics. Reforming of the aqueous fraction required proper dispersion of the liquid to avoid vapor-phase carbonization of the feed in the inlet to the reactor. A spraying nozzle injector has been designed and successfully tested. We will present and discuss the process developed for the pyrolysis and reforming operations and some preliminary product cost estimates. The economics of the process is favored when the separated ligninderived oxyaromatics are converted to valuable co-products and the aqueous fraction of the bio-oil is used for hydrogen production.
INTRODUCTION Although renewable lignocellulosic biomass has been considered as a potential feedstock for gasification to produce syngas, the economics of current processes favor the use of hydrocarbons (natural gas, C2-Cs, and naphtha) and inexpensive coal. An alternative approach to the production of Hz from biomass is fast pyrolysis of biomass to generate a liquid product (also known as bio-oil) and catalytic steam reforming of the oil or its fractions. This latter approach has the potential to be cost competitive with the current commercial processes for hydrogen production. The yield of bio-oil can be as high as 75-80 wt.% of the anhydrous biomass.
Bio-oil is a mixture of aldehydes, alcohols, acids, oligomers from the constitutive carbohydrates and lignin, and some water from the dehydration reactions. The overall steam reforming reaction t
I . of bio-oil (or any oxygenate with a chemical formula of C,,H,,,g), is given by:
(1) The stoichiometric yield of hydrogen is 2+d2n-Wn moles per mole of carbon in the feed, and Wn
C, HmOk + (2n-k) H20 = n COz + (2n + d2-k) Hz I
7 is usually in the fractions for the aromatic phenolics from lignin, while Wn is close to 1 for most carbohydrate-derived products such as sugars. In contrast to producer gas, bio-oil is easily transportable. Thus, the two key process steps, pyrolysis and reforming, can be carried out independently at different locations. This' allows to minimize the costs of feedstock, transportation, and product (H2) distribution. In this paper, we describe results on catalytic steam reforming of oxygenates. Tests performed using a mimreactor interfaced with a molecular beam mass spectrometer and a bench-scale, fixed bed reactor have demonstrated near stoichiometric hydrogen yields from the bio-oil aqueous fraction obtained after precipitation and separation of the ligninderived oxyaromatics. We will also present results of preliminary economic analysis on this process, which also produces a valuable co-product (ligninderived oxyaromatics).
EXPERIMENTAL Tests were carried out in two systems: a microreactor coupled to a molecular-beam mass spectrometer (MBMS) and a bench-scale fixed bed unit. Both systems have been described in detail in our previous work.'.' The mimreactor was housed in a tubular furnace with four independently controlled temperature zones. The dual bed contigumtion of this reactor enabled us to study either the differences between thermolysis and catalysis or to compare the performances of two catalysts under the same temperature conditions. Gaseous products at the exit of the microreactor are sampled in real-time through a supersonic, h - j e t expansion nozzle.
' On leave fiom Univnsitat Rovira i Virgili. Departammt d'Enginycria Qulmica, Autovia de Mou S/N. Tanagon&
* Also afliliatcd with Univmit6 de Sberbmoke, S h h k e , Qurbec. Canada, JIK-2R1 43006 Spain.
779
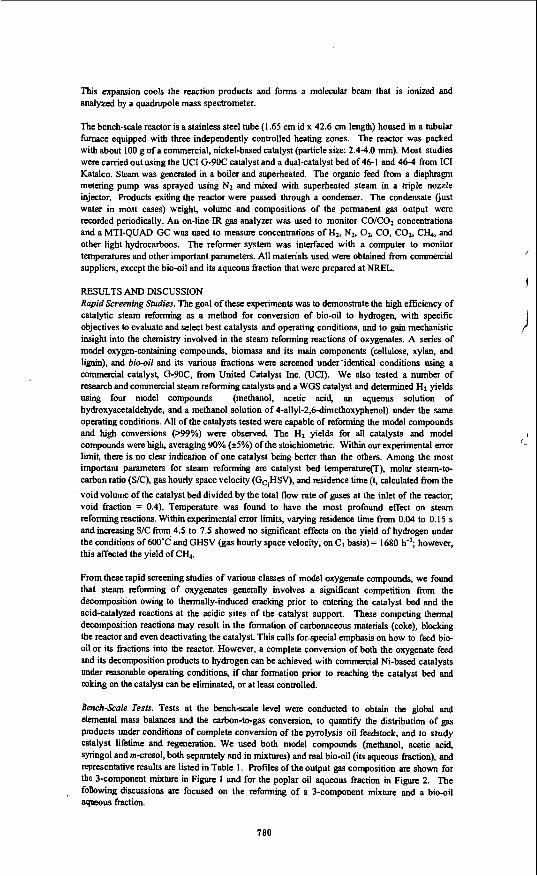
This expamion cools the reaction products and forms a molecular beam that is ionized and analyzed by a quadrupole mass spectrometer.
The bench-scale reactor is a stainless steel tube (1.65 cm id x 42.6 CITI lengtll) housed in a tubular furnace equipped with three independently controlled heating zones. The reactor was packed with about 100 g of a commercial, nickel-based catalyst (particle size: 2.44.0 mm). Most studies were carried out using the UCI G-90C catalyst and a dual-catalyst bed of 46-1 and 46-4 from IC1 Katalco. Steam was generated in a boiler and superheated. The organic feed from a diaphragm metering pump was sprayed using Nz and mixed with superheated steam in a hiple nozzle injector. Products exiting the reactor were passed through a condenser. The condensate (just water in most cases) weight, volume and compositions of the permanent gas output were recorded periodically. An on-line IR gas analyzer was used to monitor CO/COz concentrations and a MTI-QUAD GC was used to measure concentrations of Hz, Nz. 02, CO, COz, Cb, and other light hydrocarbons. The reformer system was interfaced with a computer to monitor temperatures and other important parameters. All materials used were obtained from commercial suppliers, except the bio-oil and its aqueous fraction that were prepared at NREL.
RESULTS AND DISCUSSION Rapid Screening Studies. The goal of these experiments was to demonstrate the high efficiency of catalytic steam reforming as a method for conversion of bio-oil to hydrogen, with specific objectives to evaluate and select best catalysts and operating conditions, and to gain mechanistic insight into the chemistry involved in the steam reforming reactions of oxygenates. A series of model oxygen-containing compounds, biomass and its main components (cellulose, xylan, and lignin), and bio-oil and its various hctions were screened under.identical conditions using a commercial catalyst, G-90C, from United Catalyst Inc. (UCI). We also tested a number of research and commercial steam reforming catalysts and a WGS catalyst and determined HZ yields using four model compounds (methanol, acetic acid, an aqueous solution of hydroxyacetaldehyde, and a methanol solution of 4-allyl-2,6-dimethoxyphenol) under the same operating conditions. All of the catalysts tested were capable of reforming the model compounds and high conversions (>99%) were observed The H2 yields for all catalysts and model compounds were high, averaging 90% (+So/,) of the stoichiometric. Within our experimental error limit, there is no clear indication of one catalyst being better than the others. Among the most important parameters for steam reforming are catalyst bed temperaturefl), molar steam-to- carbon ratio (S/C), gas hourly space velocity (G,,HSV), and residence time (t. calculated from the void volume of the catalyst bed divided by the total flow rate of gases at the inlet of the reactor; void fraction = 0.4). Temperature was found to have the most profound effect on steam reforming reactions. Within experimental m r limits, varying residence time from 0.04 to 0.15 s and increasing S/C from 4.5 to 7.5 showed no significant effects on the yield of hydrogen under the conditions of 600'C and GHSV (gas hourly space velocity, on CI basis) = 1680 h-I; however, this affected the yield of CI&
From these rapid screening studies of various classes of model oxygenate compounds, we found that steam reforming of oxygenates generally involves a significant competition from the decomposition owing to thermally-induced cracking prior to entering the catalyst bed and the acid-catalyzed reactions at the acidic sites of the catalyst support. These competing thermal decomposition reactions may result in the formation of carbonaceous materials (coke), blocking the reactor and even deactivating the catalyst This calls for.specia1 emphasis on how to feed bio- oil or its fractions into the reactor. However, a complete conversion of both the oxygenate feed and its decomposition products to hydrogen can be achieved with commercial Ni-based catalysts under reasonable operating conditions, if char formation prior to reaching the catalyst bed and coking on the catalyst can be eliminated, or at least controlled.
Bench-Scale Tests. Tests at the bench-scale level were conducted to obtain the global and elemental mass balances and the carbon-to-gas conversion, to quantify the distribution of gas pmducts under Conditions of complete conversion of the pyrolysis oil feedstock. and to study catalyst lifetime and regeneration. We used both model compounds (methanol, acetic acid, syringol and m-cresol, both separately and in mixtures) and real bio-oil (its aqueous fraction), and representative results are listed in Table 1. Profiles of the output gas composition are shown for the 3-component mixture in Figure 1 and for the poplar oil aqueous fraction in Figure 2. The fouowing discussions are focused on the reforming of a 3-component mbthlre and a bio-oil aqueous finction.
,
780
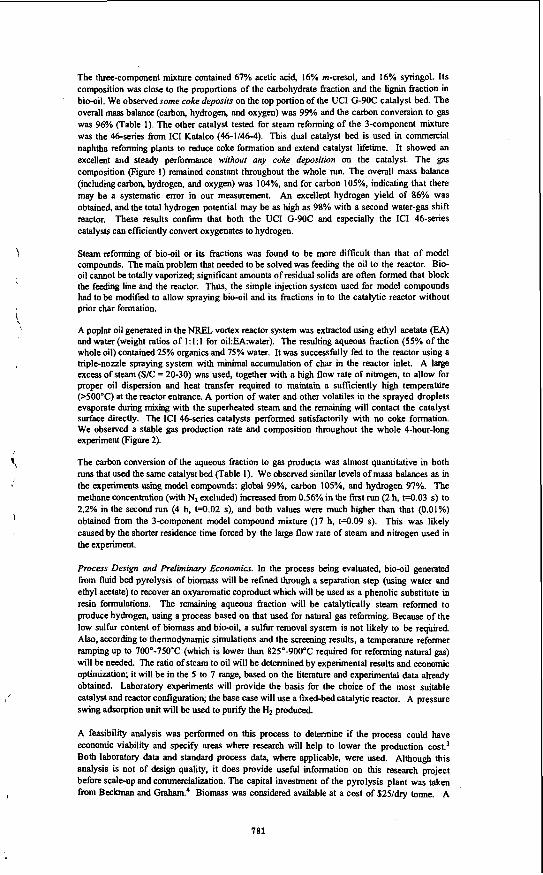
The three-component mixture contained 67% acetic acid, 16% m-cresol, and 16% syringol. Its composition was close to the proportions of the carbohydrate fraction and the lignin fraction in bio-oil. We observed some coke deposifs on the top portion of the UCI G-90C catalyst bed. The overall mass balance (carbon, hydrogen, and oxygen) was 99% and the carbon conversion to gas was 96% (Table I). The other catalyst tested for steam reforming of the 3-component mixture was the 46-series from IC1 Katalco (46-1/46-4). This dual catalyst bed is used in commercial naphtha reforming plants to reduce coke formation and extend catalyst lifetime. It showed an excellent and steady performance without any coke deposition on the catalyst. The gas composition (Figure I) remained constant throughout the whole run. The overall mass balance (including carbon, hydrogen, and oxygen) was 104%. and for carbon 105%. indicating that there may be a systematic error in our measurement. An excellent hydrogen yield of 86% was obtained, and the total hydrogen potential may be as high as 98% with a second water-gas shift reactor. These results confirm that both the UCI G-90C and especially the IC1 46-series catalysts can efficiently convert oxygenates to hydrogen.
Steam reforming of bio-oil or its fractions was found to be more difficult than that of model compounds. The main problem that needed to be solved was feeding the oil to the reactor. Bio- oil cannot be totally vaporized; significant amounts of residual solids are often formed that block the feeding line and the reactor. Thus, the simple injection system used for model compounds had to be modified to allow spraying bio-oil and its fractions in to the catalytic reactor without prior char formation.
A poplar oil generated in the NREL vortex reactor system was extracted using ethyl acetate (EA) and warn (weight ratios of 1:l:l for 0il:EA:water). The resulting aqueous fraction (55% of the whole oil) contained 25% organics and 75% water. It was successfully fed to the reactor using a triple-nozzle spraying system with minimal accumulation of char in the reactor inlet. A large. excess of steam (S/C = 20-30) was used, together with a high flow rate of nitrogen, to allow for proper oil dispersion and heat transfer required to maintain a sufficiently high temperature (>SOO"C) at the reactor entrance. A portion of water and other volatiles in the sprayed droplets evaporate during mixing with the superheated steam and the remaining will contact the catalyst surface directly. The IC1 46-series catalysts performed satisfactorily with no coke formation. We observed a stable gas production rate and composition throughout the whole 4-hour-long experiment (Figure 2).
The carbon conversion of the aqueous fraction to gas products was almost quantitative in both runs that used the same catalyst bed (Table I). We observed similar levels of mass balances as in the experiments using model compounds: global 99%, carbon 105%, and hydrogen 97%. The methane concentration (with N2 excluded) increased from 0.56% in the fmt run (2 h, W.03 s) to 2.2% in the second run (4 h, M . 0 2 s), and both values were much higher than that (0.01%) obtained from the 3-component model compound mixture (17 h, H . 0 9 s). This was likely caused by the shorter residence time forced by the large flow rate of steam and nitrogen used in the experiment.
Process Design and Preliminary Economics. In the process being evaluated, bio-oil generated from fluid bed pyrolysis of biomass will be refined through a separation step (using water and ethyl acetate) to recover an oxyaromatic coproduct which will be used as a phenolic substitute in resin formulations. The remaining aqueous fraction will be catalytically steam reformed to produce hydrogen, using a process based on that used for natural gas reforming. Because of the low sulfur content of biomass and bio-oil, a sulfur removal system is not likely to be rq; i rea Also, according to thermodynamic simulations and the screening results, a temperature reformer ramping up to 7OO0-750'C (which is lower than 825"-9OO0C required for reforming natural gas) will be needed. The ratio of steam to oil will be determined by experimental results and economic optimization; it will be in the 5 to 7 range, based on the literature and experimental data already obtained Laboratory experiments will provide the basis for the choice of the most suitable catalyst and reactor configuration; the base case will use a fixed-bed catalytic reactor. A pressure swing adsorption unit will be used to purify the Hz produced.
A feasibility analysis was performed on this process to determine if the process could have economic viability and specify areas where research will help to lower the production cost3 Both laboratory data and standard process data, where applicable, were used. Although this analysis is not of design quality, it does provide useful information on this research project before scale-up and commercialization. The capital investment of the pyrolysis plant was taken from Bec!unan and Graham! Biomass was considered available at a cost of $25/dry tonne. A
781
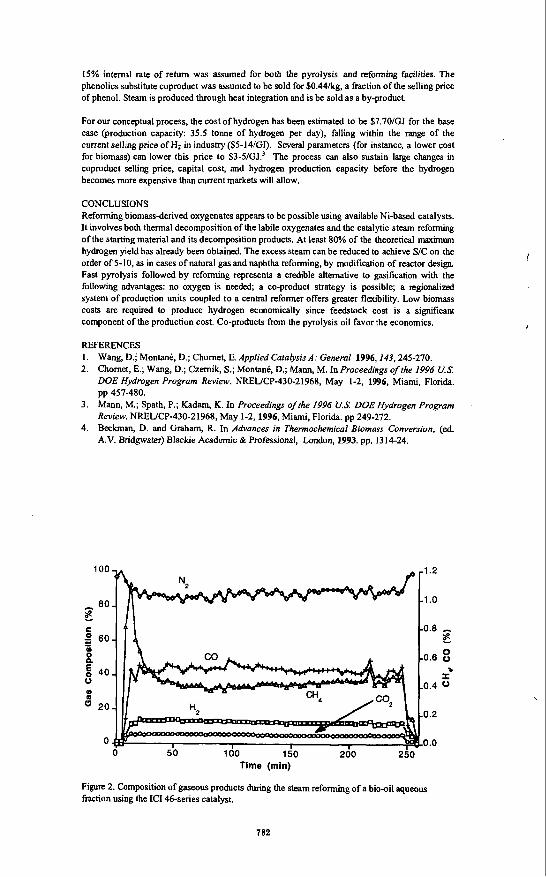
15% internal rate of retum was assumed for both the pyrolysis and reforming facilities. The phenolics substitute coproduct was assumed to be sold for SO.44kg. a fraction of the selling price of phenol. Steam is produced through heat integration and is be sold as a by-product.
For our conceptual process, the cost of hydrogen has been estimated to be $7.70/GJ for the base case (production capacity: 35.5 tonne of hydrogen per day), falling within the range of the current selling price of Ht in industry ($5-14/GJ). Several parameters (for instance, a lower cost for biomass) can lower this price to $3-5/GJ.3 The process can also sustain large changes in coproduct selling price, capital cost, and hydrogen production capacity before the hydrogen becomes more expensive than current markets will allow.
CONCLUSIONS Reforming biomass-derived oxygenates appears to be possible using available Ni-based catalysts. It involves both thermal decomposition of the labile oxygenates and the catalyhc steam reforming of the starting material and its decomposition products. At least 80% of the theoretical maximum hydrogen yield has already been obtained. The excess steam can be reduced to achieve SIC on the order of 5-10, as in cases of natural gas and naphtha reforming, by modification of reactor design. Fast pyrolysis followed by reforming represents a credible alternative to gasification with the following advantages: no oxygen is needed, a co-product strategy is possible; a regionalized system of production units coupled to a central reformer offers greater flexibility. Low biomass costs are required to produce hydrogen economically since feedstock cost is a significant component of the production cost. Co-products from the pyrolysis oil favor the economics.
REFERENCES 1. 2.
Wang, D.i Montant, D.; Chornet, E. Applied Catalysis A: General 1996,143,245-270. Chornet, E.; Wang, D.; Czemik, S.; Montant, D.; Mann, M. In Proceedings of the 1996 US. DOE Hydrogen Program Review. NREUCP-430-21968, May 1-2, 1996, Miami, Florida.
Mann, M.; Spath, P.; Kadam, K. In Proceedings of the 1996 US DOE Hydrogen Program Review. NREUCP-430-21968, May 1-2,1996, Miami, Florida. pp 249-272. Beckman, D. and Graham, R. In Advances in Thermochemical Biomass Conversion, (ed. A.V. Bridgwater) Blackie Academic & Professional, London, 1993. pp. 1314-24.
pp 457-480. 3.
4.
100 1.2
1 .o
c 0.8
80 E g 60 E - W 0 a 0.6 0
0.4 0 0 P 5 40 I
8 20 W
0.2
0 0.0
Time (rnin)
Figure 2. Composition of gaseous products during the steam reforming of a bio-oil aqueous fraction using the IC1 46-series catalyst.
782
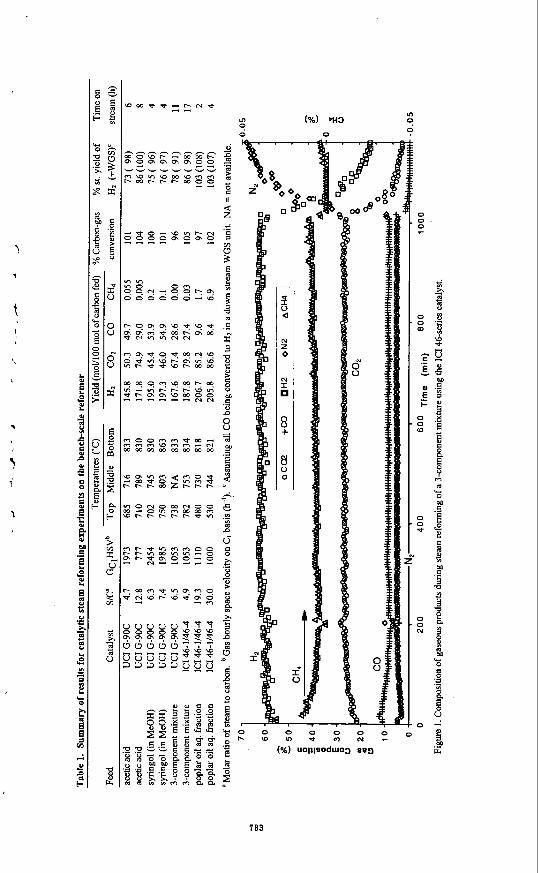
II
i2
-
x a
N z 0
N I
8
8
+
0 0 -
I I l ie
0
783


![diagram 5.1 [Converted] - Building Control NI · part of the flue serving an open-flued appliance. flue soot door debris collection space chimney appliance flue outlet appliance flue](https://img.pdfslide.net/doc/110x75/60ea4a68722f9641f22c1939/diagram-51-converted-building-control-ni-part-of-the-flue-serving-an-open-flued.jpg)