Embed Size (px)
Citation preview

ArticlesDOI: 10.1038/s41559-017-0234-3
© 2017 Macmillan Publishers Limited, part of Springer Nature. All rights reserved.
Biodiversity at risk under future cropland expansion and intensificationLaura Kehoe 1,2*, Alfredo Romero-Muñoz 1, Ester Polaina3, Lyndon Estes 4,5,6, Holger Kreft 7 and Tobias Kuemmerle1,8
1 Geography Department, Humboldt-University Berlin, Berlin 10099, Germany. 2 Biology Department, University of Victoria, Victoria, BC V8P 5C2, Canada. 3 Department of Conservation Biology, Estación Biológica de Doñana-CSIC, Sevilla 41092, Spain. 4 Civil and Environmental Engineering, Princeton University, Princeton, NJ 08544, USA. 5 Woodrow Wilson School, Princeton University, Princeton, NJ 08544, USA. 6 Graduate School of Geography, Clark University, Worcester, MA 01581, USA. 7 Biodiversity, Macroecology and Biogeography, Georg-August-University Göttingen, Göttingen 37077, Germany. 8 Integrative Research Institute on Transformations of Human–Environment Systems (IRI THESys), Humboldt-University Berlin, Berlin 10099, Germany. *e-mail: [email protected]
SUPPLEMENTARY INFORMATION
In the format provided by the authors and unedited.
NATuRE EcoLogy & EvoLuTioN | www.nature.com/natecolevol

- Supplementary Information –
Biodiversity at risk under future cropland expansion and intensification
Laura Kehoe*, Alfredo Romero-Muñoz, Ester Polaina, Lyndon Estes, Holger Kreft, Tobias Kuemmerle

Figure 1: Global Land System classification (updated to a ~1-km resolution from van Asselen & Verburg 1). Darker green areas indicate predominantly natural regions of forest and grassland that are not suitable for cropland (In legend ‘Dense forest’ to ‘Grassland, bovines, goats & sheep’). Lighter green systems annotated with (CS) indicate areas where cropland is suitable – but not currently present. Full dataset available for download from the HU-Box
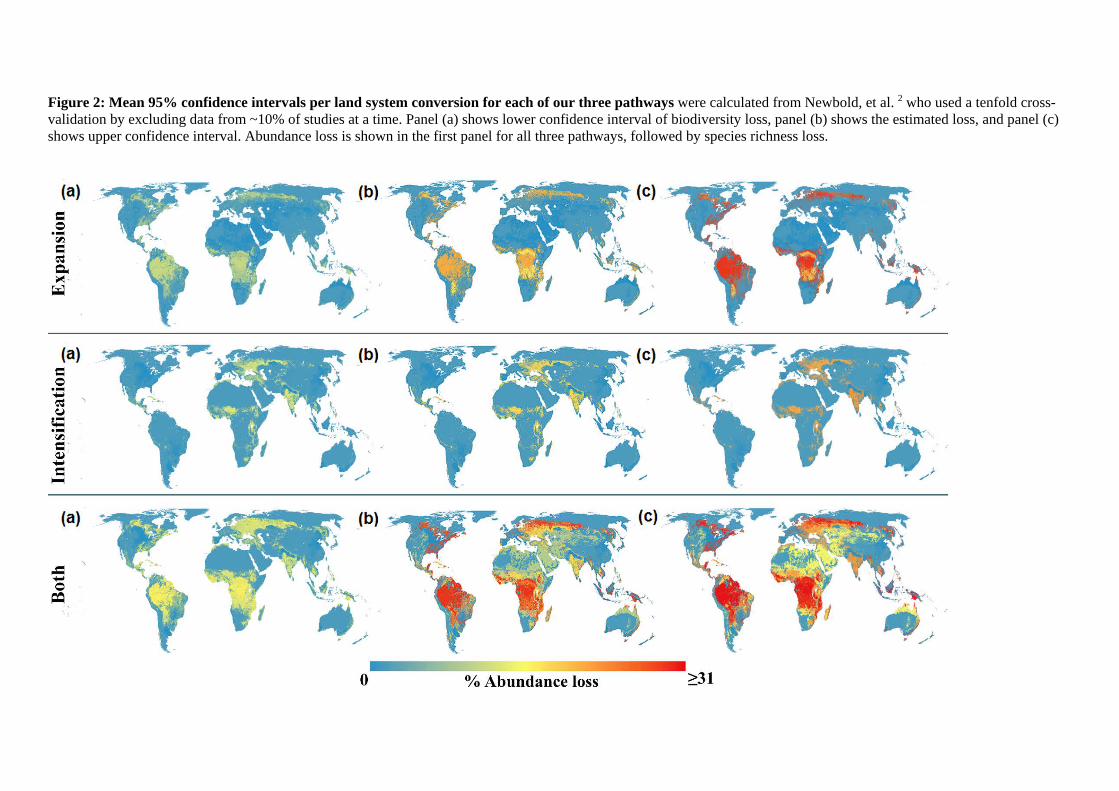
Figure 2: Mean 95% confidence intervals per land system conversion for each of our three pathways were calculated from Newbold, et al. 2 who used a tenfold cross-validation by excluding data from ~10% of studies at a time. Panel (a) shows lower confidence interval of biodiversity loss, panel (b) shows the estimated loss, and panel (c) shows upper confidence interval. Abundance loss is shown in the first panel for all three pathways, followed by species richness loss.


Figure 3: High-risk regions of species loss in terms of pathways of expansion (dark red = top 5%, light red = top 10%) and intensification (dark turquoise = top 5%, light
turquoise = top 10%) overlaid with: (a) protected areas 3 IUCN category I to VI (Ia = Strict Nature Reserve, Ib = Wilderness Area, II = National Park III = Natural Monument
or Feature, IV = Habitat/Species Management Area, V = Protected Landscape/Seascape, VI = Protected Area with sustainable use of natural resources, darker blue shades in
figure denotes higher protection status), (b) the 110 km grid cell most at risk of species richness loss found in the moist forests of Peru and partially covered by the IUCN
category II Bahuaja-Sonene and category VI Tambopata National Reserve. Bottom Panel: conservation priority schemes (dashed lines), (c) Conservation International hotspots 4, (d) Global 200 Ecoregions 5 and, (e) Last of the Wild 6.

Figure 4: Average national level species richness lost per 110 km grid cell (# sr loss) on each pathway (expansion, intensification, and both expansion and intensification)
compared with the natural log of conservation spending per km2 at the national level – log spending 7, and the average % economic growth of the agricultural sector of 2009-
2013 – agricultural growth 8. Colour code according to each country’s realm (Afrotropical = Red, Neotropical = Navy, Palaearctic = Blue). Full list of country codes with
country names given in Supplementary Table 7.

Table 1: Details on datasets for the Global Land System map V2
Dataset (citation, original scale)
Description (data value, reference year)
Data Source
INPU
T M
ETRI
CS
Cropland - (Fritz et al., 2015, 1km)
Tree Cover (Hansen et al. 2013, 1 arc-second per pixel, or ~ 30 meters per pixel at the equator)
Urban and Bare Areas (Land Cover CCI, 2016, 300m) Livestock densities* - Gridded livestock of the world (Wint & Robinson, 2007, 0.05°)
(% per grid cell, 2005)
(% per grid cell, ~2000) (% per grid cell, 2008‐2012).
Livestock heads accounting for amount of land suitable for livestock production (livestock heads per km2, ~2000)
IIASA-IFPRI Cropland Map see publication: http://onlinelibrary.wiley.com/doi/10.1111/gcb.12838/abstract Time-series analysis of Landsat images http://earthenginepartners.appspot.com/science-2013-global-forest CCI-LC project ESA FAO and spatially predicted on suitable land
SY
STEM
M
ETRI
CS Crop Suitability - (Fischer et al. 2012 -
2012, 5 arc min) Yield Gaps - (FAO/IIASA, 2011-2012, 5 arc min)
Crop suitability index (class) for high input level rain-fed cereals (1961-1990) Ratio of actual and potential yield for high input level main crops (2000)
FAO/IIASA, 2011-2012. Global Agro-ecological Zones (GAEZ v3.0) FAO/IIASA, 2011-2012. Global Agro-ecological Zones (GAEZ v3.0)
* An updated recent publication for livestock densities is now available from Robinson, et al. 9 was not utilized due to what appeared to be a lower spatial resolution in many regions, especially in Sub-Saharan Africa. Tables 2-7 found in Supplementary Information excel file

References 1 van Asselen, S. & Verburg, P. H. A Land System representation for global assessments and land-use modeling. Global Change Biology 18, 3125–3148,
doi:10.1111/j.1365-2486.2012.02759.x (2012). 2 Newbold, T. et al. Global effects of land use on local terrestrial biodiversity. Nature 520, 45-50, doi:10.1038/nature14324 (2015). 3 UNEP-WCMC. The World Database on Protected Areas (WDPA). In: (ed. I.A. Unep-Wcmc), Cambridge, UK: UNEP-WCMC. (2016). 4 Mittermeier, R.A., Patricio, R.G., Hoffman, M., Pilgrim, J., Brooks, T., Mittermeier, C.G., Lamoreux, J. & da Fonseca, G.A.B. Hotspots Revisited
CEMEX, Mexico City, Mexico. (2004). 5 Olson, D. M. & Dinerstein, E. The Global 200: Priority Ecoregions for Global Conservation. Annals of the Missouri Botanical Garden 89, 199-224,
doi:10.2307/3298564 (2002). 6 Sanderson, E. W. et al. The human footprint and the last of the wild. Bioscience 52, 891-904 (2002). 7 Waldron, A. et al. Targeting global conservation funding to limit immediate biodiversity declines. Proc Natl Acad Sci U S A 110, 12144-12148,
doi:10.1073/pnas.1221370110 (2013). 8 World Bank Group. World Development Indicators. (World Bank Publications, 2013). 9 Robinson, T. P. et al. Mapping the Global Distribution of Livestock. PLoS ONE 9, e96084, doi:10.1371/journal.pone.0096084 (2014).