Embed Size (px)
Citation preview

Biodiversity in a changing Oosterschelde: from past to present

The ‘Working Documents’ series presents interim results of research commissioned by the Statutory Research Tasks Unit for Nature & the Environment (WOT Natuur & Milieu) from various external agencies. The series is intended as an internal channel of communication and is not being distributed outside the WOT Unit. The content of this document is mainly intended as a reference for other researchers engaged in projects commissioned by the Unit. As soon as final research results become available, these are published through other channels. The present series includes documents reporting research findings as well as documents relating to research management issues. This document was produced in accordance with the Quality Manual of the Statutory
Research Tasks Unit for Nature & the Environment (WOT Natuur & Milieu).
Justification IMARES IMARES utilizes an ISO 9001:2008 certified quality management system (certificate number: 57846-2009-AQ-NLD-RvA). This certificate is valid until 15 December 2012. The organization has been certified since 27 February 2001. The certification was issued by DNV Certification B.V. Furthermore, the chemical laboratory of the Environmental Division has NEN-AND-ISO/IEC 17025:2005 accreditation for test laboratories with number L097. This accreditation is valid until 27 March 2013 and was first issued on 27 March 1997. Accreditation was granted by the Council for Accreditation. WOT-werkdocument 288 – (Project WOT-04-011-007) IMARES rapportnummer: C046/12 The scientific quality of this report has been peer reviewed by a colleague scientist and the head of the department of IMARES. Approved:
Tom Ysebaert scientist
Approved:
Birgit Dauwe head of the Delta Department
Signature:
Signature:
Date:
30 March 2011 Date: 30 March 2011
WOT Working Document 288 presents the findings of a research project commissioned by the Netherlands Environmental Assessment Agency (PBL) and funded by the Dutch Ministry of Economic Affairs, Agriculture and Innovation (EL&I). This document contributes to the body of knowledge which will be incorporated in more policy-oriented publications such as the National Nature Outlook and Environmental Balance reports, and thematic assessments.

W e rk d o c u m e n t 2 8 8
W e t t e l i j k e O n d e r z o e k s t a k e n N a t u u r & M i l i e u
W a g e n i n g e n , M a r c h 2 0 1 2
Biodivers i ty in a changing
Oosterschelde: f rom past to
present
M . Tange l de r
K . T r oos t
D . v an den Ende
T . J .W . Y sebae r t

4 C 12.046 WOT-werkdocument 288.doc
Referaat Dutch: M. Tangelder, Troost, K., D. van den Ende en T.J.W. Ysebaert (2012). Biodiversity in a changing Oosterschelde: from past to present. Wettelijke Onderzoekstaken Natuur & Milieu. Wageningen, Wettelijke Onderzoekstaken Natuur & Milieu, WOT-werkdocument 288. 52 p.; 14 Fig.; 1 Tab.; 26 Ref.; 3 Annexes English: M. Tangelder, Troost, K., D. van den Ende and T.J.W. Ysebaert (2012). Biodiversity in a changing Oosterschelde: from past to present. Wettelijke Onderzoekstaken Natuur & Milieu. Wageningen, Wettelijke Onderzoekstaken Natuur & Milieu, WOT-workdocument 288. 52 p.; 14 Fig.; 1 Tab.; 26 Ref.; 3 Annexes De biodiversiteit onder vogels in de Oosterschelde neemt significant toe van 84 soorten in 1987 tot 105 soorten in 2008. Met name de herbivore en piscivore vogels zijn verantwoordelijk voor deze toename. Broedvogels nemen toe in aantal vanaf 1994. Vissen vertonen echter weinig verandering in de gemeten periode (1970-2008) en vertonen een lichte significante toename in het aantal soorten in de periode 1996-2001. De macrofauna-gemeenschap vertoont een constant hoge Shannon Wiener-index tussen de 2,5 en 3,5, maar de aantallen tussen soorten zijn erg ongelijk verdeeld doordat er veel soorten met relatief lage aantallen zijn en een paar soorten voorkomen in relatief hoge aantallen. De aantallen individuen voor suspensie- en filter feeders en oppervlakte deposit- en facultatieve suspensie feeders nemen significant af over de gehele gemeten periode (1993-2008). Zeehonden (twee soorten) nemen in aantallen toe. Met name Gewone zeehond (Phoca vitulina) vertoont een forse stijging in aantallen en ook de Grijze zeehond (Halichoerus grypus), hoewel minder abundant, vertoont een stijging in aantal waargenomen individuen. Bruinvissen (Phocoena phocoena) zijn niet beschouwd in de analyse. Het areaal aan zeegras vertoont een sterke daling in 1984-1993 van 657 tot 63, een afname van 90%. Ook het schorareaal neemt af. Trefwoorden: Biodiversiteit, Oosterschelde, Gewone zeehond, Grijze zeehond, Zeegras, Schor
©2012 IMARES
P.O. Box 77, NL 4400 AB Yerseke Phone: (0317) 48 09 00; Fax: (0317) 48 73 59; e-mail: [email protected] The Working Documents series is published by the Statutory Research Tasks Unit for Nature & the Environment (WOT Natuur & Milieu), part of Wageningen UR. This document is available from the secretary’s office, and can be downloaded from www.wotnatuurenmilieu.wur.nl. Statutory Research Tasks Unit for Nature & the Environment, P.O. Box 47, NL-6700 AA Wageningen, The Netherlands Phone: +31 317 48 54 71; Fax: +31 317 41 90 00; e-mail: [email protected]; Internet: www.wotnatuurenmilieu.wur.nl All rights reserved. No part of this publication may be reproduced and/or republished by printing, photocopying, microfilm or any other means without the publisher’s prior permission in writing. The publisher accepts no responsibility for any damage ensuing from the use of the results of this study or from the implementation of the recommendations contained in this report. F-0008 vs. 1.8 [2012] Project WOT-04-011 – 007 [Werkdocument 288 − March 2012]
Contents
1 Introduction 7
2 Methodology 9
2.1 Description of the Oosterschelde 9 2.2 Data collection and availability 12 2.3 Data processing, statistics and presentation 13
3 Results 17
3.1 General overview of birds, fish and benthos 17 3.2 Birds trophic groups 19 3.3 Fish trophic groups 21 3.4 Benthic macrofauna trophic groups 22 3.5 Specific habitats & species 23
4 Conclusions and discussion 25
Literature 29
Annex 1 Determined species and their categorization in feeding guilds 31
Annex 2 Overview and specification of collected data 41
Annex 3 Abundance of species per trophic group 43

Biodiversity in a changing Oosterschelde: from past to present 7
1 Introduction
A large-scale engineering project, the ‘Delta project’, caused drastic changes in the ecosystems of the different estuaries of the South-western delta in the Netherlands. Estuarine ecosystems with extensive intertidal habitats (mud and sand flats, marshes) were changed into stagnant fresh, brackish and salt water lakes. Although the Delta Works provided protection and brought safety following the flood disaster of 1953, the Delta Works also have their downsides for the natural environment, water quality and the economy. While some environmental drawbacks were expected at the time, the Delta currently faces many ecological problems, indicating a lack in robustness. Examples are: erosion of tidal flats in the Oosterschelde estuary (Van Zanten and Adriaanse 2008) and oxygen deficiency in Lake Grevelingen (Lengbeek, Bouma et al. 2007). To address these problems, as well as future effects of climate change and sea level rise, possibilities for restoring estuarine dynamics, salinity gradients and connectivity between water bodies are currently investigated (Zuidwestelijke Delta 2010). To be able to predict consequences for species biodiversity we need to know todays biodiversity, as well as how biodiversity of the different water bodies, and the delta area as a whole, changed due to the long-term effects of the ‘Delta project’. This project has led to a dramatic reduction of estuarine dynamics and to a fragmentation of large-scale estuarine nature into multiple, largely isolated systems. All of these systems developed in different directions. For the area as a whole, the overall species biodiversity seems to have increased. By restoring estuarine dynamics, what will be gained and what will be lost?, commissioned by the Ministry of Economic Affairs, Agriculture and Innovation (Dutch: EL&I), IMARES is conducting a study in which the development of overall biodiversity of the South-western Delta area is compared to that of the separate water bodies (Westerschelde and Oosterschelde estuaries, the lakes Veerse Meer, Grevelingenmeer, Haringvliet, Krammer-Volkerak, Zoommeer and Markiezaat) (Project BO-11-015-004). Discussed will be how the biodiversity of some main species groups (birds, fish, benthos, etc.) in each subsystem evolved into today’s state, and how this relate to the biodiversity of the entire Delta area as a whole. Based on these results it is questioned whether restoration of estuarine dynamics will lead to an increase or decrease in biodiversity, species richness, and overall robustness. In addition to, and to complement, the above mentioned project, the PBL Netherlands Environmental Assessment Agency (Planbureau voor de Leefomgeving) commissioned a more detailed study on changes in biodiversity, species richness, functional groups and key species and habitats in a subset of water bodies in the Southwestern Delta: the Oosterschelde estuary, and the lakes Grevelingenmeer, Veerse Meer and Haringvliet. This project is also funded by the Ministry of Economic Affairs, Agriculture and Innovation (Project WOT-04-011-007). The current report is a report in progress, which shows what kind of results can be obtained by analysing these long-term datasets, based on the Oosterschelde as an example. The other three systems will be combined with the Oosterschelde results in a final report in 2012. We used available long-term datasets on macrobenthos, fish, birds, vegetation and key species. We also analysed trends in abundance within functional subsets of shorebirds, fish and benthos. These were related to the timing of the Delta project and other major changes.


Biodiversity in a changing Oosterschelde: from past to present 9
2 Methodology
2.1 Description of the Oosterschelde
An important aspect of the Delta project was the closure of the Oosterschelde. The original plan was to close of the Oosterschelde completely, so it would become a freshwater basin. Soon, a campaign started to keep the Oosterschelde open, to maintain the unique intertidal saltwater environment. The Dutch government agreed to an alternative plan. Instead of closing the Oosterschelde, an open barrier would be built. This barrier (Figure 1) would be closed during storms and high water levels. The construction of the Delta works (Figure 2) started to affect the Oosterschelde in 1959 with the separation of the Veerse Meer. The Grevelingen was closed off by the construction of the Grevelingen dam (1958-1965) and the Krammer-Volkerak was closed off by the Volkerakdam (1957-1969). These constructions cut off the freshwater discharge into the Oosterschelde. The Delta works changed the hydrodynamic characteristics of the Oosterschelde. The construction of the storm surge barrier diminished the cross sectional area of the channels of the inlet of the Oosterschelde from 80,000 m2 in 1984 to approx. 17,900 m2 in 1987. During the construction works of this barrier, the tidal volume, tidal current velocities and the tidal range gradually decreased. Later on, the closure of the Oesterdam (1986) and the Philipsdam (1987) led to a decrease of tidal volume of almost 30 %, but led to an increase in tidal range. Due to the decrease in the tidal volume the current velocities in the Oosterschelde are reduced by about 30%. In total, the tidal range is reduced by about 12 %. As a consequence of this tidal reduction, wave energy dissipation is concentrated on a smaller part of the intertidal flats and salt marshes.
Figure 1: The Oosterschelde storm surge barrier
10 C 12.046 WOT-werkdocument 288.doc
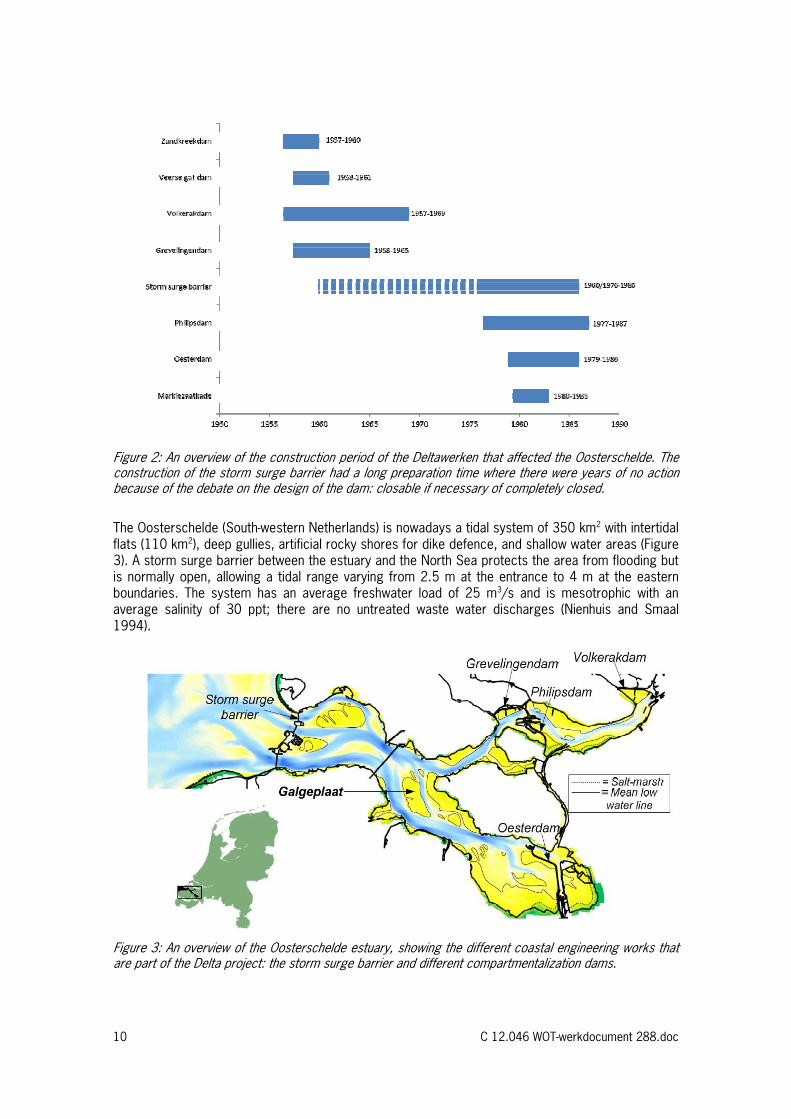
Figure 2: An overview of the construction period of the Deltawerken that affected the Oosterschelde. The construction of the storm surge barrier had a long preparation time where there were years of no action because of the debate on the design of the dam: closable if necessary of completely closed.
The Oosterschelde (South-western Netherlands) is nowadays a tidal system of 350 km2 with intertidal flats (110 km2), deep gullies, artificial rocky shores for dike defence, and shallow water areas (Figure 3). A storm surge barrier between the estuary and the North Sea protects the area from flooding but is normally open, allowing a tidal range varying from 2.5 m at the entrance to 4 m at the eastern boundaries. The system has an average freshwater load of 25 m3/s and is mesotrophic with an average salinity of 30 ppt; there are no untreated waste water discharges (Nienhuis and Smaal 1994).
Figure 3: An overview of the Oosterschelde estuary, showing the different coastal engineering works that are part of the Delta project: the storm surge barrier and different compartmentalization dams.

Biodiversity in a changing Oosterschelde: from past to present 11
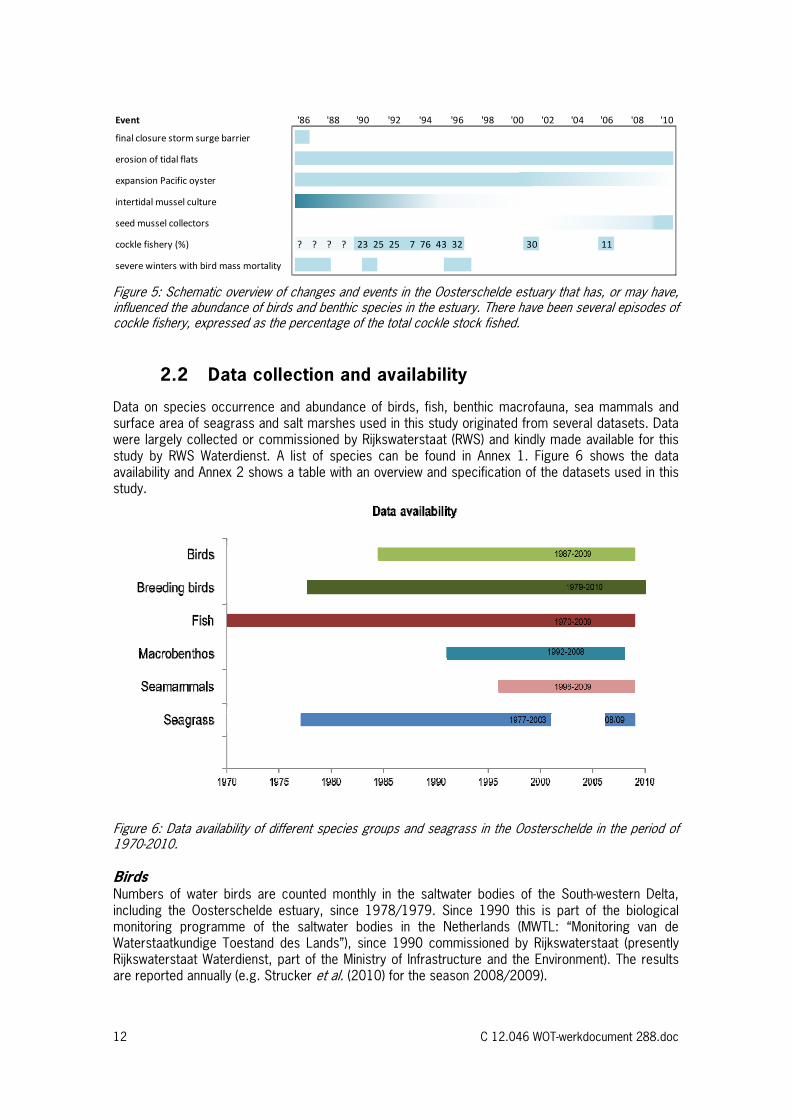
Despite the Oosterschelde remained an open, tidal ecosystem, the geomorphology of the area is still changing as a result of the infrastructural works of the Delta project. The compartmentalization dams and the storm surge barrier decreased the tidal water volume going in and out the Oosterschelde, as well as the tidal currents. As a result, the gullies are too wide for the reduced water volume. During storm events, sediment of the tidal flats is eroded away, whereas tidal currents are too weak to bring back the sediments on the tidal flats. As a consequence the sediments are transported from the higher intertidal zone into the gullies, and many tidal flats are slowly eroding. This process is known as the ‘sand starvation’ problem of the Oosterschelde. Until 2001, on average 0.5 km2 of the intertidal permanently eroded per year (Van Zanten and Adriaanse 2008). According to Jacobse et al. (2008), between 1990 and 2007, 6 km2 of intertidal flats was lost. Each year, an estimated total of 1 million m3 sand is disappearing into the gullies. More than 50% of the entire intertidal of the Oosterschelde estuary is predicted to have disappeared by 2045 (Van Zanten and Adriaanse 2008). Jacobse et al. (2008) mention an expected loss of 40 km2 in the coming century. The Oosterschelde is important as nature conservation area and of particular relevance for wader birds such as Oystercatcher, Dunlin, Grey Plover and Curlew that overwinters in large numbers (Troost and Ysebaert 2011). The Oosterschelde is protected under the international Ramsar convention as wetland of international importance and is part of the Natura 2000 network under the European Birds and Habitats Directive. The area is extensively used for shellfish bottom culture and cockle fishery. There are 1,550 ha oyster culture plots, all located in the eastern part (Figure 4). The Pacific Oyster was introduced to the Oosterschelde in 1964 by fishermen for culture purpose, but started to expand in the wild since 1976. Since then a rapid expansion of the Pacific Oyster was observed, but the increase appears to have stabilised. The percentage of the intertidal area covered by oyster beds increased to around 9% in 2005 (Smaal, Kater et al. 2009). Figure 5 shows an overview of changes and events in the Oosterschelde.
Figure 4: The Oosterschelde estuary, divided into four compartments: North, East, Central and West.
12 C 12.046 WOT-werkdocument 288.doc
Event '86 '88 '90 '92 '94 '96 '98 '00 '02 '04 '06 '08 '10
final closure storm surge barrier
erosion of tidal flats
expansion Pacific oyster
intertidal mussel culture
seed mussel collectors
cockle fishery (%) ? ? ? ? 23 25 25 7 76 43 32 30 11
severe winters with bird mass mortality Figure 5: Schematic overview of changes and events in the Oosterschelde estuary that has, or may have, influenced the abundance of birds and benthic species in the estuary. There have been several episodes of cockle fishery, expressed as the percentage of the total cockle stock fished.
2.2 Data collection and availability
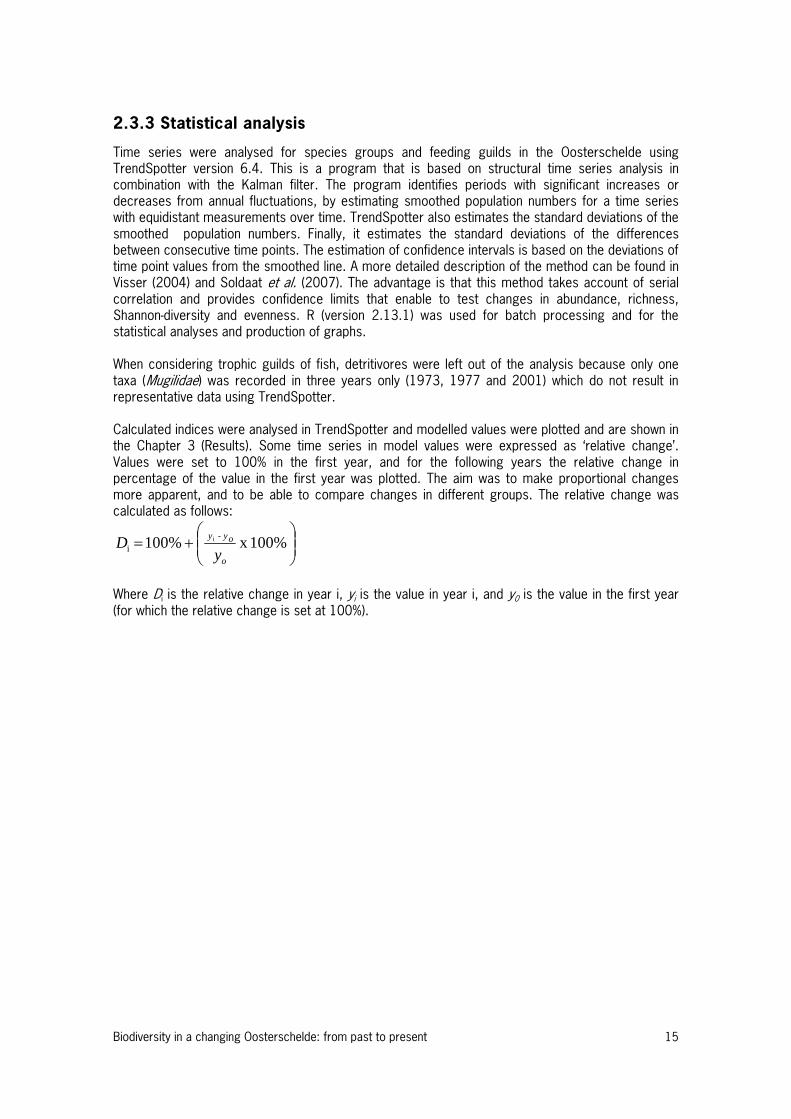
Data on species occurrence and abundance of birds, fish, benthic macrofauna, sea mammals and surface area of seagrass and salt marshes used in this study originated from several datasets. Data were largely collected or commissioned by Rijkswaterstaat (RWS) and kindly made available for this study by RWS Waterdienst. A list of species can be found in Annex 1. Figure 6 shows the data availability and Annex 2 shows a table with an overview and specification of the datasets used in this study.
Figure 6: Data availability of different species groups and seagrass in the Oosterschelde in the period of 1970-2010. Birds Numbers of water birds are counted monthly in the saltwater bodies of the South-western Delta, including the Oosterschelde estuary, since 1978/1979. Since 1990 this is part of the biological monitoring programme of the saltwater bodies in the Netherlands (MWTL: “Monitoring van de Waterstaatkundige Toestand des Lands”), since 1990 commissioned by Rijkswaterstaat (presently Rijkswaterstaat Waterdienst, part of the Ministry of Infrastructure and the Environment). The results are reported annually (e.g. Strucker et al. (2010) for the season 2008/2009).

Biodiversity in a changing Oosterschelde: from past to present 13
Shorebird numbers are counted once per month, during a series of high tides. During high tide, the birds are concentrated on high tide roosts, where they are relatively easy to count. The entire shore of the Oosterschelde estuary is split up into smaller areas, that cover all high tide roosts. The large intertidal flats of Roggenplaat and Neeltje Jans are counted from a boat. Bird data before 1987 were extracted from studies carried out by Meininger et al. (1985) and used as reference data. Fish The Dutch Demersal Fish Survey (DFS) survey covers the coastal waters from the southern border of the Netherlands to Esbjerg, including the Wadden Sea, the outer part of the Ems-Dollard estuary, the Westerschelde and the Oosterschelde (Van Beek, Rijnsdorp et al. 1989). This survey has been carried out in September-October since 1970. In this study, data of the Oosterschelde estuary were used. The Oosterschelde is sampled with a 3m-beam trawl. Fishing is restricted to the tidal channels and gullies deeper than 2 m because of the draught of the research vessel. Benthic macrofauna Within the monitoring programme MWTL, the benthic macrofauna of the Oosterschelde estuary has been monitored since 1990. Sampling is carried out each spring and autumn by the Monitor Taskforce of NIOO-CEME (Netherlands Institute of Ecology – Centre for Estuarine and Marine Ecology), commissioned by the Ministry of Infrastructure and the Environment. Methods are given by Escaravage et al. (2003). Sea mammals Numbers of sea mammals in the Oosterschelde, Grevelingen and Westerschelde were counted yearly in June - July since 1996 until present by Rijkswaterstaat Waterdienst. Sea mammals in the Oosterschelde mainly include seals (Common seal and Grey seal) and Harbour porpoises. Harbour porpoise was left out of the analysis because there were not enough data. Seagrass Mapping of seagrass was done by Rijkswaterstaat using false colour aerial photography (scale 1:10000 and 1:20000 and GPS/INS scale 1:2500). Field measurements included mapping in the field and subsequent analysis using GIS. Data were collected in the Oosterschelde in 1977-2003 and in Grevelingen in 1973-2003. Mapping was done based on three vegetation types. Data of 2009-2008 were extracted from studies by Damm (2009; 2010). Saltmarshes There were no continuous time series of saltmarsh coverage available. Therefore these data were collected from a study by Van der Pluijm & De Jong (1998) for the years1865, 1910, 1938, 1960, 1978, 1988, 1995. Due to the construction of compartmentalisation dams, the surface area of the Oosterschelde proper was reduced. The Oesterdam cut off the most Eastern part of the Oosterschelde, and through construction of the Philipsdam and Grevelingendam the Oosterschelde was cut off from the Grevelingen and Krammer-Volkerak. Therefore, the area of saltmarshes outside the current limits of the Oosterschelde were left out.
2.3 Data processing, statistics and presentation
2.3.1 General
Datasets were checked for synonyms in species names. Incomplete determinations were either deleted or scaled back to a higher taxonomic level. In the bird dataset, missing values were replaced by modelled values through imputing (Underhill & Prys-Jones 1994 in Strucker, Arts et al. 2008). We used the dataset from 1987/1988, when the closure of the Oosterschelde estuary was completed. From this year on, all data have been checked, validated, and missing data imputed.

14 C 12.046 WOT-werkdocument 288.doc
Each species or taxonomic endpoint level of birds (including breeding birds), fish and macrobenthos were categorized in feeding guilds (Table 1). A list of determined species and their classification in feeding guilds can be found in Annex 1. Table 1: Categorization in feeding guilds
Birds Breeding birds* Fish Benthos
Benthivores Benthivores Benthivores 0. not determined to species level
Carnivores Omnivores Bentho-piscivores 1. suspension or filter feeder
Herbivores Piscivores Piscivores 2.interface- , surface deposit- and facultative suspension feeder
Omnivores Planktivores 3.subsurface deposit feeder, grazer
Piscivores 4.predator, omnivore, scavenger * only breeding birds that are strictly related to marine habitats were counted. These did not include herbivores (duck and geese) and carnivores (birds of prey).
2.3.2 Indices
Biodiversity and evenness is expressed by using the Shannon Wiener index for biodiversity and species evenness index to show how equal the group of species are numerically. The Shannon Wiener index is one of several diversity indices used to measure diversity in categorical data. Typically the value of the index ranges from 1.5 (low species richness and evenness) to 3.5 (high species evenness and richness), though values beyond these limits may be encountered. Because the Shannon Wiener index (H) gives a measure of both species numbers and the evenness (J) of their abundance, the resulting figure does not give an absolute description of a site's biodiversity. It is particularly useful when comparing similar ecosystems or habitats, as it can highlight one example being richer or more even than another. Below the calculations for both indices are elaborated. Shannon Wiener index
Evenness ni = the number of individuals in species i; the abundance of species i. N = the total number of individuals. Pi = number of Pilou. The relative abundance of each species, calculated as the proportion of
individuals of a given species to the total number of individuals in the community: ni/N. S = the number of species (species richness). In this report we will refer to the Shannon Wiener index as Shannon-diversity. In this report Shannon-diversity and evenness were determined for birds, fish and macrobenthos data. The macrobenthos data showed presence of very high numbers of Hydrobia ulvae in 2001 and 2002. The Shannon Wiener index is sensitive to large differences in evenness between species and therefore can give a misleading impression of low species richness. Therefore data of this species were removed in all years. Besides biodiversity and evenness, species richness and abundance are also expressed, where richness is the number of species and abundance the amount of individuals within a group or subgroup.
s
PiLn *Pi - H1i
S
1 i LnSH
J
Biodiversity in a changing Oosterschelde: from past to present 15
2.3.3 Statistical analysis
Time series were analysed for species groups and feeding guilds in the Oosterschelde using TrendSpotter version 6.4. This is a program that is based on structural time series analysis in combination with the Kalman filter. The program identifies periods with significant increases or decreases from annual fluctuations, by estimating smoothed population numbers for a time series with equidistant measurements over time. TrendSpotter also estimates the standard deviations of the smoothed population numbers. Finally, it estimates the standard deviations of the differences between consecutive time points. The estimation of confidence intervals is based on the deviations of time point values from the smoothed line. A more detailed description of the method can be found in Visser (2004) and Soldaat et al. (2007). The advantage is that this method takes account of serial correlation and provides confidence limits that enable to test changes in abundance, richness, Shannon-diversity and evenness. R (version 2.13.1) was used for batch processing and for the statistical analyses and production of graphs. When considering trophic guilds of fish, detritivores were left out of the analysis because only one taxa (Mugilidae) was recorded in three years only (1973, 1977 and 2001) which do not result in representative data using TrendSpotter. Calculated indices were analysed in TrendSpotter and modelled values were plotted and are shown in the Chapter 3 (Results). Some time series in model values were expressed as ‘relative change’. Values were set to 100% in the first year, and for the following years the relative change in percentage of the value in the first year was plotted. The aim was to make proportional changes more apparent, and to be able to compare changes in different groups. The relative change was calculated as follows:
100% x 100% -
ii
o
oyy
yD
Where Di is the relative change in year i, yi is the value in year i, and y0 is the value in the first year (for which the relative change is set at 100%).


Biodiversity in a changing Oosterschelde: from past to present 17
3 Results
3.1 General overview of birds, fish and benthos
Figure 7 displays time series of birds, fish and benthos showing trends in Shannon-diversity, evenness and richness. Birds show a significant increase in Shannon-diversity and evenness for the period of 1988-2002, after which the trend levelled off. For the years 1998 - 2001 this corresponds with an increase in species richness. The figures show a slight decrease in fish species richness in the period of 1980-1989 (non-significant), which coincides with the construction of the storm surge barrier and Oesterdam in the period 1979 – 1986. Species richness among fish increased again in the period 1996-2000. Species richness among birds and fish seem to decrease from 2003 onward where benthos data show an increase. These changes, however, were not significant.
Figure 7: Time series of birds, fish and benthos showing Shannon Wiener (a) and evenness (b) index and species richness (c). Data series are expressed in relative in- or decrease over time. Significant changes are indicated as follows: + green = significant increase, - red = significant decrease, 0 = no (detectable) trend.
SW Evenness Richness
year birds
fish
ben
thos
birds
fish
ben
thos
birds
fish
ben
thos
1970 0 0 0
1971 0 0 0
1972 0 0 0
1973 0 0 0
1974 0 0 0
1975 0 0 0
1976 0 0 0
1977 0 0 0
1978 0 0 0
1979 0 0 0
1980 0 0 0
1981 0 0 0
1982 0 0 0
1983 0 0 0
1984 0 0 0
1985 0 0 0
1986 0 0 0
1987 0 0 0 0 0 0
1988 + 0 + 0 0 0
1989 + 0 + 0 0 0
1990 + 0 + 0 0 0
1991 + 0 + 0 0 0
1992 + 0 0 + 0 0 0 0 0
1993 + 0 0 + 0 0 0 0 0
1994 + 0 0 + 0 0 0 0 0
1995 + 0 0 + 0 0 0 0 0
1996 + 0 0 + 0 0 0 + 0
1997 + 0 0 + 0 0 0 + 0
1998 + 0 0 + 0 0 + + 0
1999 + 0 0 + 0 0 + + 0
2000 + 0 0 + 0 0 + + 0
2001 + 0 0 + 0 0 + 0 0
2002 + 0 0 + 0 0 0 0 0
2003 0 0 0 0 0 0 0 0 0
2004 0 0 0 0 0 0 0 0 0
2005 0 0 0 0 0 0 0 0 0
2006 0 0 0 0 0 0 0 0 0
2007 0 0 0 0 0 0 0 0 0
2008 0 0 0 0 0 0 0 0 0
2009 0 0 0 0 0 0
a.
b.
c.
18 C 12.046 WOT-werkdocument 288.doc
year 1992
1993
1994
1995
1996
1997
1998
1999
2000
2001
2002
2003
2004
2005
2006
2007
2008
Benthos NorthSW 0 0 0 0 0 0 0 0 0 0 0 0 0 0 0 0 0Evennes 0 0 0 0 0 0 0 0 0 0 0 0 0 0 0 0 0Richness 0 0 0 0 0 0 0 0 0 0 0 0 0 0 0 0 0Benthos EastSW 0 0 0 0 0 0 0 0 0 0 0 0 0 0 0 0 0Evennes 0 0 0 0 0 0 0 0 0 0 0 0 0 0 0 0 0Richness 0 0 0 0 0 0 0 0 0 0 0 0 0 0 0 0 0Benthos WestSW 0 0 0 0 0 0 0 0 0 0 0 0 0 0 0 0 0Evennes 0 0 0 0 0 0 0 0 0 0 0 0 0 0 0 0 0Richness 0 0 0 0 0 0 0 0 0 0 0 0 0 0 0 0 0
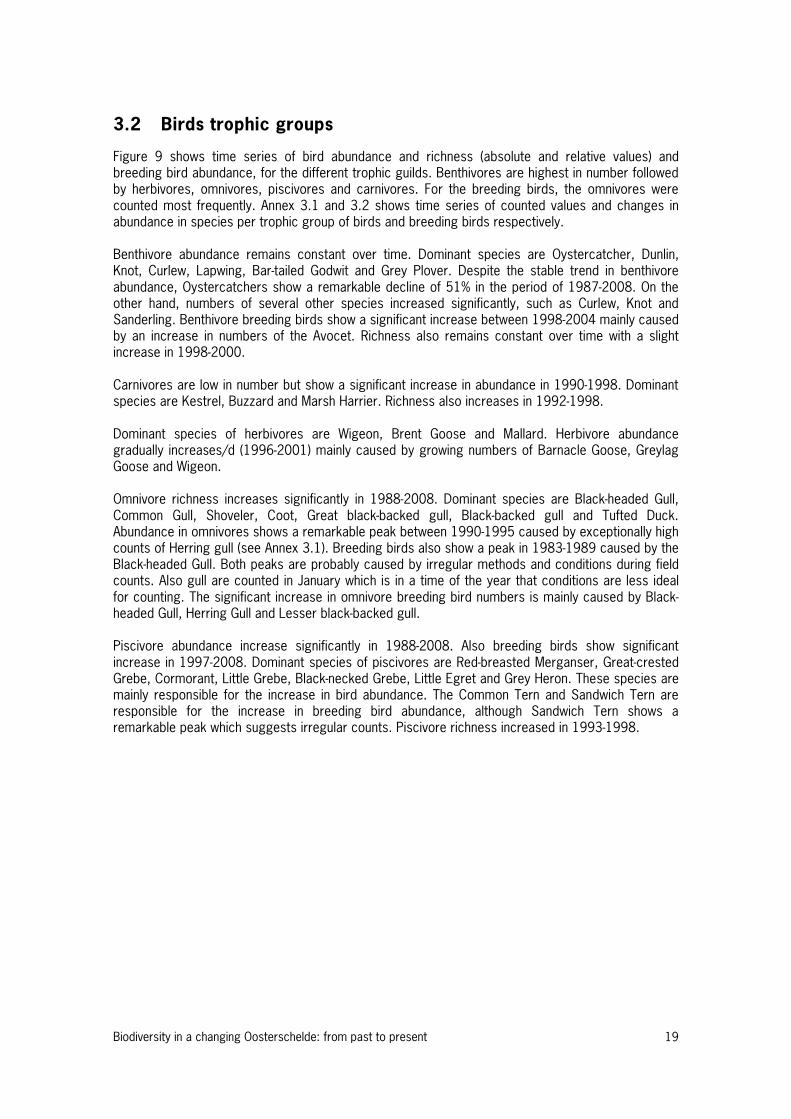
Benthos Shannon-diversity of benthic macrofauna, subdivided by the Northern, Eastern and Western compartments remains high between 2.5 and 3.5 in the period of 1992-2008 (Figure 8). The benthic community is relatively uneven with an evenness around 0.5-1.0. A high species richness causes the high score in Shannon diversity. A lower evenness is explained by many rare species which occur at very low number and few species that occur in very high numbers. Relative richness in the Western and Eastern compartments increases with 14% and 13% respectively but these changes were not significant.
Figure 8: Time series of benthos in different areas of the Oosterschelde (north, east and west) showing Shannon-diversity/evenness and relative Shannon-diversity/evenness (a,b) and richness and relative richness (c,d). Shown here are the TrendSpotter models (a,c) and relatives changes in modelled values (b,d). Significant changes are indicated as follows: + green = significant increase, - red = significant decrease, 0 = no (detectable) trend.
a. b.
c. d.
Biodiversity in a changing Oosterschelde: from past to present 19
3.2 Birds trophic groups
Figure 9 shows time series of bird abundance and richness (absolute and relative values) and breeding bird abundance, for the different trophic guilds. Benthivores are highest in number followed by herbivores, omnivores, piscivores and carnivores. For the breeding birds, the omnivores were counted most frequently. Annex 3.1 and 3.2 shows time series of counted values and changes in abundance in species per trophic group of birds and breeding birds respectively. Benthivore abundance remains constant over time. Dominant species are Oystercatcher, Dunlin, Knot, Curlew, Lapwing, Bar-tailed Godwit and Grey Plover. Despite the stable trend in benthivore abundance, Oystercatchers show a remarkable decline of 51% in the period of 1987-2008. On the other hand, numbers of several other species increased significantly, such as Curlew, Knot and Sanderling. Benthivore breeding birds show a significant increase between 1998-2004 mainly caused by an increase in numbers of the Avocet. Richness also remains constant over time with a slight increase in 1998-2000. Carnivores are low in number but show a significant increase in abundance in 1990-1998. Dominant species are Kestrel, Buzzard and Marsh Harrier. Richness also increases in 1992-1998. Dominant species of herbivores are Wigeon, Brent Goose and Mallard. Herbivore abundance gradually increases/d (1996-2001) mainly caused by growing numbers of Barnacle Goose, Greylag Goose and Wigeon. Omnivore richness increases significantly in 1988-2008. Dominant species are Black-headed Gull, Common Gull, Shoveler, Coot, Great black-backed gull, Black-backed gull and Tufted Duck. Abundance in omnivores shows a remarkable peak between 1990-1995 caused by exceptionally high counts of Herring gull (see Annex 3.1). Breeding birds also show a peak in 1983-1989 caused by the Black-headed Gull. Both peaks are probably caused by irregular methods and conditions during field counts. Also gull are counted in January which is in a time of the year that conditions are less ideal for counting. The significant increase in omnivore breeding bird numbers is mainly caused by Black-headed Gull, Herring Gull and Lesser black-backed gull. Piscivore abundance increase significantly in 1988-2008. Also breeding birds show significant increase in 1997-2008. Dominant species of piscivores are Red-breasted Merganser, Great-crested Grebe, Cormorant, Little Grebe, Black-necked Grebe, Little Egret and Grey Heron. These species are mainly responsible for the increase in bird abundance. The Common Tern and Sandwich Tern are responsible for the increase in breeding bird abundance, although Sandwich Tern shows a remarkable peak which suggests irregular counts. Piscivore richness increased in 1993-1998.

20 C 12.046 WOT-werkdocument 288.doc
year 1979
1980
1981
1982
1983
1984
1985
1986
1987
1988
1989
1990
1991
1992
1993
1994
1995
1996
1997
1998
1999
2000
2001
2002
2003
2004
2005
2006
2007
2008
2009
Birds abundancebenthivores 0 0 0 0 0 0 0 0 0 0 0 0 0 0 0 0 0 0 0 0 0 0carnivores 0 0 0 + + + + + + + + + 0 0 0 0 0 0 0 0 0 0herbivores 0 0 0 0 0 0 0 0 0 + + + + + + + 0 0 0 0 0 0omnivores 0 0 0 + + + 0 0 - 0 0 0 0 0 0 0 0 0 0 0 0 0piscivores 0 + + + + + + + + + + + + + + + + + + + + +Breeding bird abundancebenthivores 0 0 0 0 0 0 0 0 0 0 0 0 0 0 0 0 0 0 0 + + + + + + + 0 0 0 0omnivores 0 0 0 0 0 0 0 0 0 0 0 0 0 0 0 + + + + + + + + + + + + + + +piscivores 0 0 0 0 0 0 0 0 0 0 0 0 0 0 0 0 0 0 + + + + + + + + + + + +Birds richnessbenthivores 0 0 0 0 0 0 0 0 0 0 0 + + + 0 0 0 0 0 0 0 0carnivores 0 0 0 0 0 + + + + + + + 0 0 0 0 0 0 0 0 0 0herbivores 0 + + + + + + + + + + + + + + + + + + + + +omnivores 0 + + + + + + + + + + + + + + + + + + + + +piscivores 0 0 0 0 0 0 + + + + + 0 0 0 0 0 0 0 0 0 0 0
Figure 9: Time series of birds and breeding birds categorized in trophic groups showing bird abundance/richness (a,c) and relative abundance/richness (b,d) and breeding bird abundance (e) and relative abundance (f) of trophic groups. Due to the low number of species of breeding bird couples, richness is not considered. Significant changes are indicated as follows: + green = significant increase, - red = significant decrease, 0 = no (detectable) trend.
b.
d.
a.
c.
e. f.

Biodiversity in a changing Oosterschelde: from past to present 21
3.3 Fish trophic groups
Figure 10 shows time series of fish relative abundance (a) and relative richness (b). Community structure is composed of a large number of benthivores followed by planktonivores, bentho-piscivores/piscivores and detritivores respectively. Annex 3.3 shows time series of changes in abundance in species per trophic group of fish. Benthivore abundance shows no significant change. Dominants species are European plaice (Pleuronectes platessa), Common dab (Limanda limanda), Common sole (Solea solea) and Pouting (Trisopterus luscus). Richness showed a significant increase between 1998-2001. Bentho-piscivore also show no significant change in abundance. Most abundant species are European eel (Anguila anguila) and Shorthorn sculpin (Myoxocephalus scorpius). Richness showed a significant increase between 1997-2001. Piscivore abundance as shows no significant change. Whiting (Merlangius merlangus) is most abundant and to a lesser degree followed by Cod (Gadus morhua), Horse mackarel (Trachurus trarchurus) and Sea bass (Dicenthrarchus labrax). Richness showed a significant increase between 1995-1998. Planktivore abundance shows a significant increase in 1997-1999 and remains constant in richness. This increase in abundance could be related to higher algae availability as a consequence of increased visibility. Dominant species are Pomatoschistus sp. followed by Herring (Clupea harengus) and Sprat (Sprattus sprattus).
Figure 10: Time series of fish categorized in trophic groups showing relative abundance (a) and relative richness (b) trophic groups. Significant changes are indicated as follows: + green = significant increase, - red = significant decrease, 0 = no (detectable) trend.
a.
b.
Fish abundance Fish richness
year bent
hivo
res
bent
ho-p
isci
vore
s
detr
itivo
res
pisc
ivor
es
plan
kton
ivor
es
bent
hivo
res
bent
ho-p
isci
vore
s
detr
itivo
res
pisc
ivor
es
plan
kton
ivor
es
1970 0 0 0 0 0 0 0 0 0 01971 0 0 0 0 0 0 0 0 0 01972 0 0 0 0 0 0 0 0 0 01973 0 0 0 0 0 0 0 0 0 01974 0 0 0 0 0 0 0 0 0 01975 0 0 0 0 0 0 0 0 0 01976 0 0 0 0 0 0 0 0 0 01977 0 0 0 0 0 0 0 0 0 01978 0 0 0 0 0 0 0 0 0 01979 0 0 0 0 0 0 0 0 0 01980 0 0 0 0 0 0 0 0 0 01981 0 0 0 0 0 0 0 0 0 01982 0 0 0 0 0 0 - 0 0 01983 0 0 0 0 0 0 - 0 0 01984 0 0 0 0 0 0 0 0 0 01985 0 0 0 0 0 0 0 0 0 01986 0 0 0 0 0 0 0 0 0 01987 0 0 0 0 0 0 0 0 0 01988 0 0 0 0 0 0 0 0 0 01989 0 0 0 0 0 0 0 0 0 01990 0 0 0 0 0 0 0 0 0 01991 0 0 0 0 0 0 0 0 0 01992 0 0 0 0 0 0 0 0 0 01993 0 0 0 0 0 0 0 0 0 01994 0 0 0 0 0 0 0 0 0 01995 0 0 0 0 0 0 0 0 + 01996 0 0 0 0 0 0 0 0 + 0
1997 0 0 0 0 + 0 + 0 + 01998 0 0 0 0 + + + 0 + 01999 0 0 0 0 + + + 0 0 02000 0 0 0 0 0 + 0 0 0 02001 0 0 0 0 0 + 0 0 0 02002 0 0 0 0 0 0 0 0 0 02003 0 0 0 0 0 0 0 0 0 02004 0 0 0 0 0 0 0 0 0 02005 0 0 0 0 0 0 0 0 0 02006 0 0 0 0 0 0 0 0 0 02007 0 0 0 0 0 0 0 0 0 02008 0 0 0 0 0 0 0 0 0 02009 0 0 0 0 0 0 0 0 0 0
b.
a.
22 C 12.046 WOT-werkdocument 288.doc
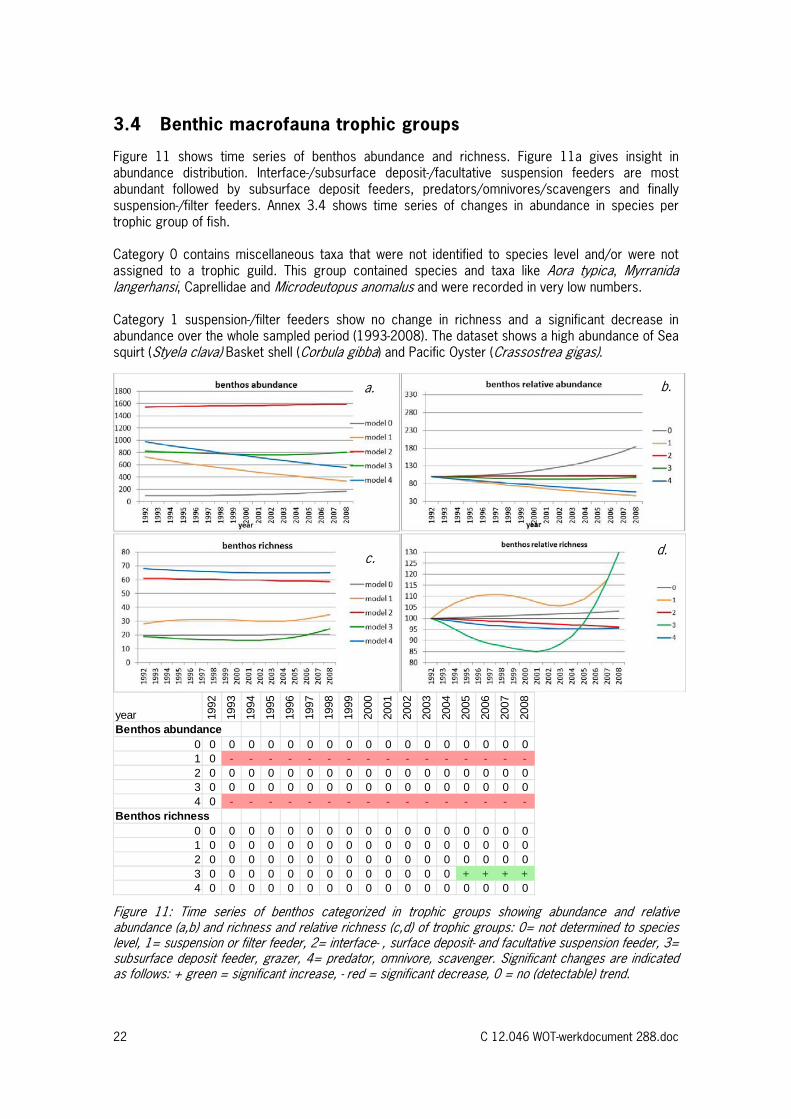
3.4 Benthic macrofauna trophic groups
Figure 11 shows time series of benthos abundance and richness. Figure 11a gives insight in abundance distribution. Interface-/subsurface deposit-/facultative suspension feeders are most abundant followed by subsurface deposit feeders, predators/omnivores/scavengers and finally suspension-/filter feeders. Annex 3.4 shows time series of changes in abundance in species per trophic group of fish. Category 0 contains miscellaneous taxa that were not identified to species level and/or were not assigned to a trophic guild. This group contained species and taxa like Aora typica, Myrranida langerhansi, Caprellidae and Microdeutopus anomalus and were recorded in very low numbers. Category 1 suspension-/filter feeders show no change in richness and a significant decrease in abundance over the whole sampled period (1993-2008). The dataset shows a high abundance of Sea squirt (Styela clava) Basket shell (Corbula gibba) and Pacific Oyster (Crassostrea gigas).
year 1992
1993
1994
1995
1996
1997
1998
1999
2000
2001
2002
2003
2004
2005
2006
2007
2008
Benthos abundance0 0 0 0 0 0 0 0 0 0 0 0 0 0 0 0 0 01 0 - - - - - - - - - - - - - - - -2 0 0 0 0 0 0 0 0 0 0 0 0 0 0 0 0 03 0 0 0 0 0 0 0 0 0 0 0 0 0 0 0 0 04 0 - - - - - - - - - - - - - - - -
Benthos richness0 0 0 0 0 0 0 0 0 0 0 0 0 0 0 0 0 01 0 0 0 0 0 0 0 0 0 0 0 0 0 0 0 0 02 0 0 0 0 0 0 0 0 0 0 0 0 0 0 0 0 03 0 0 0 0 0 0 0 0 0 0 0 0 0 + + + +4 0 0 0 0 0 0 0 0 0 0 0 0 0 0 0 0 0
Figure 11: Time series of benthos categorized in trophic groups showing abundance and relative abundance (a,b) and richness and relative richness (c,d) of trophic groups: 0= not determined to species level, 1= suspension or filter feeder, 2= interface- , surface deposit- and facultative suspension feeder, 3= subsurface deposit feeder, grazer, 4= predator, omnivore, scavenger. Significant changes are indicated as follows: + green = significant increase, - red = significant decrease, 0 = no (detectable) trend.
a. b.
c. d.
Biodiversity in a changing Oosterschelde: from past to present 23
Category 2 interface- /surface deposit-/facultative suspension feeders show no change in abundance and richness over time. The dataset shows a high abundance of bristle worms (Aphelochaeta marioni, Pygospio elegans, Lanic conchilega, Spiophanes bombyx) and White furrow shell (Abra alba). Category 3 subsurface deposit feeders and grazers, show a constant abundance and a significant increase in richness from 2005. The dataset shows high abundance of worms (Scoloplos armiger, Capitella capitata), and a mollusc (Cyanoplax cuverna). Category 4 predators, omnivores and scavengers are a relatively large group of species that occur in relatively low abundance. Abundance of species shows a significant decreasing trend in 1993-2008 and no change in richness. Dominant species are polychaete worms (Lepidonotus squamatus, Nephtys hombergii, Malmgreniella lunulata and Subadyte pellucida), and anemones (Actiniaria).
3.5 Specific habitats & species
3.5.1 Sea mammals
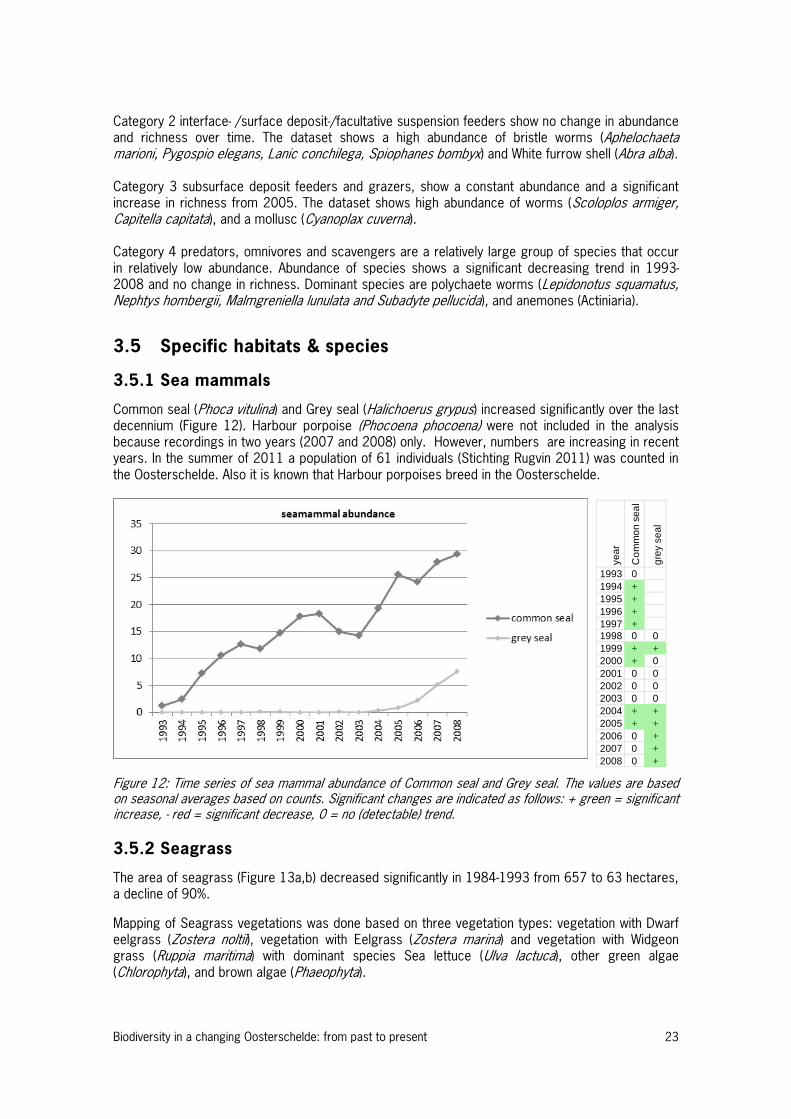
Common seal (Phoca vitulina) and Grey seal (Halichoerus grypus) increased significantly over the last decennium (Figure 12). Harbour porpoise (Phocoena phocoena) were not included in the analysis because recordings in two years (2007 and 2008) only. However, numbers are increasing in recent years. In the summer of 2011 a population of 61 individuals (Stichting Rugvin 2011) was counted in the Oosterschelde. Also it is known that Harbour porpoises breed in the Oosterschelde.
Figure 12: Time series of sea mammal abundance of Common seal and Grey seal. The values are based on seasonal averages based on counts. Significant changes are indicated as follows: + green = significant increase, - red = significant decrease, 0 = no (detectable) trend. 3.5.2 Seagrass
The area of seagrass (Figure 13a,b) decreased significantly in 1984-1993 from 657 to 63 hectares, a decline of 90%. Mapping of Seagrass vegetations was done based on three vegetation types: vegetation with Dwarf eelgrass (Zostera noltii), vegetation with Eelgrass (Zostera marina) and vegetation with Widgeon grass (Ruppia maritima) with dominant species Sea lettuce (Ulva lactuca), other green algae (Chlorophyta), and brown algae (Phaeophyta).
year
Co
mm
on s
eal
gre
y se
al
1993 01994 +1995 +1996 +1997 +1998 0 01999 + +2000 + 02001 0 02002 0 02003 0 02004 + +2005 + +2006 0 +2007 0 +2008 0 +

24 C 12.046 WOT-werkdocument 288.doc
Figure 13: Time series of area of seagrass (a) and relative change in area of seagrass (b). Significant changes are indicated as follows: + green = significant increase, - red = significant decrease, 0 = no (detectable) trend. 3.5.3 Saltmarshes
Figure 14 shows time series of saltmarsh coverage in different regions of the Oosterschelde (a,b,c) and of the total Oosterschelde (d). North and Kom show an increase in 1938-1978 and 1910-1960 respectively. After this period data show a constant decline. Overall area of salt marshes in the whole Oosterschelde showed a decreasing trend (R2 = 0,72).
Figure 14: Area of saltmarshes in hectares based on a study by Van der Pluijm and De Jong (1998). Subareas of the Oosterschelde North (a), Kom in the east (b) and Middle (c) and of the whole Oosterschelde (d).
a. b.
a. b.
c. d.
year 1977
1978
1979
1980
1981
1982
1983
1984
1985
1986
1987
1988
1989
1990
1991
1992
1993
1994
1995
1996
1997
1998
1999
2000
2001
2002
2003
Seagrass 0 0 0 0 0 0 0 - - - - - - - - - - 0 0 0 0 0 0 + + 0 0
Biodiversity in a changing Oosterschelde: from past to present 25
4 Conclusions and discussion
This chapter describes the preliminary conclusions and discussion. Monitoring of birds, benthos en sea mammals started after completion of the storm surge barrier. It is therefore not possible to study direct effects of (construction of) the storm surge barrier on these groups from the available dataset. We did include bird counts from the period before completion of the storm surge barrier (Meininger et al. (1985)), but these data were not suitable for calculation of Shannon-diversity, evenness and richness because only a selection of bird species seemed to have been counted. These data will be added in the final report in 2012. The area of saltmarshes and seagrass meadows has been monitored for a longer period, and both show a decline which may be caused by long-term changes in tidal currents and erosion of tidal flats (‘sediment starvation’), as well as other long-term physical and chemical changes (e.g. salinity, turbidity, …) as a consequence of the Delta project. Birds Bird biodiversity increased significantly, from a Shannon index of 2.15 in 1988 to 2.9 in 2002. Species richness also increased, from 84 species in 1987 to 105 species in 2008. The increase in abundance in breeding birds could be related to a large scale nature development project, called “Plan Tureluur”, that was executed in 1999. This plan was designed to compensate for the loss of intertidal flats as a consequence of sand starvation. The total plan aims to develop 850 hectares of salt, inland nature along the borders of the Oosterschelde mainly on Schouwen-Duivenland. Between 1999 and 2009, 510 hectares of nature divided over numerous larger and smaller areas was developed. These areas are of high importance as foraging and breeding grounds for birds. It is likely that the growth of breeding bird couples was supported by this increase in habitat. Especially the Pied avocet showed high increase in abundance. It has to be underlined here that Plan Tureluur concerns inland, saltwater nature areas lacking tidal influence and not to be confused with saltmarshes that are part of the estuarine ecosystem. The explanation for the increase in bird abundance is more difficult to relate. The significant increase in piscivore bird abundance (‘88-‘08) and richness (‘97-‘08 for birds) could be explained due to the fact that the Oosterschelde became less turbid with the construction of the storm surge barrier. With increased visibility their food source of fish are more easily preyed upon. Carnivores and herbivores also increase in abundance (‘90-‘98,‘96-’01 resp.) and richness (‘92-’98, ‘98-’08 resp.). Omnivores show a constant significant increase in richness but their abundance remains relatively constant. Benthivores show now change in abundance and a slight increase in richness for the period of 1998-2000. The increase in abundance and richness of several trophic guilds could be related to an environmental management aimed at conservation of species. For example more nesting boxes are placed that enhances breeding of carnivores. Also an increase of habitat diversity along the Oosterschelde due to nature development probably contributed. Benthivore, omnivore and piscivore breeding bird abundance increased significantly (’99-’04, ’94-’08, ’97-’08 resp.) this could be related to an increase in nature area and a combination of the above mentioned factors. Fish Fish show little change. Species richness decreases in the period of 1980-1989, which coincides with the construction of the storm surge barrier and Oesterdam in the period 1979 – 1986. Although this change was not significant, fish may have been affected by the disturbance caused by the construction of dams. Species richness among fish increased significantly in the period 1996-2000.

26 C 12.046 WOT-werkdocument 288.doc
Abundance and richness within trophic guilds of fish also show little change. Planktivore abundance increases for a short period in 1997-1999. This may be related to increased availability of food (algae) as a consequence of higher visibility in the Oosterschelde. Benthivore, bentho-piscivore and piscivore richness increases (‘98-‘01,‘97-‘99 ,’95-’98 resp.) whereas bentho-piscivores already decreased in the period 1982-‘83. The data on fish (obtained from the IMARES database) show a selection of mainly the smaller species due to a combination of low fishing speed and fine mesh size (20 mm) during sampling by 3 m-beamtrawl. Piscivores are amongst the faster swimming fish. The low fishing speed during sampling could explain why no significant trend in abundance can be concluded, because low numbers were caught. Piscivore richness did increase significantly (’95-‘98). Benthos Benthic macrofauna show a constant high Shannon index of 2.5 - 3.5. The reason for this score is high species richness. The community is very uneven (0.5-1.0) due to many species with low abundance and few species with high abundance. Trophic guilds of suspension/ filter feeders (category 1) and predators/predators, omnivores/ and scavengers (category 4) showed a constant significant decrease in abundance (1993-2008). Subsurface deposit feeders and grazers, (category 3) show an increase in richness in 2005-2008. Interface-, surface deposit- and facultative suspension feeders (category 2) showed no change. It should be kept in mind that sampling methods for macrobenthic fauna within the MAWTL programme do not give a complete picture of macrobenthic fauna present in the Oosterschelde estuary. For larger animals that occur in lower densities (e.g. the lugworm Arenicola marina, shellfish such as cockles Cerastoderma edule and Mya arenaria), the sampled surface is too small. The method is also not well suited to highly mobile epifauna such as crabs and shrimp. Finally, the sampling points generally do not include hard substrates such as oyster beds, that do harbour a high biomass and high species richness. Although analysis of the MWTL dataset did not reveal large changes that may be attributed to the Delta project or other human induced changes, this does not necessarily mean that the benthic community did not change. The largest changes may have occurred on hard substrates. Since the 1970’s, cover by beds of the Pacific oyster has been increasing. These oyster beds increase habitat heterogeneity on the small scale of the oyster bed, but also on the larger scale of the estuary (Troost 2010). Pacific oysters create structurally complex structures that offer settlement opportunities and shelter for many different organisms. Because in most reefs oyster patches are alternated with bare patches, also many species living in soft sediments are present. De Kluijver and Dubbeldam (2003) monitored hard substrates such as (mainly) dikes. The main changes they found were due to the expansion of the Pacific oyster. They showed that biodiversity on hard substrates decreases with an increasing cover of Pacific oysters. However, Pacific oyster reefs have also been demonstrated to increase species richness and biodiversity when they occur on soft sediments (Kochman, Buschbaum et al. 2008; Markert, Wehrmann et al. 2009; Troost 2009). They also form a suitable habitat for introduced (exotic) species that are from the same area of origin: the North-West Pacific. Sea mammals Sea mammal abundance increased significantly. The Common seal grew in abundance (significant in ’94-’97,’99,’00,’04,’05) and although less abundant, in recent years (’04-‘08) numbers of the Grey seal also showed a significant increasing trend.
Biodiversity in a changing Oosterschelde: from past to present 27
Until the 1970’s numbers of Common seal severely declined (Compendium voor de Leefomgeving 2012). The most important cause was the accumulation of heavy metals (PCB’s) in fish that was consumed by seals. Also they were hunted upon until 1961. In addition the construction of the Deltaworks also caused disturbance. From 1980 numbers started increasing despite a virus that affected seals in 1988 and 2002 and killed around 50% of the seals, the population recovered (Compendium voor de Leefomgeving 2012). Seagrass This study shows that the area of seagrass in the Oosterschelde decreased significantly in 1984-1993 from 657 to 63 hectares, a decline of 90%. The exact cause of this decline is uncertain and could have many causes. A study by Kamermans et al. (1999) showed a relation between the increased salinity as a consequence of the Grevelingendam that considerately reduced freshwater inflow (as also in the Oosterschelde) and the decreased area of Zostera marina although this relation was not significant. Saltmarshes The reduction in area of saltmarshes could be related to the construction of the Deltaworks. The area of saltmarshes grew in some regions of the Oosterschelde in the first half of the 20th century (East until 1960 and North until 1978) by natural accretion by sedimentation and succession. After this period results show a constant decline. Overall area of salt marshes in the whole Oosterschelde showed a decreasing trend (R2 = 0,72). By the completion of the dams Markiezaatkade (1983), Oesterdam (1986), Oosterschelde storm surge barrier (1986) and Philipsdam (1987) area of saltmarshes decreased due to construction and because a part of the Oosterschelde became a fresh water lake with no tide (Zoommeer and Markiezaat). In the following years erosion occurred in the Oosterschelde causing a gradual decrease in area of saltmarshes (Smaal and Boeije 1991). Later it became apparent that the storm surge barrier caused a sediment shortage due to a decreases tidal water volume and tidal currents (a phenomena called “sand starvation”). During storms sediment of the tidal flats is eroded away, whereas tidal currents are too weak to bring back the sediments on the tidal flats. As a consequence the sediments are transported from the higher intertidal zone, salt marshes, into the gullies, and many tidal flats are slowly eroding. Follow up This is a progress report that shows preliminary outcomes and conclusions of trends in biodiversity in the Oosterschelde. These are the first outcomes of the Oosterschelde that are part of a broader research that also concerns similar analysis of lakes Grevelingenmeer, Veerse Meer and Haringvliet. The final report will contain more in depth data analysis and a more elaborated interpretation. We will also focus on the relation of biodiversity trends between water bodies also in relation to the delta as a whole and how the Delta Works have affected these trends. Finally we will discuss the outcomes in the framework of current policy and give implications for management.


Biodiversity in a changing Oosterschelde: from past to present 29
Literature
Compendium voor de Leefomgeving (2012). (http://www.compendiumvoordeleefomgeving.nl.) Gewone en grijze zeehond in Waddenzee en Deltagebied, 1959 - 2011 (indicator 1231, versie 09, 11 januari 2012). www.compendiumvoordeleefomgeving.nl. CBS, Den Haag; Planbureau voor de Leefomgeving, Den Haag/Bilthoven en Wageningen UR, Wageningen.
Damm, T. (2009). Zeegraskartering 2008, Waddenzee en Oosterschelde, Rijkswaterstaat: 72.
Damm, T. (2010). Zeegraskartering 2009, Waddenzee en Oosterschelde, Rijkswaterstaat: 74.
De Kluijver, M. and M. Dubbeldam (2003). De sublitorale hard-substraat levensgemeenschappen in de Oosterschelde, eveluatie van de ontwikkelingen in de periode 1985-2002. Middelburg, RIKZ.
Escaravage, V., T. Ysebaert, et al. (2003). Karakteristieken van het macrobenthos in de Oosterschelde in verband met actuele beheersvragen. Yerseke, KNAW-NIOO, Centre for Estuarine and Marine Ecology, NIOO-CEME.
Jacobse, S., O. Scholl, et al. (2008). Prognose van Schor- en slikontwikkelingen in de Oosterschelde. Een analyse naar de te verwachten ontwikkelingen tot 2060, Rijkswaterstaat.
Kamermans, P., M. A. Hemminga, et al. (1999). "Significance of salinity and silicon levels for growth of a formerly estuarine eelgrass (Zostera marina) population (Lake Grevelingen, The Netherlands)." Marine Biology 133(3): 527-539.
Kochman, J., C. Buschbaum, et al. (2008). "Shift from native mussels to alien oysters: differential effects of ecosystem engineers." Journal of Experimental Marine Biology and Ecology 364(1-10).
Lengbeek, W., S. Bouma, et al. (2007). Het effect van zuurstofdeficiëntie op het bodemleven in het Grevelingenmeer. Een blik onder water. Culemborg, Bureau Waardenburg.
Markert, A., A. Wehrmann, et al. (2009). "Recently established Crassostrea-reefs versus native Mytilus-beds:differences in ecosystem engineering affects the macrofaunal communities (Wadden Sea of Lower Saxony southern German Bight)." Biological Invasions.
Meininger, P. L., H. J. M. Baptist, et al. (1985). Vogeltellingen in het zuidelijk deltagebied in 1980/81 - 1983/84. Middelburg, Rijkswaterstaat.
Nienhuis, P. H. and A. C. Smaal (1994). The Oosterschelde Estuary (The Netherlands): A Case-Study of a Changing Ecosystem. Dordrecht.
Smaal, A. C. and R. C. Boeije (1991). Veilig getij, de effecten van de waterbouwkundige werken op het getijdemilieu van de Oosterschelde. Middelburg, DGW, Directie Zeeland.
Smaal, A. C., B. J. Kater, et al. (2009). "Introduction, establishment and expansion of the Pacific oyster Crassostrea gigas in the Oosterschelde (SW Netherlands)." Helgoland Marine Research 63: 75-83.
Soldaat, L., H. Visser, et al. (2007). "Smoothing and trend detection in waterbird monitoring data using structural time-series analysis and the Kalman filter." Journal of Ornithology 148(2): 351-357.
Stichting Rugvin (2011). 'www.stichtingrugvin.nl.'
Strucker, R. C. W., F. A. Arts, et al. (2008). Watervogels en zeezoogdieren in de Zoute Delta 2006/2007, Rijkswaterstaat Waterdienst.
30 C 12.046 WOT-werkdocument 288.doc
Strucker, R. C. W., F. A. Arts, et al. (2010). Watervogels en zeezoogdieren in de Zoute Delta 2008/2009, Rijkswaterstaat Waterdienst.
Troost, K. (2009). Pacific Oysters in Dutch Estuaries: Cause of Success and Consequences for Native Bivalves., University of Groningen. PhD thesis: 255.
Troost, K. and T. Ysebaert (2011). ANT Oosterschelde: Long-term trends of waders and their dependende on intertidal foraging grounds., IMARES Wageningen UR.
Troost, T. (2010). "cause and effects of a highly successful marine invasion: Case-study of the introduced Pacific oyster Crassostrea gigas in continental NWEuropean estuaries." Journal of Sea Reasearch 64: 145-165.
Van Beek, F. A., A. D. Rijnsdorp, et al. (1989). "Monitoring juvinile stocks of flatfish in the Wadden Sea and the coastal areas of the souhteastern North Sea." Helgolandes Meeresuntersuchungen 43: 461-477.
Van der Pluijm, A. M. and D. J. De Jong (1998). Historisch overzicht schorareaal in Zuid-West Nederland. Middelburg, RWS-RIKZ.
Van Zanten, E. and L. A. Adriaanse (2008). Verminderd getij. Verkenning van mogelijke maatregelen om de erosie van platen, slikken en scorren van de Oosterschelde te beperken. Middelburg, Rijkswaterstaat Zeeland.
Visser, H. (2004). "Estimation and detection of flexible trends." Atmospheric Environment 38: 4135-4145.
Zuidwestelijke Delta (2010). Veilig, Veerkrachtig en Vitaal, Ontwerp-Uitvoeringsprogramma Zuidwestelijke Delta 2010-2015+. S. Z. Delta, Stuurgroep Zuidwestelijke Delta: 87.
Biodiversity in a changing Oosterschelde: from past to present 31
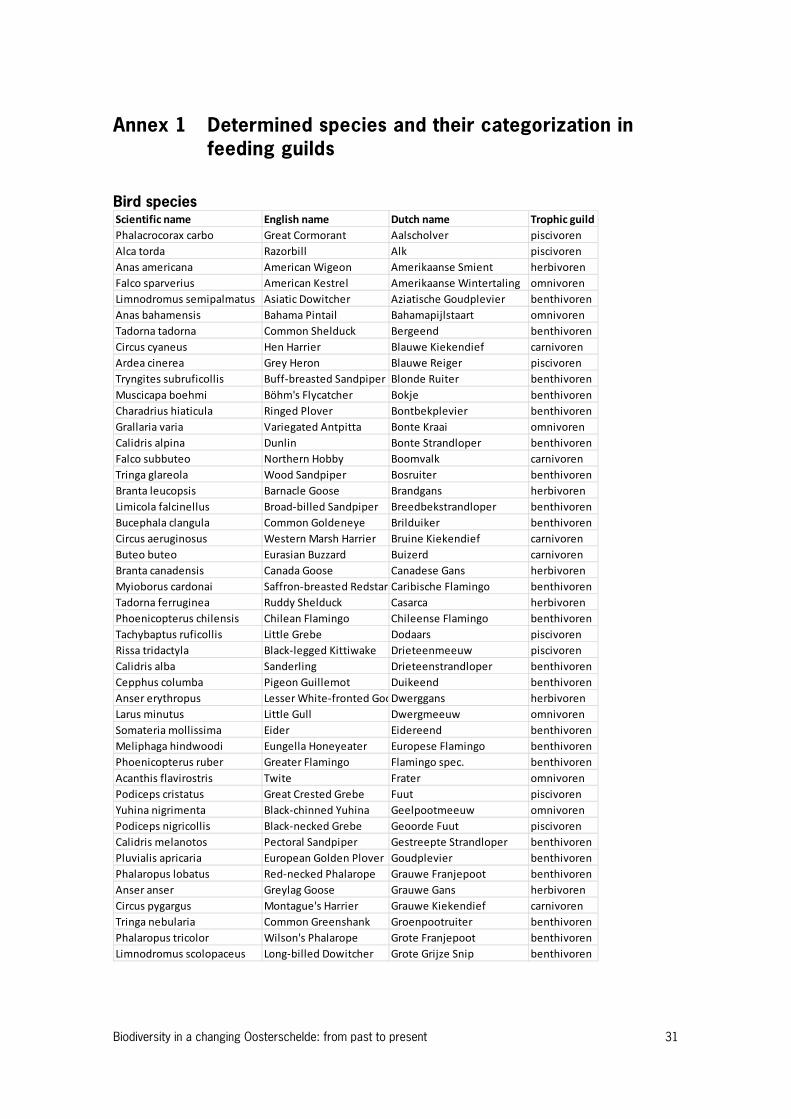
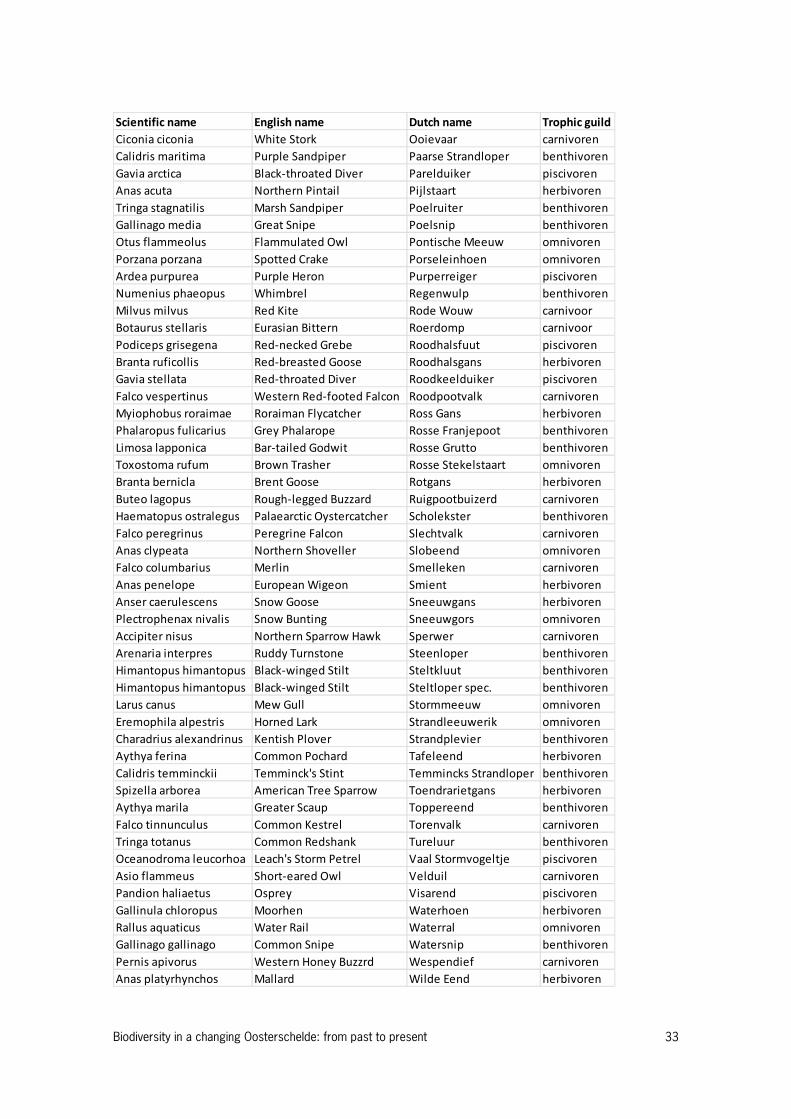
Annex 1 Determined species and their categorization in
feeding guilds
Bird species Scientific name English name Dutch name Trophic guild
Phalacrocorax carbo Great Cormorant Aalscholver piscivoren
Alca torda Razorbill Alk piscivoren
Anas americana American Wigeon Amerikaanse Smient herbivoren
Falco sparverius American Kestrel Amerikaanse Wintertaling omnivoren
Limnodromus semipalmatus Asiatic Dowitcher Aziatische Goudplevier benthivoren
Anas bahamensis Bahama Pintail Bahamapijlstaart omnivoren
Tadorna tadorna Common Shelduck Bergeend benthivoren
Circus cyaneus Hen Harrier Blauwe Kiekendief carnivoren
Ardea cinerea Grey Heron Blauwe Reiger piscivoren
Tryngites subruficollis Buff‐breasted Sandpiper Blonde Ruiter benthivoren
Muscicapa boehmi Böhm's Flycatcher Bokje benthivoren
Charadrius hiaticula Ringed Plover Bontbekplevier benthivoren
Grallaria varia Variegated Antpitta Bonte Kraai omnivoren
Calidris alpina Dunlin Bonte Strandloper benthivoren
Falco subbuteo Northern Hobby Boomvalk carnivoren
Tringa glareola Wood Sandpiper Bosruiter benthivoren
Branta leucopsis Barnacle Goose Brandgans herbivoren
Limicola falcinellus Broad‐billed Sandpiper Breedbekstrandloper benthivoren
Bucephala clangula Common Goldeneye Brilduiker benthivoren
Circus aeruginosus Western Marsh Harrier Bruine Kiekendief carnivoren
Buteo buteo Eurasian Buzzard Buizerd carnivoren
Branta canadensis Canada Goose Canadese Gans herbivoren
Myioborus cardonai Saffron‐breasted RedstartCaribische Flamingo benthivoren
Tadorna ferruginea Ruddy Shelduck Casarca herbivoren
Phoenicopterus chilensis Chilean Flamingo Chileense Flamingo benthivoren
Tachybaptus ruficollis Little Grebe Dodaars piscivoren
Rissa tridactyla Black‐legged Kittiwake Drieteenmeeuw piscivoren
Calidris alba Sanderling Drieteenstrandloper benthivoren
Cepphus columba Pigeon Guillemot Duikeend benthivoren
Anser erythropus Lesser White‐fronted GooDwerggans herbivoren
Larus minutus Little Gull Dwergmeeuw omnivoren
Somateria mollissima Eider Eidereend benthivoren
Meliphaga hindwoodi Eungella Honeyeater Europese Flamingo benthivoren
Phoenicopterus ruber Greater Flamingo Flamingo spec. benthivoren
Acanthis flavirostris Twite Frater omnivoren
Podiceps cristatus Great Crested Grebe Fuut piscivoren
Yuhina nigrimenta Black‐chinned Yuhina Geelpootmeeuw omnivoren
Podiceps nigricollis Black‐necked Grebe Geoorde Fuut piscivoren
Calidris melanotos Pectoral Sandpiper Gestreepte Strandloper benthivoren
Pluvialis apricaria European Golden Plover Goudplevier benthivoren
Phalaropus lobatus Red‐necked Phalarope Grauwe Franjepoot benthivoren
Anser anser Greylag Goose Grauwe Gans herbivoren
Circus pygargus Montague's Harrier Grauwe Kiekendief carnivoren
Tringa nebularia Common Greenshank Groenpootruiter benthivoren
Phalaropus tricolor Wilson's Phalarope Grote Franjepoot benthivoren
Limnodromus scolopaceus Long‐billed Dowitcher Grote Grijze Snip benthivoren

32 C 12.046 WOT-werkdocument 288.doc
Scientific name English name Dutch name Trophic guild
Catharacta skua Great Skua Grote Jager carnivoor
Larus marinus Greater Black‐backed Gull Grote Mantelmeeuw omnivoren
Thalasseus sandvicensis Sandwich Tern Grote Stern piscivoren
Mergus merganser Goosander Grote Zaagbek piscivoren
Melanitta fusca Velvet Scoter Grote Zee‐eend benthivoren
Egretta alba Great Egret Grote Zilverreiger piscivoren
Limosa limosa Black‐tailed Godwit Grutto benthivoren
Accipiter gentilis Northern Goshawk Havik carnivoren
Scolopax rusticola Eurasian Woodcock Houtsnip benthivoren
Gavia immer Great Northern Diver IJsduiker piscivoren
Clangula hyemalis Long‐tailed Duck IJseend benthivoren
Calcarius lapponicus Lapland Bunting IJsgors omnivoren
Alcedo atthis River Kingfisher IJsvogel piscivoren
Anser indicus Bar‐headed Goose Indische Gans herbivoren
Morus bassanus Northern Gannet Jan Van Gent piscivoren
Anas cyanoptera Cinnamon Teal Kaneeltaling omnivoren
Calidris canutus Red Knot Kanoetstrandloper benthivoren
Philomachus pugnax Ruff Kemphaan benthivoren
Vanellus vanellus Northern Lapwing Kievit benthivoren
Alle alle Little Auk Kleine Alk piscivoren
Tringa flavipes Lesser Yellowlegs Kleine Geelpootruiter benthivoren
Stercorarius parasiticus Arctic Skua Kleine Jager piscivoren
Larus fuscus Lesser Black‐backed Gull Kleine Mantelmeeuw omnivoren
Charadrius dubius Little Ringed Plover Kleine Plevier benthivoren
Anser brachyrhynchus Pink‐footed Goose Kleine Rietgans herbivoren
Calidris minuta Little Stint Kleine Strandloper benthivoren
Egretta garzetta Little Egret Kleine Zilverreiger piscivoren
Cygnus columbianus Tundra Swan Kleine Zwaan herbivoren
Stercorarius longicaudus Long‐tailed Skua Kleinste Jager piscivoren
Recurvirostra avosetta Pied Avocet Kluut benthivoren
Cygnus olor Mute Swan Knobbelzwaan herbivoren
Bubulcus ibis Cattle Egret Koereiger carnivoren
Larus ridibundus Black‐headed Gull Kokmeeuw omnivoren
Anser albifrons White‐fronted Goose Kolgans herbivoren
Grus grus Common Crane Kraanvogel carnivoren
Anas strepera Gadwall Krakeend herbivoren
Calidris ferruginea Curlew Sandpiper Krombekstrandloper benthivoren
Netta rufina Red‐crested Pochard Krooneend herbivoren
Phalacrocorax aristotelis Shag Kuifaalscholver piscivoren
Podiceps auritus Slavonian Grebe Kuifduiker benthivoren
Aythya fuligula Tufted Duck Kuifeend omnivoren
Platalea leucorodia White Spoonbill Lepelaar benthivoren
Aix galericulata Mandarin Duck Mandarijneend omnivoren
Fulica atra Black Coot Meerkoet omnivoren
Stercorarius pomarinus Pomarine Skua Middelste Jager carnivoor
Mergus serrator Red‐breasted Merganser Middelste Zaagbek piscivoren
Eudromias morinellus Dotterel Morinelplevier benthivoren
Alopochen aegyptiacus Egyptian Goose Nijlgans herbivoren
Biodiversity in a changing Oosterschelde: from past to present 33
Scientific name English name Dutch name Trophic guild
Ciconia ciconia White Stork Ooievaar carnivoren
Calidris maritima Purple Sandpiper Paarse Strandloper benthivoren
Gavia arctica Black‐throated Diver Parelduiker piscivoren
Anas acuta Northern Pintail Pijlstaart herbivoren
Tringa stagnatilis Marsh Sandpiper Poelruiter benthivoren
Gallinago media Great Snipe Poelsnip benthivoren
Otus flammeolus Flammulated Owl Pontische Meeuw omnivoren
Porzana porzana Spotted Crake Porseleinhoen omnivoren
Ardea purpurea Purple Heron Purperreiger piscivoren
Numenius phaeopus Whimbrel Regenwulp benthivoren
Milvus milvus Red Kite Rode Wouw carnivoor
Botaurus stellaris Eurasian Bittern Roerdomp carnivoor
Podiceps grisegena Red‐necked Grebe Roodhalsfuut piscivoren
Branta ruficollis Red‐breasted Goose Roodhalsgans herbivoren
Gavia stellata Red‐throated Diver Roodkeelduiker piscivoren
Falco vespertinus Western Red‐footed Falcon Roodpootvalk carnivoren
Myiophobus roraimae Roraiman Flycatcher Ross Gans herbivoren
Phalaropus fulicarius Grey Phalarope Rosse Franjepoot benthivoren
Limosa lapponica Bar‐tailed Godwit Rosse Grutto benthivoren
Toxostoma rufum Brown Trasher Rosse Stekelstaart omnivoren
Branta bernicla Brent Goose Rotgans herbivoren
Buteo lagopus Rough‐legged Buzzard Ruigpootbuizerd carnivoren
Haematopus ostralegus Palaearctic Oystercatcher Scholekster benthivoren
Falco peregrinus Peregrine Falcon Slechtvalk carnivoren
Anas clypeata Northern Shoveller Slobeend omnivoren
Falco columbarius Merlin Smelleken carnivoren
Anas penelope European Wigeon Smient herbivoren
Anser caerulescens Snow Goose Sneeuwgans herbivoren
Plectrophenax nivalis Snow Bunting Sneeuwgors omnivoren
Accipiter nisus Northern Sparrow Hawk Sperwer carnivoren
Arenaria interpres Ruddy Turnstone Steenloper benthivoren
Himantopus himantopus Black‐winged Stilt Steltkluut benthivoren
Himantopus himantopus Black‐winged Stilt Steltloper spec. benthivoren
Larus canus Mew Gull Stormmeeuw omnivoren
Eremophila alpestris Horned Lark Strandleeuwerik omnivoren
Charadrius alexandrinus Kentish Plover Strandplevier benthivoren
Aythya ferina Common Pochard Tafeleend herbivoren
Calidris temminckii Temminck's Stint Temmincks Strandloper benthivoren
Spizella arborea American Tree Sparrow Toendrarietgans herbivoren
Aythya marila Greater Scaup Toppereend benthivoren
Falco tinnunculus Common Kestrel Torenvalk carnivoren
Tringa totanus Common Redshank Tureluur benthivoren
Oceanodroma leucorhoa Leach's Storm Petrel Vaal Stormvogeltje piscivoren
Asio flammeus Short‐eared Owl Velduil carnivoren
Pandion haliaetus Osprey Visarend piscivoren
Gallinula chloropus Moorhen Waterhoen herbivoren
Rallus aquaticus Water Rail Waterral omnivoren
Gallinago gallinago Common Snipe Watersnip benthivoren
Pernis apivorus Western Honey Buzzrd Wespendief carnivoren
Anas platyrhynchos Mallard Wilde Eend herbivoren

34 C 12.046 WOT-werkdocument 288.doc
Scientific name English name Dutch name Trophic guild
Cygnus cygnus Whooper Swan Wilde Zwaan benthivoren
Anas crecca Green‐winged Teal Wintertaling omnivoren
Hodgsonius phaenicuroides White‐bellied Redstart Witbuikrotgans carnivoren
Tringa ochropus Green Sandpiper Witgatje carnivoren
Aythya nyroca Ferruginous Duck Witoogeend omnivoren
Numenius arquata Western Curlew Wulp piscivoren
Haliaeetus albicilla White‐tailed Sea Eagle Zeearend benthivoren
Uria aalge Common Guillemot Zeekoet benthivoren
Larus argentatus Herring Gull Zilvermeeuw carnivoren
Pluvialis squatarola Grey Plover Zilverplevier herbivoren
Anas querquedula Garganey Zomertaling omnivoren
Ciconia nigra Black Stork Zwarte Ooievaar benthivoren
Phoenicurus ochruros Black Redstart Zwarte Rotgans piscivoren
Tringa erythropus Spotted Redshank Zwarte Ruiter carnivoren
Milvus migrans Black Kite Zwarte Wouw piscivoren
Melanitta nigra Black Scoter Zwarte Zee‐eend omnivoren
Cygnus atratus Black Swan Zwarte Zwaan benthivoren
Larus melanocephalus Mediterranean Gull Zwartkopmeeuw carnivoren
Tyrannopsis sulphurea Sulphury Flycatcher Zwemeend benthivoren Breeding bird species
Scientific name English name Dutch name Trophic guild
Charadrius hiaticula Ringed Plover Bontbekplevier benthivoren
Sterna albifrons Little Tern Dwergstern piscivoren
Yuhina nigrimenta Black‐chinned Yuhina Geelpootmeeuw omnivoren
Thalasseus sandvicensis Sandwich Tern Grote Stern piscivoren
Larus ridibundus Black‐headed Gull Kokmeeuw omnivoren
Charadrius dubius Little Ringed Plover Kleine Plevier benthivoren
Recurvirostra avosetta Pied Avocet Kluut benthivoren
Larus marinus Greater Black‐backed Gull Grote Mantelmeeuw omnivoren
Larus fuscus Lesser Black‐backed Gull Kleine Mantelmeeuw omnivoren
Sterna paradisaea Arctic Tern Noordse Stern piscivoren
Himantopus himantopus Black‐winged Stilt Steltkluut benthivoren
Charadrius alexandrinus Kentish Plover Strandplevier benthivoren
Larus canus Mew Gull Stormmeeuw omnivoren
Sterna hirundo Common Tern Visdief piscivoren
Larus argentatus Herring Gull Zilvermeeuw omnivoren
Larus melanocephalus Mediterranean Gull Zwartkopmeeuw omnivoren

Biodiversity in a changing Oosterschelde: from past to present 35
Fish species Vissen
Scientific name Dutch name Trophic guild
Agonus cataphractus Harnasmannetje benthivore
Alosa fallax Fint planktivore
Ammodytes sp. planktivore
Anguilla anguilla Aal bentho‐piscivore
Aphia minuta bentho‐piscivore
Arnoglossus laterna bentho‐piscivore
Atherina bentho‐piscivore
Buglossidium luteum Dwergtong benthivore
Callionymus lyra Pitvis benthivore
Callionymus maculatus benthivore
Callionymus reticulatus benthivore
Ciliata mustela Vijdradige meun benthivore
Clupea harengus Haring planktivore
Dasyatis pastinaca bentho‐piscivore
Dicentrarchus labrax Zeebaars piscivore
Echiichthys vipera Kleine pieterman bentho‐piscivore
Enchelyopus cimbrius Vierdradige meun benthivore
Engraulis encrasicolus Ansjovis planktivore
Entelurus aequoraeus planktivore
Eutrigla gurnardus Grauwe poon benthivore
Gadus morhua Kabeljauw piscivore
Gaidropsarus vulgaris benthivore
Galeorhinus galeus piscivore
Gasterosteus aculeatus benthivore
Gobius niger benthivore
Hyperoplus lanceolatus Smelt piscivore
Limanda limanda Schar benthivore
Liparis liparis Slakdolf benthivore
Merlangius merlangus Wijting piscivore
Microstomus kitt benthivore
Mugilidae Harderachtige detritivore
Mullus surmuletus benthivore
Myoxocephalus scorpius Zeedonderpad bentho‐piscivore
Osmerus eperlanus Spiering bentho‐piscivore
Pholis gunnellus Botervis benthivore
Platichthys flesus Bot benthivore
Pleuronectes platessa Schol benthivore
Pollachius virens piscivore
Pomatoschistus sp. Grondel planktivore
Psetta maxima Tarbot piscivore
Raja clavata Rog bentho‐piscivore
Raniceps raninus benthivore
Sardina pilchardus planktivore
Scophthalmus rhombus Griet piscivore
Solea solea Tong benthivore
Sprattus sprattus Sprot planktivore
Squalus acanthias piscivore
Syngnathus sp. Zeenaalden planktivore
Taurulus bubalis benthivore
Trachurus trachurus Horsmakreel piscivore
Trigla lucerna Rode poon benthivore
Trisopterus luscus Steenbolk benthivore
Trisopterus minutus Steenbolk benthivore
Zeus faber piscivore
Zoarces viviparus Puitaal benthivore

36 C 12.046 WOT-werkdocument 288.doc
Benthos species Trophic groups: 0= not determined to species level, 1= suspension or filter feeder, 2= interface- , surface deposit- and facultative suspension feeder, 3= subsurface deposit feeder, grazer, 4= predator, omnivore, scavenger. Scientific name Trophic guild Scientific name Trophic guildAbludomelita obtusata 2 Bispira crassicornis 1
Abra 2 Bivalvia 1
Abra alba 2 Boccardiella ligerica 2
Abra nitida 2 Bodotria scorpioides 2
Abra tenuis 2 Botryllus schlosseri 1
Acanthocardia 1 Brachyura 4
Acanthocardia echinata 1 Capitella capitata 3
Acanthocardia paucicostata 1 Capitellidae 3
Achelia echinata 4 Caprellidae 0
Actiniaria 4 Carcinus maenas 4
Alitta succinea 4 Caridea 0
Alitta virens 4 Cerastoderma 1
Ampelisca 1 Cerastoderma edule 1
Ampelisca brevicornis 1 Cerianthus lloydii 4
Ampharete 2 Chaetognatha 4
Ampharete acutifrons 2 Chaetozone setosa 2
Ampharete finmarchica 2 Cheirocratus sundevalli 3
Ampharetidae 2 Chironomus salinarius 0
Amphilochus neapolitanus 3 Ciona intestinalis 1
Amphitrite 2 Cirratulidae 2
Anoplodactylus petiolatus 4 Cirratulus cirratus 2
Anthozoa 4 Corbula gibba 1
Aora typica 0 Corophium 2
Aoridae 2 Corophium arenarium 2
Aphelochaeta marioni 2 Corophium multisetosum 2
Apherusa bispinosa 2 Corophium volutator 2
Aphrodita aculeata 4 Cossura 3
Arenicola 3 Cossura longocirrata 3
Arenicola defodiens 3 Crangon 4
Arenicola marina 3 Crangon crangon 4
Aricidea 2 Crassicorophium bonellii 2
Aricidea minuta 2 Crassostrea 1
Ascidiacea 1 Crepidula fornicata 1
Ascidiella aspersa 1 Cumacea 0
Asterias 4 Cumopsis goodsir 2
Asterias amurensis 4 Cyanoplax caverna 3
Athanas nitescens 4 Cyathura carinata 0
Atylus 4 Decapoda 0
Atylus guttatus 4 Delavalia 2
Atylus swammerdami 4 Diastylis 2
Balanus crenatus 1 Diastylis bradyi 2
Barnea candida 3 Diastylis lucifera 2
Bathyporeia 2 Diastylis rathkei 2
Bathyporeia elegans 2 Diastylis rugosa 2
Bathyporeia guilliamsoniana 2 Didemnidae 1
Bathyporeia pelagica 2 Didemnum candidum 1
Bathyporeia sarsi 2 Dipolydora coeca 2
Bathyporeia sarsi 2 Dipolydora quadrilobata 2

Biodiversity in a changing Oosterschelde: from past to present 37
Trophic groups: 0= not determined to species level, 1= suspension or filter feeder, 2= interface- , surface deposit- and facultative suspension feeder, 3= subsurface deposit feeder, grazer, 4= predator, omnivore, scavenger. Scientific name Trophic guild Scientific name Trophic guildDodecaceria concharum 2 Jaera (Jaera) albifrons 3
Echinocardium cordatum 3 Janira maculosa 3
Elysia viridis 0 Janiridae 3
Ensis 1 Kefersteinia cirrata 0
Ensis directus 1 Kurtiella bidentata 1
Ensis ensis 1 Laevicardium crassum 1
Ensis magnus 1 Lagis koreni 3
Epitonium clathratulum 4 Lanice conchilega 2
Ericthonius brasiliensis 1 Lepidonotus squamatus 4
Eteone 4 Liocarcinus 4
Eteone flava 4 Liocarcinus depurator 4
Eteone longa 4 Liocarcinus holsatus 4
Eualus cranchii 4 Liocarcinus navigator 4
Eulalia viridis 4 Littorina 3
Eumida 4 Littorina littorea 3
Eumida bahusiensis 4 Lumbrineris latreilli 4
Eumida sanguinea 4 Macoma balthica 2
Eunereis longissima 4 Macropodia 4
Eunicidae 4 Macropodia parva 4
Eurydice pulchra 4 Magelona 2
Euspira pulchella 4 Magelona mirabilis 2
Exogone (Exogone) naidina 2 Malacoceros 2
Flabelligera affinis 2 Malacoceros fuliginosus 2
Gammaridae 4 Malacoceros tetracerus 2
Gammaridea 0 Malmgreniella lunulata 4
Gammarus 4 Marphysa sanguinea 4
Gammarus locusta 4 Megaluropus agilis 1
Gammarus salinus 4 Melita 2
Gammarus zaddachi 4 Melita palmata 2
Gastrosaccus spinifer 4 Microdeutopus 0
Gattyana cirrhosa 4 Microdeutopus anomalus 0
Gibbula 3 Microdeutopus chelifer 0
Glycera 4 Microdeutopus gryllotalpa 0
Glycera alba 4 Microphthalmus 3
Glycera convoluta 4 Microphthalmus aberrans 3
Harmothoe 4 Microphthalmus sczelkowi3
Harmothoe imbricata 4 Microphthalmus similis 3
Harmothoe impar 4 Microprotopus 4
Hediste diversicolor 4 Microprotopus maculatus 4
Hesionidae 4 Molgula manhattensis 1
Heteromastus filiformis 3 Mollusca 0
Hippolyte longirostris 4 Monocorophium ascherusi 2
Hippolyte varians 4 Monocorophium insidiosum2
Hydrobia ulvae 3 Monocorophium sextonae 2
Idotea chelipes 4 Mya arenaria 1
Idotea linearis 4 Myrianida 4
Insecta 0 Myrianida brachycephala 0
Isopoda 0 Myrianida langerhansi 0
38 C 12.046 WOT-werkdocument 288.doc
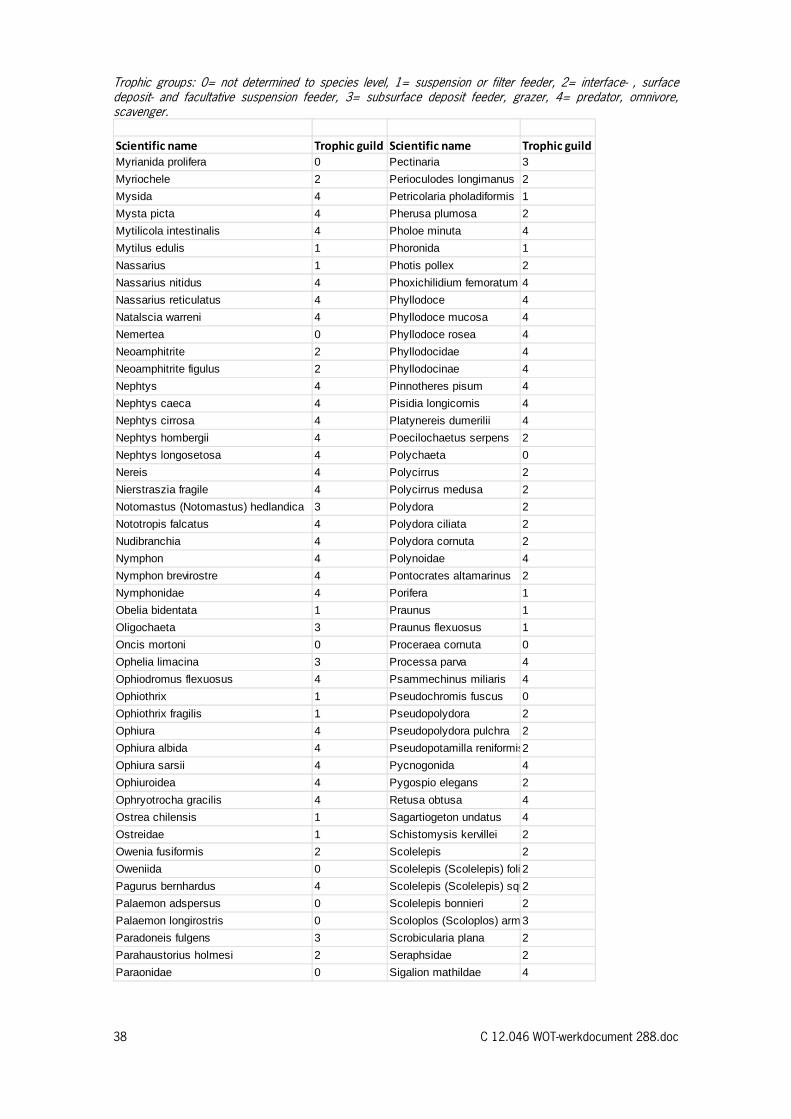
Trophic groups: 0= not determined to species level, 1= suspension or filter feeder, 2= interface- , surface deposit- and facultative suspension feeder, 3= subsurface deposit feeder, grazer, 4= predator, omnivore, scavenger.
Scientific name Trophic guild Scientific name Trophic guildMyrianida prolifera 0 Pectinaria 3
Myriochele 2 Perioculodes longimanus 2
Mysida 4 Petricolaria pholadiformis 1
Mysta picta 4 Pherusa plumosa 2
Mytilicola intestinalis 4 Pholoe minuta 4
Mytilus edulis 1 Phoronida 1
Nassarius 1 Photis pollex 2
Nassarius nitidus 4 Phoxichilidium femoratum 4
Nassarius reticulatus 4 Phyllodoce 4
Natalscia warreni 4 Phyllodoce mucosa 4
Nemertea 0 Phyllodoce rosea 4
Neoamphitrite 2 Phyllodocidae 4
Neoamphitrite figulus 2 Phyllodocinae 4
Nephtys 4 Pinnotheres pisum 4
Nephtys caeca 4 Pisidia longicornis 4
Nephtys cirrosa 4 Platynereis dumerilii 4
Nephtys hombergii 4 Poecilochaetus serpens 2
Nephtys longosetosa 4 Polychaeta 0
Nereis 4 Polycirrus 2
Nierstraszia fragile 4 Polycirrus medusa 2
Notomastus (Notomastus) hedlandica 3 Polydora 2
Nototropis falcatus 4 Polydora ciliata 2
Nudibranchia 4 Polydora cornuta 2
Nymphon 4 Polynoidae 4
Nymphon brevirostre 4 Pontocrates altamarinus 2
Nymphonidae 4 Porifera 1
Obelia bidentata 1 Praunus 1
Oligochaeta 3 Praunus flexuosus 1
Oncis mortoni 0 Proceraea cornuta 0
Ophelia limacina 3 Processa parva 4
Ophiodromus flexuosus 4 Psammechinus miliaris 4
Ophiothrix 1 Pseudochromis fuscus 0
Ophiothrix fragilis 1 Pseudopolydora 2
Ophiura 4 Pseudopolydora pulchra 2
Ophiura albida 4 Pseudopotamilla reniformis2
Ophiura sarsii 4 Pycnogonida 4
Ophiuroidea 4 Pygospio elegans 2
Ophryotrocha gracilis 4 Retusa obtusa 4
Ostrea chilensis 1 Sagartiogeton undatus 4
Ostreidae 1 Schistomysis kervillei 2
Owenia fusiformis 2 Scolelepis 2
Oweniida 0 Scolelepis (Scolelepis) foli 2
Pagurus bernhardus 4 Scolelepis (Scolelepis) squ2
Palaemon adspersus 0 Scolelepis bonnieri 2
Palaemon longirostris 0 Scoloplos (Scoloplos) arm 3
Paradoneis fulgens 3 Scrobicularia plana 2
Parahaustorius holmesi 2 Seraphsidae 2
Paraonidae 0 Sigalion mathildae 4

Biodiversity in a changing Oosterschelde: from past to present 39
Trophic groups: 0= not determined to species level, 1= suspension or filter feeder, 2= interface- , surface deposit- and facultative suspension feeder, 3= subsurface deposit feeder, grazer, 4= predator, omnivore, scavenger.
Scientific name Trophic guildSiriella clausi 0
Spio filicornis 2
Spio goniocephala 2
Spio martinensis 2
Spionidae 2
Spiophanes bombyx 2
Spisula 1
Spisula subtruncata 1
Stenothoe marina 1
Sthenelais boa 4
Streblospio shrubsolii 2
Streptosyllis websteri 2
Styela clava 1
Subadyte pellucida 4
Sycon 0
Syllidae 4
Syllidia armata 0
Syllis gracilis 0
Tellimya ferruginosa 1
Tellina 2
Tellina fabula 2
Tellina tenuis 2
Tellinoidea 2
Terebellida 2
Thia scutellata 4
Tryphosella sarsi 0
Urothoe 2
Urothoe brevicornis 2
Urothoe poseidonis 2
Venerupis 1
Venerupis senegalensis 1


Biodiversity in a changing Oosterschelde: from past to present 41
Annex 2 Overview and specification of collected data
Group Period Source Time of sampling Sample locations Method Data standardization and
comments
Birds 1987-2009
1979-2010 for
breeding birds
Waterdienst, Rijkswaterstaat, SOVON -seasonal averages
June-July
-gulls only in January
Oosterschelde Counts Incomplete years
(’94,’97,’99,’00,’02,’07,’09) were
estimated by imputing
Fish 1970-2009 Dutch Demersal Fish Surveys, IMARES September-October,
only fall data were
used
Oosterschelde Beam trawl 3m, fine mesh 20mm,
net size 80m2
Data expressed individuals per
hectares
Macro-
benthos
1992-2008 BIOMON/MWTL,
Waterdienst, Rijkswaterstaat & Monitoring
Taskforce of NIOO-CEME
Autumn data were
used
Oosterschelde North,
East and West. Per
region multiple strata and
10 samples per stratum
3 pooled sediment Reineck boxcores
in combination with a core of 8cm
diameter (0.015 m2, in total), sieved
over 1mm mesh size
Mean values of individuals per m2
locations North, East and West
were calculated and summed up.
Sea
mammals
1996-2009 Waterdienst, Rijkswaterstaat July-June Oosterschelde Counts Only data of Grey Seal, Common
Seal and Harbour porpoise were
collected
Seagrass -1977-2003
-2008-2009
Waterdienst, Rijkswaterstaat/RIKZ (via
Compendium voor de Leefomgeving)
-Zeegraskarteringen: Damm (2009; 2010)
variable Intertidal
False colour aerial photography scale
1:10000 and 1:20000, GPS/INS
scale 1:2500 was used, field
measurements using enhancements,
analysis using GIS
Seagrass in hectares
Salt-marsh 1865, 1910,
1938, 1960,
1978, 1988,
1995
Waterdienst Rijswaterstaat variable Intertidal
False colour aerial photography scale
1:5000
Saltmarshes in hectares

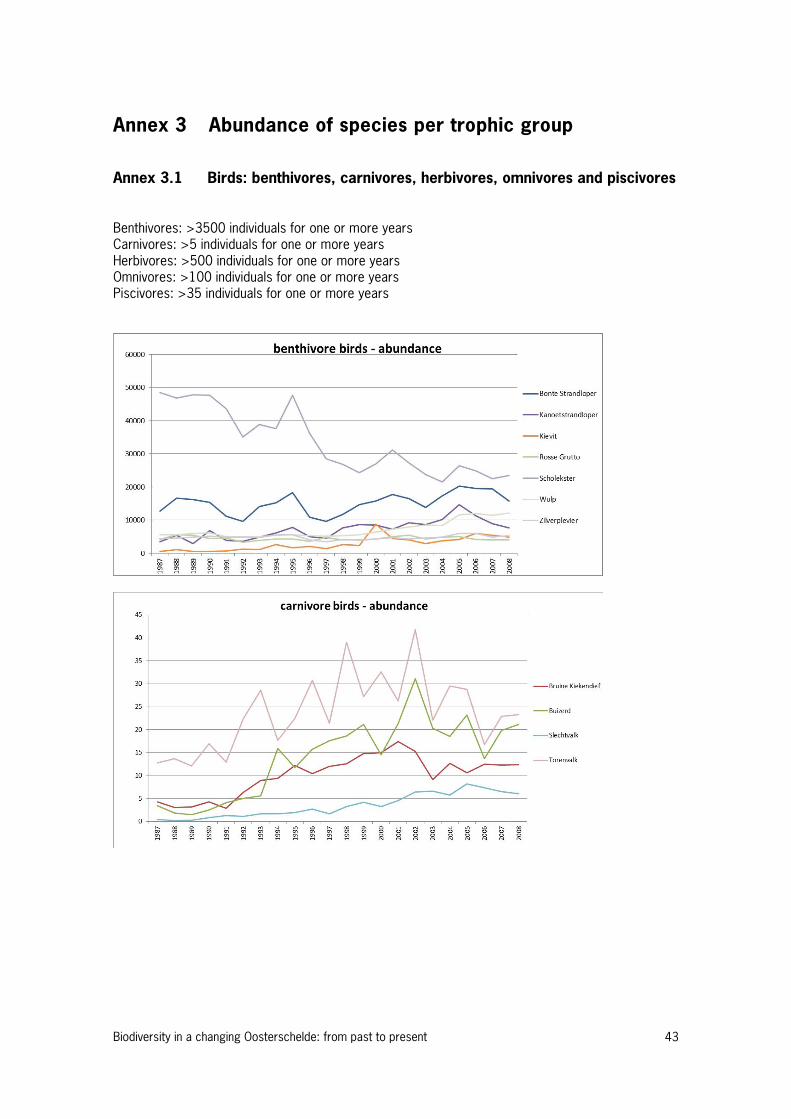
Biodiversity in a changing Oosterschelde: from past to present 43
Annex 3 Abundance of species per trophic group
Annex 3.1 Birds: benthivores, carnivores, herbivores, omnivores and piscivores Benthivores: >3500 individuals for one or more years Carnivores: >5 individuals for one or more years Herbivores: >500 individuals for one or more years Omnivores: >100 individuals for one or more years Piscivores: >35 individuals for one or more years

44 C 12.046 WOT-werkdocument 288.doc

Biodiversity in a changing Oosterschelde: from past to present 45
Annex 3.2 Breeding birds: benthivores, omnivores and piscivores
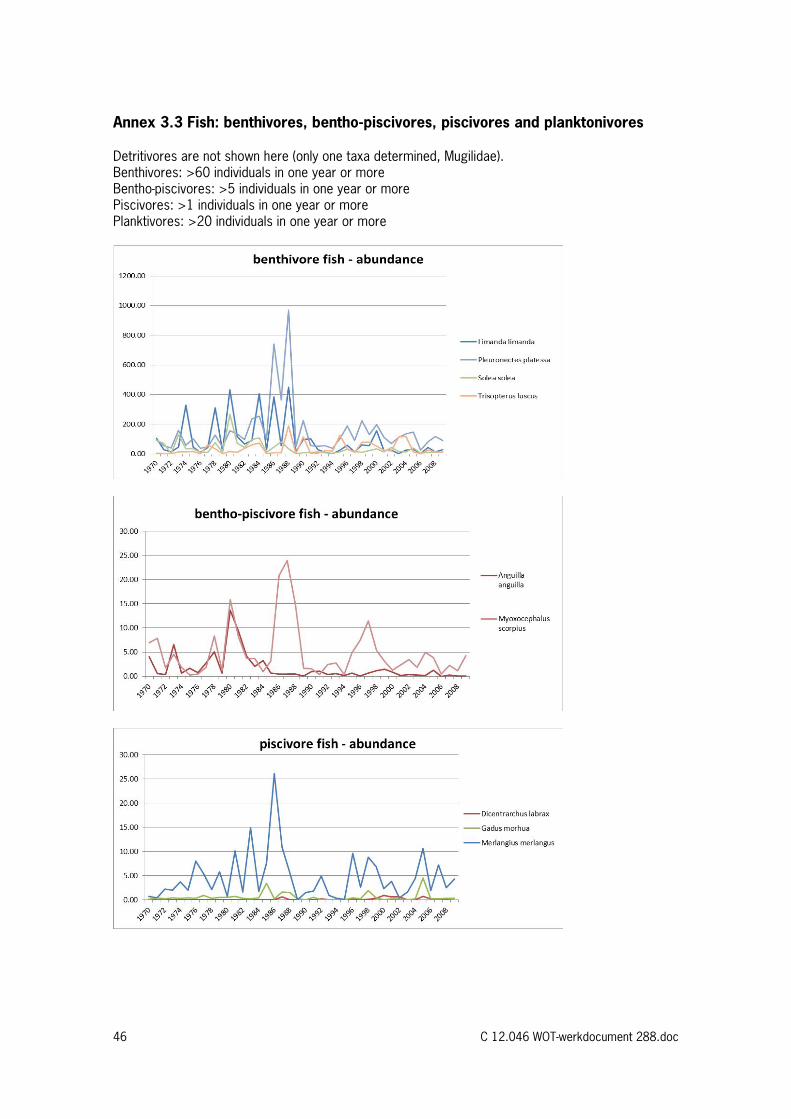
46 C 12.046 WOT-werkdocument 288.doc
Annex 3.3 Fish: benthivores, bentho-piscivores, piscivores and planktonivores Detritivores are not shown here (only one taxa determined, Mugilidae). Benthivores: >60 individuals in one year or more Bentho-piscivores: >5 individuals in one year or more Piscivores: >1 individuals in one year or more Planktivores: >20 individuals in one year or more
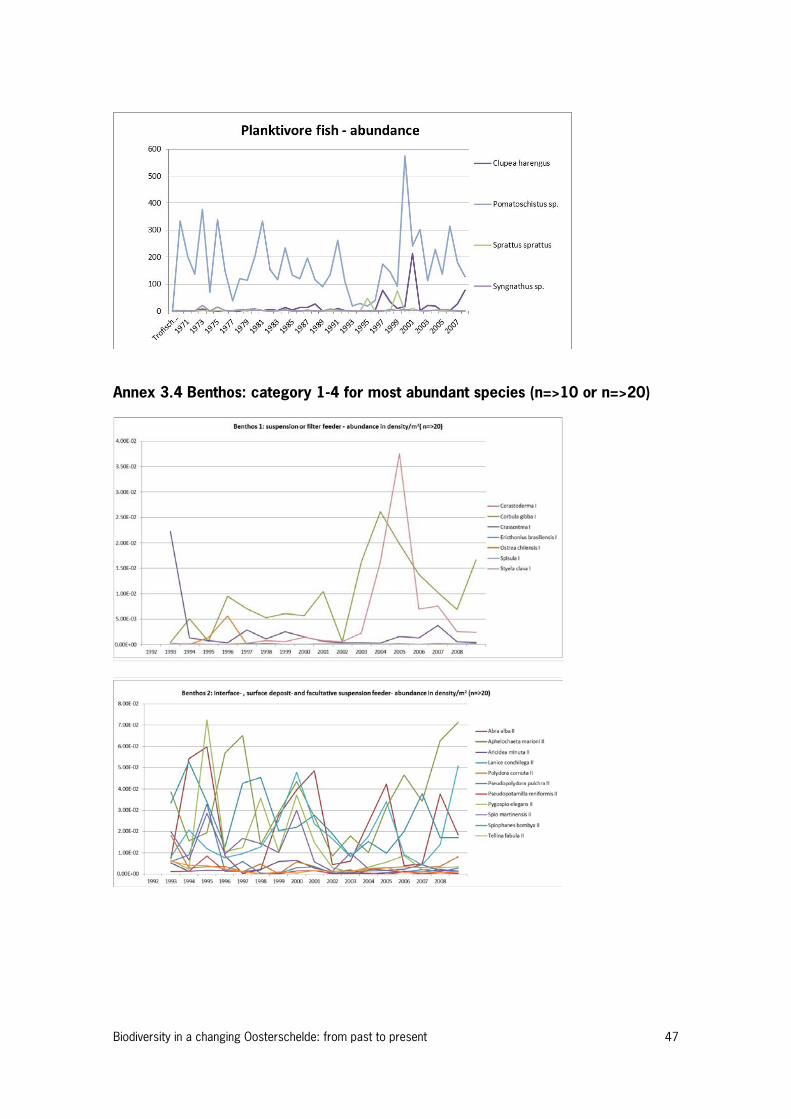
Biodiversity in a changing Oosterschelde: from past to present 47
Annex 3.4 Benthos: category 1-4 for most abundant species (n=>10 or n=>20)

48 C 12.046 WOT-werkdocument 288.doc
Biodiversity in a changing Oosterschelde: from past to present 49
Verschenen documenten in de reeks Werkdocumenten van de Wettelijke Onderzoekstaken
Natuur & Milieu vanaf 2009 Werkdocumenten zijn verkrijgbaar bij het secretariaat van Unit Wettelijke Onderzoekstaken Natuur & Milieu, te Wageningen. T 0317 – 48 54 71; F 0317 – 41 90 00; E [email protected] De werkdocumenten zijn ook te downloaden via de WOT-website www.wotnatuurenmilieu.wur.nl 2009
126 Kamphorst, D.A. Keuzes in het internationale biodiversiteitsbeleid; Verkenning van de beleidstheorie achter de internationale aspecten van het Beleidsprogramma Biodiversiteit (2008-2011)
127 Dirkx, G.H.P. & F.J.P. van den Bosch. Quick scan gebruik Catalogus groenblauwe diensten
128 Loeb, R. & P.F.M. Verdonschot. Complexiteit van nutriëntenlimitaties in oppervlaktewateren
129 Kruit, J. & P.M. Veer. Herfotografie van landschappen; Landschapsfoto’s van de ‘Collectie de Boer’ als uitgangspunt voor het in beeld brengen van ontwikkelingen in het landschap in de periode 1976-2008
130 Oenema, O., A. Smit & J.W.H. van der Kolk. Indicatoren Landelijk Gebied; werkwijze en eerste resultaten
131 Agricola, H.J.A.J. van Strien, J.A. Boone, M.A. Dolman, C.M. Goossen, S. de Vries, N.Y. van der Wulp, L.M.G. Groenemeijer, W.F. Lukey & R.J. van Til. Achtergrond-document Nulmeting Effectindicatoren Monitor Agenda Vitaal Platteland
132 Jaarrapportage 2008. WOT-04-001 – Koepel 133 Jaarrapportage 2008. WOT-04-002 – Onderbouwend
Onderzoek 134 Jaarrapportage 2008. WOT-04-003 – Advisering Natuur &
Milieu 135 Jaarrapportage 2008. WOT-04-005 – M-AVP 136 Jaarrapportage 2008. WOT-04-006 –
Natuurplanbureaufunctie 137 Jaarrapportage 2008. WOT-04-007 –
Milieuplanbureaufunctie 138 Jong de, J.J., J. van Os & R.A. Smidt. Inventarisatie en
beheerskosten van landschapselementen 139 Dirkx, G.H.P., R.W. Verburg & P. van der Wielen.
Tegenkrachten Natuur. Korte verkenning van de weerstand tegen aankopen van landbouwgrond voor natuur
140 Annual reports for 2008; Programme WOT-04 141 Vullings, L.A.E., C. Blok, G. Vonk, M. van Heusden, A.
Huisman, J.M. van Linge, S. Keijzer, J. Oldengarm & J.D. Bulens. Omgaan met digitale nationale beleidskaarten
142 Vreke, J.,A.L. Gerritsen, R.P. Kranendonk, M. Pleijte, P.H. Kersten & F.J.P. van den Bosch. Maatlat Government – Governance
143 Gerritsen, A.L., R.P. Kranendonk, J. Vreke, F.J.P. van den Bosch & M. Pleijte. Verdrogingsbestrijding in het tijdperk van het Investeringsbudget Landelijk Gebied. Een verslag van casusonderzoek in de provincies Drenthe, Noord-Brabant en Noord-Holland
144 Luesink, H.H., P.W. Blokland, M.W. Hoogeveen & J.H. Wisman. Ammoniakemissie uit de landbouw in 2006 en 2007
145 Bakker de, H.C.M. & C.S.A. van Koppen. Draagvlakonderzoek in de steigers. Een voorstudie naar indicatoren om maatschappelijk draagvlak voor natuur en landschap te meten
146 Goossen, C.M., Monitoring recreatiegedrag van Nederlanders in landelijke gebieden. Jaar 2006/2007
147 Hoefs, R.M.A., J. van Os & T.J.A. Gies. Kavelruil en Landschap. Een korte verkenning naar ruimtelijke effecten van kavelruil
148 Klok, T.L., R. Hille Ris Lambers, P. de Vries, J.E. Tamis & J.W.M. Wijsman. Quick scan model instruments for marine biodiversity policy
149 Spruijt, J., P. Spoorenberg & R. Schreuder. Milieueffectiviteit en kosten van maatregelen gewasbescherming
150 Ehlert, P.A.I. (rapporteur). Advies Bemonstering bodem voor differentiatie van fosfaatgebruiksnormen
151 Wulp van der, N.Y. Storende elementen in het landschap: welke, waar en voor wie? Bijlage bij WOT-paper 1 – Krassen op het landschap
152 Oltmer, K., K.H.M. van Bommel, J. Clement, J.J. de Jong, D.P. Rudrum & E.P.A.G. Schouwenberg. Kosten voor habitattypen in Natura 2000-gebieden. Toepassing van de methode Kosteneffectiviteit natuurbeleid
153 Adrichem van, M.H.C., F.G. Wortelboer & G.W.W. Wamelink (2010). MOVE. Model for terrestrial Vegetation. Version 4.0
154 Wamelink, G.W.W., R.M. Winkler & F.G. Wortelboer. User documentation MOVE4 v 1.0
155 Gies de, T.J.A., L.J.J. Jeurissen, I. Staritsky & A. Bleeker. Leefomgevingsindicatoren Landelijk gebied. Inventarisatie naar stand van zaken over geurhinder, lichthinder en fijn stof
156 Tamminga, S., A.W. Jongbloed, P. Bikker, L. Sebek, C. van Bruggen & O. Oenema. Actualisatie excretiecijfers landbouwhuisdieren voor forfaits regeling Meststoffenwet
157 Van der Salm, C., L. .M. Boumans, G.B.M. Heuvelink & T.C. van Leeuwen. Protocol voor validatie van het nutriëntenemissiemodel STONE op meetgegevens uit het Landelijk Meetnet effecten Mestbeleid
158 Bouwma, I.M. Quickscan Natura 2000 en Programma Beheer. Een vergelijking van Programma Beheer met de soorten en habitats van Natura 2000
159 Gerritsen, A.L., D.A. Kamphorst, T.A. Selnes, M. van Veen, F.J.P. van den Bosch, L. van den Broek, M.E.A. Broekmeyer, J.L.M. Donders, R.J. Fontein, S. van Tol, G.W.W. Wamelink & P. van der Wielen. Dilemma’s en barrières in de praktijk van het natuur- en landschapsbeleid; Achtergronddocument bij Natuurbalans 2009
160 Fontein R.J, T.A. de Boer, B. Breman, C.M. Goossen, R.J.H.G. Henkens, J. Luttik & S. de Vries. Relatie recreatie en natuur; Achtergronddocument bij Natuurbalans 2009
161 Deneer, J.W. & R. Kruijne. (2010). Atmosferische depositie van gewasbeschermingsmiddelen. Een verkenning van de literatuur verschenen na 2003
162 Verburg, R.W., M.E. Sanders, G.H.P. Dirkx, B. de Knegt & J.W. Kuhlman. Natuur, landschap en landelijk gebied. Achtergronddocument bij Natuurbalans 2009
163 Doorn van, A.M. & M.P.C.P. Paulissen. Natuurgericht milieubeleid voor Natura 2000-gebieden in Europees perspectief: een verkenning
164 Smidt, R.A., J. van Os & I. Staritsky. Samenstellen van landelijke kaarten met landschapselementen, grondeigendom en beheer. Technisch achtergronddocument bij de opgeleverde bestanden
165 Pouwels, R., R.P.B. Foppen, M.F. Wallis de Vries, R. Jochem, M.J.S.M. Reijnen & A. van Kleunen, Verkenning LARCH: omgaan met kwaliteit binnen ecologische netwerken
166 Born van den, G.J., H.H. Luesink, H.A.C. Verkerk, H.J. Mulder, J.N. Bosma, M.J.C. de Bode & O. Oenema, Protocol voor monitoring landelijke mestmarkt onder een stelsel van gebruiksnormen, versie 2009
167 Dijk, T.A. van, J.J.M. Driessen, P.A.I. Ehlert, P.H. Hotsma, M.H.M.M. Montforts, S.F. Plessius & O. Oenema. Protocol beoordeling stoffen Meststoffenwet- Versie 2.1

50 C 12.046 WOT-werkdocument 288.doc
168 Smits, M.J., M.J. Bogaardt, D. Eaton, A. Karbauskas & P. Roza. De vermaatschappelijking van het Gemeenschappelijk Landbouwbeleid. Een inventarisatie van visies in Brussel en diverse EU-lidstaten
169 Vreke, J. & I.E. Salverda. Kwaliteit leefomgeving en stedelijk groen
170 Hengsdijk, H. & J.W.A. Langeveld. Yield trends and yield gap analysis of major crops in the World
171 Horst, M.M.S. ter & J.G. Groenwold. Tool to determine the coefficient of variation of DegT50 values of plant protection products in water-sediment systems for different values of the sorption coefficient
172 Boons-Prins, E., P. Leffelaar, L. Bouman & E. Stehfest (2010) Grassland simulation with the LPJmL model
173 Smit, A., O. Oenema & J.W.H. van der Kolk. Indicatoren Kwaliteit Landelijk Gebied
2010 174 Boer de, S., M.J. Bogaardt, P.H. Kersten, F.H. Kistenkas,
M.G.G. Neven & M. van der Zouwen. Zoektocht naar nationale beleidsruimte in de EU-richtlijnen voor het milieu- en natuurbeleid. Een vergelijking van de implementatie van de Vogel- en Habitatrichtlijn, de Kaderrichtlijn Water en de Nitraatrichtlijn in Nederland, Engeland en Noordrijn-Westfalen
175 Jaarrapportage 2009. WOT-04-001 – Koepel 176 Jaarrapportage 2009. WOT-04-002 – Onderbouwend
Onderzoek 177 Jaarrapportage 2009. WOT-04-003 – Advisering Natuur &
Milieu 178 Jaarrapportage 2009. WOT-04-005 – M-AVP 179 Jaarrapportage 2009. WOT-04-006 –
Natuurplanbureaufunctie 180 Jaarrapportage 2009. WOT-04-007 –
Milieuplanbureaufunctie 181 Annual reports for 2009; Programme WOT-04 182 Oenema, O., P. Bikker, J. van Harn, E.A.A. Smolders, L.B.
Sebek, M. van den Berg, E. Stehfest & H. Westhoek. Quickscan opbrengsten en efficiëntie in de gangbare en biologische akkerbouw, melkveehouderij, varkenshouderij en pluimveehouderij. Deelstudie van project ‘Duurzame Eiwitvoorziening’
183 Smits, M.J.W., N.B.P. Polman & J. Westerink. Uitbreidingsmogelijkheden voor groene en blauwe diensten in Nederland; Ervaringen uit het buitenland
184 Dirkx, G.H.P. (red.). Quick responsefunctie 2009. Verslag van de werkzaamheden
185 Kuhlman, J.W., J. Luijt, J. van Dijk, A.D. Schouten & M.J. Voskuilen. Grondprijskaarten 1998-2008
186 Slangen, L.H.G., R.A. Jongeneel, N.B.P. Polman, E. Lianouridis, H. Leneman & M.P.W. Sonneveld. Rol en betekenis van commissies voor gebiedsgericht beleid
187 Temme, A.J.A.M. & P.H. Verburg. Modelling of intensive and extensive farming in CLUE
188 Vreke, J. Financieringsconstructies voor landschap
189 Slangen, L.H.G. Economische concepten voor beleidsanalyse van milieu, natuur en landschap
190 Knotters, M., G.B.M. Heuvelink, T. Hoogland & D.J.J. Walvoort. A disposition of interpolation techniques
191 Hoogeveen, M.W., P.W. Blokland, H. van Kernebeek, H.H. Luesink & J.H. Wisman. Ammoniakemissie uit de landbouw in 1990 en 2005-2008
192 Beekman, V., A. Pronk & A. de Smet. De consumptie van dierlijke producten. Ontwikkeling, determinanten, actoren en interventies.
193 Polman, N.B.P., L.H.G. Slangen, A.T. de Blaeij, J. Vader & J. van Dijk. Baten van de EHS; De locatie van recreatiebedrijven
194 Veeneklaas, F.R. & J. Vader. Demografie in de Natuurverkenning 2011; Bijlage bij WOt-paper 3
195 Wascher, D.M., M. van Eupen, C.A. Mücher & I.R. Geijzendorffer, Biodiversity of European Agricultural landscapes. Enhancing a High Nature Value Farmland Indicator
196 Apeldoorn van, R.C., I.M. Bouwma, A.M. van Doorn, H.S.D. Naeff, R.M.A. Hoefs, B.S. Elbersen & B.J.R. van Rooij. Natuurgebieden in Europa: bescherming en financiering
197 Brus, D.J., R. Vasat, G. B. M. Heuvelink, M. Knotters, F. de Vries & D. J. J. Walvoort. Towards a Soil Information System with quantified accuracy; A prototype for mapping continuous soil properties
198 Groot, A.M.E.& A.L. Gerritsen, m.m.v. M.H. Borgstein, E.J. Bos & P. van der Wielen. Verantwoording van de methodiek Achtergronddocument bij ‘Kwalitatieve monitor Systeeminnovaties verduurzaming landbouw’
199 Bos, E.J. & M.H. Borgstein. Monitoring Gesloten voer-mest kringlopen. Achtergronddocument bij ‘Kwalitatieve monitor Systeeminnovaties verduurzaming landbouw’
200 Kennismarkt 27 april 2010; Van onderbouwend onderzoek Wageningen UR naar producten Planbureau voor de Leefomgeving
201 Wielen van der, P. Monitoring Integrale duurzame stallen. Achtergronddocument bij ‘Kwalitatieve monitor Systeeminnovaties verduurzaming landbouw’
202 Groot, A.M.E.& A.L. Gerritsen. Monitoring Functionele agrobiodiversiteit. Achtergrond-document bij ‘Kwalitatieve monitor Systeeminnovaties verduurzaming landbouw’
203 Jongeneel, R.A. & L. Ge. Farmers’ behavior and the provision of public goods: Towards an analytical framework
204 Vries, S. de, M.H.G. Custers & J. Boers. Storende elementen in beeld; de impact van menselijke artefacten op de landschapsbeleving nader onderzocht
205 Vader, J. J.L.M. Donders & H.W.B. Bredenoord. Zicht op natuur- en landschapsorganisaties; Achtergronddocument bij Natuurverkenning 2011
206 Jongeneel, R.A., L.H.G. Slangen & N.B.P. Polman. Groene en blauwe diensten; Een raamwerk voor de analyse van doelen, maatregelen en instrumenten
207 Letourneau, A.P, P.H. Verburg & E. Stehfest. Global change of land use systems; IMAGE: a new land allocation module
208 Heer, M. de. Het Park van de Toekomst. Achtergronddocument bij Natuurverkenning 2011
209 Knotters, M., J. Lahr, A.M. van Oosten-Siedlecka & P.F.M. Verdonschot. Aggregation of ecological indicators for mapping aquatic nature quality. Overview of existing methods and case studies
210 Verdonschot, P.F.M. & A.M. van Oosten-Siedlecka. Graadmeters Aquatische natuur. Analyse gegevenskwaliteit Limnodata
211 Linderhof, V.G.M. & H. Leneman. Quickscan kosteneffectiviteitsanalyse aquatische natuur
212 Leneman, H., V.G.M. Linderhof & R. Michels. Mogelijkheden voor het inbrengen van informatie uit de ‘KRW database’ in de ‘KE database’
213 Schrijver, R.A.M., A. Corporaal, W.A. Ozinga & D. Rudrum. Kosteneffectieve natuur in landbouwgebieden; Methode om effecten van maatregelen voor de verhoging van biodiversiteit in landbouwgebieden te bepalen, een test in twee gebieden in Noordoost-Twente en West-Zeeuws-Vlaanderen
214 Hoogland, T., R.H. Kemmers, D.G. Cirkel & J. Hunink. Standplaatsfactoren afgeleid van hydrologische model uitkomsten; Methode-ontwikkeling en toetsing in het Drentse Aa-gebied
215 Agricola, H.J., R.M.A. Hoefs, A.M. van Doorn, R.A. Smidt & J. van Os. Landschappelijke effecten van ontwikkelingen in de landbouw
216 Kramer, H., J. Oldengarm & L.F.S. Roupioz. Nederland is groener dan kaarten laten zien; Mogelijkheden om ‘groen’ beter te inventariseren en monitoren met de automatische classificatie van digitale luchtfoto’s
217 Raffe, J.K. van, J.J. de Jong & G.W.W. Wamelink (2011). Kostenmodule Natuurplanner; functioneel ontwerp en software-validatie
218 Hazeu, G.W., Kramer, H., J. Clement & W.P. Daamen (2011). Basiskaart Natuur 1990rev

Biodiversity in a changing Oosterschelde: from past to present 51
219 Boer, T.A. de. Waardering en recreatief gebruik van Nationale Landschappen door haar bewoners
220 Leneman, H., A.D. Schouten & R.W. Verburg. Varianten van natuurbeleid: voorbereidende kostenberekeningen; Achtergronddocument bij Natuurverkenning 2011
221 Knegt, B. de, J. Clement, P.W. Goedhart, H. Sierdsema, Chr. van Swaay & P. Wiersma. Natuurkwaliteit van het agrarisch gebied
2011 222 Kamphorst, D.A. & M.M.P. van Oorschot. Kansen en
barrières voor verduurzaming van houtketens 223 Salm, C. van der & O.F. Schoumans. Langetermijneffecten
van verminderde fosfaatgiften 224 Bikker, P., M.M. van Krimpen & G.J. Remmelink. Stikstof-
verteerbaarheid in voeders voor landbouwhuisdieren; Berekeningen voor de TAN-excretie
225 M.E. Sanders & A.L. Gerritsen (red.). Het biodiversiteitsbeleid in Nederland werkt. Achtergronddocument bij Balans van de Leefomgeving 2010
226 Bogaart, P.W., G.A.K. van Voorn & L.M.W. Akkermans. Evenwichtsanalyse modelcomplexiteit; een verkennende studie
227 Kleunen A. van, K. Koffijberg, P. de Boer, J. Nienhuis, C.J. Camphuysen, H. Schekkerman, K.H. Oosterbeek, M.L. de Jong, B. Ens & C.J. Smit (2010). Broedsucces van kustbroedvogels in de Waddenzee in 2007 en 2008
228 Salm, C. van der, L.J.M. Boumans, D.J. Brus, B. Kempen & T.C van Leeuwen. Validatie van het nutriëntenemissiemodel STONE met meetgegevens uit het Landelijk Meetnet effecten Mestbeleid (LMM) en de Landelijke Steekproef Kaarteenheden (LSK).
229 Dijkema, K.S., W.E. van Duin, E.M. Dijkman, A. Nicolai, H. Jongerius, H. Keegstra, L. van Egmond, H.J. Venema & J.J. Jongsma. Vijftig jaar monitoring en beheer van de Friese en Groninger kwelderwerken: 1960-2009
230 Jaarrapportage 2010. WOT-04-001 – Koepel 231 Jaarrapportage 2010. WOT-04-002 – Onderbouwend
Onderzoek 232 Jaarrapportage 2010. WOT-04-003 – Advisering Natuur &
Milieu 233 Jaarrapportage 2010. WOT-04-005 – M-AVP 234 Jaarrapportage 2010. WOT-04-006 –
Natuurplanbureaufunctie 235 Jaarrapportage 2010. WOT-04-007 –
Milieuplanbureaufunctie 236 Arnouts, R.C.M. & F.H. Kistenkas. Nederland op slot door
Natura 2000: de discussie ontrafeld; Bijlage bij WOt-paper 7 – De deur klemt
237 Harms, B. & M.M.M. Overbeek. Bedrijven aan de slag met natuur en landschap; relaties tussen bedrijven en natuurorganisaties. Achtergronddocument bij Natuurverkenning 2011
238 Agricola, H.J. & L.A.E. Vullings. De stand van het platteland 2010. Monitor Agenda Vitaal Platteland; Rapportage Midterm meting Effectindicatoren
239 Klijn, J.A. Wisselend getij. Omgang met en beleid voor natuur en landschap in verleden en heden; een essayistische beschouwing. Achtergronddocument bij Natuurverkenning 2011
240 Corporaal, A., T. Denters, H.F. van Dobben, S.M. Hennekens, A. Klimkowska, W.A. Ozinga, J.H.J. Schaminée & R.A.M. Schrijver. Stenoeciteit van de Nederlandse flora. Een nieuwe parameter op grond van ecologische amplitudo’s van de Nederlandse plantensoorten en toepassingsmogelijkheden
241 Wamelink, G.W.W., R. Jochem, J. van der Greft-van Rossum, C. Grashof-Bokdam, R.M.A. Wegman, G.J. Franke & A.H. Prins. Het plantendispersiemodel DIMO. Verbetering van de modellering in de Natuurplanner
242 Klimkowska, A., M.H.C. van Adrichem, J.A.M. Jansen & G.W.W. Wamelink. Bruikbaarheid van WNK-monitoringgegevens voor EC-rapportage voor Natura 2000-gebieden. Eerste fase
243 Goossen, C.M., R.J. Fontein, J.L.M. Donders & R.C.M. Arnouts. Mass Movement naar recreatieve gebieden; Overzicht van methoden om bezoekersaantallen te meten
244 Spruijt, J., P.M. Spoorenberg, J.A.J.M. Rovers, J.J. Slabbekoorn, S.A.M. de Kool, M.E.T. Vlaswinkel, B. Heijne, J.A. Hiemstra, F. Nouwens & B.J. van der Sluis. Milieueffecten van maatregelen gewasbescherming
245 Walker, A.N. & G.B. Woltjer. Forestry in the Magnet model. 246 Hoefnagel, E.W.J., F.C. Buisman, J.A.E. van Oostenbrugge
& B.I. de Vos. Een duurzame toekomst voor de Nederlandse visserij. Toekomstscenario’s 2040
247 Buurma, J.S. & S.R.M. Janssens. Het koor van adviseurs verdient een dirigent. Over kennisverspreiding rond phytophthora in aardappelen
248 Verburg, R.W., A.L. Gerritsen & W. Nieuwenhuizen. Natuur mee koppelen in ruimtelijke ontwikkeling: een analyse van sturingsstrategieën voor de Natuurverkenning. Achtergronddocument bij Natuurverkenning 2011
249 Kooten, T. van & C. Klok. The Mackinson-Daskalov North Sea EcoSpace model as a simulation tool for spatial planning scenarios
250 Bruggen van, C., C.M. Groenestein, B.J. de Haan, M.W. Hoogeveen, J.F.M. Huijsmans, S.M. van der Sluis & G.L. Velthof. Ammoniakemissie uit dierlijke mest en kunstmest 1990-2008. Berekeningen met het Nationaal Emissiemodel voor Ammoniak (NEMA)
251 Bruggen van, C., C.M. Groenestein, B.J. de Haan, M.W. Hoogeveen, J.F.M. Huijsmans, S.M. van der Sluis & G.L. Velthof. Ammoniakemissie uit dierlijke mest en kunstmest in 2009. Berekeningen met het Nationaal Emissiemodel voor Ammoniak (NEMA)
252 Randen van, Y., H.L.E. de Groot & L.A.E. Vullings. Monitor Agenda Vitaal Platteland vastgelegd. Ontwerp en implementatie van een generieke beleidsmonitor
253 Agricola, H.J., R. Reijnen, J.A. Boone, M.A. Dolman, C.M. Goossen, S. de Vries, J. Roos-Klein Lankhorst, L.M.G. Groenemeijer & S.L. Deijl. Achtergronddocument Midterm meting Effectindicatoren Monitor Agenda Vitaal Platteland
254 Buiteveld, J. S.J. Hiemstra & B. ten Brink. Modelling global agrobiodiversity. A fuzzy cognitive mapping approach
255 Hal van R., O.G. Bos & R.G. Jak. Noordzee: systeem-dynamiek, klimaatverandering, natuurtypen en benthos. Achtergronddocument bij Natuurverkenning 2011
256 Teal, L.R.. The North Sea fish community: past, present and future. Background document for the 2011 National Nature Outlook
257 Leopold, M.F., R.S.A. van Bemmelen & S.C.V. Geelhoed. Zeevogels op de Noordzee. Achtergronddocument bij Natuurverkenning 2011
258 Geelhoed, S.C.V. & T. van Polanen Petel. Zeezoogdieren op de Noordzee. Achtergronddocument bij Natuurverkenning 2011
259 Kuijs, E.K.M. & J. Steenbergen. Zoet-zoutovergangen in Nederland; stand van zaken en kansen voor de toekomst. Achtergronddocument bij Natuurverkenning 2011
260 Baptist, M.J. Zachte kustverdediging in Nederland; scenario’s voor 2040. Achtergronddocument bij Natuurverkenning 2011
261 Wiersinga, W.A., R. van Hal, R.G. Jak & F.J. Quirijns. Duurzame kottervisserij op de Noordzee. Achtergronddocument bij Natuurverkenning 2011
262 Wal J.T. van der & W.A. Wiersinga. Ruimtegebruik op de Noordzee en de trends tot 2040. Achtergronddocument bij Natuurverkenning 2011
263 Wiersinga, W.A. J.T. van der Wal, R.G. Jak & M.J. Baptist. Vier kijkrichtingen voor de mariene natuur in 2040. Achtergronddocument bij Natuurverkenning 2011
264 Bolman, B.C. & D.G. Goldsborough. Marine Governance. Achtergronddocument bij Natuurverkenning 2011

52 C 12.046 WOT-werkdocument 288.doc
265 Bannink, A. Methane emissions from enteric fermentation in dairy cows, 1990-2008; Background document on the calculation method and uncertainty analysis for the Dutch National Inventory Report on Greenhouse Gas Emissions
266 Wyngaert, I.J.J. van den, P.J. Kuikman, J.P. Lesschen, C.C. Verwer & H.H.J. Vreuls. LULUCF values under the Kyoto Protocol; Background document in preparation of the National Inventory Report 2011 (reporting year 2009)
267 Helming, J.F.M. & I.J. Terluin. Scenarios for a cap beyond 2013; implications for EU27 agriculture and the cap budget.
268 Woltjer, G.B. Meat consumption, production and land use. Model implementation and scenarios.
269 Knegt, B. de, M. van Eupen, A. van Hinsberg, R. Pouwels, M.S.J.M. Reijnen, S. de Vries, W.G.M. van der Bilt & S. van Tol. Ecologische en recreatieve beoordeling van toekomstscenario’s van natuur op het land. Achtergrond-document bij Natuurverkenning 2011.
270 Bos, J.F.F.P., M.J.W. Smits, R.A.M Schrijver & R.W. van der Meer. Gebiedsstudies naar effecten van vergroening van het Gemeenschappelijk Landbouwbeleid op bedrijfseconomie en inpassing van agrarisch natuurbeheer.
271 Donders, J., J. Luttik, M. Goossen, F. Veeneklaas, J. Vreke & T. Weijschede. Waar gaat dat heen? Recreatiemotieven, landschapskwaliteit en de oudere wandelaar. Achtergronddocument bij Natuurverkenning 2011.
272 Voorn G.A.K. van & D.J.J. Walvoort. Evaluation of an evaluation list for model complexity.
273 Heide, C.M. van der & F.J. Sijtsma. Maatschappelijke waardering van ecosysteemdiensten; een handreiking voor publieke besluitvorming. Achtergronddocument bij Natuurverkenning 2011
275 Os, J. van; T.J.A. Gies; H.S.D. Naeff; L.J.J Jeurissen. Emissieregistratie van landbouwbedrijven; verbeteringen met behulp van het Geografisch Informatiesysteem Agrarische Bedrijven.
276 Walsum, P.E.V. van & A.A. Veldhuizen. MetaSWAP_V7_2_0; Rapportage van activiteiten ten behoeve van certificering met Status A.
277 Kooten T. van & S.T. Glorius. Modeling the future of het North Sea. An evaluation of quantitative tools available to explore policy, space use and planning options.
280 Kistenkas, F.H. & W. Nieuwenhuizen. Rechtsontwikkelingen landschapsbeleid: landschapsrecht in wording. Bijlage bij WOt-paper 12 – ‘Recht versus beleid’
281 Meeuwsen, H.A.M. & R. Jochem. Openheid van het landschap; Berekeningen met het model ViewScape.
282 Dobben, H.F. van. Naar eenvoudige dosis-effectrelaties tussen natuur en milieucondities; een toetsing van de mogelijkheden van de Natuurplanner.
283 Gaaff, A. Raming van de budgetten voor natuur op langere termijn; Achtergronddocument bij Natuurverkenning 2011.
285 Vries, P. de, J.E. Tamis, J.T. van der Wal, R.G. Jak, D.M.E. Slijkerman and J.H.M. Schobben. Scaling human-induced pressures to population level impacts in the marine environment; implementation of the prototype CUMULEO-RAM model.
2012 286 Keizer-Vlek, H.E. & P.F.M. Verdonschot. Bruikbaarheid van
SNL-monitoringgegevens voor EC-rapportage voor Natura 2000-gebieden; Tweede fase: aquatische habitattypen.
288 Troost, K., D. van de Ende, M. Tangelder & T.J.W. Ysebaert. Biodiversity in a changing Oosterschelde: from past to present
289 Jaarrapportage 2011. WOT-04-001 – Koepel 290 Jaarrapportage 2011. WOT-04-008 – Agromilieu 291 Jaarrapportage 2011. WOT-04-009 – Natuur, Landschap
en Platteland 292 Jaarrapportage 2011. WOT-04-010 – Balans van de
Leefomgeving 293 Jaarrapportage 2011. WOT-04-011 – Natuurverkenning