Embed Size (px)
Citation preview
Biodiversity Indonesia
Frida Sidik, PhD
Researcher, Kementerian Kelautan dan Perikanan
Fellow, 2016/17 ASEAN-US Science and Technology Fellowship – Kementerian Lingkungan Hidup dan Kehutanan
Principal Investigator, PEER Science 2013-2015
Email: [email protected]
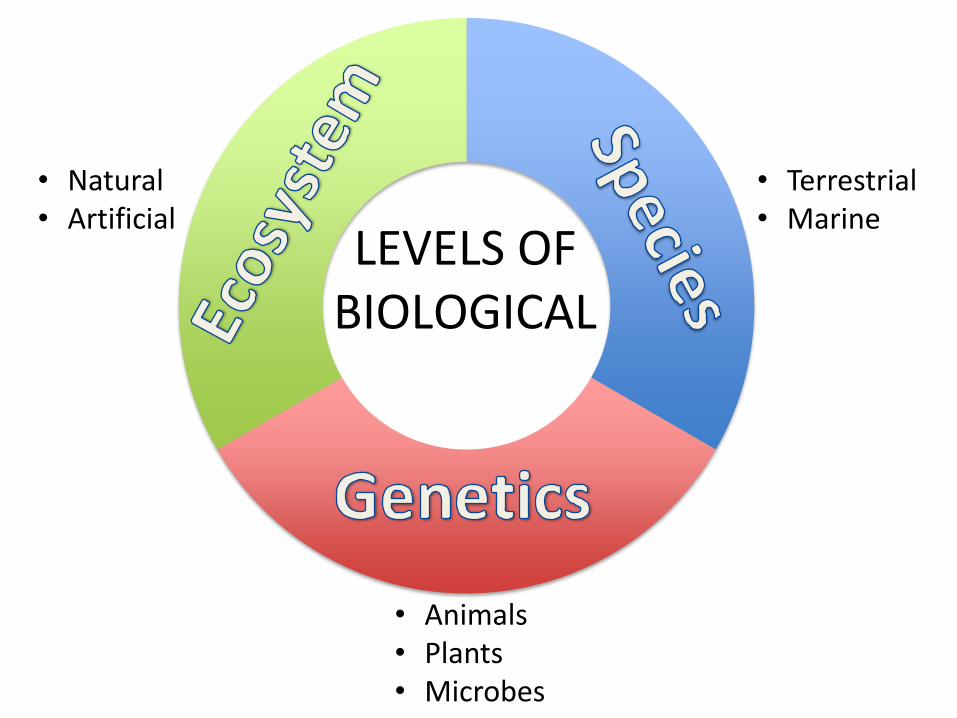
LEVELS OF BIOLOGICAL
• Natural • Artificial
• Terrestrial • Marine
• Animals • Plants • Microbes
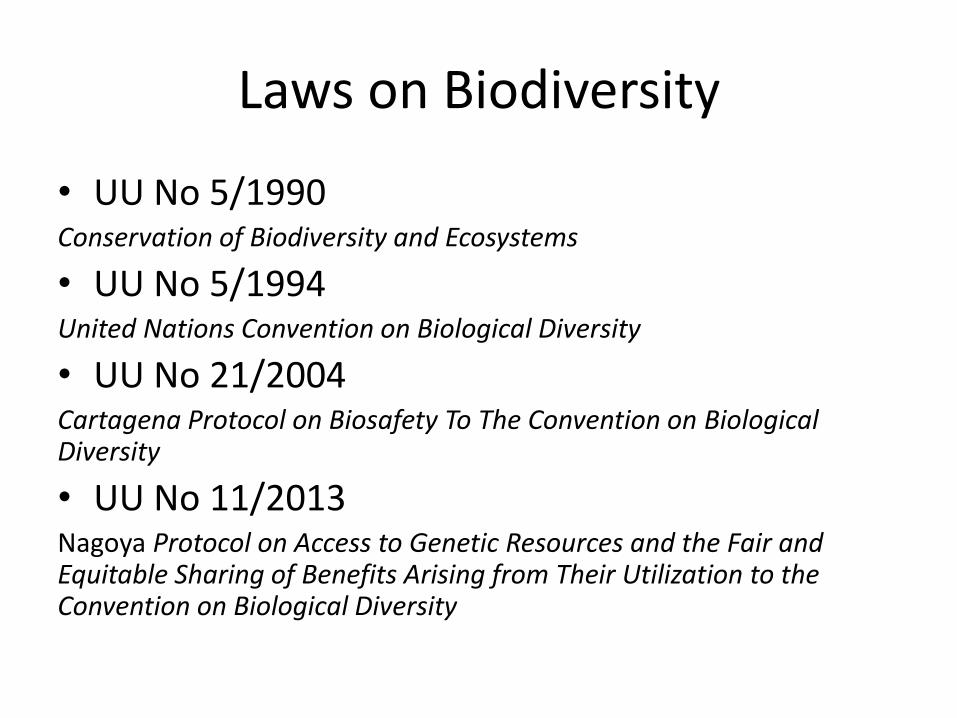
Laws on Biodiversity
• UU No 5/1990 Conservation of Biodiversity and Ecosystems
• UU No 5/1994 United Nations Convention on Biological Diversity
• UU No 21/2004 Cartagena Protocol on Biosafety To The Convention on Biological Diversity
• UU No 11/2013 Nagoya Protocol on Access to Genetic Resources and the Fair and Equitable Sharing of Benefits Arising from Their Utilization to the Convention on Biological Diversity

1993
Biodiversity Action Plan for Indonesia (BAPI) Ratification UN CBD
2003
Indonesian Biodiversity Strategy and Action Plan (IBSAP) 2003-2020 Biodiversity Action Plan 2020, Aichi Target, Access and Benefit Sharing (ABS), LIPI (2014), COP CBD 10 Nagoya
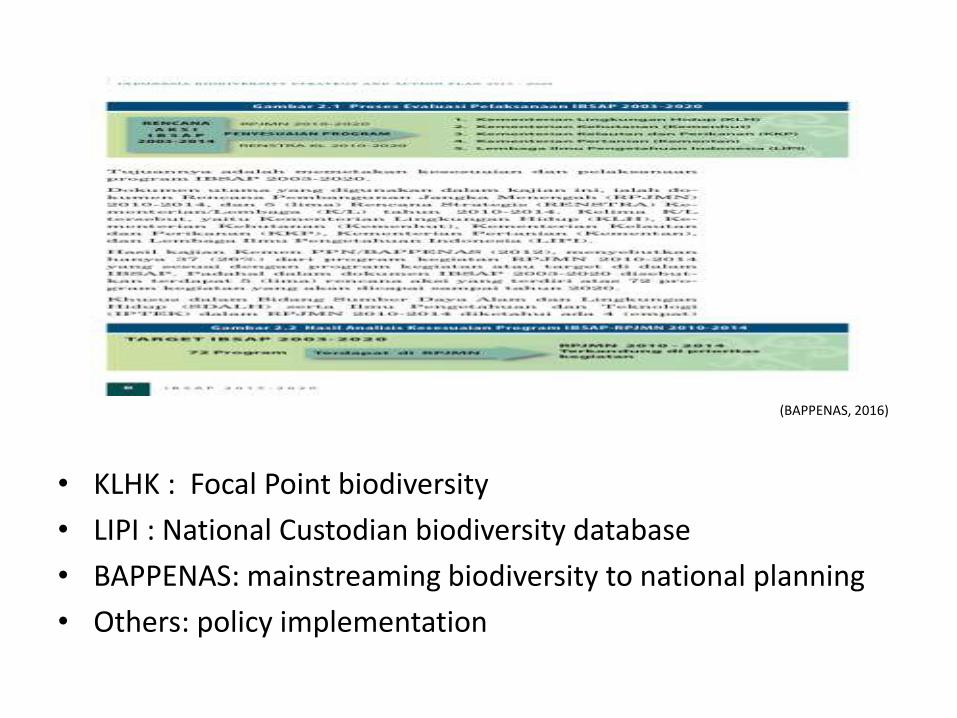
• KLHK : Focal Point biodiversity
• LIPI : National Custodian biodiversity database
• BAPPENAS: mainstreaming biodiversity to national planning
• Others: policy implementation
(BAPPENAS, 2016)
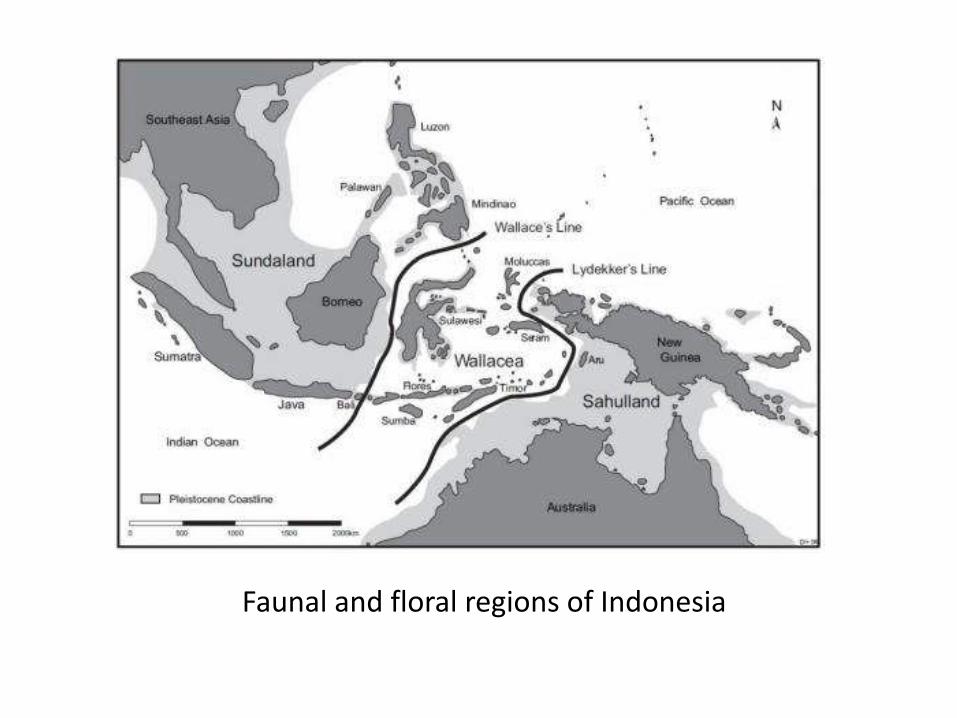
Faunal and floral regions of Indonesia
xv
rine biodiversity conservation priorities in order to design an effective and representative national
system of MPAs and MPA networks. The prioritization exercise reported herein was designed to
address this need, and had three primary objectives:
1. Solicit input from internationally-recognized experts to establish what constitutes the essential
marine biodiversity of Indonesia;
2. Provide a science-based ranking of the marine ecoregions of Indonesia in terms of their prior-
ity for marine biodiversity conservation investment by the Government of Indonesia, CTSP and
other interested parties;
3. Identify priority “gap” areas which currently lack marine protected area coverage necessary for
the further development of a comprehensive national system of MPAs in Indonesia.
Prioritization Process
The prioritization exercise was conducted primarily through an electronic expert opinion ques-
tionnaire that sought to compile as much quantitative data as possible for use in ranking Indonesian
geographies for marine biodiversity conservation investment. In order to ensure comparability of
expert inputs and rankings, it was necessary to select a standardized delineation of the marine
regions of Indonesia. Given that that the primary goal of the exercise was to identify top priority
geographies for conservation investments that will frequently involve ecologically-connected net-
works of MPAs, we have selected the marine ecoregions of the world (MEOW) defined by Spalding
et al. (2007) as the default delineation for this exercise, as these ecoregions generally represent the
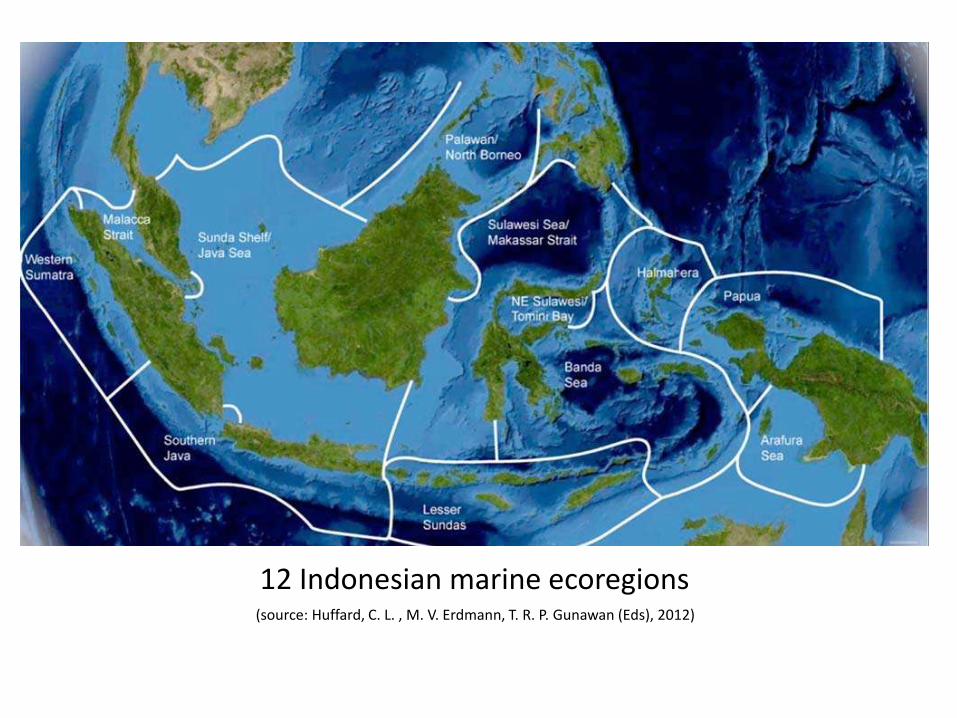
scale at which such networks will be defined and implemented. Within Indonesia, the MEOW
classification defines 12 marine ecoregions (see Figure XS1 below).
Figure XS1. Map showing the twelve Indonesian marine ecoregions as defined in the Marine Ecoregions of the World
(MEOW) classification scheme; redrawn from Spalding et al. (2007)12 Indonesian marine ecoregions (source: Huffard, C. L. , M. V. Erdmann, T. R. P. Gunawan (Eds), 2012)
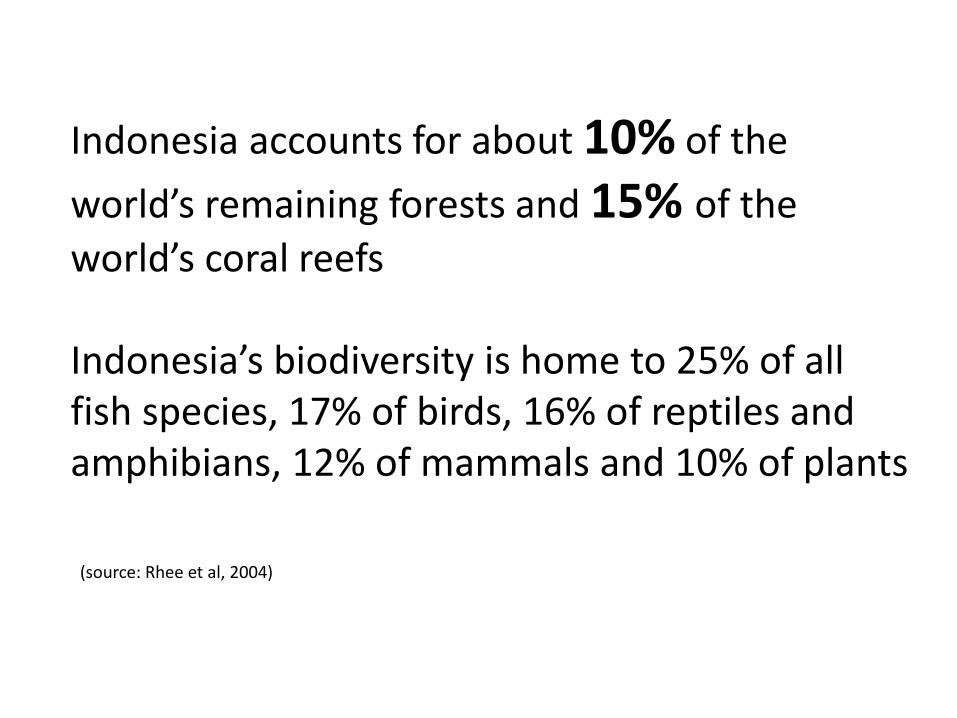
Indonesia accounts for about 10% of the
world’s remaining forests and 15% of the
world’s coral reefs Indonesia’s biodiversity is home to 25% of all fish species, 17% of birds, 16% of reptiles and amphibians, 12% of mammals and 10% of plants (source: Rhee et al, 2004)
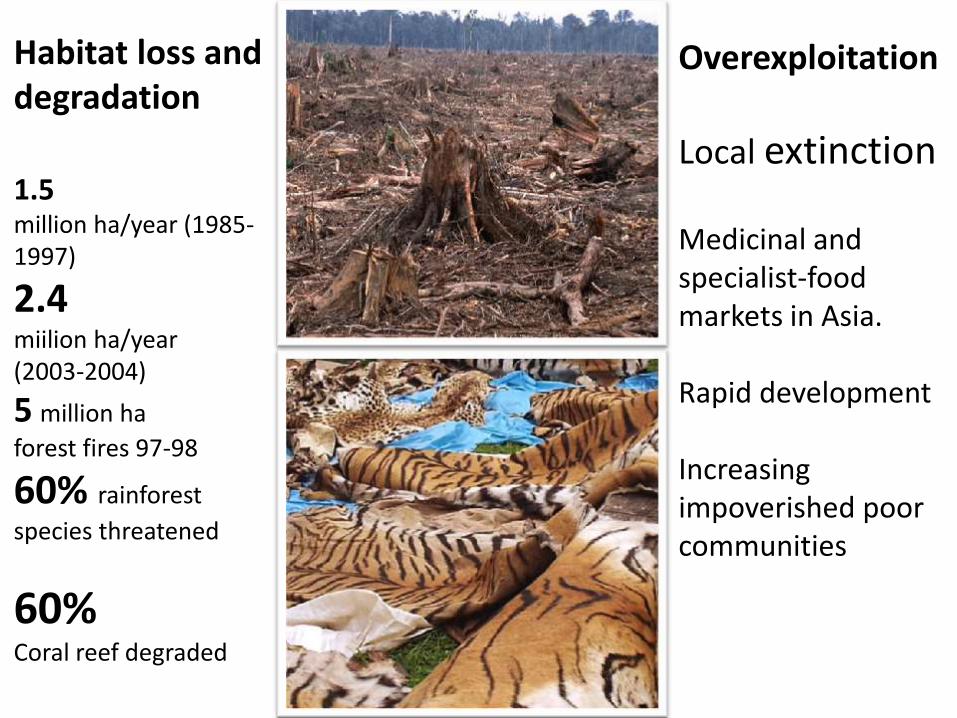
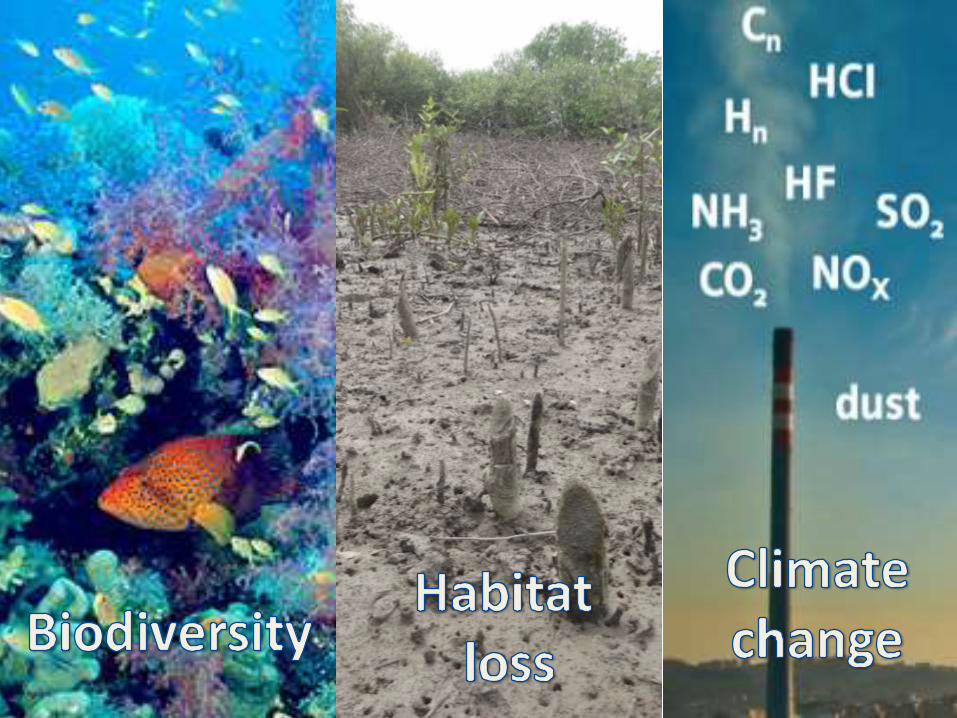
Habitat loss and degradation
1.5 million ha/year (1985-1997)
2.4 miilion ha/year (2003-2004)
5 million ha
forest fires 97-98
60% rainforest
species threatened
60% Coral reef degraded
Overexploitation
Local extinction Medicinal and specialist-food markets in Asia. Rapid development Increasing impoverished poor communities
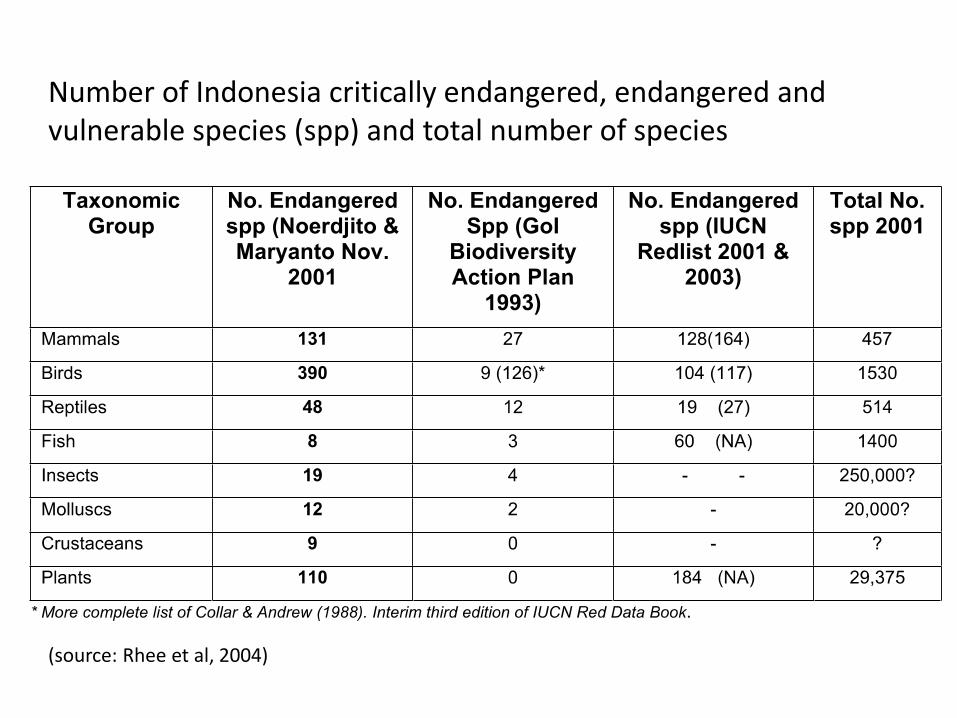
Number of Indonesia critically endangered, endangered and vulnerable species (spp) and total number of species
(source: Rhee et al, 2004)
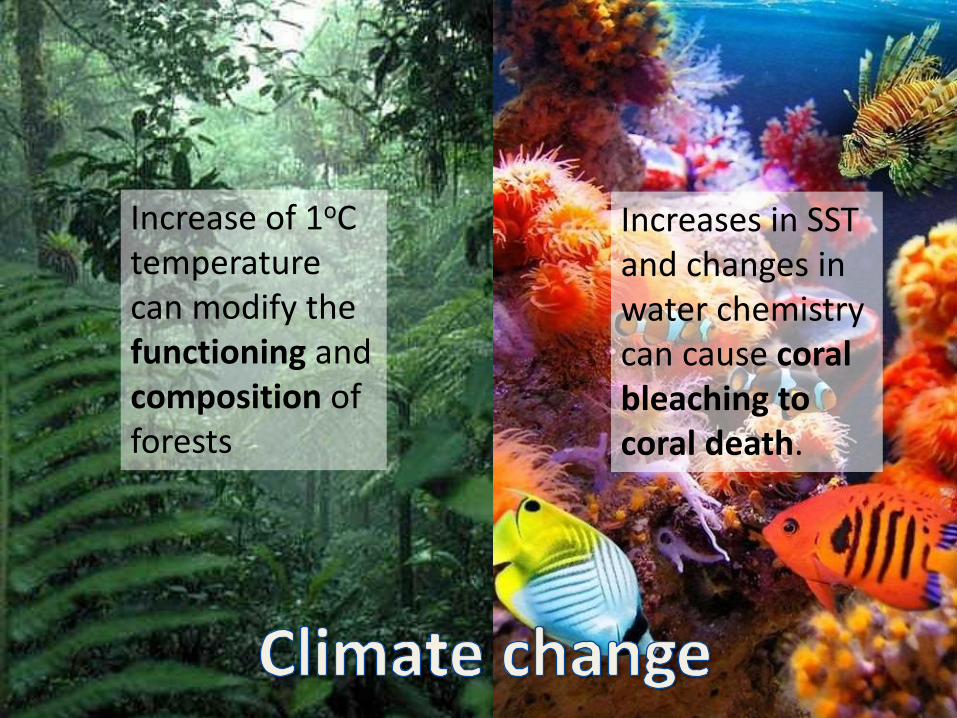
CONSERVATION
Increase of 1oC temperature can modify the functioning and composition of forests
Increases in SST and changes in water chemistry can cause coral bleaching to coral death.
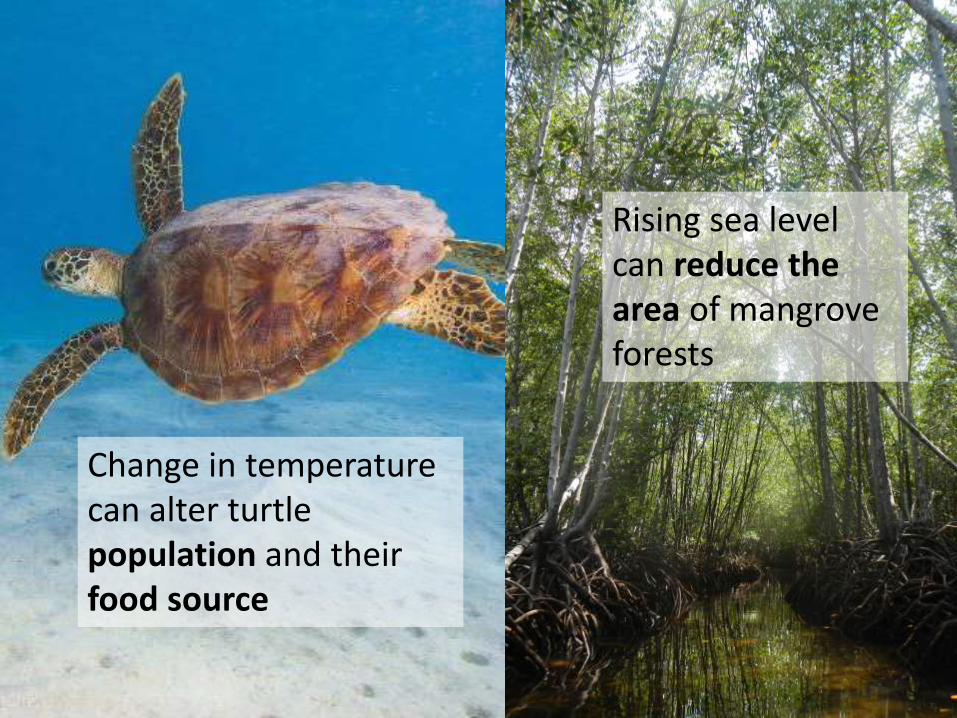
Rising sea level can reduce the area of mangrove forests
Change in temperature can alter turtle population and their food source

4 - 1
4. Protected Areas Policy, Status and Management
While the previous Chapter looks at biodiversity patterns and conservation of
biodiversity in specific protected areas, this Chapter focuses on broad, national-level
protected areas policy, status and management. This is important in terms of
understanding opportunities and constraints for working in specific individual protected
areas. Further, it is important for identifying entry-points to leverage best practices in
conservation management in one site to the broader national protected area system.
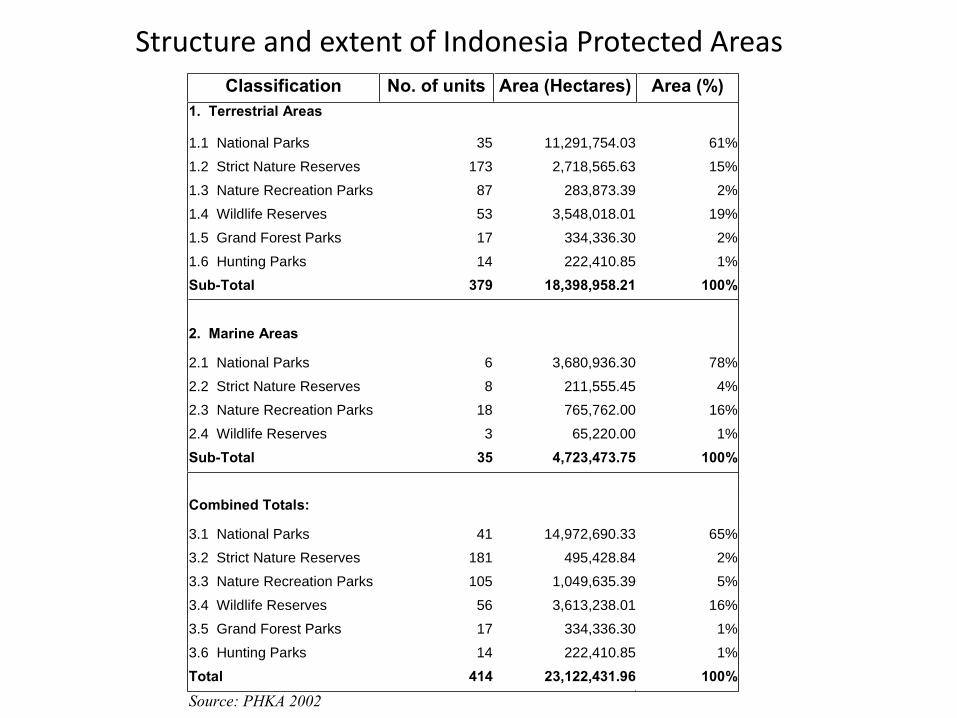
Indonesia has established a network of 379 terrestrial protected areas covering 18,398
million hectares and 35 marine PAs covering 4,723 million ha. Established mostly during
the 1980s, Indonesia’s protected area system is founded on a habitat and biodiversity
representation approach.
Table 4.1: Structure and Extent of Indonesia’s Protected Areas System
Classification No. of units Area (Hectares) Area (%)
1. Terrestrial Areas
1.1 National Parks 35 11,291,754.03 61%
1.2 Strict Nature Reserves 173 2,718,565.63 15%
1.3 Nature Recreation Parks 87 283,873.39 2%
1.4 Wildlife Reserves 53 3,548,018.01 19%
1.5 Grand Forest Parks 17 334,336.30 2%
1.6 Hunting Parks 14 222,410.85 1%
Sub-Total 379 18,398,958.21 100%
2. Marine Areas
2.1 National Parks 6 3,680,936.30 78%
2.2 Strict Nature Reserves 8 211,555.45 4%
2.3 Nature Recreation Parks 18 765,762.00 16%
2.4 Wildlife Reserves 3 65,220.00 1%
Sub-Total 35 4,723,473.75 100%
Combined Totals:
3.1 National Parks 41 14,972,690.33 65%
3.2 Strict Nature Reserves 181 495,428.84 2%
3.3 Nature Recreation Parks 105 1,049,635.39 5%
3.4 Wildlife Reserves 56 3,613,238.01 16%
3.5 Grand Forest Parks 17 334,336.30 1%
3.6 Hunting Parks 14 222,410.85 1%
Total 414 23,122,431.96 100%
Source: PHKA 2002
Structure and extent of Indonesia Protected Areas
25
11
jenis ini mencakup kegiatan identifikasi dan pemetaan ikan-ikan yang terancam punah,
langka, dan endemik. Selain itu, ditargetkan peningkatan status perlindungan dan
pelestarian, dan pengaturan pemanfaatan lestari sumberdaya ikan tersebut. Target 15
spesies untuk konservasi jenis tersebut adalah ikan napoleon, arwana super red,
arwana jardini, kuda laut, karang, hiu, paus, Banggai Cardinal Fish, kima, terubuk, labi-
labi, lola, teripang, penyu, dan dugong.
Gambar 1. Pembagian ekoregion prioritas konservasi Indonesia
Selain tagert luasan dan konservasi jenis ikan, para ahli kelautan banyak meneliti
dan mempublikasikan tentang target konservasi terhadap habitat penting sumberdaya
pesisir dan laut. Habitat penting atau critical habitats yang dimaksud adalah terumbu
karang, hutan mangrove, dan padang lamun. Menurut Bohnsack et al. (2000),
melindungi sekitar 20 - 30% luasan terumbu karang telah terbukti dapat mendukung
keberlanjutan ekosistem terumbu karang. Sedangkan PISCO (2002) mensinyalir bahwa
manfaat optimal dari pengelolaan KKP melalui spill-over dan produksi larva akan
meningkat pada perlindungan terhadap 20-30% luasan habitat penting. Setelah
12
melewati 20-30%, KKP menjadi sangat luas, sehingga akan menurunkan produksi
perikanan karena menyempitnya daerah penangkapan bagi masyarakat.
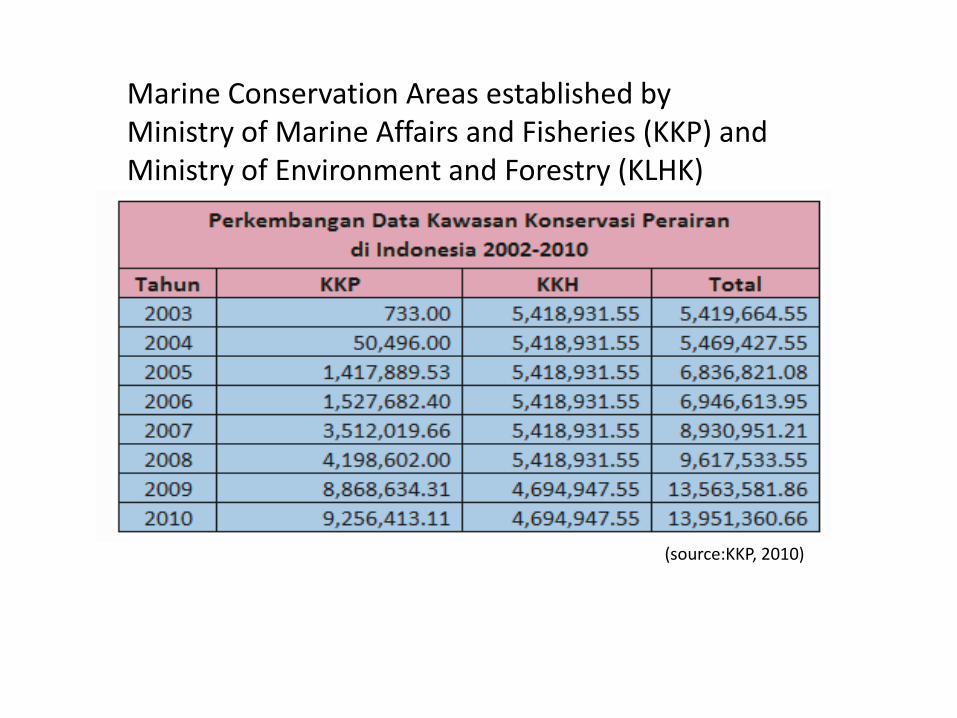
5.2 Status Konservasi
Sampai dengan awal tahun 2011, Indonesia telah mengembangkan 13,95 juta
ha KKP. Perkembangan luasan KKP mengalami peningkatan yang signifikan sejak
tahun 2003. Pada tahun 2003 total luas KKP baru mencapai luasan 5,42 juta ha yang
hampir semuanya merupakan inisiasi Kementerian Kehutanan. Hanya 733 ha yang
merupakan inisiasi Kementerian Kelautan dan Perikanan atau kurang dari 1%. Namun
saat ini terjadi peningkatan hingga 9,26 juta ha atau sekitar 66% dari luas total KKP
(Dermawan, 2010) (Tabel 1).
Tabel 1. Perkembangan Data KKP di Indonesia periode 2002-2010
Kementerian Kelautan dan Perikanan menginisiasi berdirinya Taman Nasional
Perairan (TNP) Laut Sawu seluas 3,5 juta ha, sedangkan inisiasi Pemerintah Daerah
seluas 5 juta ha melalui pembentukan KKP Daerah. Pencapaian luasan KKP tersebut
merupakan 4,5% dari luas laut teritorial Indonesia dan telah melampaui target
pemerintah di tahun 2010 yang berkomitmen mengembangkan KKP 10 juta ha. Untuk
memenuhi target pemerintah di tahun 2014, maka pemerintah masih harus
mengembangkan 1,5 juta ha KKP baru.
Marine Conservation Areas established by Ministry of Marine Affairs and Fisheries (KKP) and Ministry of Environment and Forestry (KLHK)
(source:KKP, 2010)
77
Figure 25. Number of first through fourth order conservation priorities (from Salm and Halim, 1984) per
Indonesian ecoregion. Relative size of pie chart corresponds to the number of priorities in this ecoregion,
while size of pie sections represent relative proportions of ordered priorities.
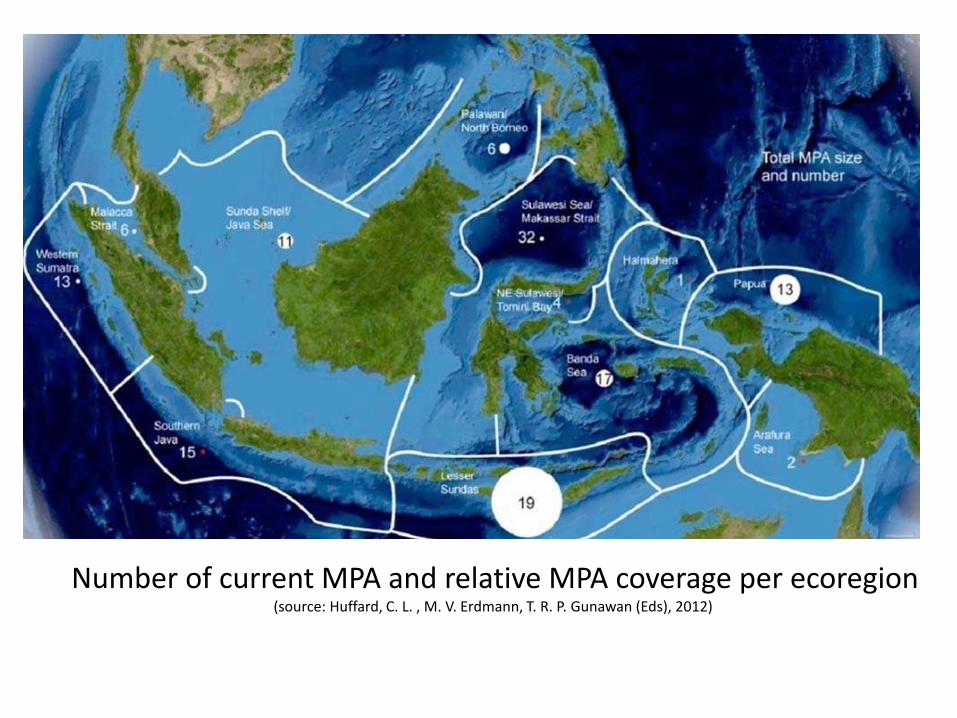
Figure 26. The number of current MPAs and relative MPA coverage per ecoregion in Indonesia. The number
within the white circle represents the number of MPAs in that ecoregion, while the size of white circle is
proportional to the number of hectares of MPA coverage in that ecoregion. Red asterisks denote MPA
coverage too small to represent at this scale.
Number of current MPA and relative MPA coverage per ecoregion (source: Huffard, C. L. , M. V. Erdmann, T. R. P. Gunawan (Eds), 2012)
xvii
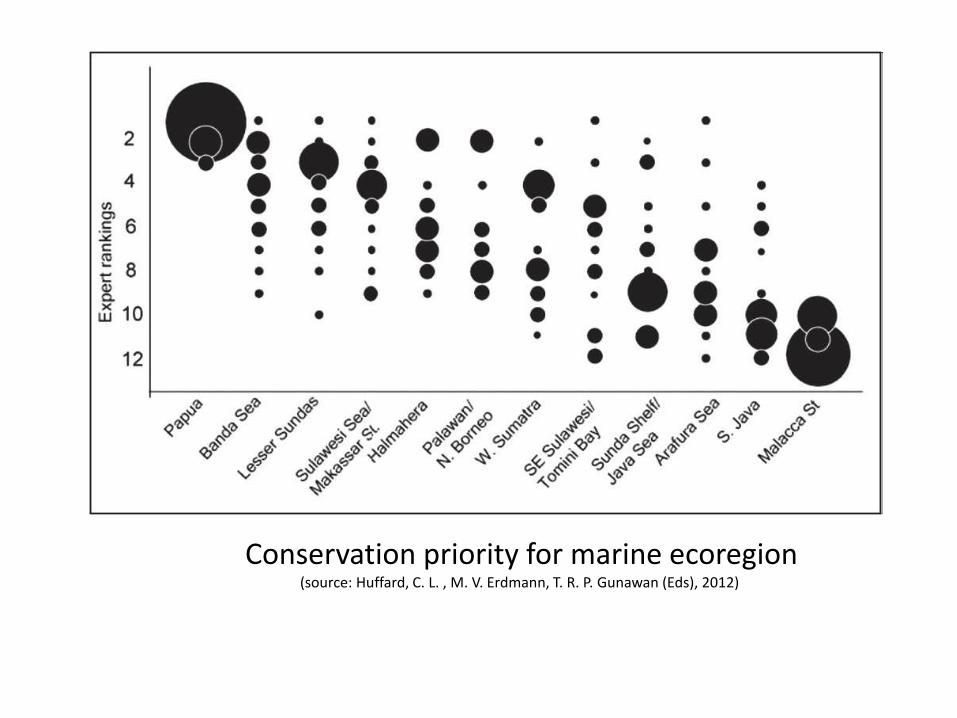
Figure XS2. Tally of expert rankings of conservation priority for marine ecoregions of Indonesia
based on biodiversity considerations, with an emphasis on irreplaceability and representativeness
criteria. Ecoregions are displayed on the X-axis from left to right in order of their final prioritization
rank. Size of circle corresponds with the number of votes for that rank.
Brief summary of rankings on a per-ecoregion basis is given below:
1. Papua was overwhelmingly ranked the top marine biodiversity conservation priority in Indone-
sia—ten of 16 experts ranked Papua number 1, while the remaining six ranked it either second
or third. Papua tops most counts of coral reef biodiversity and boasts numerous animals, habi-
tats, and genetic clades that are rare elsewhere in Indonesia, including 1) record numbers of
endemic fish, corals and stomatopods, 2) Sperm whale calving grounds, 3) the world’s largest
Pacific Leatherback turtle rookery, 4) major Green turtle rookeries, 5) resident Bryde’s whales
in Kaimana, and 6) healthy populations of Dugongs and Estuarine crocodiles. Low human
population density adds to the conservation potential for this area, though aligning forces of
exploitation intensify the urgency for marine conservation action in this region.
2. The Banda Sea ranks second for marine conservation priority in Indonesia based on its 1) high
diversity of coral reef species, 2) high reef habitat diversity including abundant nearshore yet
deep-sea habitats, which are otherwise rare throughout the world, 3) strategic role in connec-
tivity based on current patterns, 4) significant role in sea turtle life cycles, and 5) significance to
highly endangered oceanic cetaceans such as blue whales. As a very deep basin, the Banda Sea
has provided an important refuge for reefs during past sea level regressions, and may play a
similar role in the future of tropical marine species as global climate change heats up shallower
seas. Like Papua, human population density in the Banda Sea is low. However the Banda Sea is
considered to be heavily fished, a factor that threatens the attributes listed above.
Conservation priority for marine ecoregion (source: Huffard, C. L. , M. V. Erdmann, T. R. P. Gunawan (Eds), 2012)
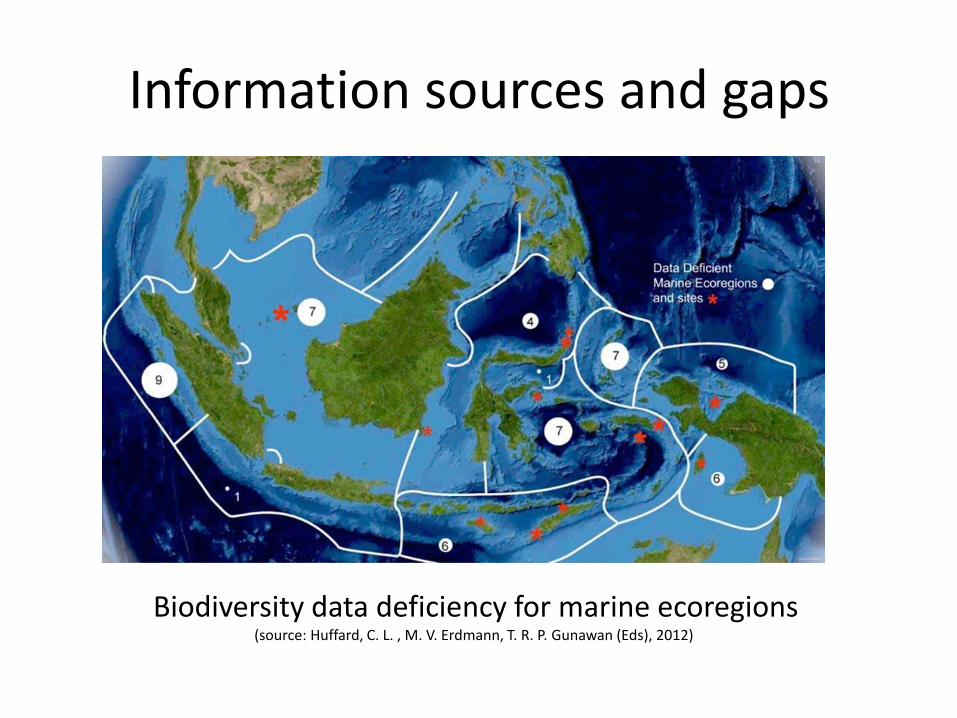
Information sources and gaps
80
Table 8. Marine ecoregions and specific sites within those ecoregions that were highlighted byrespondents as being data deficient.
Marine Ecoregion
Western Sumatra
Malacca Strait
Sunda Shelf/Java Sea
Southern Java
Palawan/Northern Borneo
Sulawesi Sea/Makassar Strait
Tomini Bay
Lesser Sundas
Banda Sea
Halmahera
Papua
Arafura Sea
Specific Sites Noted (number ofrespondents)
Natuna/Anambas (7)
Bunaken/Lembeh (2)
Southeast Kalimantan (1)
Talaud (1)
Sumba (1)
Savu Sea/Roti/Timor (5)
Alor (3)
Inner Banda Arc (5)
Outer Banda Arc (5)
Banggai Islands (1)
Cendrawasih Bay (4)
Aru Islands (1)
Number of Respondents Citing Ecoregion asData Deficient and in need of Survey Work
9
0
7
1
0
4
1
6
7
7
5
6
Figure 28. Relative biodiversity data deficiency for Indonesia’s twelve marine ecoregions. Relative size of
white circle (and number within) denotes number of experts suggesting the need for further research in this
ecoregion to address biodiversity data deficiencies. Red stars identify the location of specific sites within
ecoregions that were identified as being of interest for future survey work. This figure corresponds with
Table 8.
Biodiversity data deficiency for marine ecoregions (source: Huffard, C. L. , M. V. Erdmann, T. R. P. Gunawan (Eds), 2012)
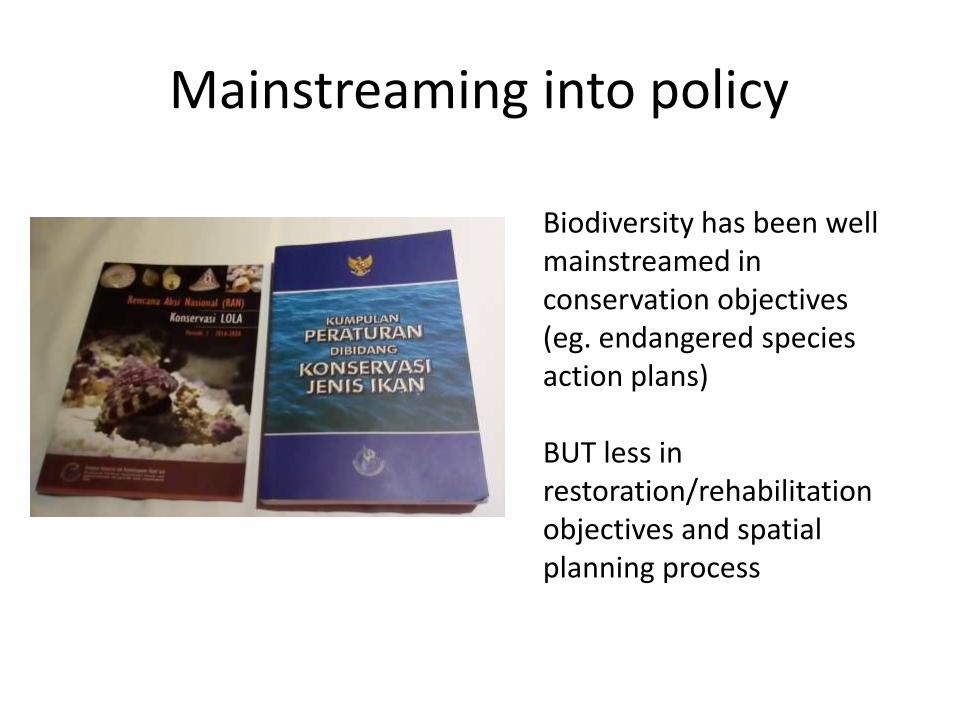
Mainstreaming into policy
Biodiversity has been well mainstreamed in conservation objectives (eg. endangered species action plans) BUT less in restoration/rehabilitation objectives and spatial planning process
6 - 26
unevenly distributed. Sixty percent of the effort is located in production forest areas
(limited, production, or conversion). Another 30% of the effort is located in protection
forests (i.e., areas that protect watershed and ecosystem functions). Ten percent of the
effort is located in conservation forests (protected areas). This allocation is consistent
with an emphasis on production and service provision from the national forests. A
biodiversity-oriented approach would yield a different distribution of rehabilitation
resources, more focused on conservation areas and protection forests as key habitat.
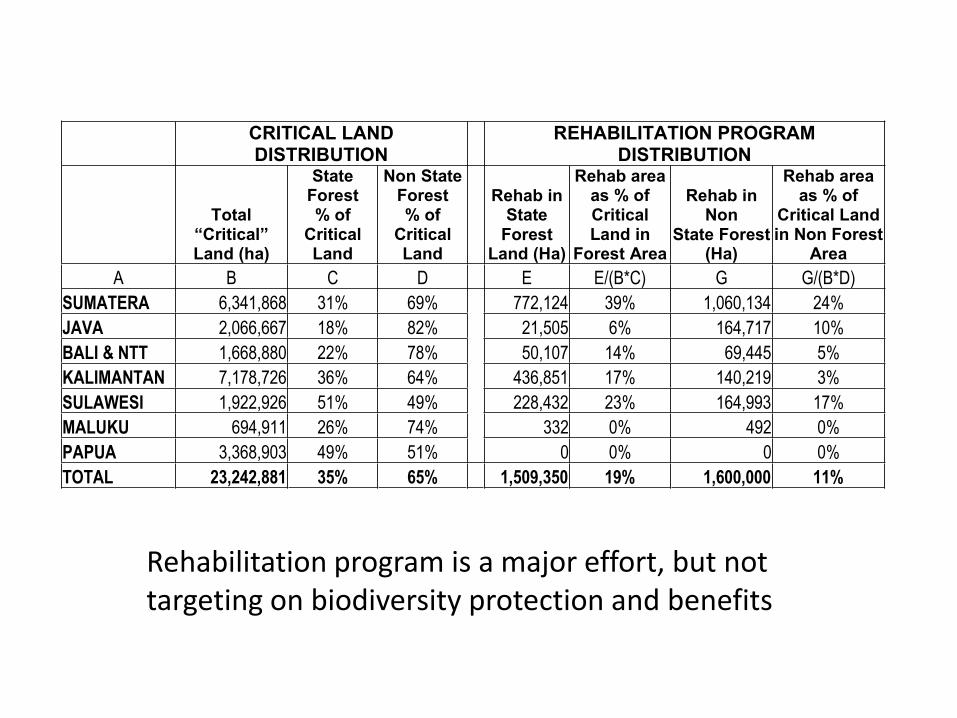
Table 6.7: Rehabilitation Efforts and Critical Lands Inside and Outside State
ForestCRITICAL LAND DISTRIBUTION
REHABILITATION PROGRAM DISTRIBUTION
Total “Critical”Land (ha)
StateForest % of
CriticalLand
Non State Forest % of
CriticalLand
Rehab in State
Forest Land (Ha)
Rehab area as % of CriticalLand in
Forest Area
Rehab in Non
State Forest (Ha)
Rehab area as % of
Critical Land in Non Forest
Area
A B C D E E/(B*C) G G/(B*D)
SUMATERA 6,341,868 31% 69% 772,124 39% 1,060,134 24%
JAVA 2,066,667 18% 82% 21,505 6% 164,717 10%
BALI & NTT 1,668,880 22% 78% 50,107 14% 69,445 5%
KALIMANTAN 7,178,726 36% 64% 436,851 17% 140,219 3%
SULAWESI 1,922,926 51% 49% 228,432 23% 164,993 17%
MALUKU 694,911 26% 74% 332 0% 492 0%
PAPUA 3,368,903 49% 51% 0 0% 0 0%
TOTAL 23,242,881 35% 65% 1,509,350 19% 1,600,000 11%
Summary. The GoI’s forest and watershed rehabilitation program is a major effort, but is
not focused on producing biodiversity protection and benefits. By focusing on critically
degraded forest areas, especially uplands and watershed areas, the program will help
toward restoring some habitat areas and ecosystem functions, with some positive
influence on biodiversity conservation. However, the program is limited in its reach and
is not targeted toward biodiversity conservation objectives. Additional efforts could be
designed to complement the national program in areas where it is working, or to
supplement it in areas where it is lacking. Relatively less effort is planned for Eastern
Indonesia and the smaller islands. Also, relatively more of the program’s resources are
focused inside the forest estate, while most of the critical lands are outside the forest
estate.
Rehabilitation program is a major effort, but not targeting on biodiversity protection and benefits
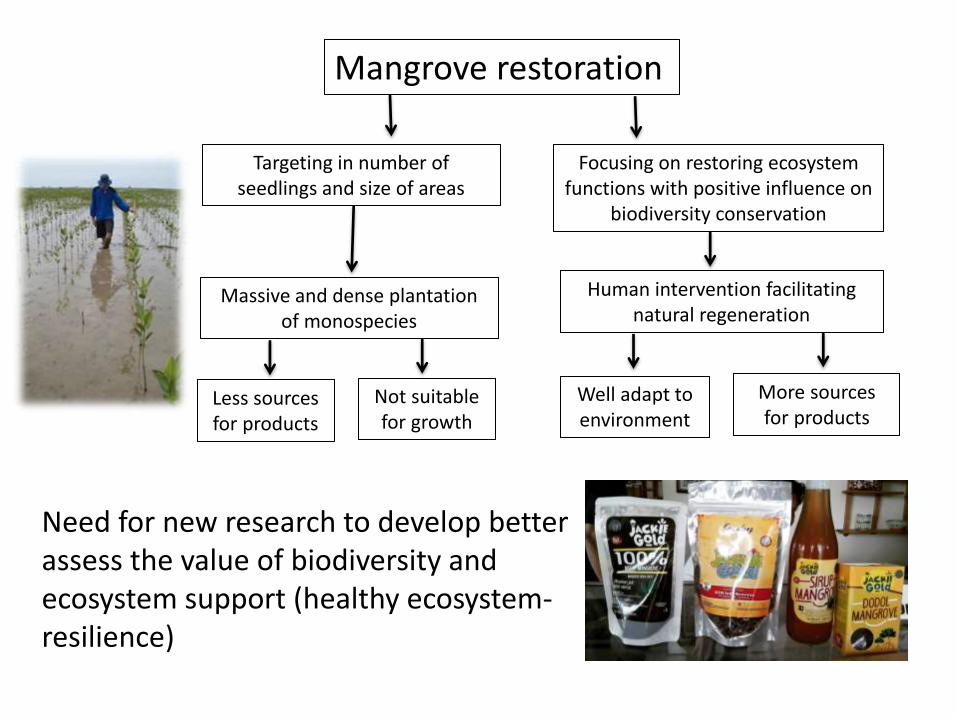
Mangrove restoration
Targeting in number of seedlings and size of areas
Massive and dense plantation of monospecies
Focusing on restoring ecosystem functions with positive influence on
biodiversity conservation
Human intervention facilitating natural regeneration
Well adapt to environment
More sources for products
Less sources for products
Not suitable for growth
Need for new research to develop better assess the value of biodiversity and ecosystem support (healthy ecosystem-resilience)