Embed Size (px)
Citation preview
BIODIVERSITY LOSS
Decline of the North American avifaunaKenneth V. Rosenberg1,2*, Adriaan M. Dokter1, Peter J. Blancher3, John R. Sauer4, Adam C. Smith5,Paul A. Smith3, Jessica C. Stanton6, Arvind Panjabi7, Laura Helft1, Michael Parr2, Peter P. Marra8†
Species extinctions have defined the global biodiversity crisis, but extinction begins with loss in abundanceof individuals that can result in compositional and functional changes of ecosystems. Using multiple andindependent monitoring networks, we report population losses across much of the North American avifaunaover 48 years, including once-common species and from most biomes. Integration of range-wide populationtrajectories and size estimates indicates a net loss approaching 3 billion birds, or 29% of 1970 abundance.A continent-wide weather radar network also reveals a similarly steep decline in biomass passage of migratingbirds over a recent 10-year period. This loss of bird abundance signals an urgent need to address threats toavert future avifaunal collapse and associated loss of ecosystem integrity, function, and services.
Slowing the loss of biodiversity is one ofthe defining environmental challenges ofthe 21st century (1–5). Habitat loss, cli-mate change, unregulated harvest, andother forms of human-caused mortality
(6, 7) have contributed to a thousandfold in-crease in global extinctions in theAnthropocenecompared to the presumed prehuman back-ground rate,withprofoundeffects on ecosystemfunctioning and services (8). The overwhelm-ing focus on species extinctions, however, hasunderestimated the extent and consequencesof biotic change, by ignoring the loss of abun-dance within still-common species and in ag-gregate across large species assemblages (2, 9).Declines in abundance can degrade ecosystemintegrity, reducing vital ecological, evolution-ary, economic, and social services that orga-nisms provide to their environment (8, 10–15).Given the current pace of global environmen-tal change, quantifying change in species abun-dances is essential to assess ecosystem impacts.Evaluating the magnitude of declines requireseffective long-term monitoring of populationsizes and trends, data that are rarely availablefor most taxa.Birds are excellent indicators of environ-
mental health and ecosystem integrity (16, 17),and our ability to monitor many species overvast spatial scales far exceeds that of any otheranimal group. We evaluated population changefor 529 species of birds in the continental
United States and Canada (76% of breedingspecies), drawing from multiple standardizedbird-monitoring datasets, some of which pro-vide close to 50 years of population data. Weintegrated range-wide estimates of popula-tion size and 48-year population trajectories,along with their associated uncertainty, toquantify net change in numbers of birds acrossthe avifauna over recent decades (18). We alsoused a network of 143 weather radars (NEXRAD)across the contiguous United States to estimatelong-term changes in nocturnal migratory pas-sage of avian biomass through the airspacein spring from 2007 to 2017. The continuousoperation and broad coverage of NEXRADprovide an automated and standardized mon-itoring tool with unrivaled temporal and spa-tial extent (19). Radar measures cumulativepassage across all nocturnally migrating spe-cies, many of which breed in areas north ofthe contiguous United States that are poorlymonitored by avian surveys. Radar thus ex-pands the area and the proportion of themigratory avifauna that is sampled relative toground surveys.Results from long-term surveys, accounting
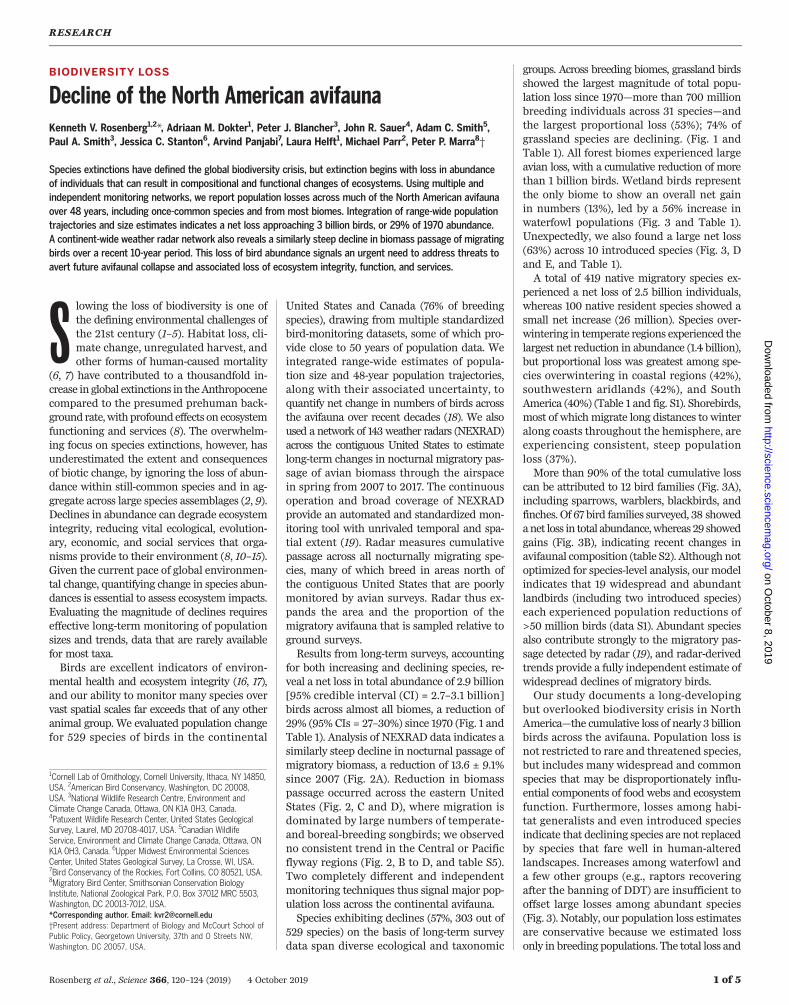
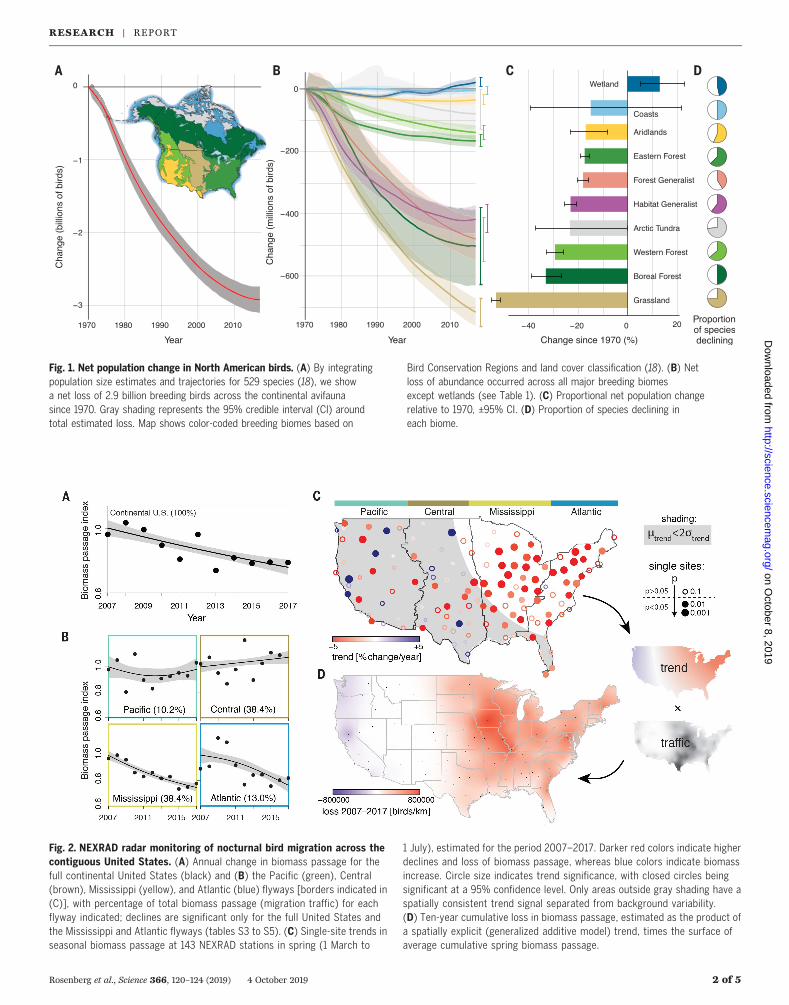
for both increasing and declining species, re-veal a net loss in total abundance of 2.9 billion[95% credible interval (CI) = 2.7–3.1 billion]birds across almost all biomes, a reduction of29% (95% CIs = 27–30%) since 1970 (Fig. 1 andTable 1). Analysis of NEXRAD data indicates asimilarly steep decline in nocturnal passage ofmigratory biomass, a reduction of 13.6 ± 9.1%since 2007 (Fig. 2A). Reduction in biomasspassage occurred across the eastern UnitedStates (Fig. 2, C and D), where migration isdominated by large numbers of temperate-and boreal-breeding songbirds; we observedno consistent trend in the Central or Pacificflyway regions (Fig. 2, B to D, and table S5).Two completely different and independentmonitoring techniques thus signal major pop-ulation loss across the continental avifauna.Species exhibiting declines (57%, 303 out of
529 species) on the basis of long-term surveydata span diverse ecological and taxonomic
groups. Across breeding biomes, grassland birdsshowed the largest magnitude of total popu-lation loss since 1970—more than 700 millionbreeding individuals across 31 species—andthe largest proportional loss (53%); 74% ofgrassland species are declining. (Fig. 1 andTable 1). All forest biomes experienced largeavian loss, with a cumulative reduction of morethan 1 billion birds. Wetland birds representthe only biome to show an overall net gainin numbers (13%), led by a 56% increase inwaterfowl populations (Fig. 3 and Table 1).Unexpectedly, we also found a large net loss(63%) across 10 introduced species (Fig. 3, Dand E, and Table 1).A total of 419 native migratory species ex-
perienced a net loss of 2.5 billion individuals,whereas 100 native resident species showed asmall net increase (26 million). Species over-wintering in temperate regions experienced thelargest net reduction in abundance (1.4 billion),but proportional loss was greatest among spe-cies overwintering in coastal regions (42%),southwestern aridlands (42%), and SouthAmerica (40%) (Table 1 and fig. S1). Shorebirds,most of whichmigrate long distances to winteralong coasts throughout the hemisphere, areexperiencing consistent, steep populationloss (37%).More than 90% of the total cumulative loss
can be attributed to 12 bird families (Fig. 3A),including sparrows, warblers, blackbirds, andfinches. Of 67 bird families surveyed, 38 showedanet loss in total abundance,whereas 29 showedgains (Fig. 3B), indicating recent changes inavifaunal composition (table S2). Although notoptimized for species-level analysis, our modelindicates that 19 widespread and abundantlandbirds (including two introduced species)each experienced population reductions of>50 million birds (data S1). Abundant speciesalso contribute strongly to the migratory pas-sage detected by radar (19), and radar-derivedtrends provide a fully independent estimate ofwidespread declines of migratory birds.Our study documents a long-developing
but overlooked biodiversity crisis in NorthAmerica—the cumulative loss of nearly 3 billionbirds across the avifauna. Population loss isnot restricted to rare and threatened species,but includes many widespread and commonspecies that may be disproportionately influ-ential components of food webs and ecosystemfunction. Furthermore, losses among habi-tat generalists and even introduced speciesindicate that declining species are not replacedby species that fare well in human-alteredlandscapes. Increases among waterfowl anda few other groups (e.g., raptors recoveringafter the banning of DDT) are insufficient tooffset large losses among abundant species(Fig. 3). Notably, our population loss estimatesare conservative because we estimated lossonly in breeding populations. The total loss and
RESEARCH
Rosenberg et al., Science 366, 120–124 (2019) 4 October 2019 1 of 5
1Cornell Lab of Ornithology, Cornell University, Ithaca, NY 14850,USA. 2American Bird Conservancy, Washington, DC 20008,USA. 3National Wildlife Research Centre, Environment andClimate Change Canada, Ottawa, ON K1A 0H3, Canada.4Patuxent Wildlife Research Center, United States GeologicalSurvey, Laurel, MD 20708-4017, USA. 5Canadian WildlifeService, Environment and Climate Change Canada, Ottawa, ONK1A 0H3, Canada. 6Upper Midwest Environmental SciencesCenter, United States Geological Survey, La Crosse, WI, USA.7Bird Conservancy of the Rockies, Fort Collins, CO 80521, USA.8Migratory Bird Center, Smithsonian Conservation BiologyInstitute, National Zoological Park, P.O. Box 37012 MRC 5503,Washington, DC 20013-7012, USA.*Corresponding author. Email: [email protected]†Present address: Department of Biology and McCourt School ofPublic Policy, Georgetown University, 37th and O Streets NW,Washington, DC 20057, USA.
on October 8, 2019
http://science.sciencem
ag.org/D
ownloaded from
Rosenberg et al., Science 366, 120–124 (2019) 4 October 2019 2 of 5
P
Fig. 1. Net population change in North American birds. (A) By integratingpopulation size estimates and trajectories for 529 species (18), we showa net loss of 2.9 billion breeding birds across the continental avifaunasince 1970. Gray shading represents the 95% credible interval (CI) aroundtotal estimated loss. Map shows color-coded breeding biomes based on
Bird Conservation Regions and land cover classification (18). (B) Netloss of abundance occurred across all major breeding biomesexcept wetlands (see Table 1). (C) Proportional net population changerelative to 1970, ±95% CI. (D) Proportion of species declining ineach biome.
Fig. 2. NEXRAD radar monitoring of nocturnal bird migration across thecontiguous United States. (A) Annual change in biomass passage for thefull continental United States (black) and (B) the Pacific (green), Central(brown), Mississippi (yellow), and Atlantic (blue) flyways [borders indicated in(C)], with percentage of total biomass passage (migration traffic) for eachflyway indicated; declines are significant only for the full United States andthe Mississippi and Atlantic flyways (tables S3 to S5). (C) Single-site trends inseasonal biomass passage at 143 NEXRAD stations in spring (1 March to
1 July), estimated for the period 2007–2017. Darker red colors indicate higherdeclines and loss of biomass passage, whereas blue colors indicate biomassincrease. Circle size indicates trend significance, with closed circles beingsignificant at a 95% confidence level. Only areas outside gray shading have aspatially consistent trend signal separated from background variability.(D) Ten-year cumulative loss in biomass passage, estimated as the product ofa spatially explicit (generalized additive model) trend, times the surface ofaverage cumulative spring biomass passage.
RESEARCH | REPORTon O
ctober 8, 2019
http://science.sciencemag.org/
Dow
nloaded from

impact on communities and ecosystems couldbe even higher outside the breeding season ifwe consider the amplifying effect of “missing”reproductive output from these lost breeders.Extinction of the passenger pigeon (Ectopistes
migratorius), once likely the most numerousbird on the planet, provides a poignant re-minder that even abundant species can goextinct rapidly. Systematic monitoring andattention paid to population declines couldhave alerted society to its pending extinction(20). Today, monitoring data suggest thatavian declines will likely continue withouttargeted conservation action, triggering addi-tional endangered species listings at tremen-dous financial and social cost. Moreover,because birds provide numerous benefits toecosystems (e.g., seed dispersal, pollination,pest control) and economies [47million peoplespend U.S.$9.3 billion per year through bird-related activities in the United States (21)],their population reductions and possible ex-tinctions will have severe direct and indirectconsequences (10, 22). Population declines can
be reversed, as evidenced by the exceptionalrecovery ofwaterfowl populations under adapt-ive harvest management (23) and the associ-ated allocation of billions of dollars devoted towetland protection and restoration, providinga model for proactive conservation in otherwidespread native habitats such as grasslands.Steep declines in North American bird pop-
ulations parallel patterns of avian declinesemerging globally (14, 15, 22, 24). In particu-lar, depletion of native grassland bird pop-ulations in North America, driven by habitatloss andmore toxic pesticide use in both breed-ing and wintering areas (25), mirrors loss offarmland birds throughout Europe and else-where (15). Even declines among introducedspecies match similar declines within thesesame species’ native ranges (26). Agriculturalintensification and urbanization have beensimilarly linked to declines in insect diversityand biomass (27), with cascading impacts onbirds and other consumers (24, 28, 29). Giventhat birds are one of the best monitored ani-mal groups, birds may also foreshadow amuch
larger problem, indicating similar or greaterlosses in other taxonomic groups (28, 30).Pervasiveness of avian loss across biomes
and bird families suggests multiple and inter-acting threats. Isolating spatiotemporal limitingfactors for individual species and populationswill require additional study, however, becausemigratory species with complex life historiesare in contact with many threats throughouttheir annual cycles. A focus on breeding sea-son biology hampers our ability to understandhow seasonal interactions drive populationchange (31), although recent continent-wideanalyses affirm the importance of events duringthe nonbreeding season (19, 32). Targetedresearch to identify limiting factors must becoupled with effective policies and societalchange that emphasize reducing threats tobreeding and nonbreeding habitats and min-imizing avoidable anthropogenic mortalityyear-round. Endangered species legislationand international treaties, such as the 1916Migratory Bird Treaty between Canada andthe United States, have prevented extinctions
Rosenberg et al., Science 366, 120–124 (2019) 4 October 2019 3 of 5
Fig. 3. Gains and losses across the North American avifauna over the pasthalf-century. (A) Bird families were categorized as having a net loss (red) orgain (blue). Total loss of 3.2 billion birds occurred across 38 families; each familywith losses greater than 50 million individuals is shown as a proportion oftotal loss, including two introduced families (gray). Swallows, nightjars, andswifts together show loss within the aerial insectivore guild. (B) Twenty-ninefamilies show a total gain of 250 million individual birds; the five families withgains greater than 15 million individuals are shown as a proportion of totalgain. Four families of raptors are shown as a single group. Note that combining
total gain and total loss yields a net loss of 2.9 billion birds across the entireavifauna. (C) For each individually represented family in (B) and (C), proportionalpopulation change within that family is shown. See table S2 for statistics oneach individual family. (D) Percentage population change among introducedand each of four management groups (18). A representative species fromeach group is shown (top to bottom, house sparrow, Passer domesticus;sanderling, Calidris alba; western meadowlark, Sturnella neglecta; green heron,Butorides virescens; and snow goose, Anser caerulescens). (E) Proportion ofspecies with declining trends.
RESEARCH | REPORTon O
ctober 8, 2019
http://science.sciencemag.org/
Dow
nloaded from
and promoted recovery of once-depleted birdspecies. History shows that conservation actionand legislation work. Our results signal anurgent need to address the ongoing threatsof habitat loss, agricultural intensification,coastal disturbance, and direct anthropogenicmortality, all exacerbated by climate change,to avert continued biodiversity loss and po-tential collapse of the continental avifauna.
REFERENCES AND NOTES
1. M. C. Urban, Science 348, 571–573 (2015).
2. R. Dirzo et al., Science 345, 401–406 (2014).
3. S. L. Pimm et al., Science 344, 1246752 (2014).
4. A. D. Barnosky et al., Nature 471, 51–57 (2011).5. W. Steffen, J. Crutzen, J. R. McNeill, Ambio 36, 614–621 (2007).
6. S. R. Loss, T. Will, P. P. Marra, Annu. Rev. Ecol. Evol. Syst. 46,99–120 (2015).
7. A. M. Calvert et al., Avian Conserv. Ecol. 8, art11 (2013).
8. D. U. Hooper et al., Nature 486, 105–108 (2012).
9. G. Ceballos, P. R. Ehrlich, R. Dirzo, Proc. Natl. Acad. Sci. U.S.A.114, E6089–E6096 (2017).
10. C. J. Whelan, Ç. H. Şekercioğlu, D. G. Wenny, J. Ornithol. 156(S1), 227–238 (2015).
11. M. Galetti et al., Science 340, 1086–1090 (2013).12. G. C. Daily, Ed., Nature’s Services: Societal Dependence
on Natural Ecosystems (Island Press, Washington,DC, 1997).
13. S. Bauer, B. J. Hoye, Science 344, 1242552 (2014).14. K. J. Gaston, R. A. Fuller, Trends Ecol. Evol. 23, 14–19
(2008).15. R. Inger et al., Ecol. Lett. 18, 28–36 (2015).16. M. L. Morrison, in Current Ornithology, R. F. Johnston, Ed.
(Springer US, Boston, MA, 1986; https://link.springer.com/10.1007/978-1-4615-6784-4_10), pp. 429–451.
17. J. Burger, M. Gochfeld, EcoHealth 1, 263–274 (2004).18. See supplementary materials.19. A. M. Dokter et al., Nat. Ecol. Evol. 2, 1603–1609
(2018).20. J. C. Stanton, Biol. Conserv. 180, 11–20 (2014).21. U.S. Department of the Interior, U.S. Fish and Wildlife Service,
and U.S. Department of Commerce, U.S. Census Bureau,
“National Survey of Fishing, Hunting, and Wildlife-AssociatedRecreation” (2016).
22. C. H. Sekercioğlu, G. C. Daily, P. R. Ehrlich, Proc. Natl. Acad.Sci. U.S.A. 101, 18042–18047 (2004).
23. J. D. Nichols, M. C. Runge, F. A. Johnson, B. K. Williams,J. Ornithol. 148 , 343–349 (2007).
24. C. A. Hallmann, R. P. B. Foppen, C. A. M. van Turnhout,H. de Kroon, E. Jongejans, Nature 511, 341–343 (2014).
25. R. L. Stanton, C. A. Morrissey, R. G. Clark, Agric. Ecosyst.Environ. 254, 244–254 (2018).
26. J. De Laet, J. D. Summers-Smith, J. Ornithol. 148 , 275–278(2007).
27. F. Sánchez-Bayo, K. A. G. Wyckhuys, Biol. Conserv. 232, 8–27(2019).
28. B. C. Lister, A. Garcia, Proc. Natl. Acad. Sci. U.S.A. 115,E10397–E10406 (2018).
29. D. L. Narango, D. W. Tallamy, P. P. Marra, Proc. Natl. Acad. Sci.U.S.A. 115, 11549–11554 (2018).
30. R. E. A. Almond, M. Grooten, “Living Planet Report - 2018:Aiming Higher” (WWF, Gland, Switzerland, 2018).
31. P. P. Marra, E. B. Cohen, S. R. Loss, J. E. Rutter, C. M. Tonra,Biol. Lett. 11, 20150552 (2015).
32. F. A. La Sorte et al., Glob. Change Biol. 23, 5284–5296 (2017).
Rosenberg et al., Science 366, 120–124 (2019) 4 October 2019 4 of 5
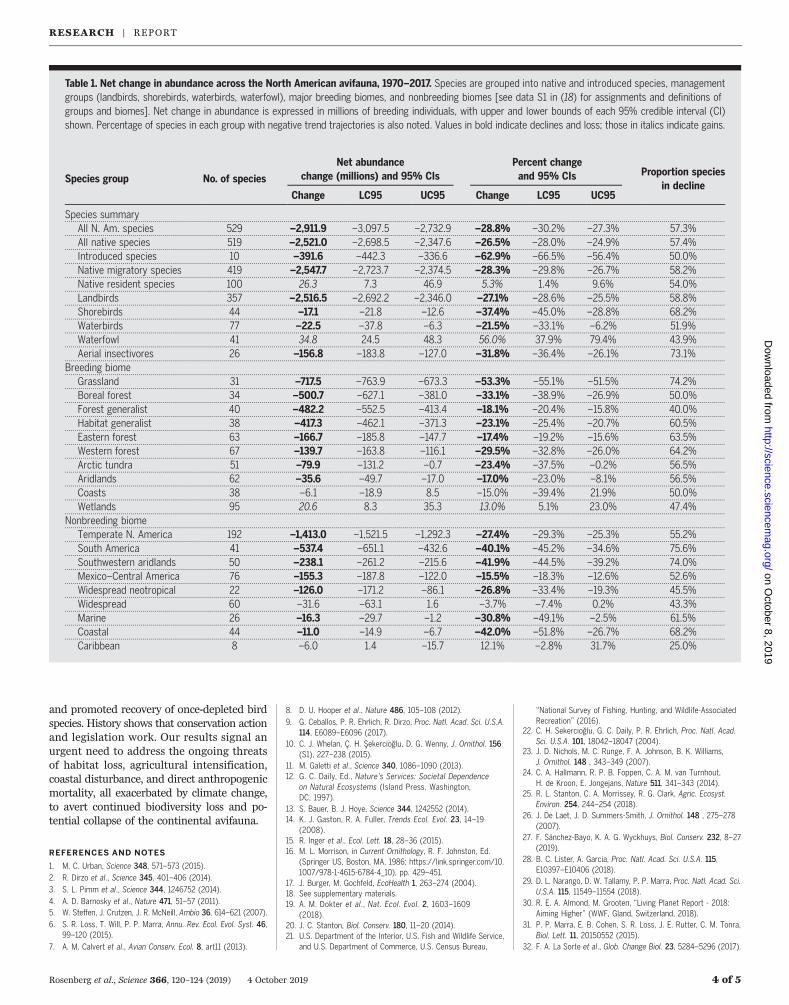
Table 1. Net change in abundance across the North American avifauna, 1970–2017. Species are grouped into native and introduced species, managementgroups (landbirds, shorebirds, waterbirds, waterfowl), major breeding biomes, and nonbreeding biomes [see data S1 in (18) for assignments and definitions ofgroups and biomes]. Net change in abundance is expressed in millions of breeding individuals, with upper and lower bounds of each 95% credible interval (CI)shown. Percentage of species in each group with negative trend trajectories is also noted. Values in bold indicate declines and loss; those in italics indicate gains.
Species group No. of species
Net abundancechange (millions) and 95% CIs
Percent changeand 95% CIs Proportion species
in declineChange LC95 UC95 Change LC95 UC95
Species summary.. .. ... ... .. ... .. ... ... .. ... ... .. ... .. ... ... .. ... ... .. ... ... .. ... .. ... ... .. ... ... .. ... .. ... ... .. ... ... .. ... ... .. ... .. ... ... .. ... ... .. ... .. ... ... .. ... ... .. ... ... .. ... .. ... ... .. ... ... .. ... .. ... ... .. ... ... .. ... ... .. ... .. ... ... .. ... ... .. ... .. ... ... .. ... ... .. ... ... .. ... .. ... ... .. ... ... .. ... .. ... ... .. ... ... .. ... ... .. ... .. ... ... .. ... ... .
All N. Am. species 529 –2,911.9 –3,097.5 –2,732.9 –28.8% –30.2% –27.3% 57.3%.. .. ... ... .. ... .. ... ... .. ... ... .. ... .. ... ... .. ... ... .. ... ... .. ... .. ... ... .. ... ... .. ... .. ... ... .. ... ... .. ... ... .. ... .. ... ... .. ... ... .. ... .. ... ... .. ... ... .. ... ... .. ... .. ... ... .. ... ... .. ... .. ... ... .. ... ... .. ... ... .. ... .. ... ... .. ... ... .. ... .. ... ... .. ... ... .. ... ... .. ... .. ... ... .. ... ... .. ... .. ... ... .. ... ... .. ... ... .. ... .. ... ... .. ... ... .
All native species 519 –2,521.0 –2,698.5 –2,347.6 –26.5% –28.0% –24.9% 57.4%.. .. ... ... .. ... .. ... ... .. ... ... .. ... .. ... ... .. ... ... .. ... ... .. ... .. ... ... .. ... ... .. ... .. ... ... .. ... ... .. ... ... .. ... .. ... ... .. ... ... .. ... .. ... ... .. ... ... .. ... ... .. ... .. ... ... .. ... ... .. ... .. ... ... .. ... ... .. ... ... .. ... .. ... ... .. ... ... .. ... .. ... ... .. ... ... .. ... ... .. ... .. ... ... .. ... ... .. ... .. ... ... .. ... ... .. ... ... .. ... .. ... ... .. ... ... .
Introduced species 10 –391.6 –442.3 –336.6 –62.9% –66.5% –56.4% 50.0%.. .. ... ... .. ... .. ... ... .. ... ... .. ... .. ... ... .. ... ... .. ... ... .. ... .. ... ... .. ... ... .. ... .. ... ... .. ... ... .. ... ... .. ... .. ... ... .. ... ... .. ... .. ... ... .. ... ... .. ... ... .. ... .. ... ... .. ... ... .. ... .. ... ... .. ... ... .. ... ... .. ... .. ... ... .. ... ... .. ... .. ... ... .. ... ... .. ... ... .. ... .. ... ... .. ... ... .. ... .. ... ... .. ... ... .. ... ... .. ... .. ... ... .. ... ... .
Native migratory species 419 –2,547.7 –2,723.7 –2,374.5 –28.3% –29.8% –26.7% 58.2%.. .. ... ... .. ... .. ... ... .. ... ... .. ... .. ... ... .. ... ... .. ... ... .. ... .. ... ... .. ... ... .. ... .. ... ... .. ... ... .. ... ... .. ... .. ... ... .. ... ... .. ... .. ... ... .. ... ... .. ... ... .. ... .. ... ... .. ... ... .. ... .. ... ... .. ... ... .. ... ... .. ... .. ... ... .. ... ... .. ... .. ... ... .. ... ... .. ... ... .. ... .. ... ... .. ... ... .. ... .. ... ... .. ... ... .. ... ... .. ... .. ... ... .. ... ... .
Native resident species 100 26.3 7.3 46.9 5.3% 1.4% 9.6% 54.0%.. .. ... ... .. ... .. ... ... .. ... ... .. ... .. ... ... .. ... ... .. ... ... .. ... .. ... ... .. ... ... .. ... .. ... ... .. ... ... .. ... ... .. ... .. ... ... .. ... ... .. ... .. ... ... .. ... ... .. ... ... .. ... .. ... ... .. ... ... .. ... .. ... ... .. ... ... .. ... ... .. ... .. ... ... .. ... ... .. ... .. ... ... .. ... ... .. ... ... .. ... .. ... ... .. ... ... .. ... .. ... ... .. ... ... .. ... ... .. ... .. ... ... .. ... ... .
Landbirds 357 –2,516.5 –2,692.2 –2,346.0 –27.1% –28.6% –25.5% 58.8%.. .. ... ... .. ... .. ... ... .. ... ... .. ... .. ... ... .. ... ... .. ... ... .. ... .. ... ... .. ... ... .. ... .. ... ... .. ... ... .. ... ... .. ... .. ... ... .. ... ... .. ... .. ... ... .. ... ... .. ... ... .. ... .. ... ... .. ... ... .. ... .. ... ... .. ... ... .. ... ... .. ... .. ... ... .. ... ... .. ... .. ... ... .. ... ... .. ... ... .. ... .. ... ... .. ... ... .. ... .. ... ... .. ... ... .. ... ... .. ... .. ... ... .. ... ... .
Shorebirds 44 –17.1 –21.8 –12.6 –37.4% –45.0% –28.8% 68.2%.. .. ... ... .. ... .. ... ... .. ... ... .. ... .. ... ... .. ... ... .. ... ... .. ... .. ... ... .. ... ... .. ... .. ... ... .. ... ... .. ... ... .. ... .. ... ... .. ... ... .. ... .. ... ... .. ... ... .. ... ... .. ... .. ... ... .. ... ... .. ... .. ... ... .. ... ... .. ... ... .. ... .. ... ... .. ... ... .. ... .. ... ... .. ... ... .. ... ... .. ... .. ... ... .. ... ... .. ... .. ... ... .. ... ... .. ... ... .. ... .. ... ... .. ... ... .
Waterbirds 77 –22.5 –37.8 –6.3 –21.5% –33.1% –6.2% 51.9%.. .. ... ... .. ... .. ... ... .. ... ... .. ... .. ... ... .. ... ... .. ... ... .. ... .. ... ... .. ... ... .. ... .. ... ... .. ... ... .. ... ... .. ... .. ... ... .. ... ... .. ... .. ... ... .. ... ... .. ... ... .. ... .. ... ... .. ... ... .. ... .. ... ... .. ... ... .. ... ... .. ... .. ... ... .. ... ... .. ... .. ... ... .. ... ... .. ... ... .. ... .. ... ... .. ... ... .. ... .. ... ... .. ... ... .. ... ... .. ... .. ... ... .. ... ... .
Waterfowl 41 34.8 24.5 48.3 56.0% 37.9% 79.4% 43.9%.. .. ... ... .. ... .. ... ... .. ... ... .. ... .. ... ... .. ... ... .. ... ... .. ... .. ... ... .. ... ... .. ... .. ... ... .. ... ... .. ... ... .. ... .. ... ... .. ... ... .. ... .. ... ... .. ... ... .. ... ... .. ... .. ... ... .. ... ... .. ... .. ... ... .. ... ... .. ... ... .. ... .. ... ... .. ... ... .. ... .. ... ... .. ... ... .. ... ... .. ... .. ... ... .. ... ... .. ... .. ... ... .. ... ... .. ... ... .. ... .. ... ... .. ... ... .
Aerial insectivores 26 –156.8 –183.8 –127.0 –31.8% –36.4% –26.1% 73.1%.. .. ... ... .. ... .. ... ... .. ... ... .. ... .. ... ... .. ... ... .. ... ... .. ... .. ... ... .. ... ... .. ... .. ... ... .. ... ... .. ... ... .. ... .. ... ... .. ... ... .. ... .. ... ... .. ... ... .. ... ... .. ... .. ... ... .. ... ... .. ... .. ... ... .. ... ... .. ... ... .. ... .. ... ... .. ... ... .. ... .. ... ... .. ... ... .. ... ... .. ... .. ... ... .. ... ... .. ... .. ... ... .. ... ... .. ... ... .. ... .. ... ... .. ... ... .
Breeding biome.. .. ... ... .. ... .. ... ... .. ... ... .. ... .. ... ... .. ... ... .. ... ... .. ... .. ... ... .. ... ... .. ... .. ... ... .. ... ... .. ... ... .. ... .. ... ... .. ... ... .. ... .. ... ... .. ... ... .. ... ... .. ... .. ... ... .. ... ... .. ... .. ... ... .. ... ... .. ... ... .. ... .. ... ... .. ... ... .. ... .. ... ... .. ... ... .. ... ... .. ... .. ... ... .. ... ... .. ... .. ... ... .. ... ... .. ... ... .. ... .. ... ... .. ... ... .
Grassland 31 –717.5 –763.9 –673.3 –53.3% –55.1% –51.5% 74.2%.. .. ... ... .. ... .. ... ... .. ... ... .. ... .. ... ... .. ... ... .. ... ... .. ... .. ... ... .. ... ... .. ... .. ... ... .. ... ... .. ... ... .. ... .. ... ... .. ... ... .. ... .. ... ... .. ... ... .. ... ... .. ... .. ... ... .. ... ... .. ... .. ... ... .. ... ... .. ... ... .. ... .. ... ... .. ... ... .. ... .. ... ... .. ... ... .. ... ... .. ... .. ... ... .. ... ... .. ... .. ... ... .. ... ... .. ... ... .. ... .. ... ... .. ... ... .
Boreal forest 34 –500.7 –627.1 –381.0 –33.1% –38.9% –26.9% 50.0%.. .. ... ... .. ... .. ... ... .. ... ... .. ... .. ... ... .. ... ... .. ... ... .. ... .. ... ... .. ... ... .. ... .. ... ... .. ... ... .. ... ... .. ... .. ... ... .. ... ... .. ... .. ... ... .. ... ... .. ... ... .. ... .. ... ... .. ... ... .. ... .. ... ... .. ... ... .. ... ... .. ... .. ... ... .. ... ... .. ... .. ... ... .. ... ... .. ... ... .. ... .. ... ... .. ... ... .. ... .. ... ... .. ... ... .. ... ... .. ... .. ... ... .. ... ... .
Forest generalist 40 –482.2 –552.5 –413.4 –18.1% –20.4% –15.8% 40.0%.. .. ... ... .. ... .. ... ... .. ... ... .. ... .. ... ... .. ... ... .. ... ... .. ... .. ... ... .. ... ... .. ... .. ... ... .. ... ... .. ... ... .. ... .. ... ... .. ... ... .. ... .. ... ... .. ... ... .. ... ... .. ... .. ... ... .. ... ... .. ... .. ... ... .. ... ... .. ... ... .. ... .. ... ... .. ... ... .. ... .. ... ... .. ... ... .. ... ... .. ... .. ... ... .. ... ... .. ... .. ... ... .. ... ... .. ... ... .. ... .. ... ... .. ... ... .
Habitat generalist 38 –417.3 –462.1 –371.3 –23.1% –25.4% –20.7% 60.5%.. .. ... ... .. ... .. ... ... .. ... ... .. ... .. ... ... .. ... ... .. ... ... .. ... .. ... ... .. ... ... .. ... .. ... ... .. ... ... .. ... ... .. ... .. ... ... .. ... ... .. ... .. ... ... .. ... ... .. ... ... .. ... .. ... ... .. ... ... .. ... .. ... ... .. ... ... .. ... ... .. ... .. ... ... .. ... ... .. ... .. ... ... .. ... ... .. ... ... .. ... .. ... ... .. ... ... .. ... .. ... ... .. ... ... .. ... ... .. ... .. ... ... .. ... ... .
Eastern forest 63 –166.7 –185.8 –147.7 –17.4% –19.2% –15.6% 63.5%.. .. ... ... .. ... .. ... ... .. ... ... .. ... .. ... ... .. ... ... .. ... ... .. ... .. ... ... .. ... ... .. ... .. ... ... .. ... ... .. ... ... .. ... .. ... ... .. ... ... .. ... .. ... ... .. ... ... .. ... ... .. ... .. ... ... .. ... ... .. ... .. ... ... .. ... ... .. ... ... .. ... .. ... ... .. ... ... .. ... .. ... ... .. ... ... .. ... ... .. ... .. ... ... .. ... ... .. ... .. ... ... .. ... ... .. ... ... .. ... .. ... ... .. ... ... .
Western forest 67 –139.7 –163.8 –116.1 –29.5% –32.8% –26.0% 64.2%.. .. ... ... .. ... .. ... ... .. ... ... .. ... .. ... ... .. ... ... .. ... ... .. ... .. ... ... .. ... ... .. ... .. ... ... .. ... ... .. ... ... .. ... .. ... ... .. ... ... .. ... .. ... ... .. ... ... .. ... ... .. ... .. ... ... .. ... ... .. ... .. ... ... .. ... ... .. ... ... .. ... .. ... ... .. ... ... .. ... .. ... ... .. ... ... .. ... ... .. ... .. ... ... .. ... ... .. ... .. ... ... .. ... ... .. ... ... .. ... .. ... ... .. ... ... .
Arctic tundra 51 –79.9 –131.2 –0.7 –23.4% –37.5% –0.2% 56.5%.. .. ... ... .. ... .. ... ... .. ... ... .. ... .. ... ... .. ... ... .. ... ... .. ... .. ... ... .. ... ... .. ... .. ... ... .. ... ... .. ... ... .. ... .. ... ... .. ... ... .. ... .. ... ... .. ... ... .. ... ... .. ... .. ... ... .. ... ... .. ... .. ... ... .. ... ... .. ... ... .. ... .. ... ... .. ... ... .. ... .. ... ... .. ... ... .. ... ... .. ... .. ... ... .. ... ... .. ... .. ... ... .. ... ... .. ... ... .. ... .. ... ... .. ... ... .
Aridlands 62 –35.6 –49.7 –17.0 –17.0% –23.0% –8.1% 56.5%.. .. ... ... .. ... .. ... ... .. ... ... .. ... .. ... ... .. ... ... .. ... ... .. ... .. ... ... .. ... ... .. ... .. ... ... .. ... ... .. ... ... .. ... .. ... ... .. ... ... .. ... .. ... ... .. ... ... .. ... ... .. ... .. ... ... .. ... ... .. ... .. ... ... .. ... ... .. ... ... .. ... .. ... ... .. ... ... .. ... .. ... ... .. ... ... .. ... ... .. ... .. ... ... .. ... ... .. ... .. ... ... .. ... ... .. ... ... .. ... .. ... ... .. ... ... .
Coasts 38 –6.1 –18.9 8.5 –15.0% –39.4% 21.9% 50.0%.. .. ... ... .. ... .. ... ... .. ... ... .. ... .. ... ... .. ... ... .. ... ... .. ... .. ... ... .. ... ... .. ... .. ... ... .. ... ... .. ... ... .. ... .. ... ... .. ... ... .. ... .. ... ... .. ... ... .. ... ... .. ... .. ... ... .. ... ... .. ... .. ... ... .. ... ... .. ... ... .. ... .. ... ... .. ... ... .. ... .. ... ... .. ... ... .. ... ... .. ... .. ... ... .. ... ... .. ... .. ... ... .. ... ... .. ... ... .. ... .. ... ... .. ... ... .
Wetlands 95 20.6 8.3 35.3 13.0% 5.1% 23.0% 47.4%.. .. ... ... .. ... .. ... ... .. ... ... .. ... .. ... ... .. ... ... .. ... ... .. ... .. ... ... .. ... ... .. ... .. ... ... .. ... ... .. ... ... .. ... .. ... ... .. ... ... .. ... .. ... ... .. ... ... .. ... ... .. ... .. ... ... .. ... ... .. ... .. ... ... .. ... ... .. ... ... .. ... .. ... ... .. ... ... .. ... .. ... ... .. ... ... .. ... ... .. ... .. ... ... .. ... ... .. ... .. ... ... .. ... ... .. ... ... .. ... .. ... ... .. ... ... .
Nonbreeding biome.. .. ... ... .. ... .. ... ... .. ... ... .. ... .. ... ... .. ... ... .. ... ... .. ... .. ... ... .. ... ... .. ... .. ... ... .. ... ... .. ... ... .. ... .. ... ... .. ... ... .. ... .. ... ... .. ... ... .. ... ... .. ... .. ... ... .. ... ... .. ... .. ... ... .. ... ... .. ... ... .. ... .. ... ... .. ... ... .. ... .. ... ... .. ... ... .. ... ... .. ... .. ... ... .. ... ... .. ... .. ... ... .. ... ... .. ... ... .. ... .. ... ... .. ... ... .
Temperate N. America 192 –1,413.0 –1,521.5 –1,292.3 –27.4% –29.3% –25.3% 55.2%.. .. ... ... .. ... .. ... ... .. ... ... .. ... .. ... ... .. ... ... .. ... ... .. ... .. ... ... .. ... ... .. ... .. ... ... .. ... ... .. ... ... .. ... .. ... ... .. ... ... .. ... .. ... ... .. ... ... .. ... ... .. ... .. ... ... .. ... ... .. ... .. ... ... .. ... ... .. ... ... .. ... .. ... ... .. ... ... .. ... .. ... ... .. ... ... .. ... ... .. ... .. ... ... .. ... ... .. ... .. ... ... .. ... ... .. ... ... .. ... .. ... ... .. ... ... .
South America 41 –537.4 –651.1 –432.6 –40.1% –45.2% –34.6% 75.6%.. .. ... ... .. ... .. ... ... .. ... ... .. ... .. ... ... .. ... ... .. ... ... .. ... .. ... ... .. ... ... .. ... .. ... ... .. ... ... .. ... ... .. ... .. ... ... .. ... ... .. ... .. ... ... .. ... ... .. ... ... .. ... .. ... ... .. ... ... .. ... .. ... ... .. ... ... .. ... ... .. ... .. ... ... .. ... ... .. ... .. ... ... .. ... ... .. ... ... .. ... .. ... ... .. ... ... .. ... .. ... ... .. ... ... .. ... ... .. ... .. ... ... .. ... ... .
Southwestern aridlands 50 –238.1 –261.2 –215.6 –41.9% –44.5% –39.2% 74.0%.. .. ... ... .. ... .. ... ... .. ... ... .. ... .. ... ... .. ... ... .. ... ... .. ... .. ... ... .. ... ... .. ... .. ... ... .. ... ... .. ... ... .. ... .. ... ... .. ... ... .. ... .. ... ... .. ... ... .. ... ... .. ... .. ... ... .. ... ... .. ... .. ... ... .. ... ... .. ... ... .. ... .. ... ... .. ... ... .. ... .. ... ... .. ... ... .. ... ... .. ... .. ... ... .. ... ... .. ... .. ... ... .. ... ... .. ... ... .. ... .. ... ... .. ... ... .
Mexico–Central America 76 –155.3 –187.8 –122.0 –15.5% –18.3% –12.6% 52.6%.. .. ... ... .. ... .. ... ... .. ... ... .. ... .. ... ... .. ... ... .. ... ... .. ... .. ... ... .. ... ... .. ... .. ... ... .. ... ... .. ... ... .. ... .. ... ... .. ... ... .. ... .. ... ... .. ... ... .. ... ... .. ... .. ... ... .. ... ... .. ... .. ... ... .. ... ... .. ... ... .. ... .. ... ... .. ... ... .. ... .. ... ... .. ... ... .. ... ... .. ... .. ... ... .. ... ... .. ... .. ... ... .. ... ... .. ... ... .. ... .. ... ... .. ... ... .
Widespread neotropical 22 –126.0 –171.2 –86.1 –26.8% –33.4% –19.3% 45.5%.. .. ... ... .. ... .. ... ... .. ... ... .. ... .. ... ... .. ... ... .. ... ... .. ... .. ... ... .. ... ... .. ... .. ... ... .. ... ... .. ... ... .. ... .. ... ... .. ... ... .. ... .. ... ... .. ... ... .. ... ... .. ... .. ... ... .. ... ... .. ... .. ... ... .. ... ... .. ... ... .. ... .. ... ... .. ... ... .. ... .. ... ... .. ... ... .. ... ... .. ... .. ... ... .. ... ... .. ... .. ... ... .. ... ... .. ... ... .. ... .. ... ... .. ... ... .
Widespread 60 –31.6 –63.1 1.6 –3.7% –7.4% 0.2% 43.3%.. .. ... ... .. ... .. ... ... .. ... ... .. ... .. ... ... .. ... ... .. ... ... .. ... .. ... ... .. ... ... .. ... .. ... ... .. ... ... .. ... ... .. ... .. ... ... .. ... ... .. ... .. ... ... .. ... ... .. ... ... .. ... .. ... ... .. ... ... .. ... .. ... ... .. ... ... .. ... ... .. ... .. ... ... .. ... ... .. ... .. ... ... .. ... ... .. ... ... .. ... .. ... ... .. ... ... .. ... .. ... ... .. ... ... .. ... ... .. ... .. ... ... .. ... ... .
Marine 26 –16.3 –29.7 –1.2 –30.8% –49.1% –2.5% 61.5%.. .. ... ... .. ... .. ... ... .. ... ... .. ... .. ... ... .. ... ... .. ... ... .. ... .. ... ... .. ... ... .. ... .. ... ... .. ... ... .. ... ... .. ... .. ... ... .. ... ... .. ... .. ... ... .. ... ... .. ... ... .. ... .. ... ... .. ... ... .. ... .. ... ... .. ... ... .. ... ... .. ... .. ... ... .. ... ... .. ... .. ... ... .. ... ... .. ... ... .. ... .. ... ... .. ... ... .. ... .. ... ... .. ... ... .. ... ... .. ... .. ... ... .. ... ... .
Coastal 44 –11.0 –14.9 –6.7 –42.0% –51.8% –26.7% 68.2%.. .. ... ... .. ... .. ... ... .. ... ... .. ... .. ... ... .. ... ... .. ... ... .. ... .. ... ... .. ... ... .. ... .. ... ... .. ... ... .. ... ... .. ... .. ... ... .. ... ... .. ... .. ... ... .. ... ... .. ... ... .. ... .. ... ... .. ... ... .. ... .. ... ... .. ... ... .. ... ... .. ... .. ... ... .. ... ... .. ... .. ... ... .. ... ... .. ... ... .. ... .. ... ... .. ... ... .. ... .. ... ... .. ... ... .. ... ... .. ... .. ... ... .. ... ... .
Caribbean 8 –6.0 1.4 –15.7 12.1% –2.8% 31.7% 25.0%.. .. ... ... .. ... .. ... ... .. ... ... .. ... .. ... ... .. ... ... .. ... ... .. ... .. ... ... .. ... ... .. ... .. ... ... .. ... ... .. ... ... .. ... .. ... ... .. ... ... .. ... .. ... ... .. ... ... .. ... ... .. ... .. ... ... .. ... ... .. ... .. ... ... .. ... ... .. ... ... .. ... .. ... ... .. ... ... .. ... .. ... ... .. ... ... .. ... ... .. ... .. ... ... .. ... ... .. ... .. ... ... .. ... ... .. ... ... .. ... .. ... ... .. ... ... .
RESEARCH | REPORTon O
ctober 8, 2019
http://science.sciencemag.org/
Dow
nloaded from
33. A. C. Smith, AdamCSmithCWS/Estimating_Change_in_NorthAmerican_Birds, Zenodo (2019);https://doi.org/10.5281/zenodo.3218403.
34. A. M. Dokter, L. Veen, J. H. Spaaks, adokter/vol2bird: vol2bird,Version 0.4.0, Zenodo (2019); https://doi.org/10.5281/zenodo.3369999.
35. A. M. Dokter, S. Van Hoey, P. Desmet, adokter/bioRad: bioRad,Version 0.4.0, Zenodo (2019); https://doi.org/10.5281/zenodo.3370005.
ACKNOWLEDGMENTS
This paper is a contribution of The Partners in Flight InternationalScience Committee and the American Ornithologist SocietyConservation Committee, and the study benefited from manydiscussions with these groups. S. Bessinger, J. Fitzpatrick, S. Loss,T. Scott Sillett, W. Hochachka, D. Fink, S. Kelling, V. Ruiz-Gutierrez,O. Robinson, E. Miller, A. Rodewald, and three anonymous
reviewers made suggestions to improve the paper. J. Ditner andM. Strimas-Mackey helped with figures and graphics. T. Meehanprovided an analysis of trends from National Audubon’s ChristmasBird Count. We thank the hundreds of volunteer citizen-scientistswho contributed to long-term bird-monitoring programs in NorthAmerica and the institutions that manage these programs. Photosin Fig. 3 are from Macaulay Library, Cornell Lab of Ornithology.Funding: NSF LTREB DEB1242584 to P.P.M.; AWS Cloud Creditsfor Research, NSF ABI Innovation DBI-1661259, and NSF ICER1927743 to A.M.D. Author contributions: All authors conceived ofthe idea for the paper; A.C.S., P.J.B., A.M.D., J.R.S., P.A.S., andJ.C.S. conducted analyses; K.V.R., A.M.D., and P.P.M. primarilywrote the paper, although all authors contributed to the finalmanuscript. Competing interests: M.P. is president, and amember of the board of directors, of the American BirdConservancy. All remaining authors declare no competinginterests. Data and materials availability: All data and software
are archived and available on Zenodo (33–35) and willbe published in future versions of the Avian ConservationAssessment Database (http://pif.birdconservancy.org/ACAD/).
SUPPLEMENTARY MATERIALS
science.sciencemag.org/content/366/6461/120/suppl/DC1Materials and MethodsFigs. S1 to S7Tables S1 to S5Databases S1 and S2References (36–101)
20 November 2018; resubmitted 23 May 2019Accepted 5 September 2019Published online 19 September 201910.1126/science.aaw1313
Rosenberg et al., Science 366, 120–124 (2019) 4 October 2019 5 of 5
RESEARCH | REPORTon O
ctober 8, 2019
http://science.sciencemag.org/
Dow
nloaded from

Decline of the North American avifauna
Stanton, Arvind Panjabi, Laura Helft, Michael Parr and Peter P. MarraKenneth V. Rosenberg, Adriaan M. Dokter, Peter J. Blancher, John R. Sauer, Adam C. Smith, Paul A. Smith, Jessica C.
originally published online September 19, 2019DOI: 10.1126/science.aaw1313 (6461), 120-124.366Science
, this issue p. 120Scienceof birds and native ecosystems on which they depend.implications for ecosystem integrity, the conservation of wildlife more broadly, and policies associated with the protection
those once considered common and wide-spread are also diminished. These results have major−−threatened species breeding individuals across a wide range of species and habitats. They show that declines are not restricted to rare and
report wide-spread population declines of birds over the past half-century, resulting in the cumulative loss of billions of et al.gathered over many decades in many parts of the world. Drawing on such data for North America, Rosenberg
Because birds are conspicuous and easy to identify and count, reliable records of their occurrence have beenStaggering decline of bird populations
ARTICLE TOOLS http://science.sciencemag.org/content/366/6461/120
MATERIALSSUPPLEMENTARY http://science.sciencemag.org/content/suppl/2019/09/18/science.aaw1313.DC1
CONTENTRELATED http://science.sciencemag.org/content/sci/365/6459/1228.full
REFERENCES
http://science.sciencemag.org/content/366/6461/120#BIBLThis article cites 76 articles, 10 of which you can access for free
PERMISSIONS http://www.sciencemag.org/help/reprints-and-permissions
Terms of ServiceUse of this article is subject to the
is a registered trademark of AAAS.ScienceScience, 1200 New York Avenue NW, Washington, DC 20005. The title (print ISSN 0036-8075; online ISSN 1095-9203) is published by the American Association for the Advancement ofScience
Science. No claim to original U.S. Government WorksCopyright © 2019 The Authors, some rights reserved; exclusive licensee American Association for the Advancement of
on October 8, 2019
http://science.sciencem
ag.org/D
ownloaded from