Embed Size (px)
Citation preview

sustainability
Article
Biodiversity Protection through Networks ofVoluntary Sustainability Standard Organizations?
Luc Fransen 1,*, Jelmer Schalk 2 , Marcel Kok 3, Vivek Voora 4 , Jason Potts 4,†, Max Joosten 5,Philip Schleifer 1 and Graeme Auld 6
1 Department Political Science, University of Amsterdam, P.O. Box 15578, 1001 NB Amsterdam,The Netherlands; [email protected]
2 Institute of Public Administration, Leiden University, 2511 DP The Hague, The Netherlands;[email protected]
3 The Netherlands Environmental Assessment Agency (Planbureau voor de Leefomgeving), P.O. Box 30315,2500 GH The Hague, The Netherlands; [email protected]
4 International Institute for Sustainable Development, International Environment House 29 Chemin deBalexert, 1219 Châtelaine, Geneva, Switzerland; [email protected]
5 Department of Political Science & International Relations, University of Geneva, 24 rue du Général-Dufour,1211 Genève, Switzerland; [email protected]
6 School of Public Policy and Administration, Carleton University, 1125 Colonel by Drive, Ottawa,ON K1S 5B6, Canada; [email protected]
* Correspondence: [email protected]† Deceased.
Received: 17 September 2018; Accepted: 19 November 2018; Published: 23 November 2018 �����������������
Abstract: This paper explores the potential for voluntary sustainability standards (VSS) organizationsto contribute to policy-making on biodiversity protection by examining their biodiversity policies,total standard compliant area, proximity to biodiversity hotspots, and the networks and partnershipsthey have in place that can support policy-making on biodiversity protection. The analysis undertakenis based on Social Network Analysis data, in combination with information from the InternationalInstitute for Sustainable Development (IISD) Standards and Biodiversity Review and the InternationalTrade Centre (ITC) Standards Map on the focus and operation of VSS organizations. The significanceof agriculture-focused private governance for global biodiversity policy and their relationshiptowards other forms of nongovernmental, governmental, and inter-governmental biodiversitypolicy are examined and described. We argue that, at present, a number of key agriculture-focusedVSS organizations are important policy actors to address biodiversity because of their elaboratebiodiversity policies, total compliant areas, and proximity to biodiversity hotspots. However,at present, most of these VSS organizations have relatively few ties with relevant governmental andinter-governmental biodiversity policymakers. The actor composition of their inter-organizationalnetworks currently reflects a focus on nongovernmental rather than governmental organizationswhile substantively they focus more on development than on environmental protection issues.
Keywords: biodiversity; standards; sustainability; networks; hotspots; agriculture
1. Introduction
Policymakers and academics alike are interested in the degree to which Voluntary SustainabilityStandard (VSS) policies can contribute positively to biodiversity and/or prevent harm tobiodiversity [1]. Issues for discussion include halting deforestation, protecting particular animal andplant species, and preventing soil erosion and its consequences. This interest, at least in part, can beexplained by the perceived stalemate in the development of inter-governmental policy-making on
Sustainability 2018, 10, 4379; doi:10.3390/su10124379 www.mdpi.com/journal/sustainability

Sustainability 2018, 10, 4379 2 of 20
biodiversity [2]. VSS organizations, as policy actors developing and governing sustainability-standards,are among a variety of actors and institutions believed to potentially be more active in promotingcross-border advances in biodiversity. VSS organizations may, therefore, potentially be a more dynamicand effective hands-on global biodiversity protection and promotion practice than inter-governmentaldecision-making has achieved.
Conversely, studies on contemporary agricultural VSS organization efforts to protect biodiversitysignals that they are limited to what they can achieve. VSS organization interventions are limited tothe agricultural land supporting standard compliant production [3]. VSS organization biodiversitypolicy, therefore, is constrained in its scale and its contribution to protection [4]. This implies thatVSS policymakers cannot go it alone when it comes to addressing biodiversity. VSS organizationpolicy-making efforts to protect biodiversity should therefore be assessed by their potential forcollective action and ability to engage with other governance organizations and institutions.
This study takes inspiration from a burgeoning literature studying VSS organization interactionsand public-private interactions in the sustainability standard-setting [5–9], and examines the degree towhich VSS organizations’ current connections with one another, with other non-governmental parties,and with (inter-)governmental treaties, laws, and organizations allow for collectively advancingbiodiversity goals. Using policy document and social network analysis [10], the paper assesses thestringency of current VSS biodiversity criteria, compliant land areas and their proximity to biodiversityhotspots, and the degree to which VSS organizations are embedded in networks that allow for collectiveaction in tackling barriers to scaling up and strengthening biodiversity protection.
The study first draws from datasets from Fransen et al. [5], which focused on VSS organizationsgoverning global agro-commodity chains, such as coffee, tea, cocoa, sugar, palm oil, cotton, soy,and flowers. Information from these datasets is then complemented by data on these commoditiesfrom the International Institute for Sustainable Development Sustainability Standards Initiative reporton standards and biodiversity [1], the International Trade Centre’s Standards Map data, and the recentgroundbreaking study by Tayleur et al. [11] on the location of agriculture-focused VSS organizationstandard-compliant areas. As is the convention in academic and grey literature on VSS [1,5,11],we focus on multiple crops, given how many VSS organizations themselves focus on various crops andare therefore expected to affect policy-making on various crops. Combining these four data sourcesallows us to analyze 11 relevant VSS focused on agro-commodities. To our knowledge, this is the firsttime that large-N network, geographic data, and VSS organization performance data are combined inthis way to make sense of VSS organizations’ collaborative potential and potential to cross-fertilizewith (inter-)governmental organizations and other actors on an issue area, such as biodiversity.
We argue that a few key agriculture-focused VSS organizations are important policy actorsto address biodiversity because of their elaborate biodiversity policies, total compliant areas,and proximity to biodiversity hotspots. However, at present, most of these VSS organizations haverelatively few ties with relevant governmental and inter-governmental biodiversity policymakers.Currently, their policy networks, in terms of actors, reflect an orientation towards nongovernmentalrather than governmental organizations, and, substantively, an orientation towards developmentalrather than environmental protection issues.
The following section examines the literature on VSS organizations and biodiversity. Section 3presents the datasets and methodological approach that were used for the analysis. Section 4 discussesVSS organization biodiversity policies, coverage, and their networks while Section 5 provides someconcluding thoughts.
2. Transnational Private Sustainability Governance Organizations and Biodiversity Policy
2.1. The Emergence of Agro-Commodity Focused VSS
The first wave of agricultural VSS organizations arose via individuals concerned with the impactsof industrialized and intensive forms of agriculture [12,13]. In the US, many individuals were connected

Sustainability 2018, 10, 4379 3 of 20
via their readership of The Rodale Institute’s magazine, Organic Farming and Gardening [14]. In 1972,national organizations working on organic agriculture launched the International Federation ofOrganic Agriculture Movements (IFOAM) to facilitate information exchange on organic practicesand the development of common principles [15]. Fairtrade certification is similarly rooted in diffusecommunities interested in alternative trade organizations in Europe and North America since the1950s. The European Fair Trade Association was formed in 1987 to help national fair trade initiativesshare experiences and ideas [16]. By 1997, the Fairtrade Labeling Organizations International (nowFairtrade International or FLO) was established, which now coordinates the standards and labelingwork of over a dozen national initiatives [17].
Following a different process, more recent VSS have included dominant actors (e.g., certainNon-Governmental Organizations (NGOs) and retailers) that decide to establish a VSS alone or witha small group of partners and because of multi-stakeholder platforms that have emerged in specificagro-commodities. The WWF has been prominent in this role; it has played a role in establishinginitiatives for palm oil (the Roundtable for Sustainable Palm Oil, RSPO) [18], soy (the Roundtablefor Responsible Soy) [19]), sugar, and cotton (Bonsucro and Better Cotton Initiative, BCI) [20,21].Retailers, government development agencies, and philanthropic foundations have helped launch VSSorganizations, such as Utz Certified and Cotton made in Africa [20,22].
Recently, scholars have turned their attention to the degree to which VSS organization interactionswith other VSS organizations may shape the effects of VSS on sustainable production, rather thanstudying the effects of VSS on production in isolation [23].
Scholars emphasize that the proliferation of VSS has led to coordination problems, makingcollective action more complicated. First, competitive interactions may arise when VSS organizationshave a similar policy focus and address similar sectors. Competition among VSS organizationsmay stimulate standard revisions that could benefit effective governance [24], but competition mayalso lead to implementation challenges, rising costs, and stakeholder confusion [25,26]. Second,VSS organizations that have different policy foci may be less productive in addressing issues thatsurpass their respective sustainability scope [3]. Authors argue that embedding VSS organizations innetworks may help foster more collaborative responses to these challenges [27].
In contemporary VSS policymaking, understanding interactions among organizationsdescriptively may help us assess the potential for VSS organization’s collaboration with other relevantgovernance actors to address complex sustainability challenges [5]. This is also in line with an evolvingresearch agenda looking at the interactions between VSS organizations and (inter-)governmentalpolicymakers. Interactions studied include partnering among public actors and VSS organization’srepresentatives [28], delegation of or orchestration of (inter-)governmental rules towards VSS [6,9],meta-governance of VSS by governments and international organizations [29], and lobbying by VSSorganization representatives towards governmental organizations and vice versa [8].
2.2. VSS and Biodiversity
Collective action among VSS organizations, and interactions between VSS organizations andinter-governmental policy-making, is of special concern in light of their potential for contributingto biodiversity protection. VSS are viewed by policy makers and analysts as a relatively flexibleapproach to biodiversity protection with some promise. Decades of inter-governmental policy-makinghave left the world with a set of treaty texts on biodiversity that are mutually inconsistent, lacking inenforcement mechanisms, and prone to varied interpretation by signatory states [2]. Moreover, becauseof the successful institutional development of international trade governance through the World TradeOrganization, and particularly the judicialization of trade dispute resolution among member states,environmental concerns politically tend to lose out relative to the efforts at governing the free flow ofgoods across borders [30]. Non-state actors, such as VSS organizations, working towards biodiversityprotection are perceived as more meaningful, hands-on, and a vehicle for implementing treaties.

Sustainability 2018, 10, 4379 4 of 20
VSS organizations focused on agro-commodities are especially relevant given how the agriculturalsector, operating on large tracts of land, impacts biodiversity.
Recent studies have therefore sought to gain insight into the potential for VSS to protectbiodiversity. Studies focused on VSS organizations operating in the forestry, fisheries, and agro-commodity sectors offer slightly different results regarding biodiversity policy focus and impact.The literature identifies biodiversity protection in the policies and criteria of agricultural VSSorganizations [31,32]. In terms of observed impacts, there is evidence that standard compliant farmsare more biodiversity-friendly than non-standard compliant farms. However, this claim is not testedfor the selection-effect: Farmers that are in a better position to advance biodiversity may opt forcertification more than farmers that are less able to do so [33,34]. Observed positive effects include lessdeforestation, higher species richness, and healthier riparian zones [35,36].
The literature also signals limits to the biodiversity protection policies of VSS organizations,related to the main purpose of VSS as market actor-dependent-instruments. VSS generally are morefocused on and better at promoting practices of conservation at the farm than beyond [33], and do abetter job of preventing biodiversity harm than promoting biodiversity benefits [34]. They can struggleto offer direct economic benefits to farmers, which may reduce farmer enthusiasm for biodiversityprotection [31]. As largeholders have more resources to become certified compared to smallholders,VSS policies are less likely to impact smallholder farms. Moreover, standard-compliant largeholderfarms contributing to forest conservation often cannot contribute to habitat conservation [32,37].Finally, VSS organizations’ stakeholders’ focus on expanding economic activities that transformnatural resources limits the ability to implement policies that limit these transformations [38].
The International Institute for Sustainable Development (IISD) published a report [1]comprehensively dealing with VSS potential to impact biodiversity. To examine how VSS criteria areenabling biodiversity protection on agricultural landscapes, it uses the Biological Impact Indicators forCommodity Production (BIICP) developed by the Secretariat of the Convention on Biological Diversityand its partners. The report finds, first, that at present pace, the VSS examined will represent 10% ofproduction volumes in eight markets (bananas, coffee, cocoa, tea, sugar, palm oil, soybean, and cotton)by 2020, but the agricultural area dedicated to these commodity sectors constitute less than 12% ofthe global agricultural land area. This means that significant presence in other crops is needed forVSS organizations to have a more meaningful impact on biodiversity protection; second, while mostVSS analyzed have a clear emphasis on habitat conversation, only a few focus on climate change,another important driver of biodiversity loss; third, most standards prescribe practices rather thanperformance outcomes when it comes to biodiversity protection; fourth, it would appear that VSSorganizations may not be operating in zones where there are the greatest threats to biodiversity andthe absence or proprietary nature of geographic information system data on standard compliant farmsprevents a more accurate assessment.
For this reason, many studies propose that the VSS approach to biodiversity protection shouldbe complemented by other policy instruments that ensure that a broader set of biodiversity criteriais addressed, other lands are targeted, or biodiversity is addressed at the landscape rather thanthe farm level, enabling a more holistic approach to biological protection [32,39]. Complementaryinteractions should be sought with domestic law and enforcement and other government initiatives inproducing countries, as well as with ecosystem service payment initiatives, public-private partnerships,and development assistance policies [40].
2.3. The Importance of Ties among VSS
Academics and policymakers focused on VSS organizations’ biodiversity policy stress therelevance of VSS organizations’ connections with each other and with other biodiversity-relevantgovernance organizations [1,5]. Similarly, the IISD report recommends a collaborative approach amongvarious actors for the proper implementation of developing VSS biodiversity criteria, sharing data,researching impacts, and assuring VSS organizations’ credibility to protect biodiversity.

Sustainability 2018, 10, 4379 5 of 20
For this reason, it is relevant to examine how VSS organizations develop ties with each otherand with other policy-relevant organizations. VSS organization interactions with each other areimportant to reduce certification costs and to encourage policy learning that can result in more effectivebiodiversity protection policies. Moreover, VSS organizations’ interactions with other institutionsand actors may contribute to improved biodiversity protection, and biodiversity impacts on largerscales [1]. While recent studies systematically look at linkages among VSS policy-makers andother institutions [5,6,9,28,41], so far, none of these studies have assessed policy networks focusedon biodiversity protection in particular. Moreover, so far, none of the studies have viewed thesignificance of linkages among VSS organizations and other organizations from the perspectiveof VSS organizations’ potential to contribute to biodiversity protection policy-making given its policiesand performance.
3. Materials, Analytical Approach, and Methods
3.1. Sample
The agricultural transnational VSS organizations examined were selected based on the availabilityof data from Fransen et al. [5,41], the IISD Standards and Biodiversity Review [1], and the ITC StandardsMap providing data on VSS organizational network structures, policies, and operations. The Fransenet al. dataset sample is based on previous studies, interviews with VSS organization and businessprofessionals conducted between 2010 and 2012. The sampling process led to a final selection of the 11VSS organizations shown in Table 1 for which we have available data. Because many VSS organizationsfocus on various crops, and their policy impact is therefore expected to extend beyond single crops,we follow both academic [5,41] and policy-maker studies [1] in casting the net widely and analyzingmany crops that have a variety of possible consequences for biodiversity protection. Our sampleinvolves both VSS focused on single crops and VSS focused on many crops and there is overlap in cropfocus across many of the VSS organizations.

Sustainability 2018, 10, 4379 6 of 20
Table 1. Key Voluntary Sustainability Standard (VSS) organization characteristics. Data from Fransen/Schalk/Auld [41] and Potts et al. [1].
VSS Sustainability ProblemDefinition Product Focus Development History Year of
DevelopmentCountry of Head
Offices
IFOAM Environmental farming practices Food consumer products Consumer-local producermovement 1972 Germany
Utz Farm-level comprehensivestandard Food consumer products Multinational brand/retail with
international NGO 1997 The Netherlands
Rainforest Alliance Conservation/Biodiversity Food consumer products Environmentalists/Science 1987 USA
Better Cotton Farm-level comprehensivestandard Cotton Multinational brand/retail with
international NGO 2005 Switzerland
Global Coffee Program (4C) Farm-level baseline standard Food consumer products Multinational brand/retail withinternational NGO 2002 Germany
FLO (present with two standardsfor hired labor and smallholders) Equitable development Food consumer products Consumer-local producer
movement 1997 Germany
CmiA Equitable development Cotton Multinational brand/retail 2005 Germany
Round Table Responsible Soy Farm-level baseline standard Food ingredients Multinational brand/retail withinternational NGO 2005 Argentina
RSPO Farm-level baseline standard Food ingredients Multinational brand/retail withinternational NGO 2002 Malaysia
RSB Farm-level comprehensivestandard Energy Multinational brand/retail with
international NGO 2006 Switzerland
Bonsucro Farm-level comprehensivestandard Food ingredients Multinational brand/retail with
International NGO 2005 UK
Sustainability 2018, 10, 4379 7 of 20
3.2. Analyzing Biodiversity Criteria and Geographic Operations
To gauge their significance, we rank VSS organizations according to three criteria: The amount ofhectares covered by a VSS in terms of standard-compliant areas; the proximity of standard-compliantareas to so-called biodiversity hotspots, i.e., regions with significant biodiversity under threat ofdestruction; and the stringency of biodiversity criteria in the implementation of a given VSS. By doingso, we continue in a tradition of policy research that compares environmental and labor criteriaquantitatively [42–45].
For stringency, we create an average stringency score for each VSS organization based on the IISDmeasure. The IISD report measures the breadth of standards in terms of biodiversity issue coverage,in combination with the degree of obligation associated with requirements on biodiversity in thestandard ([1], p. 27). The focus is on so-called critical requirements, i.e., requirements that producersneed to meet before being deemed compliant with the standard (as opposed to other requirementsthat may be met after certification). For this paper, we, in turn, create an aggregate score for thisbiodiversity stringency per VSS. Both the IISD measures and the aggregate measure have been createdin a process using inter-coder reliability and tests with alternative measurements. For the aggregatemeasure, we report on this below. For IISD operationalization and checks on reliability, we refer totheir report [1].
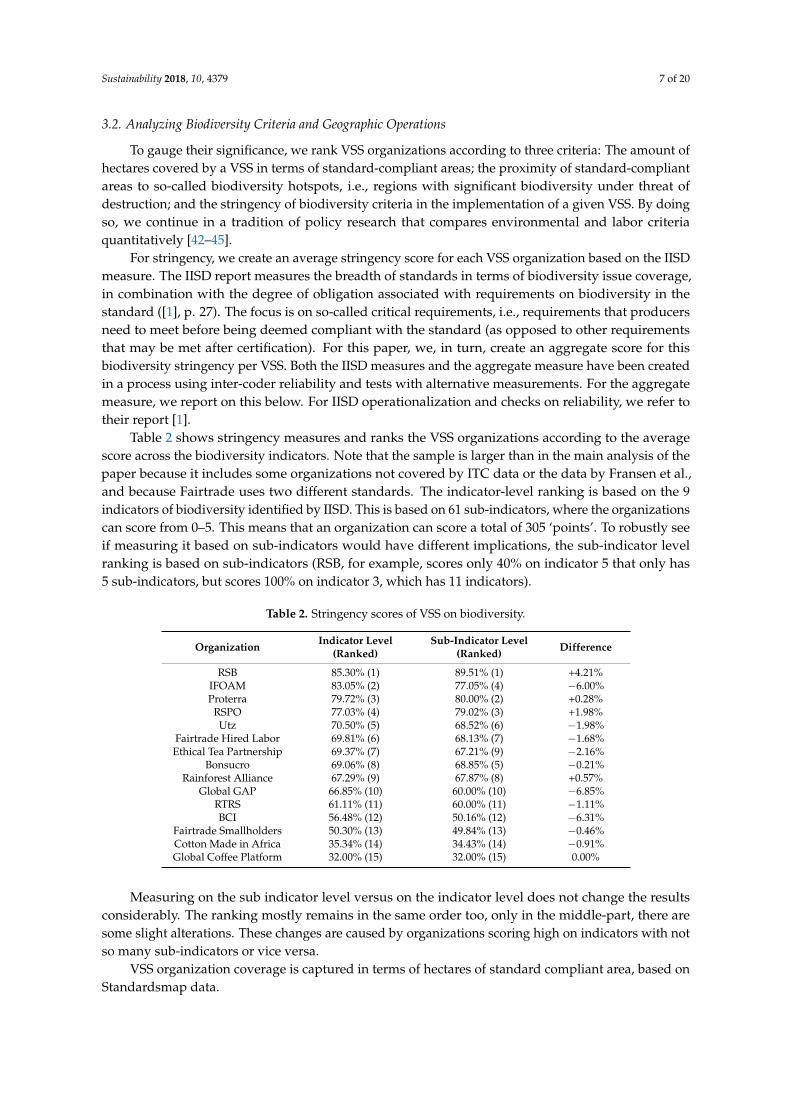
Table 2 shows stringency measures and ranks the VSS organizations according to the averagescore across the biodiversity indicators. Note that the sample is larger than in the main analysis of thepaper because it includes some organizations not covered by ITC data or the data by Fransen et al.,and because Fairtrade uses two different standards. The indicator-level ranking is based on the 9indicators of biodiversity identified by IISD. This is based on 61 sub-indicators, where the organizationscan score from 0–5. This means that an organization can score a total of 305 ‘points’. To robustly seeif measuring it based on sub-indicators would have different implications, the sub-indicator levelranking is based on sub-indicators (RSB, for example, scores only 40% on indicator 5 that only has5 sub-indicators, but scores 100% on indicator 3, which has 11 indicators).
Table 2. Stringency scores of VSS on biodiversity.
Organization Indicator Level(Ranked)
Sub-Indicator Level(Ranked) Difference
RSB 85.30% (1) 89.51% (1) +4.21%IFOAM 83.05% (2) 77.05% (4) −6.00%Proterra 79.72% (3) 80.00% (2) +0.28%
RSPO 77.03% (4) 79.02% (3) +1.98%Utz 70.50% (5) 68.52% (6) −1.98%
Fairtrade Hired Labor 69.81% (6) 68.13% (7) −1.68%Ethical Tea Partnership 69.37% (7) 67.21% (9) −2.16%
Bonsucro 69.06% (8) 68.85% (5) −0.21%Rainforest Alliance 67.29% (9) 67.87% (8) +0.57%
Global GAP 66.85% (10) 60.00% (10) −6.85%RTRS 61.11% (11) 60.00% (11) −1.11%BCI 56.48% (12) 50.16% (12) −6.31%
Fairtrade Smallholders 50.30% (13) 49.84% (13) −0.46%Cotton Made in Africa 35.34% (14) 34.43% (14) −0.91%Global Coffee Platform 32.00% (15) 32.00% (15) 0.00%
Measuring on the sub indicator level versus on the indicator level does not change the resultsconsiderably. The ranking mostly remains in the same order too, only in the middle-part, there aresome slight alterations. These changes are caused by organizations scoring high on indicators with notso many sub-indicators or vice versa.
VSS organization coverage is captured in terms of hectares of standard compliant area, based onStandardsmap data.
Sustainability 2018, 10, 4379 8 of 20
Biodiversity hotspot data is obtained from the Ecosystem Partnership Fund. To qualify as abiodiversity hotspot, a region must meet two strict criteria: Contain at least 1500 species of vascularplants (>0.5% of the world’s total) as endemics (species found nowhere else on Earth) and have lost atleast 70% of its original habitat (Critical Ecosystem Partnership Fund). Together, the VSS organizationsin our sample certified 430,864,233 hectares, of which 36.3% (156,452,483 hectares) are in countries thatcontain biodiversity hotspots and 63.7% (274,411,750 hectares) in other countries.
For robustness purposes, we cross-check our estimation of VSS organization compliant areasproximate to hotspots with Tayleur et al. [11]. Their study, due to use of geo-positioning data, offersmore precise measurement of proximity to hotspots, but cannot distinguish among different VSS,instead emphasizing commodities being certified by aggregate VSS data. We therefore check whetherthere is a match between reported compliant areas for a particular VSS organization, the commodityfocus of this VSS organization, and the areas detected by Tayleur et al. as being used for farming sucha commodity near a hotspot. This matching shows that generally our proxy for biodiversity relevanceby using country-level data is good as it, in almost all cases, signals standard-compliant areas nearhotspots in these countries. Below, we also report on particular insights from the Tayleur et al. studieswhere these have important implications for our network analysis findings.
Like the IISD authors, we hold that rankings in terms of stringency, coverage, and hotspotproximity are not a signal of VSS quality or success. A lower amount of hectares covered may,for instance, mean that a VSS organization has chosen to focus on a particular crop, region, orproducer type. A lower degree of stringency may mean that a standard has deliberately chosen anarrow set of sustainability requirements for which it considers its intervention meaningful, or that aVSS organization is seeking to offer baseline certification to poor producers that may otherwise notenter certification processes. A VSS organization with many standard-compliant areas near biodiversityhotspots similarly may reflect VSS organization strength in focusing on particular geographic areaswithout interventions in such hotspots as the VSS organization’s core mission.
Nevertheless, a higher or lower position in such rankings indicates a VSS organization’simportance in a network of organizations and professionals that could be meaningful in promotingcollaboration on biodiversity policy. This is because a VSS organization-node with a high amountof hectares covered may represent a lot of influence on farmers and their environment, as wellas many governance activities pertinent to biodiversity; because a VSS organization with strictbiodiversity requirements may provide expertise on a wide array of biodiversity-related issues andinterventions; and because a VSS organization with relatively more activities close to hotspots canoffer both knowledge of activities and conditions in these hotspots as well as potentially meaningfulimpact on the ground at these hotspots.
Moreover, we are interested to know whether ranking high in terms of stringency, totalstandard-compliant areas, and proximity to biodiversity hotspots are in any way related. A positiverelationship between these three variables would mean that there are VSS organizations withexceptional relevance for biodiversity policy for which we need to closely examine their ties toother organizations. We are therefore interested to learn if higher scores in one ranking leads to higheror lower scores in another (see Figure 1). Are more stringent VSS biodiversity criteria conducive touptake leading to a higher level of standard compliant hectares for a given VSS organization? Doesmore standard compliant area translate into greater coverage near or within hotspots? Additionally,do more stringent VSS criteria imply that VSS organizations operate close to or within hotspots?

Sustainability 2018, 10, 4379 9 of 20
Sustainability 2018, 10, x FOR PEER REVIEW 9 of 20
Figure 1. Stringency-uptake-hotspots’ relations diagram.
3.3. Gathering Network Data
We examine three different relationship types between the 11 VSS organizations, which we all derive from Fransen, Schalk, and Auld [5,41] in terms of their definition, sample, and operationalization, but nevertheless update so that we can analyze the relationships of VSS organizations in the year, 2017. Social ties can be defined in numerous ways [10,46]. In our methodology, we do not use name generators or a snowball procedure, but rather let the data speak for itself, i.e., network membership is defined based on the appearance of organizations in secondary data obtained from multiple sources that were generated by VSS and other stakeholders, as described below. The main reason for this is that our focus is global, i.e., it transcends individual projects and a single VSS. Most studies on stakeholder management and social networks in biodiversity conservation have a project focus, often a specific region with a specific problem (see e.g., Cohen et al. [47] about Coral reef types targeted in the prioritization of marine areas for the Solomon Islands, or Prell et al. [48]). For such individual projects and case studies, it makes sense to depart from a researcher-defined core network, and ask this smaller subset of key actors, who are important in day-to-day operations.
In our network boundary definition, by contrast, we do not place restrictions on who is a member of the network based on our, or respondents’, perceptions of the salience of actors/organizations for the policy at hand. This is because our main interest is not in identifying who is crucial in biodiversity conservation, but in what the overall global patterns of interdependence between VSS and associated organizations look like, and what they may mean for hotspots, stringency, and uptake. In this overall network structure, actors that are unimportant at face value can play a critical (structural) role. In mapping social networks, exhaustiveness and completeness is thus important for our analysis to be meaningful. This is also the reason that we analyze multiple types of relationships rather than a single one. Our approach, however, does come at the cost of losing the more fine-grained information of specific policy issues and actor positions for specific biodiversity projects. Our analysis should be seen as exploratory: We connect the overall VSS network structure to variations in stringency, hotspots, and uptake, without making strong causal claims on network effects.
The first relationship, the existence of actual partnerships and collaborations, we examine by searching across all available online VSS organization documentation in 2017, such as policy documents, annual reports, and newsfeeds, to identify links between VSS organizations and other sustainable agriculture organizations, including NGOs, governments, international organizations, businesses, and academic institutions [25]. Like Fransen et al., we code all these ties as belonging to the same category of partnerships and collaborations, while acknowledging that it is difficult to
Figure 1. Stringency-uptake-hotspots’ relations diagram.
3.3. Gathering Network Data
We examine three different relationship types between the 11 VSS organizations, which we allderive from Fransen, Schalk, and Auld [5,41] in terms of their definition, sample, and operationalization,but nevertheless update so that we can analyze the relationships of VSS organizations in the year,2017. Social ties can be defined in numerous ways [10,46]. In our methodology, we do not use namegenerators or a snowball procedure, but rather let the data speak for itself, i.e., network membership isdefined based on the appearance of organizations in secondary data obtained from multiple sourcesthat were generated by VSS and other stakeholders, as described below. The main reason for thisis that our focus is global, i.e., it transcends individual projects and a single VSS. Most studies onstakeholder management and social networks in biodiversity conservation have a project focus, often aspecific region with a specific problem (see e.g., Cohen et al. [47] about Coral reef types targeted in theprioritization of marine areas for the Solomon Islands, or Prell et al. [48]). For such individual projectsand case studies, it makes sense to depart from a researcher-defined core network, and ask this smallersubset of key actors, who are important in day-to-day operations.
In our network boundary definition, by contrast, we do not place restrictions on who is a memberof the network based on our, or respondents’, perceptions of the salience of actors/organizationsfor the policy at hand. This is because our main interest is not in identifying who is crucial inbiodiversity conservation, but in what the overall global patterns of interdependence between VSSand associated organizations look like, and what they may mean for hotspots, stringency, and uptake.In this overall network structure, actors that are unimportant at face value can play a critical (structural)role. In mapping social networks, exhaustiveness and completeness is thus important for our analysisto be meaningful. This is also the reason that we analyze multiple types of relationships rather than asingle one. Our approach, however, does come at the cost of losing the more fine-grained informationof specific policy issues and actor positions for specific biodiversity projects. Our analysis should beseen as exploratory: We connect the overall VSS network structure to variations in stringency, hotspots,and uptake, without making strong causal claims on network effects.
The first relationship, the existence of actual partnerships and collaborations, we examineby searching across all available online VSS organization documentation in 2017, such as policydocuments, annual reports, and newsfeeds, to identify links between VSS organizations and othersustainable agriculture organizations, including NGOs, governments, international organizations,businesses, and academic institutions [25]. Like Fransen et al., we code all these ties as belongingto the same category of partnerships and collaborations, while acknowledging that it is difficult toseparate loose one-off partnerships from more institutionalized longer term relationships. It was tootime-consuming to track and research each and every partnership individually, and the assumption

Sustainability 2018, 10, 4379 10 of 20
is that if the VSS themselves find a partnership or collaboration important enough to mention inkey documents, like their year reports as an organization, it is significant, and comparable in thissense. Moreover, in hand-coding the documents, multiple coders were involved who discussedprojects and collaborations if doubts were raised about their significance. The resulting partnershipsand collaborations network thus conveys the existence of collaborative relationships between VSSorganizations and other organizations.
Second, using information from 2017 provided by the ISEAL Alliance, the Global SocialCompliance Programme, the Ethical Tea Partnership, the Dutch Sustainable Trade Initiative (IDH),the Global Food Safety Initiative (GFSI), and the World Cocoa Foundation, we constructedmeta-governance networks, which indicate participation of VSS organizations, NGOs, governments,intergovernmental organizations, academic institutes, and businesses in these seven meta-governanceinitiatives. Ties examined here include membership and governance roles in meta-governance, as wellas voluntarily subjecting standards and policies to equivalence processes, so that standards becomecomparable. The meta-governance network thus consists of VSS organizations and other organizations,in which a relationship between two actors represents the number of shared memberships across thedifferent initiatives (maximum of six).
Third, like Fransen et al., we analyze VSS policy documents from 2017 for references to otherorganizations as the basis of standard policies. We structurally compare documents detailing prevailingstandard-setting policies. This includes the following categories of documents that are available onlineand that are comprehensive in their coverage of VSS organization operations (and functionally similaracross the sample) in verifying compliance with sustainability requirements: Substantive requirementsfor businesses and how these should be weighted, auditing policies, policies assuring the origin of aproduct, and policies regarding the VSS organization’s internal governance activities.
Fransen et al. [41] also apply network analysis to employment ties, forming a network of VSSorganizations and their affiliated organizations, in which a relationship between a VSS organizationand another organization is based on the number of employees who were, or still are, affiliated withboth organizations, based on an analysis of the online resumes of the VSS organization employees(in the period of 2002–2012). We find these resumes too dated (2012) to include in the present study.Results are available on request, but do not upset the patterns described here on the basis of the otherinvestigated ties.
We report on measures of these cross-references per organization (including all mentioned VSSpolicy documents). We code references to different policies and ideas for organizational sub-unitswithin the same organization as it occurred in a VSS policy-document set (specifically the UnitedNations (UN), International Labor Organization (ILO), International Organization for Standardization(ISO), and the European Union (EU)). For the UN, we differentiated for example between UNDP,UNCTAD or UNHRC. The resulting references’ network consists of VSS organizations and otherorganizations, in which a relationship constitutes the existence of a reference between two actors.
Finally, we use organization profiles from their websites to divide the organizations with tiesto agro-commodity-focused VSS organizations into four generic groups: Government and Politics,Non-profit, Business, and VSS. Our analysis may include references to VSS organizations that are notpart of our initial selection if the 11 VSS organizations analyzed have ties with them via, for instance,the partnerships or policy references.
4. Results
4.1. Biodiversity Criteria, Coverage, and Proximity to Biodiversity Hotspots
Table 3 shows descriptive statistics of the stringency scores (the average, the highest, and thelowest score per indicator) based on data from the SSI report. RSB is ranked highest most often, whilethe Global Coffee Platform (4C) and Cotton Made in Africa are ranked lower. As noted, we do nottreat this as an indicator of success. Indeed, GCP’s score mirrors its ambition to be a baseline standard,

Sustainability 2018, 10, 4379 11 of 20
and CmiA’s score is consistent with its ambition to be focused on social and developmental issues.Across the issue areas, RSB and IFOAM have the most aligned and have the most stringent biodiversitycriteria for biodiversity protection.
Table 3. Stringency scores for VSS.
Indicator Average Score Highest Score Lowest Score
1. Percent Farm Area in Land Classesof Different Habitat Quality 65.8% RSB (100%) Global Coffee
Platform (34%)
2. Conversion/loss of natural habitatcover (land use change over time) 76.67% RSB and RSPO
(100%) GG (36.67%)
3. Area-based conservationmanagement 64.24% RSB (100%) BCI (41.82%)
4. Water Use per Unit Product 81.87%BCI, Bonsucro,
IFOAM, and RSB(100%)
Global CoffeePlatform (44%)
5. Synthetic Pesticides and FertilizerUse per Unit Area or Product 54.67% IFOAM (100%)
Global CoffeePlatform and CMA
(24%)
6. Biological Oxygen Demand atSampling Sites 60.95% RSB (100%) CMA (8.57%)
7. Soil Organic Matter 57.67% IFOAM (100%) Global CoffeePlatform (0%)
8. Fossil Fuel Use per Unit Area orProduct 72.80% Bonsucro and
IFOAM (100%) CMiA (33.33%)
9. Carbon Footprint of Product andLand Use 49.20% RSB (86%) CMiA (10%)
Total 64.87% (average) RSB IFOAM,Bonsucro, RSPO, BCI
Global CoffeePlatform and CMiA,
BCI
Table 4 reports the average stringency scores for all VSS organizations across the nine BIICPsin Table 3. Table 4 presents the descriptive statistics for standard-compliant area and proximity tobiodiversity hotspots and network relationships. The VSS organizations for which we miss networkindicators are ranked for other indicators.

Sustainability 2018, 10, 4379 12 of 20
Table 4. Descriptive statistics of the IISD, ITC, and network indicators of the VSS organizations.
Organisation Stringency Hectares Hotspots Hectares Partnership (Degree) References (Degree) Meta-Governance(Degree, Weighted)
4C 32.00% (11) 1,424,838 (6) 1,424,838 (6) 24 (1) 20 (5) 123 (2)BCI 56.48% (9) 1,612,000 (4) 1,612,000 (4) 21 (2) 16 (6) 123 (2)
Cotton Made in Africa 35.34% (10) 585,339 (9) 585,339 (8) 18 (3) 12 (8) 123 (2)FLO (hired labor) 69.81% (5) 1,295,379 (7) 1,295,379 (7) 7 (7) 26 (2) 123 (2)
IFOAM 83.05% (2) 31,536,885 (1) 28,691,726 (1) 5 (8) 11 (9) 123 (2)Rainforest Alliance 67.29% (7) 1,431,383 (5) 1,431,383 (5) 12 (6) 23 (4) 251 (1)
Roundtable on Sustainable Palm Oil 77.03% (3) 2,619,436 (2) 2,619,436 (2) 16 (4) 31 (1) 123 (2)Roundtable on Responsible Soy 61.11% (8) 483,934 (10) 480,204 (9) 0 (9) 16 (6) 251 (1)
Utz Certified 70.50% (4) 1,690,604 (3) 1,690,604 (3) 15 (5) 14 (7) 251 (1)Bonsucro 69.06% (6) 963,990 (8) n.a. 18 (3) 25 (3) 123 (2)
RSB 85.30% (1) n.a. n.a. 18 (3) 12 (8) 123 (2)Global Gap 66.85% 1,849,086 1,551,725 n.a. n.a. n.a.
ProTerra 79.72% 1,215,349 1,212,849 n.a. n.a. n.a.

Sustainability 2018, 10, 4379 13 of 20
Overall, VSS organizations with a higher standard compliant area are most active in countrieswith biodiversity hotspots. We can therefore assume that VSS organizations with a larger coverage interms of hectares will also matter for biodiversity.
Comparing the scores for standard stringency and standard-compliant areas in biodiversityhotspots suggests that some of the VSS organizations with more stringent standards are also activenear biodiversity hotspots, in particular the members of IFOAM, as well as RSPO and Utz. In networkterms, we would expect these VSS organizations to prove interesting organizations to link up to,offering both potential impacts as well as varied expertise and experience in terms of promotingbiodiversity. An interesting outlier on this list is BCI, with a relatively less stringent standard, but ahigh proximity to hotspots.
Throughout this study, we must critically ask ourselves whether IFOAM, as the head organizationof the organics movement, has a similar status as a transnational organization as the other VSS, in termsof its governing capacity relative to its national chapter organizations. We have reason to believethat much of the politically significant “action” when it comes to organics may take place elsewhere,in comparison to the head organizations of Utz, Rainforest Alliance, and RSPO.
The data by Tayleur et al. [11] confirm this, but add interesting commodity-specific insights. Palmoil certified data (including RSPO’s), for instance, position certified areas concentrated in Indonesia andMalaysia, particularly in areas closer to towns and with lower levels of poverty. In biodiversity terms,these areas, compared to non-certified areas, have higher levels of tree loss, and lower coverages ofIBAs and protected areas. Coffee and cocoa (the core commodities for Utz, and significant commoditiesfor IFOAM), are certified across Asia, Africa, and Latin Americas in areas relevant for birds, morethan in areas that are not certified. For coffee, in particular, areas also included high conservationareas for birds and mammals, more than non-certified areas. Certified tea (also a commodity certifiedby Utz and covered by IFOAM) production may occur in Asia, Africa, and Latin America in areaswith amphibians, and in the study, is more associated with greater protected area coverage thanareas without certification. In sum, geographic data shows that VSS organizations with stringentbiodiversity policies have certified practices relevant for protected areas, high conservation value areas,birds, mammals, and amphibians. Their policies and activities are therefore geared towards impact onthese issues.
4.2. Network Analysis Results
We proceed to describe the VSS organization networks for the four different types of relationships(see Section 3.3). We do so in a non-technical way. For a more elaborate description of the datamanipulation and social network techniques applied, we refer the reader to Fransen, Schalk,and Auld [5,41], because the data structure for the networks is the same.
The networks are shown in Figure 2. In all three networks, each node represents an organization.Nodes with more ties are proportionately larger. The type of organization (VSS organization, Non-profitPrivate, Business, or Government and Politics) is represented by a specific color, according to thelegend. When the edge weight is higher—meaning that a tie between two organizations has ahigher value—the tie is proportionately thicker in Figure 2b Variation in edge weights only existsfor the meta-governance networks. Recall that a link in the meta-governance network constitutesthe number of shared memberships. Thus, organizations can have a stronger weighted tie if theyshare memberships of more meta-governance institutions. In contrast, because of our coding strategy(see Section 3.3), a partnership or a reference either exists or it does not, and thus has no weight.Compared to the other two networks, the meta-governance network is relatively dense (many of theties between actors that could theoretically exist, actually do exist). This is because a tie between allpairs of organizations is created that are a member of a single meta-governance institution. With asubstantial number of member organizations in each institution, the network shows a high level ofdensity overall (in Figure 2b, roughly represented by the different clusters or ‘clouds’). Apart fromFigure 2, Table 3 provides the number of ties each of the 11 VSS organizations in our sample has in

Sustainability 2018, 10, 4379 14 of 20
each of the networks, or their ‘degree centrality’ ([10], p. 178). For the meta-governance network,degree centrality is computed as the sum over all tie values, thus taking into account the edge weights.For all three networks, the higher an organization’s centrality, the higher its structural prominence.
Sustainability 2018, 10, x FOR PEER REVIEW 14 of 20
values, thus taking into account the edge weights. For all three networks, the higher an organization’s centrality, the higher its structural prominence.
(a) Partnerships and collaborations
(b) Meta-governance
Figure 2. Cont.

Sustainability 2018, 10, 4379 15 of 20Sustainability 2018, 10, x FOR PEER REVIEW 15 of 20
(c) References
Figure 2. The VSS networks for partnerships and collaborations, meta-governance, and references. Legend. Node size represents degree centrality. Color represents type of organization: Green = VSS, yellow = non-profit private, blue = business, red = government and politics, light-blue = missing. Edge weight represents the number of shared memberships (meta-governance). Node labels only shown for more central organizations.
A number of tentative interpretations can be derived from Figure 2. First of all, the different networks show different levels of activity, and specific central organizations. The partnership network is relatively sparse, which is most likely a consequence of the effort required: VSS organizations must choose their partners strategically because, due to resources’ constraints, it is likely that VSS organizations can only establish a limited number of partnerships. We assume that partnering among VSS organizations can be substantively meaningful, assuring information exchange and building trust, which could be used for collective action purposes [5]. Table 3 shows that GCP and BCI have the most partnerships.
The meta-governance network is relatively dense, but one can question to what extent information exchange actively takes place within each dyad (i.e., pair of organizations). After all, among many of the meta-governance initiatives we studied, substantive exchange and coordination among policy-makers is expected, but not required. Policy-makers from VSS organizations and other governance organizations may not meet [5]. In this network, Rainforest Alliance, Utz, and Roundtable on Responsible Soy have most shared memberships with other organizations. At the same time, a number of VSS organizations not in the core sample of 11 are central in this network, namely Global Gap, ProTerra, and FSC. Finally, the most active ‘referencers’ are FLO and RSPO.
Second, it appears that more stringent and active VSS organizations are not necessarily more central in the three networks. Recall that IFOAM, RSPO, and Utz are, overall, the most stringent and active (in the stringency percentage, hectares, and activity near biodiversity hotspots). When we look at IFOAM, we observe in Table 3 that it is not central in any of the three networks, compared to the other VSS. This is notable, and signals that the organics movement is in terms of its policy ideas, partners, and employment pool, in a class of its own relative to the other, more mainstream business focused VSS. It also signals that collective action among VSS that includes the organics movement may be harder, also with regard to biodiversity objectives.
RSPO is most central in the reference network, but ranks lower in the other three. Utz is perhaps the most noticeable VSS organizations: Although it ranks lower than IFOAM and RSPO on the
Figure 2. The VSS networks for partnerships and collaborations, meta-governance, and references.Legend. Node size represents degree centrality. Color represents type of organization: Green = VSS,yellow = non-profit private, blue = business, red = government and politics, light-blue = missing. Edgeweight represents the number of shared memberships (meta-governance). Node labels only shown formore central organizations.
A number of tentative interpretations can be derived from Figure 2. First of all, the differentnetworks show different levels of activity, and specific central organizations. The partnership networkis relatively sparse, which is most likely a consequence of the effort required: VSS organizationsmust choose their partners strategically because, due to resources’ constraints, it is likely that VSSorganizations can only establish a limited number of partnerships. We assume that partnering amongVSS organizations can be substantively meaningful, assuring information exchange and building trust,which could be used for collective action purposes [5]. Table 3 shows that GCP and BCI have themost partnerships.
The meta-governance network is relatively dense, but one can question to what extent informationexchange actively takes place within each dyad (i.e., pair of organizations). After all, among manyof the meta-governance initiatives we studied, substantive exchange and coordination amongpolicy-makers is expected, but not required. Policy-makers from VSS organizations and othergovernance organizations may not meet [5]. In this network, Rainforest Alliance, Utz, and Roundtableon Responsible Soy have most shared memberships with other organizations. At the same time,a number of VSS organizations not in the core sample of 11 are central in this network, namely GlobalGap, ProTerra, and FSC. Finally, the most active ‘referencers’ are FLO and RSPO.
Second, it appears that more stringent and active VSS organizations are not necessarily morecentral in the three networks. Recall that IFOAM, RSPO, and Utz are, overall, the most stringentand active (in the stringency percentage, hectares, and activity near biodiversity hotspots). When welook at IFOAM, we observe in Table 3 that it is not central in any of the three networks, compared tothe other VSS. This is notable, and signals that the organics movement is in terms of its policy ideas,partners, and employment pool, in a class of its own relative to the other, more mainstream businessfocused VSS. It also signals that collective action among VSS that includes the organics movement maybe harder, also with regard to biodiversity objectives.
RSPO is most central in the reference network, but ranks lower in the other three. Utz is perhapsthe most noticeable VSS organizations: Although it ranks lower than IFOAM and RSPO on the

Sustainability 2018, 10, 4379 16 of 20
biodiversity indicators overall, it is very central in the meta-governance network, and moderatelycentral in the partnership network. A possible contender for Utz in this sense is BCI, which is aninteresting outlier in terms of stringency and activity—with a relatively less stringent standard, but ahigh proximity to hotspots and a dominant role in terms of centrality in the employment ties andpartnerships and collaboration networks. The Tayleur et al. data does not cover cotton, which is whywe are not able to provide more context on geography here regarding BCI.
Next, we explore the network positions of IFOAM, RSPO, and Utz for the significance of theirties to other organizations claiming to specifically address biodiversity protection in their policies.We then see that IFOAM does have a set of partnerships with international organizations relevant forbiodiversity, most notably the Food and Agriculture Organization (FAO), unlike RSPO and Utz.
Furthermore, the three networks are characterized by quite different compositions when it comesto the types of organizations. Most evidently, VSS organizations tend to predominantly refer togovernment and policy organizations. Among these, the various sub units of the ILO, the StockholmConvention, and the World Health Organization (WHO) are most popular. The dominance ofgovernment and policy partners in this network is most likely indicative of the desire of VSSorganizations to legitimate their organization, and to be perceived as a reliable VSS organizationregardless of their private nature. Alternatively, it could reflect an effort to be aligned withinternationally recognized directives from UN agencies to leverage existing governance efforts fromthese agencies. Relevant for our purposes here, the links to governmental actors and internationalorganizations within this network signal more of a “developmental” focus of the VSS, rather than a“biodiversity”-focus. Safe for the Stockholm, Rotterdam, and Ramsar convention, most IO treatiesreferenced seem to focus on social and economic issues reflecting more development despite theirpotential for biodiversity protection.
The meta-governance network is dominated by business organizations. The most importantamong these are IKEA, Starbucks, Unilever, Marks & Spencer, Cargill, and Mondelez International.These are significant actors for addressing biodiversity protection in global supply chains, but theirlinkage to VSS organizations does not imply collective biodiversity protection activities. Solidaridad,IUCN, and the WWF are relevant organizations for VSS organizations across the networks, and,especially the latter two, may prove useful partners in developing biodiversity activities.
In sum, networks of relevant actors in biodiversity protection are relatively sparse. Withinthe partnership network, deemed most relevant for biodiversity protection, the ties are sparserand not focused on relevant biodiversity policy-makers. Despite being the most significant VSSorganization in terms of policies and standard compliant areas, IFOAM does not play a centralrole across these networks, but does have some relevant partnerships with the inter-governmentalbiodiversity policy-making world, while Utz and RSPO have mostly links to nongovernmental actors.Overall, the ties between VSS organizations and other types of organizations across the networks seemto exhibit a focus on development rather than on biodiversity protection.
Utz has recently announced a merger with Rainforest Alliance, another important VSSorganization in our sample. It remains speculation what consequences this will have for Utz’srelevance for biodiversity policies, but if the present links that Rainforest Alliance has in our networkanalyses remain intact, then this would mean that Utz would reduce its distance towards relevantbiodiversity-related organizations, such as FAO.
5. Discussion
With increasing interest in the potential of VSS organizations to contribute to biodiversityprotection and policy-making on biodiversity, we have investigated VSS organization standards,operations, locations of certified areas, and network ties. Based on analysis of standard stringency,coverage, and proximity to biodiversity hotspots, we first tentatively conclude that a few VSSorganizations are in a promising position to potentially contribute through their policy-makingto biodiversity protection goals. At the same time, based on analysis of network positions, VSS

Sustainability 2018, 10, 4379 17 of 20
organization links to relevant biodiversity actors and institutions are still quite scarce, signaling thattheir ability to engage in collaborative policy-making and policy exchange with relevant biodiversitypolicymakers is, at present, limited. Possibly as a heritage of their initial policy focus, VSS organizationlinks to the developmental policy world and to private parties are more prevalent than to the mostwell-known and relevant public biodiversity policymakers and policies. So, while VSS organizations,such as Utz, the organics movement, and RSPO, should be reckoned with as biodiversity actors, ourresults still reveal a gap between their activities and policies and the (inter-)governmental biodiversitypolicy world.
Previous research [48,49] has demonstrated that centrality is important in networks oforganizations that seek to steer environmental policy and resource management. We suggest, based on11 cases, that those in a promising position with regard to their biodiversity criteria, their proximityto hotspots, and total compliant areas are not necessarily the best-connected ones. Further researchmust (a) substantiate these empirical associations and (b) look at causal effects of network positionand stakeholder strategy for project/organization success (e.g., targeting specific actors that werepreviously unknown in the network). Ours is a first step in the challenging task to ‘collate, integrate,and analyse the large amounts of fragmented and diverse biodiversity data to determine the currentstatus and trends of biodiversity in order to inform the relevant decision makers’ ([50], p. 50).
While our insights pertain to the agriculture-focused VSS organizations and their relationshipto biodiversity, scholars of public-private interactions and policy communities in environmentalpolicy-making may draw broader lessons from our study. First, substantively, our findings suggestthat the strategic perspective of agricultural VSS organizations is still developmental focused, despiteVSS policymakers engaging with issues, such as climate change and water use. Second, analytically,our paper demonstrates that it may be useful to combine policy document analysis with geo-positioningand social network analysis when discussing the relevance of policy interactions. Arguably, theseapproaches reinforce each other, and enable us to pinpoint the relevance of actors and policies on arange of different dimensions.
Further research could investigate our observations in more detail. Our approach has limits interms of its ability to develop social network analysis only for indicators where data gathering canbe close to exhaustive. This means that avenues of exchange among biodiversity-relevant actorsthat are harder to describe completely and reliably (including informal meetings among policyactors, individual presence at conferences, and so on) are hard or impossible to analyze with ourmethods, and yet may be important for the exchange of ideas and points of view on biodiversityprotection. Moreover, the particulars of the combination of datasets forced us to exclude somestandards and organizations that are relevant to enrich our understanding of VSS organizations’potential in biodiversity policymaking. New studies may look at the characteristics of these. Next tothis, our research offers only a view from the “VSS organization cockpits” when it comes to relevantstrategic links to other organizations in the networks. Conversely, we are at present not able to seewhat links non-VSS organizations, such as the Convention on Biological Diversity (CBD) secretariat,develop by themselves, next to their affiliations to VSS. A further, very relevant avenue for research istherefore to create a more complete picture of the public and private policy network on biodiversity.Obviously, we also encourage much further research on how exchange, collaboration, and coordinationefforts at biodiversity protection may or may not have effects on the ground in farms, at plantations,and their environments. We are interested in studies that examine the degree to which interactionsamong biodiversity-relevant actors and VSS organizations may or may not have the expected positiveimpacts on biodiversity protection. While the present study cannot directly engage with this issue,it does provide empirical insights that describe the potential for such impacts in the near future.

Sustainability 2018, 10, 4379 18 of 20
Author Contributions: Conceptualization: M.K., L.F., J.S.; Data curation: M.J., J.S., L.F., V.V., J.P.; Formal analysis:J.S., M.J., V.V., J.P.; Funding acquisition: M.K., L.F., J.S.; Investigation: L.F., J.S., V.V., J.P., G.A.; Methodology: M.K.,J.S., L.F., V.V., J.P., G.A.; Project administration: L.F.; Resources: P.S., V.V., J.P.; Software: M.J., J.S.; Supervision:M.K., L.F.; Validation: P.S.; Visualization: M.J., J.S.; Writing—original draft: L.F., J.S., G.A.; Writing—Review &editing: L.F., J.S., V.V., P.S., M.K.
Funding: This research was funded by the Netherlands Environmental Assessment Agency (PBL).
Acknowledgments: Research for this paper was funded by the Netherlands Environmental Assessment Agency(PBL). We thank Mark van Oorschot, Philipp Pattberg, Oscar Widerberg, and Bas Arts for comments to an earlydraft of this paper.
Conflicts of Interest: The authors declare no conflicts of interest
References
1. Potts, J.; Voora, V.; Lynch, M.; Mammadova, A. Standards and Biodiversity. State of Sustainability Initiatives. 2017.Available online: https://www.iisd.org/ssi/standards-and-biodiversity/ (accessed on 16 December 2017).
2. Harrop, S. Biodiversity and conservation. In Handbook of Climate and Environmental; Falkner, R., Ed.; Wiley &Sons: London, UK, 2016; pp. 37–51.
3. Auld, G. Confronting Trade-Offs and Interactive Effects in the Choice of Policy Focus: Specialized VersusComprehensive Private Governance. Regul. Gov. 2014, 8, 126–148. [CrossRef]
4. Van Oorschot, M.; Kok, M.; Brons, J.; Van der Esch, S.; Janse, J.; Rood, T.; Vixseboxse, E.; Wilting, H.;Vermeulen, W.J.V. Sustainability of International Dutch Supply Chains: Progress, Effects and Perspectives; PBLPublication No. 1289; PBL Netherlands Environmental Assessment Agency: The Hague, The Netherlands,2014.
5. Fransen, L.; Schalk, J.; Auld, G. Community structure and the behavior of transnational sustainabilitygovernors: Toward a multi-relational approach. Regul. Gov. 2018. [CrossRef]
6. Green, J.F. Blurred Lines: Public-Private Interactions in Carbon Regulations. Inter. Interact. 2017, 2017 43,103–128. [CrossRef]
7. D’Hollander, D.; Marx, A. Strengthening private certification systems through public regulation: The case ofsustainable public procurement. Sustain. Account. Manag. Policy J. 2014, 5, 2–21. [CrossRef]
8. Renckens, S. The Basel Convention, US politics, and the emergence of non-state e-waste recycling certification.Int. Environ. Agreem. Polit. Law Econ. 2015, 15, 141–158. [CrossRef]
9. Henriksen, L.F.; Ponte, S. Public orchestration, social networks, and transnational environmental governance:Lessons from the aviation industry. Regul. Gov. 2018, 12, 23–45. [CrossRef]
10. Wasserman, S.; Faust, K. Social Network Analysis: Methods and Applications; Cambridge University Press:Cambridge, UK, 1994.
11. Tayleur, C.; Balmford, A.; Buchanan, G.M.; Butchart, S.H.; Walker, C.C.; Ducharme, H.; Tracewski, L. Whereare commodity crops certified, and what does it mean for conservation and poverty alleviation? Boil. Conserv.2018, 217, 36–46. [CrossRef]
12. Dankers, C.; Liu, P. Environmental and Social Standards, Certification and Labelling for Cash Crops; Food andAgriculture Organization of the United Nations: Rome, Italy, 2003.
13. Guthman, J. Agrarian Dreams: The Paradox of Organic Farming in California; University of California Press:Berkeley, CA, USA, 2004.
14. Haedicke, M.A. Organizing Organic: Conflict and Compromise in an Emerging Market; Stanford University Press:Stanford, CA, USA, 2016.
15. Langman, M. Memories and Notes on the Beginning and Early History of IFOAM. 1992. Available online:http://infohub.ifoam.org/sites/default/files/page/files/early_history_ifoam.pdf (accessed on 30 October 2005).
16. Bird, K.; Hughes, D.R. Ethical Consumerism: The Case of “Fairly Traded” Coffee. Bus. Ethics 1997, 6, 159–168.[CrossRef]
17. Raynolds, L.T. Re-Embedding Global Agriculture: The International Organic and Fair Trade Movements.Agric. Hum. Values 2000, 17, 297–309. [CrossRef]
18. Schouten, G.; Glasbergen, P. Creating Legitimacy in Global Private Governance: The Case of the Roundtableon Sustainable Palm Oil. Ecol. Econ. 2011, 70, 1891–1899. [CrossRef]
19. Elgert, L. Certified Discourse? The Politics of Developing Soy Certification Standards. Geoforum 2012, 43,295–304. [CrossRef]

Sustainability 2018, 10, 4379 19 of 20
20. Sneyd, A. When Governance Gets Going: Certifying ‘Better Cotton’ and ‘Better Sugarcane’. Dev. Chang.2014, 45, 231–256. [CrossRef]
21. Schleifer, P. Private regulation and global economic change: The drivers of sustainable agriculture in Brazil.Governance 2017, 30, 687–703. [CrossRef]
22. Ponte, S. ‘Roundtabling’sustainability: Lessons from the Biofuel Industry. Geoforum 2014, 54, 261–271.[CrossRef]
23. Eberlein, B.; Abbott, K.W.; Black, J.; Meidinger, E.; Wood, S. Transnational Business Governance Interactions:Conceptualization and Framework for Analysis. Regul. Gov. 2014, 8, 1–21. [CrossRef]
24. Overdevest, C. Comparing Forest Certification Schemes: The Case of Ratcheting Standards in the ForestSector. Socio-Econ. Rev. 2010, 8, 47–76. [CrossRef]
25. Marx, A.; Wouters, J. Competition and Cooperation in the Market of Voluntary Sustainability Standards.2014. Available online: https://papers.ssrn.com/sol3/papers.cfm?abstract_id=2431191 (accessed on19 November 2018).
26. Fransen, L. The Politics of Meta-Governance in Transnational Private Sustainability Governance. Policy Sci.2015, 48, 293–317. [CrossRef]
27. Bernstein, S.; Cashore, B. Can Non-State Global Governance Be Legitimate? An Analytical Framework.Regul. Gov. 2007, 1, 347–371. [CrossRef]
28. Bitzer, V.; Glasbergen, P.; Leroy, P. Partnerships of a feather flock together? An analysis of the emergence ofnetworks of partnerships in the global cocoa sector. Glob. Netw. 2012, 12, 355–374. [CrossRef]
29. Derkx, B.; Glasbergen, P. Elaborating global private meta-governance: An inventory in the realm of voluntarysustainability standards. Glob. Environ. Chang. 2014, 27, 41–50. [CrossRef]
30. Clapp, J.; Dauvergne, P. Paths to a Green World: The Political Economy of the Global Environment; MIT Press:Cambridge, MA, USA, 2005.
31. Blackman, A.; Naranjo, M.A. Does eco-certification have environmental benefits? Organic coffee in CostaRica. Ecol. Econ. 2012, 83, 58–66. [CrossRef]
32. Rueda, X.; Lambin, E.F. Responding to globalization: Impacts of certification on Colombian small-scalecoffee growers. Ecol. Soc. 2013, 18, 21. [CrossRef]
33. Tscharntke, T.; Milder, J.C.; Schroth, G.; Clough, Y.; DeClerck, F.; Waldron, A.; Ghazoul, J. Conservingbiodiversity through certification of tropical agroforestry crops at local and landscape scales. Conserv. Lett.2015, 8, 14–23. [CrossRef]
34. Milder, J.C.; Newsom, D.; Lambin, E.; Rueda, X. Measuring impacts of certification on biodiversity at multiplescales: Experience from the SAN/Rainforest Alliance system and priorities for the future. Policy Matters2016, 21, 14.
35. Hughell, D.; Newsom, D. Impacts of Rainforest Alliance Certification on Coffee Farms in Colombia; RainforestAlliance: New York, NY, USA, 2013.
36. Takahashi, R.; Todo, Y. The impact of a shade coffee certification program on forest conservation: A casestudy from a wild coffee forest in Ethiopia. J. Environ. Manag. 2013, 130, 48–54. [CrossRef] [PubMed]
37. Ruysschaert, D. The Impact of Global Palm Oil Certification on Transnational Governance, HumanLivelihoods, and Biodiversity Conservation. Policy Matters 2016, 21, 45–58.
38. MacDonald, K.I. The devil is in the (bio) diversity: Private sector “engagement” and the restructuring ofbiodiversity conservation. Antipode 2010, 42, 513–550. [CrossRef]
39. Visseren-Hamakers, I.J.; Arts, B.; Glasbergen, P. Partnership as Governance Mechanism in DevelopmentCooperation: Intersectoral North-South Partnerships for Marine Biodiversity; Edward Elgar: Northampton,MA, USA, 2007.
40. D’Hollander, D.; Tregurtha, N. Exploring the potential of government and voluntary standards collaborationsto scale up sustainable production and supply. Policy Matters 2016, 59, 60–72.
41. Fransen, L.; Schalk, J.; Auld, G. Work ties beget community? Assessing interactions among transnationalprivate governance organizations in sustainable agriculture. Glob. Netw. 2016, 16, 45–67. [CrossRef]
42. Dietz, T.; Auffenberg, J.; Chong, A.E.; Grabs, J.; Kilian, B. The Voluntary Coffee Standard Index (VOCSI).Developing a Composite Index to Assess and Compare the Strength of Mainstream Voluntary SustainabilityStandards in the Global Coffee Industry. Ecol. Econ. 2018, 150, 72–87. [CrossRef]
43. Fuchs, D. Business and governance. In Globalization; Schirm, S., Ed.; Taylor & Francis: London, UK, 2006.

Sustainability 2018, 10, 4379 20 of 20
44. McDermott, C.L.; Noah, E.; Cashore, B. Differences that ‘matter’? A framework for comparing environmentalcertification standards and government policies. J. Environ. Policy Plan. 2008, 10, 47–70.
45. Fransen, L. Corporate Social Responsibility and Global Labor Standards: Firms and Activists in the Making of PrivateRegulation; Routledge: New York, NY, USA, 2012.
46. Scott, J. Social Network Analysis, 4th ed.; Sage: London, UK, 2017.47. Cohen, P.J.; Evans, L.S.; Mills, M. Social networks supporting governance of coastal ecosystems in Solomon
Islands. Conserv. Lett. 2012, 5, 376–386. [CrossRef]48. Prell, C.; Hubacek, K.; Reed, M. Stakeholder Analysis and Social Network Analysis in Natural Resource
Management. Soc. Nat. Resour. 2009, 22, 501–518. [CrossRef]49. Mills, M.; Álvarez-Romero, J.G.; Vance-Borland, K.; Cohen, P.; Pressey, R.L.; Guerrero, A.M.; Ernstson, H.
Linking regional planning and local action: Towards using social network analysis in systematic conservationplanning. Biol. Conserv. 2014, 169, 6–13. [CrossRef]
50. Hoffmann, A.; Penner, J.; Vohland, K.; Cramer, W.; Doubleday, R.; Henle, K.; Penev, L. Improved accessto integrated biodiversity data for science, practice and policy—The European Biodiversity ObservationNetwork (EU BON). Nat. Conserv. 2016, 6, 49–65. [CrossRef]
© 2018 by the authors. Licensee MDPI, Basel, Switzerland. This article is an open accessarticle distributed under the terms and conditions of the Creative Commons Attribution(CC BY) license (http://creativecommons.org/licenses/by/4.0/).